Abstract
Background
CD300s are a group of proteins playing vital roles in immune responses. However, much is yet to be elucidated regarding the expression patterns and clinical significances of CD300s in cancers.
Methods
In this study, we comprehensively investigated CD300s in a pan‐cancer manner using multi‐omic data from The Cancer Genome Atlas. We also studied the relationship between CD300s and the immune landscape of AML.
Results
We found that CD300A‐CD300LF were generally overexpressed in tumors (especially AML), whereas CD300LG was more often downregulated. In AML, transactivation of CD300A was not mediated by genetic alterations but by histone modification. Survival analyses revealed that high CD300A‐CD300LF expression predicted poor outcome in AML patients; the prognostic value of CD300A was validated in seven independent datasets and a meta dataset including 1115 AML patients. Furthermore, we demonstrated that CD300A expression could add prognostic value in refining existing risk models in AML. Importantly, CD300A‐CD300LF expression was closely associated with T‐cell dysfunction score and could predict response to AML immunotherapy. Also, CD300A was found to be positively associated with HLA genes and critical immune checkpoints in AML, such as VISTA, CD86, CD200R1, Tim‐3, and the LILRB family genes.
Conclusions
Our study demonstrated CD300s as potential prognostic biomarker and an ideal immunotherapy target in AML, which warrants future functional and clinical studies.
Keywords: CD300s, immune evasion, leukemia, pan‐cancer, prognosis
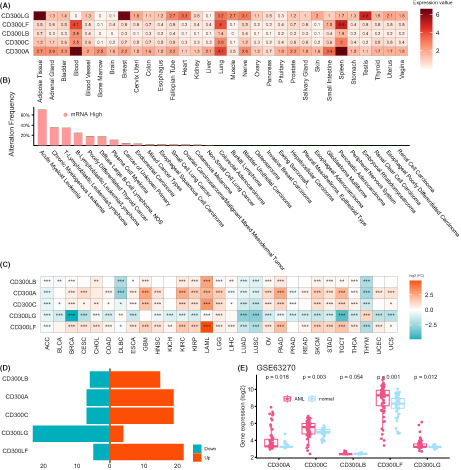
We found that CD300A‐CD300LF were significantly upregulated and high expression of these genes predict worse survival in AML. Specifically, CD300A may aid risk stratification in AML and its expression was likely to be regulated by H3K4me3 histone modification. Importantly, we demonstrated CD300A as an essential co‐inhibitory signal that might cause NK cell exhaustion and promotes immune escape of AML cells.
1. INTRODUCTION
Acute myeloid leukemia (AML) is a heterogeneous disease with underlying cytogenetic or molecular genetic aberrations. Despite progress in our understanding of the biology of this disease, chemotherapy remains as the main intervention and most patients will inevitably relapse and ultimately die. Therefore, there is an urgent need to uncover more effective therapeutic targets.
Targeting immune checkpoints has proved to be beneficial in treating various cancers and inhibitors blocking PD‐1/PD‐L1 have already been approved by FDA. 1 , 2 , 3 AML was by itself poorly immunogenic and extremely immune‐suppressive. 4 This could be caused by a number of tumor immune evasion mechanisms, including upregulation of co‐inhibitory ligands such as CTLA‐4, PD‐L1, PD‐1, Tim‐3 on AML cells, 5 reduced expression of neoantigens/MHC, 6 enrichment of immunosuppressive cell subsets such as regulatory T cells (Tregs), 7 myeloid‐derived suppressor cells (MDSCs) 8 , 9 , and tumor‐associated macrophages (TAMs), 10 , 11 and induction of T‐cell exhaustion. 5 , 12 Several clinical and preclinical studies have demonstrated the promise of blocking co‐inhibitory receptors in AML, yet the efficacy and response rate remain to be completely determined. 5 Indeed, these studies have paved the way for rigorous study of co‐inhibitory molecules in AML.
The human CD300 receptor family composed of seven members (CD300A, CD300LB, CD300C, CD300LD, CD300E, CD300LF, and CD300LG) located on chromosome 17. 13 , 14 Specifically, the cytoplasmic domains of two receptors, CD300A and CD300LF, contain the immunoreceptor tyrosine‐based inhibitory motifs (ITIMs), which endows them with inhibitory‐dominant potential in immune processes. 15 The CD300 molecules, especially CD300A and CD300LF, are mainly expressed on myeloid cells, such as monocytes, macrophages, and dendritic cells (DCs). 13 , 15 , 16 In particular, CD300A is also expressed on the tumor‐suppressive NK and CD8+ T cells, in which it mediates inhibitory signal and leads to an exhaustion status of these cell. 17 , 18 , 19 , 20
It has been reported that CD300 family members is involved in multiple autoimmune disorders, such as asthma, 21 colitis, 22 , 23 acute kidney injury, 24 and brain damage. 25 However, far too little attention has been paid to the relation between CD300s and cancers, which are also immune‐mediated or inflammatory diseases. There are only few evidences that CD300A was found to be significantly overexpressed in hematological malignancies, such as acute lymphoblastic leukemia (ALL), 26 , 27 AML, 28 and diffuse large B‐cell lymphoma (DLBCL). 29 Therefore, in this study, we performed a systematic analysis concerning the expression patterns, transcriptional regulations, clinical impacts, and roles in the tumor microenvironment (TME) of CD300 members in a broad spectrum of cancer types, focusing on its role in AML.
2. MATERIALS AND METHODS
2.1. Analysis of gene expression data
The transcript levels of CD300 family in normal tissues were determined by using the Genotype‐Tissue Expression (GTEx) dataset. Averaged expression data of CD300s for over 1000 cancer cell lines from various organ sites were analyzed through cBioPortal (https://www.cbioportal.org/).We then systematically analyzed the expression patterns of CD300s between 9197 tumor and 8290 normal samples by combining RNA sequencing data from the TCGA and the GTEx projects. The two datasets were downloaded from the UCSC Xena project and were normalized between arrays using the limma package. 30 The UALCAN (http://UALCAN.path.uab.edu/) web tool was used to evaluate protein expressions of CD300s in certain cancers and adjacent normal tissues. Further, we retrieved a dataset containing both healthy and AML samples from Gene Expression Omnibus (GEO) (https://www.ncbi.nlm.nih.gov/geo/) (accession number GSE63270) to validate the differential expression of CD300s between AML and normal controls. We also used the Hemap AML dataset to analyze whether CD300s expressions were associated with certain molecular subtypes. 31 The Human Proteome Map (https://www.humanproteomemap.org/) database was used to assess protein expression levels of CD300s in normal tissues and cell types, including 17 adult tissues, six primary hematopoietic cells, and seven fetal tissues.
2.2. Analysis of AML single‐cell RNA‐sequencing (scRNA‐seq) data
To quantify the expression of CD300s across immune cells at the single‐cell level, we utilized two published scRNA‐seq data: one consists of 30,712 bone marrow (BM) cells from 16 AML samples at diagnosis (Van Galen AML scRNA, GSE116256), 32 and the other consists of 30,579 AML BM cells for eight patients (FIMM AML scRNA). Both datasets were obtained through the Synapse Web Portal (https://www.synapse.org and doi: 10.7303/syn21991014), and were processed and visualized using custom scripts provided by Dufva et al. 31
2.3. Analysis of genetic and epigenetic alteration data
Genetic alteration (including somatic mutations, amplification, and deep deletion) frequencies of CD300s across TCGA pan‐cancers (including 10,967 patients) were analyzed and visualized through the cbioportal genomic database (http://www.cbioportal.org). Mutation data of 24 most frequently mutated genes identified in the TCGA AML project were used to determine the association between CD300s expression and common gene mutations. The relationships between mutation status and the dichotomized expression of CD300s were analyzed by two‐sided Fisher exact tests.
CD300s promoter methylation data in various tumor and normal samples were analyzed through DiseaseMeth database (http://bio‐bigdata.hrbmu.edu.cn/diseasemeth/analyze.html). Correlation between CD300s expression and methylation across pan‐cancers were assessed through the GSCALite platform (http://bioinfo.life.hust.edu.cn/web/GSCALite/). 33
Previously published H3K4me3 ChIP‐seq data of three leukemia cells were downloaded from GEO (K562 cells from GSE74359; MLL‐AF9 blast cells from GSE89336; and KG‐1 cells from GSE109619) and visualized via UCSC genome browser.
2.4. Survival analysis
Univariate Cox regression was performed to examine influence of CD300s expression on overall survival (OS) across 33 cancers. We then used the Kaplan–Meier method to estimate survival in AML patients with high and low CD300s levels. The optimal cut point of CD300s expression was determined by the X‐tile method. 34 The prognostic value of CD300A in AML was further validated in seven independent cohorts of AML patients (GSE6891, n = 293; GSE10358, n = 304; GSE37642 [U133A], n = 422; GSE37642 [U133plus2], n = 140; GSE12417 [U133A], n = 163; GSE12417 [U133plus2], n = 79; GSE71014, n = 104). We also combined these microarray datasets using the combat function from the sva R package to create a dataset with maximum number of samples. To examine the predictive power of CD300A expression in the context of existing models, we recalculated two gene expression‐based prognostic models (LSC17 and LI24) as previously described. 11 The survivalROC R package was used to estimate the time‐dependent receiver operating characteristic (ROC) curve from survival data and compute the value of the area under the curve (AUC). A multivariable model was used to develop a nomogram in the TCGA cohort, and the scores of each variable were calculated and visualized using the nomogramEx R package.
2.5. Immune response analysis
Immune cell type abundances were estimated with CIBERSORT as described earlier. 11 We also used other algorithms 35 available from TIMER 2.0 web portal (http://timer.comp‐genomics.org/) to quantify the proportions of monocytes, macrophages, and CD8 T cells. Finally, the TIDE (Tumor Immune Dysfunction and Exclusion) database (http://tide.dfci.harvard.edu) was used to calculate T‐cell dysfunction, T‐cell exclusion, and specific immune signature scores, and to predict the potential response to immunotherapy in AML.
2.6. Differential gene expression analysis and functional enrichment analysis
Briefly, differentially expressed genes between high and low CD300A expressers were defined using DESeq2 R package at false discovery rate (FDR) <0.05. Gene Ontology (GO) analysis, Kyoto Encyclopedia of Genes and Genomes (KEGG), and Reactome pathway analysis of the differentially expressed genes (DEGs) were performed using the STRING database (http://www.string‐db.org/). GO, KEGG, and Reactome terms with false discovery rate (FDR)‐corrected p‐values less than 0.05 were considered as significantly enriched. The web‐tool STRING (http://string.embl.de/) was used to construct a protein–protein interaction (PPI) network of the DEGs. A confidence score >0.9 was used as the judgment criterion. Results were displayed with Cytoscape v3.8.2. We also used GeneMANIA (http://genemania.org/) to search for gene interactions between CD300 members and co‐expressed genes. Gene set enrichment analysis (GSEA) was performed via GSEA v4.1.0 software (http://www.broad.mit.edu/gsea) using the Hallmark gene sets within the Molecular Signatures Database (MSigDB).
2.7. Statistical analysis and visualization
Wilcoxon rank sum tests were used to compare differences between two groups. Specifically, differential expression of CD300s between each molecular subtype and the remaining samples in the Hemap dataset were analyzed as previously described. 31 Spearman correlation analysis was used to test the association of CD300s with HLA genes 36 and immune checkpoints 37 in AML. All statistical analyses and visualizations were performed using R statistical software, version 4.1.1. The box, violin, bar, and bubble plots were generated with the R package “ggplot2”, “ggpubr”, and “ggsci”, the volcano plot was created using the “EnhancedVolcano” package, and survival curves were plotted using the “survival” package. All statistical tests were two‐sided with p‐values less than 0.05 considered significant.
3. RESULTS
3.1. Expression patterns of CD300s in normal tissues and cancer cell lines
Among seven CD300 molecules (CD300A, CD300LB, CD300C, CD300LD, and CD300E, CD300LF, and CD300LG). We selected only five members (CD300A, CD300LB, CD300C, CD300LF, and CD300LG) for our analyses. Since the probes of CD300LD and CD300E were not found in the GEO microarray data sets. First, we explored the expression patterns of CD300s in different human tissues based on RPKM values using GTEx (http://www.GTExportal.org/home/). We observed that CD300A‐CD300LF were highly expressed in blood, lung, and spleen; while CD300A was expressed broadly on most tissues, CD300B, CD300C, and CD300LF were only weakly expressed in other tissues (Figure 1A). Interestingly, CD300LG showed a unique expression pattern: it was expressed at high levels in the adipose tissue, breast, heart, and testis, but it was not expressed by blood. Next, we analyzed the expression profiles of CD300s in cancer cell lines from Cancer Cell Line Encyclopedia (CCLE). As shown in Figure 1B, CD300s showed relatively high expression in cell lines of malignant hematological cell lines (AML, chronic myelogenous leukemia, T‐lymphoblastic leukemia/lymphoma, and B‐lymphoblastic leukemia/lymphoma), and the highest expression was seen in AML.
FIGURE 1.
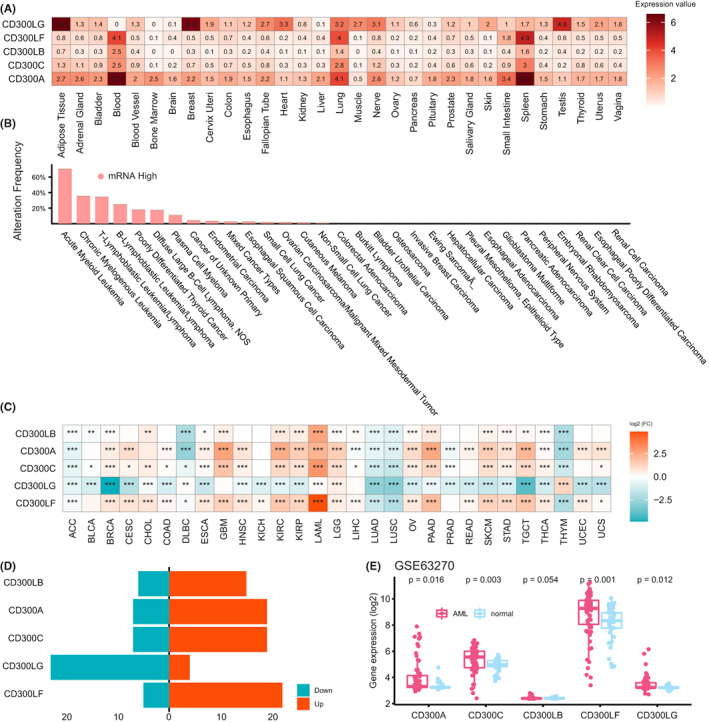
Expression patterns of CD300s in normal tissues, cancer cell lines, and primary tumor samples. (A) Heatmap showing mRNA expression levels of CD300s in normal tissues from the Genotype‐Tissue Expression (GTEx) database. (B) Bar plot showing transcriptional alteration frequencies of CD300s in various tumor cell lines from the Cancer Cell Line Encyclopedia (CCLE) database. (C) Heatmap of differential expression profiles of CD300s between tumor and normal samples, combining data from TCGA and GTEx databases. The color depicts the log2‐transformed fold change (Log2FC) between tumor and normal tissues. *p < 0.05; **p < 0.01; ***p < 0.001. (D) Bar plot showing genes significantly upregulated and downregulated (P < 0.05) across different cancer types. Red, upregulated expression; blue, downregulated expression. (E) Box plots showing expression levels of CD300s in normal controls and AML in the GSE63270 dataset
3.2. Analysis of CD300 family gene expression levels in tumor and non‐tumor tissues
To date, a comprehensive pan‐cancer analyses determining the dysregulations of CD300s between tumor and normal tissues is still lacking. Here, we combined data from TCGA and GTEx to systematically compare CD300s expression between tumor and adjacent normal tissue across 29 cancer types (9197 tumor and 8290 normal samples). Surprisingly, we identified significant differential expression of CD300s in almost all cancer types tested (Figure 1C). Overall, CD300A‐CD300LF were more often upregulated in cancers; whereas downregulation of CD300LG in tumors was more commonly seen (Figure 1D). For CD300A‐CD300LF, the most remarkable difference was observed between AML and normal its normal counterparts (Figure 1C). This difference was also validated in an independent microarray dataset (GSE63270; AML, n = 62, Normal, n = 42) (Figure 1E).
In addition, we found that CD300A‐CD300LF were highly expressed in glioblastoma multiforme (GBM), brain lower grade glioma (LGG), kidney renal clear cell carcinoma (KIRC), kidney renal papillary cell carcinoma (KIRP), ovarian cancer (OV), pancreatic adenocarcinoma (PAAD), skin cutaneous melanoma (SKCM), stomach adenocarcinoma (STAD), and testicular germ cell tumor (TGCT), whereas they were markedly decreased in lung adenocarcinoma (LUAD), lung squamous cell carcinoma (LUSC), and thymoma (THYM), as compared with normal controls (Figure 1C). Further, we used the UALCAN (http://UALCAN.path.uab.edu/) database to assess the protein expression of CD300A in a number of solid cancers, such as breast cancer (BRCA), GBM, LUAD, KIRC, and ovarian cancer (OV) (except for CD300LF in GBM, other CD300 members were not identified in these proteomic datasets). Importantly, we were able to confirm the upregulation of CD300A in BRCA, GBM, head and neck squamous cell carcinoma (HNSC), KIRC, PAAD, uterine corpus endometrial carcinoma (UCEC), and the downregulation of CD300A in liver hepatocellular carcinoma (LIHC) (except for LUAD and OV, which showed an opposite pattern of protein expression) (Figure 1C and Figure S1). Moreover, CD300LF showed increased expression pattern in the proteomic dataset of GBM similar to what has been observed in the RNA‐seq dataset (Figure S1). Overall, these results demonstrated that the protein expression patterns of CD300A in most cancers agreed very well with the observed levels of mRNA.
3.3. The genetic and epigenetic features of CD300s in pan‐cancers
We then explored genetic alterations (including mutations, amplifications, and deletions) frequencies of CD300s in TCGA pan‐cancer datasets. The average alteration frequencies of five genes are summarized in Figure 2A. Mutations of CD300s were mainly distributed in SKCM, UCEC, and LUAD (Figure 2A). For copy number alterations (CNAs), CD300s were much more frequently amplificated than deleted. In mesothelioma (MESO) and THYM, amplifications were the only genetic events, while in uveal melanoma (UVM), CD300s were often deleted (Figure 2A). It is worth noting that in AML, where CD300s were transcriptionally active, no genetic alterations were observed, suggesting other mechanisms might contribute to the abnormal CD300s expression in AML.
FIGURE 2.
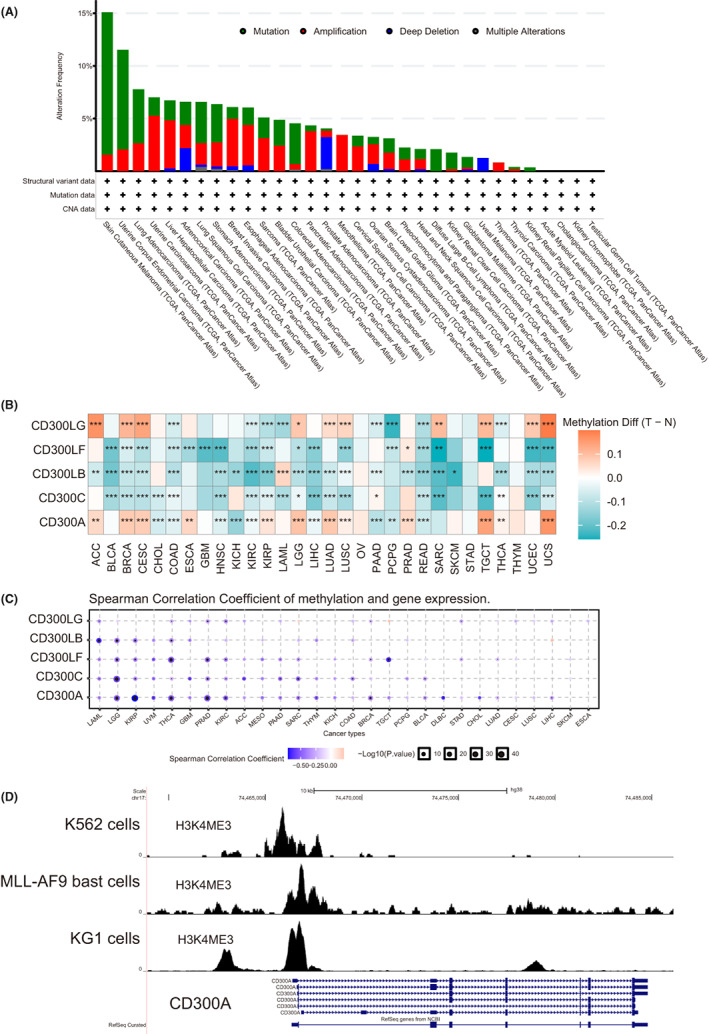
The genetic and epigenetic features of CD300s in pan‐cancers. (A) Genetic alteration ((including mutations, amplifications, and deletions) frequencies of CD300s across different tumors from TCGA. (B) Heatmap of differential methylation profiles of CD300s between tumor and normal samples, using data from the Diseasemeth database. The color depicts methylation differences between tumor (T) and normal (N) tissues. *p < 0.05; **p < 0.01; ***p < 0.001. (C) Correlation between methylation and mRNA expression of CD300s analyzed via the GSCALite platform (http://bioinfo.life.hust.edu.cn/web/GSCALite/). Blue dots indicate negative correlation and red indicate positive correlation. The size of the point represents the statistical significance. (D) ChIP‐seq tracks for H3K4me3 at CD300A gene loci in K562 cells, MLL‐AF9 blast cells, and KG‐1 cells. ChIP‐seq data were obtained from GSE74359, GSE89336, and GSE109619
We next asked whether DNA methylation regulates the expression of CD300s in cancers. To this end, we obtained curated DNA methylation microarray data of CD300s across 30 cancer types with matched controls through the human disease methylation database Diseasemeth version 2.0 (http://bio‐bigdata.hrbmu.edu.cn/diseasemeth/). We found that CD300LB, CD300C, and CD300LF were significantly hypomethylated in almost all cancer types as compared to normal samples (Figure 2B). Interestingly, CD300A, which is upregulated in most cancers, demonstrated an overall hypermethylation pattern.
Further analysis using the GSCA database revealed weak negative correlation between methylation and expression levels of CD300s in a number of cancer types (Figure 2C). In AML, however, no methylation differences were observed for two most well‐characterized CD300 members‐CD300A and CD300LF (Figure 2B).
It has been reported that CD300A could be regulated by transcription activation‐associated histone marks, such as histone H3 lysine 4 mono‐ and tri‐methylation (H3K4me1 and me3, respectively). 38 Consistently, we found a significant enrichment of H3K4me3 marks in the promoter regions of CD300A gene in three types of leukemia cells from published ChIP‐seq datasets (K562 cells from GSE74359; MLL‐AF9 blast cells from GSE89336; KG‐1 cells from GSE109619) (Figure 2D). Overall, these results suggest that, at least in leukemia cells, CD300A expression might be regulated by histone modification.
3.4. Prognostic significances of CD300s in different cancers
Given that the expression of CD300s was significantly dysregulated in cancers, we asked whether these genes have prognostic relevance in TCGA pan‐cancer datasets. Cox regression analyses revealed that in most cancers, high expressions of CD300A‐CD300LF were related to poor overall survival (OS), such as in LAML, LGG, and UVM (Figure 3A). While in SKCM, a significant beneficial effect on OS was observed for CD300A, CD300C, and CD300LF (Figure 3A). However, CD300LG was only prognostically relevant in a few cancers (Figure 3A). Considering that CD300A‐CD300LF were specifically and highly expressed in AML, we decided to focus our survival analysis on these genes in AML. To this end, we collected seven independent AML datasets from GEO; X‐tile was then performed to determine the optimal thresholds in TCGA and GEO datasets. First, we were able to validate the prognostic value of CD300A‐CD300LF expression within the TCGA cohorts (Figure 3B) and cytogenetically normal (CN) subsets of AML (Figure 3C). Importantly, the adverse prognostic impact of CD300A was validated in seven independent cohorts of AML patients (GSE6891, n = 293; GSE10358, n = 304; GSE37642 [U133A], n = 422; GSE37642 [U133plus2], n = 140; GSE12417 [U133A], n = 163; GSE12417 [U133plus2], n = 79; GSE71014, n = 104) (Figure 4A,C,E‐I) and CN‐AML patients from GSE6891 and GSE10358 cohorts (Figure 4B,D). In order to incorporate the maximum number of samples, we combined these datasets from GEO yielding a meta dataset of 1115 AML patients (including 242 CN‐AML patients). In the meta dataset, CD300A status remained excellent predictive power for OS (whole cohort, p = 5.8*e−9; CN‐AML, p = 5.7*e−5) (Figure 4J,K).
FIGURE 3.
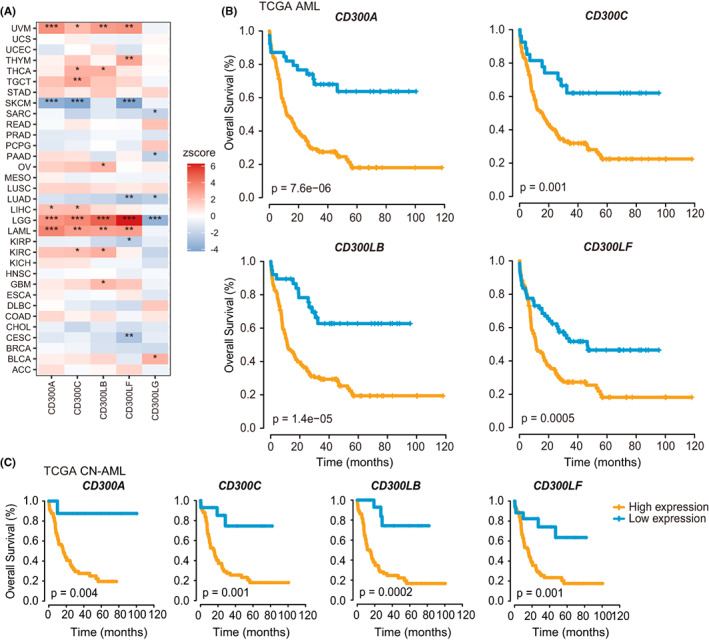
The prognostic significances of CD300s in cancers. (A) Association between CD300s expression and patient prognosis across 33 cancer types as determined by the Cox regression model. (B and C) Kaplan–Meier curves representing OS of AML patients from the whole TCGA cohort (B) and the CN‐AML subsets (C) based on the expression of indicated CD300 members (CD300A‐CD300LF)
FIGURE 4.
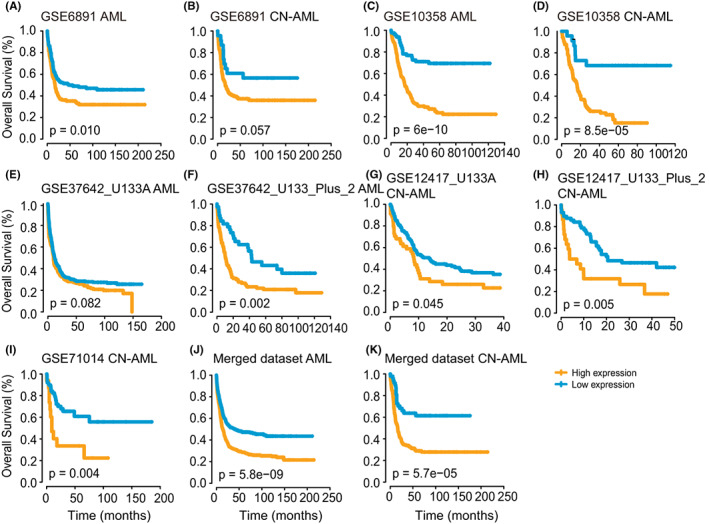
Independent validation of the prognostic value of CD300A. (A‐K) Kaplan–Meier curves representing OS of seven AML cohorts from GEO (GSE6891, n = 293; GSE10358, n = 304; GSE37642 [U133A], n = 422; GSE37642 [U133plus2], n = 140; GSE12417 [U133A], n = 163; GSE12417 [U133plus2], n = 79; GSE71014, n = 104) (A, C, and E‐I), CN‐AML patients from GSE6891 and GSE10358 cohorts (B and D), a merged dataset of 1115 AML patients (J), and 242 CN‐AML patients (K) according to CD300A expression status
3.5. Additional value of CD300A expression in refining risk stratification in AML
The strong prognostic significance of CD300A status led us to hypothesize that it may add prognostic value to established risk models. Two gene expression‐based prognostic models‐LSC17 and LI24‐have shown their superior prognostic performance in risk stratification for AML patients. 39 , 40 We therefore test the predictive power of CD300A expression in the context of these two models. We established both models in the TCGA and GSE10358 cohorts and patients were stratified into high‐ and low‐risk groups, respectively (dichotomized according to the median score value). When applied to each risk group stratified by LSC17 and LI24 in the TCGA cohort, CD300A status was still able to discriminate between shorter and longer OS both within the high‐ and low‐risk groups (Figure 5A,B). This was also true for both models in the GSE10358 cohort (Figure S2A and B). We then compared the prediction performance of CD300A expression with that of LSC17 and LI24 using by calculating the AUC. The AUC of CD300A was 0.567, 0.640, and 0.710 in the TCGA cohort at 1, 3, and 5 years; CD300A yielded the highest AUC in predicting the 5‐year survival rate, even surpassing LSC17 and LI24 (Figure 5C). In the GSE10358 cohort, CD300A expression also had a good performance in predictive accuracy (AUC: 0.623, 0.681, and 0.696 at 1, 3, and 5 years, Figure S2C), comparable to that of LSC17 but lower than LI24. In summary, these results suggest CD300A as a good candidate for refining existing classification schemes.
FIGURE 5.
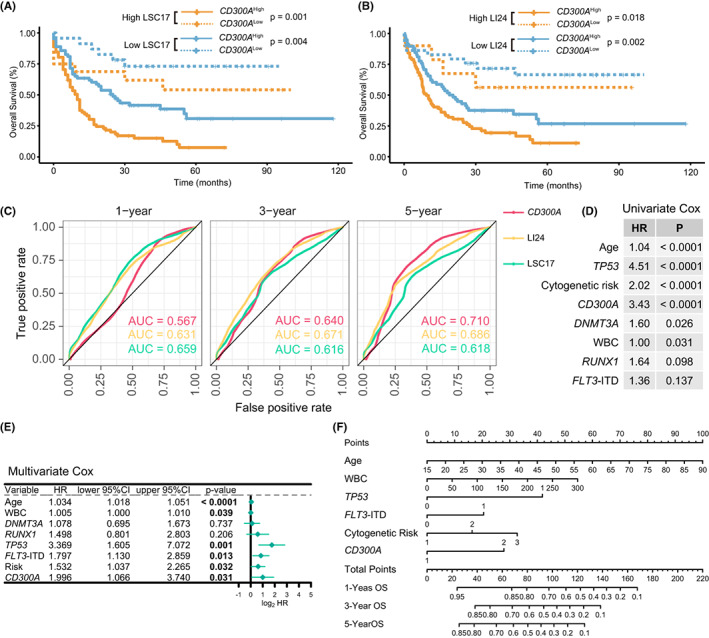
Additional value of CD300A expression in refining risk stratification in AML. (A and B) OS of patients from TCGA as stratified by the LSC17 (A) and the LI24 (B) signature. Patients with a low‐ and high‐risk score were further dichotomized according to CD300A expression status. (C) Time dependent ROC curves of CD300A expression, LSC17, and LI24 in the TCGA cohort at 1, 3, and 5 years. (D and E) Univariate (D) and multivariate (E) analysis of CD300A expression for OS in the TCGA cohort. For univariate analysis, only variables with p ≤ 0.20 are shown. Please see Supplementary Tables S1 for the full list of variables. (F) Nomogram for predicting 1‐, 3‐, and 5‐year OS for AML patients in TCGA cohort
3.6. Prognostic model of CD300A in AML
To assess whether CD300A expression impacted OS independent of known prognostic factors for AML, we performed multivariate analysis in the TCGA cohort. In multivariate models, including all parameters with p‐value less than 0.2 under univariate analysis (Figure 5D and Table S1), high expression of CD300A remained an independent prognosticator for OS (p = 0.031) together with age (p < 0.0001), white blood count (WBC count, p = 0.039), TP53 mutation status (p = 0.001), FLT3‐ITD mutation status (p = 0.013), and cytogenetic risk group (p = 0.032) (Figure 5E).
To better predict AML patients' prognosis, we constructed a nomogram based on multivariable Cox proportional hazards model in the TCGA cohort (Figure 5F). Six independent prognostic factors, age, WBC, mutations of TP53 and FLT3‐ITD, cytogenetic risk, and CD300A expression, were included in the model. In the nomogram, each variable is assigned a separate score, and the sum of these scores was rescaled to a range of 0–100 to estimate the probability of an event. The probability of AML patient survival at 1‐, 3‐, and 5‐year could be determined by drawing a line from the total point axis straight down to the outcome axis. As can be seen in the figure, the nomogram quantitatively predicted the probability of 1‐year, 2‐year, and 3‐year OS (Figures 5F).
3.7. Molecular subtypes and clinical characteristics associated with CD300s expression
We then examined the associations of CD300s expression with the clinical and genetic characteristics in the TCGA AML cohort. Significant differences were found between FAB subtypes and CD300A‐CD300LF expression status: high expression of CD300A‐CD300LF were significantly more frequent in AML with myelomonocytic (M4) and monocytic (M5) morphology, whereas the M3 subtype was exclusively observed in patients with low CD300A‐CD300LF expression (Figure 6A). Consistently, when examining the expression differences of CD300s across published molecular subtypes in the Hemap AML dataset, we found that CD300A‐CD300LF were more highly expressed in monocyte‐like AML, with low‐expressions levels in the PML‐RARA subtype (Figure 6B). Moreover, patients with high CD300A‐CD300LF expression were more likely to be >60‐year‐old and less likely to present with favorable cytogenetics (Figure 6A).
FIGURE 6.
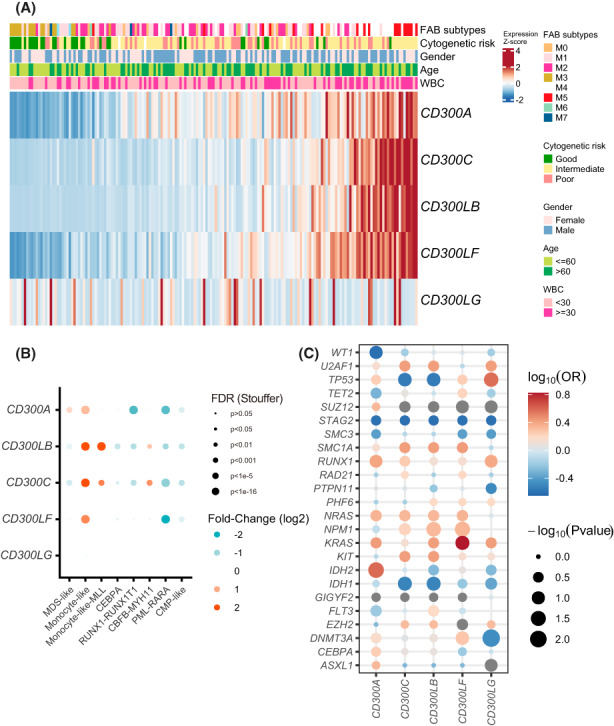
Molecular subtypes and clinical characteristics associated with CD300s expression. (A) Heatmap showing association between CD300s expression and clinical characteristics in the TCGA AML cohort. (B) Expression differences of CD300s among molecular subtypes in the Hemap AML dataset. The expression fold change between each subtype and the remaining samples were compared using the Wilcoxon rank sum test. The color of the dots indicates fold changes (log2) and size indicates the FDR values. The FDR values were categorized into six groups based on significance cutoffs for visualization (0.05, 0.01, 0.001, 1e‐5, 1e‐16). (C) Bubble plot showing associations between the expression of CD300s and common mutational events in the TCGA dataset. Bubble size indicates −log10 (Fisher test p‐value). Color signifies log10 (odds ratio [OR]), positive association is indicated with red circles, negative with blue circles, and non‐association with gray circles
To determine whether CD300s correlated with mutational status of AML‐associated genes, we examined significantly mutated genes occurred in patients with high and low CD300s expression (dichotomized at the median expression value of each gene), using mutational data adopted from TCGA. As shown in Figure 6C, patients with high CD300A expression had higher frequency of mutations in IDH2, while IDH1 was more frequently mutated in those with low CD300LB and CD300C expression. Patients with NPM1 mutations had a significantly higher expression of CD300LB and CD300LF than those with NPM1‐wild type. Moreover, high CD300LG expression was positively correlated with TP53 mutations and negatively correlated with DNMT3A mutations.
3.8. Association between CD300s expression and immune responses in cancer
The CD300 molecules are known to play important roles in the fine tuning of immune responses, we thus further explored the relationship between CD300s and tumor immune infiltrates. First, analysis of normal cell populations from the Hemap dataset revealed that CD300s were generally expressed at higher levels in myeloid lineage immune cells (monocytes, macrophages, neutrophils, and myeloid progenitors), with relatively low expression in lymphoid lineages (lymph node, T/NK cells, CD4+ T cells, plasma cell, B cell, and germinal center cell) (Figure 7A). Interestingly, the opposite trend was observed for CD300LG. This myeloid preference was also confirmed in two recently published scRNA‐seq datasets of AML (Van Galen AML scRNA and FIMM AML scRNA, Figures S3A and B). Moreover, we have observed a strong protein expression of CD300A and CD300LF in monocytes using Human Proteome Map (https://www.humanproteomemap.org/), a database for mass‐spectrometry proteomic analysis (Figure S4). It is noteworthy that CD300A showed a strong signal on NK cells in both the scRNA‐seq and mass‐spectrometry datasets (Figure S3 and S4), consistent with previous findings that CD300A is expressed on the surface of all human NK cells. 17 , 18
FIGURE 7.
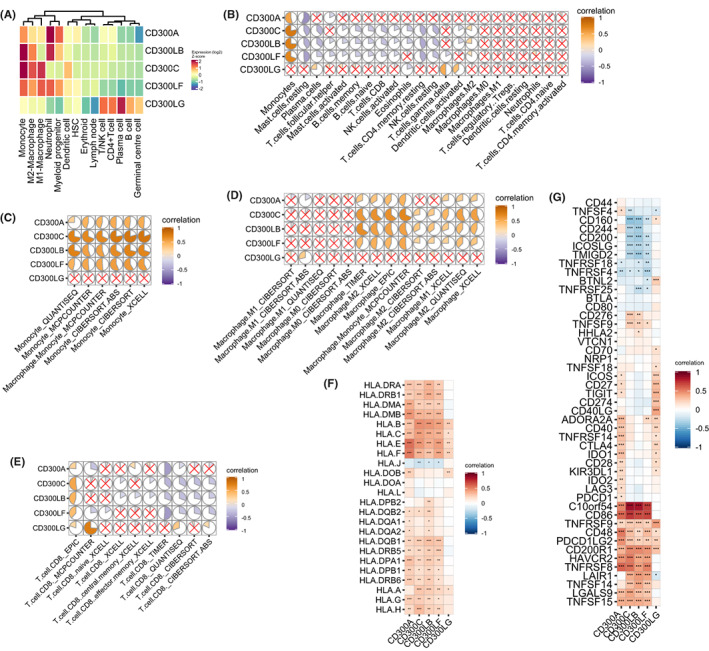
The relation between CD300s expression with immune cell infiltration, HLA genes, and immune checkpoints. (A) Heatmap showing CD300s expression in normal cell populations from the Hemap dataset. (B) Correlation matrix plot showing correlations between CD300s and tumor immune infiltrating cells in AML. The overall immune cell compositions were estimated by CIBERSORT in the TCGA dataset. (C‐E) Correlation matrix plots showing correlations between CD300s with monocytes (C), macrophages (D), and CD8 T cells (E). The overall immune cell compositions were estimated by indicated methods in the TCGA dataset. (F and G) Heatmap showing correlation between the expression of CD300s with HLA genes (F) and immune checkpoint genes (G) in the TCGA dataset
We then assessed the correlation of CD300s expression with infiltrations of 22 immune cell types inferred by the CIBERSORT algorithm. We found that CD300A‐CD300LF expression was positively associated with monocyte infiltrations but negatively associated with infiltrations of resting mast cells. CD300LB, CD300C, and CD300LF expression also showed significantly negative associations with infiltration of T/NK cells (CD8 T cells, resting T cells CD4 memory cell, activated, and resting NK cells) and B cells (plasma cells, memory B cells, and naïve B cells), while these three genes showed a significantly positive association with the immunosuppressive M2 macrophages (Figure 7B). By contrast, no correlation was found of CD300A and CD300LG expression with the majority of cell types (Figure 7B). Similar results were found by analyzing the CIBERSORT estimates in the GSE10358 and GSE6891 dataset (Figure S5A and B). Importantly, when other methods were used for calculating the relative fractions of immune cells, positive associations between CD300A‐CD300LF and monocytes were consistently seen, while M2 macrophages were positively correlated and CD8 T cells negatively correlated with CD300A‐CD300LF for most‐if not all‐instances in all three datasets (Figure 7C‐E and Figure S6A‐F). Collectively, these findings indicate immunosuppressive roles of CD300s in the TME.
3.9. Correlation of CD300s with HLA genes and immune checkpoints in AML
Given that human leukocyte antigen (HLA) and immune checkpoints plays important roles in the TME, it is therefore of great interest to evaluate the relationship between CD300s and these immune signatures. We found that CD300A‐CD300LF positively correlated with most of the HLA genes (Figure 7F). Since cancers with higher HLA gene expression were often more immunologically active, showing significantly higher immune cell infiltration, 41 it is reasonably to speculate that high CD300s expressers might share the same trait. In addition, we observed strong positive correlations between CD300A‐CD300LF expression and immune checkpoint molecules such as: C10orf54, CD86, CD200R1, HAVCR2, TNFRSF8, and TNFRSF9; whereas CD300C, CD300LB, and CD300LF expression were negatively correlated with CD160, CD200, ICOSLG, and TMIGD2 (Figure 7G). Distinct correlation patterns were observed between CD300LG and these signatures, a trend consistent with the previous results (Figure 7F,G).
3.10. CD300s expression predicted response to immunotherapies
Recently, a gene expression‐based score called tumor immune dysfunction and exclusion (TIDE) were showed to have excellent performance in predicting immunotherapy clinical response. 42 We therefore checked the relationship of CD300s with the expression signatures of T‐cell dysfunction and T‐cell exclusion. Surprisingly, we found a negative correlation of CD300A‐CD330LF with T cell exclusion signatures, including myeloid‐derived suppressor cells (MDSCs), M2 subtype of tumor‐associated macrophages (TAMs), exclusion and TIDE score but a positive correlation with the T‐cell dysfunction score, IFNG, and merck18 signatures (Figure 8A). This indicates that CD300 molecules might contribute to immune evasion through the induction of T‐cell dysfunction. Based on these results, we asked whether CD300 molecules would have a guiding value in predicting immunotherapy in AML. In the TCGA AML cohort, we found that the predicted responders showed significantly higher expression levels of CD300A‐CD300LF but lower levels of CD300LG than non‐responders (Figure 8B), suggesting CD300 expression could be a good predictor for immunotherapy in AML.
FIGURE 8.
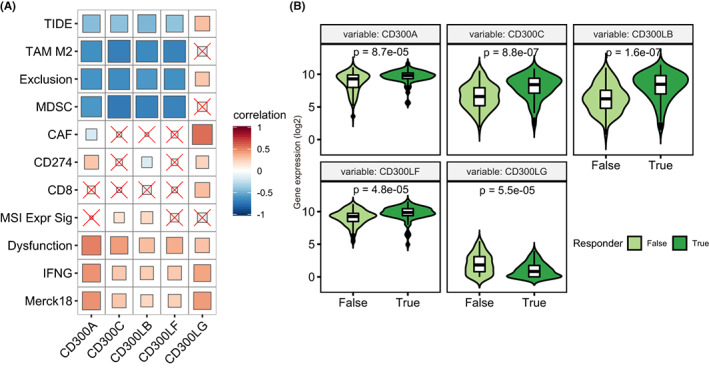
CD300s expression predicted response to immunotherapies. (A) Correlation matrix showing the association between CD300s expression with T‐cell dysfunction and T‐cell exclusion signatures in TCGA AML cohort, as determined using the tumor immune dysfunction and evasion (TIDE) method. (B) Violin plots comparing the expression of CD300s between patients who benefitted or did not benefit from immunotherapy in AML, as predicted by the TIDE algorithm. Significances were calculated by Wilcoxon rank sum tests
3.11. The biological significance of CD300s expression in AML
Next, we investigated the potential biological features associated with CD300s in AML. We choose CD300A to represent this family, since the expression of five CD300 members (except for CD300LG) were highly correlated in AML (Figure S7). A comparison of gene expression profiles of patients with high and low CD300A expression (based on the median expression value) was then performed. Overall, 442 genes (147 up‐ and 295 downregulated; adjusted p < 0.05; |log2FC| > 1.5) were differentially expressed in CD300A high versus CD300A low patients (Figure 9A and Data S1). Among the genes positively correlated with CD300A were monocytes marker gene CD14, further supporting the monocytic prevalence of CD300s. Also highly correlated were well‐characterized immune checkpoint genes in AML, such as IDO1, LILRB1, LILRB2, and LILRB3 (Figure 9A). Using the STRING tool, we constructed a protein–protein interaction (PPI) network of the differentially expressed genes (DEGs), with a confidence score >0.90. Genes interacted with CD300A and their sub‐networks were shown through Cytoscape software (Figure 9B). We observed that 13 genes were directly interacting with CD300A: LILRB1, LILRB2, LILRB3, LILRA1, LILRA4, CLEC4A, CCR5, SIGLEC7, CX3CR1, CD1C, CST7, CD300E, and FGR. The majority of these genes were involved in immune responses. Among them were immune‐inhibitory leukocyte immunoglobulin‐like receptors: LILRB1, LILRB2, LILRB3, LILRA1, LILRA4; 43 CX3CR1, and CD1C, commonly expressed in myeloid dendritic cells (mDCs), which modulate T‐cell functions with either stimulatory or suppressive effects; 44 , 45 SIGLEC7, an inhibitory receptor expressed on NK cells that could indicate NK cell dysfunction in AML. 46 , 47 Genes involved in the pathogenesis of AML such as CCR5, 48 CST7, 49 and FGR 50 were also detected. Collectively, these gene–gene interactions might contribute to the immunomodulatory effects of CD300A in AML.
FIGURE 9.
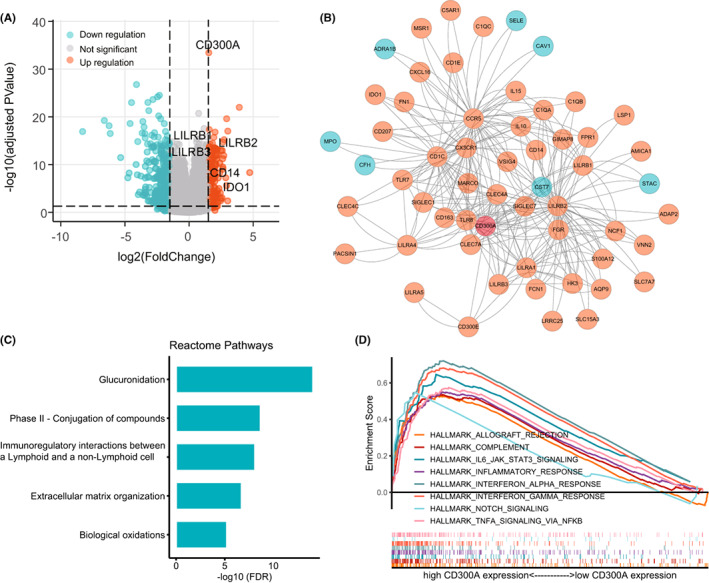
The biological significance of CD300A expression in AML. (A) Volcano plot showing differentially expressed genes (DEGs) between high and low CD300A expressers. (B) Cytoscape analysis of CD300A‐related network using PPI information obtained from STRING database (http://stringdb.org/). Red nodes represent upregulated genes and blue represent downregulated genes. (C) Reactome Pathway analysis of DEGs. (D) Gene set enrichment analysis (GSEA) of patients with high and low CD300A expression, using Hallmark gene sets obtained from the Molecular Signatures Database (MSigDB)
GeneMANIA analysis confirmed that LILRB3 was closely connected with CD300 molecules, and that the co‐expressed genes were mainly involved in negative regulation of a series of cellular processes such as: mononuclear cell proliferation, leukocyte proliferation, leukocyte activation, cell activation, immune system process, and lymphocyte activation, highlighting the immunosuppressive functions of CD300 members (Figure S8A).
To further identify the potential function of these DEGs, we performed GO analysis using these DEGs and the top 10 significant terms of BP, MF, and CC enrichment analysis are shown (Figure S8B). Most GO terms were related to receptor activity, component of plasma membrane, and plasma membrane. KEGG analysis revealed that metabolism‐related pathways were significantly enriched (Figure S8C); while Reactome Pathway analysis demonstrated the enrichment of immunoregulatory interactions between a lymphoid and a non‐lymphoid cell (Figure 9C). Further, using GSEA, we found that multiple immune‐related cancer hallmarks were enriched in the CD300A high group, such as HALLMARK_ALLOGRAFT_REJECTION, HALLMARK_COMPLEMENT, HALLMARK_IL6_JAK_STAT3_SIGNALING, HALLMARK_INFLAMMATORY_RESPONSE, HALLMARK_INTERFERON_ALPHA_RESPONSE, HALLMARK_INTERFERON_GAMMA_RESPONSE, HALLMARK_NOTCH_SIGNALING, HALLMARK_TNFA_SIGNALING_VIA_NFKB (Figure 9D).
4. DISCUSSION
The CD300 receptor family members are a group of genes involved mainly in fine‐tuning the immune responses. Specifically, CD300A and CD300LF have long cytoplasmic tail containing ITIMs that are capable of eliciting negative signals. 15 While CD300LF could act both as activating and inhibitory receptor, CD300A preferentially exerts immune‐inhibitory activity. Since our analyses were largely based on microarray datasets, where the probes of CD300LD and CD300E does not exist, we therefore focused on investigating the other five members (CD300A, CD300LB, CD300C, CD300LF, and CD300LG). First, using GTEx database, we showed that CD300A‐CD300LF were predominantly expressed in the blood, lung, and spleen tissue, consistent with previous reports. 51 One exception is CD300LG, which was highly expressed in the adipose tissue, breast, heart, and testis, but it was not expressed by blood. This is in line with the finding that CD300LG was not expressed by leukocytes but was expressed at high levels in the heart. 52 Indeed, in all our following analyses, CD300LG showed a distinct transcriptional/clinical pattern compared with the other four genes. This could be due to the structural difference observed in CD300LG: it lacks structural motifs of stimulatory or inhibitory potential and contains a mucin‐like domain. 13 , 51
Several studies have reported the pathological roles of CD300s in autoimmune diseases, 21 , 22 , 23 , 24 , 25 but there is still insufficient data for their involvement in human cancer development. To date, transcriptional dysregulations of CD300s, especially CD300A and CD300LF, have been reported mostly in patients with hematological malignancies, such as ALL, AML, and DLBCL. 26 , 27 , 28 , 29 , 53 , 54 Accordingly, our analyses showed that CD300A‐CD300LF were remarkably overexpressed in AML both in RNA‐seq (TCGA) and microarray (GSE63270) datasets. In addition, we found that CD300A‐CD300LF were more often upregulated in tumors, whereas the opposite was seen for CD300LG, further supporting the distinct expression pattern of CD300LG.
Transcriptional control of the CD300 molecules is essential for the immediate regulation of immune responses. Various triggering stimuli, including cytokines, 21 , 55 Toll‐like receptors (TLRs), 56 hypoxia, and granulocyte–macrophage‐colony‐stimulating factor (GM‐CSF), 57 are known to regulate CD300s expressions. However, evidences regarding their transcriptional regulation at the genomic and epigenetic level is insufficient. We thus assessed the genomic and epigenetic landscape of CD300s across TCGA pan‐cancer studies. Interestingly, we could not identify any mutation or copy number changes of CD300s in AML. Further analyses revealed that CD300A and CD300LF were also unlikely to be regulated by DNA methylation in AML. Recent evidence indicates that CD300A could be robustly induced by PPARβ/δ‐mediated histone modification in macrophages. 38 Similarly, we observed a significant enrichment of H3K4me3 marks in the promoter regions of CD300A gene in leukemia cell lines. These findings indicate that CD300A might be transactivated by H3K4me3 via direct binding.
Among CD300 family members, CD300A was found to be negatively associated with prognosis in ALL, 27 AML, 28 and DLBCL. 29 In the present study, we comprehensively assessed the prognostic implications of CD300s in 33 cancer types and we were able to confirm the adverse prognostic impact of CD300A in AML. In the previous study, survival analysis of CD300A was restricted to the TCGA dataset, our further used seven independent AML datasets and a meta dataset including 1115 AML patients to confirm the prognostic value of CD300A. Moreover, we demonstrated additional value of CD300A expression in refining existing classification schemes in AML. These results suggest CD300A as a promising biomarker of cancer risk in AML patients.
As immune‐modulatory molecules, it is of particular interest to investigate CD300s' correlations with immune cell infiltrations in the TME. CD300A‐CD300LF were reported to be preferentially expressed in cells belonging to the myeloid lineage. 13 , 15 , 16 In accordance, we showed that CD300A‐CD300LF were highly expressed in myeloid lineage immune cells (especially monocytes) both in bulk or at the single cell level. Besides, CD300A‐CD300LF were significantly enriched in monocyte‐like AML subsets. It was noteworthy that CD300A was also highly expressed in NK cells infiltrating AML cells, a finding similar to what has been reported previously. 17 , 18 It has been known that patients with AML often have dysfunctional T cells and NK cells at diagnosis. 58 , 59 Indeed, CD300A could inhibit NK cell‐mediated cytotoxicity and make NK cells display a similar status with exhausted T cells. 17 , 18 This facilitates AML blasts escape from immune elimination and cooperate to promote disease progression, which might explain the poor outcome observed in high CD300A expressers. We can safely speculate that blocking CD300A could restore NK cells activity and lead to AML suppression. Accordingly, we found CD300A expression was positively correlated with T‐cell dysfunction score and high CD300A expressers were predicted to have a better response to immunotherapy in AML. Also, CD300A was found to be positively associated with inhibitory immune checkpoints, such as C10orf54 (also known as VISTA), CD86, CD200R1, HAVCR2 (also known as Tim‐3), and the LILRB family genes (please refer to our unpublished work, DOI: 10.21203/rs.3.rs‐810,313/v1), all of which were reported to be overexpressed in AML cells and some of them may become promising therapeutic targets. 60 , 61 , 62 , 63 , 64 , 65 Interestingly, two genes co‐expressed and interacted with CD300A‐CX3CR1 and CD1C‐were both found to be expressed on mDCs in the AML TME. While CX3CR1+ DC (like CD206+ DC) expresses high levels of CD274 (PD‐L1) and PDCD1LG2 (PD‐L2) and mediates T‐cell suppression, the CD1C+ DC population expresses mainly functional molecules, and displays a T‐cell stimulatory capacity. 44 This further illustrates the fine‐tuning of immune responses in AML by CD300A‐related gene networks.
Our study has several limitations. First, because the expression data of CD300LD and CD300E were not obtainable from microarray data sets, their clinical and immunological implications were leaved undetermined. Second, CD300A has already been reported to be upregulated and prognostically significant in AML. 28 Nonetheless, our results are important in providing a comprehensive view of the prognostic value of CD300 members across a broad type of cancers. Moreover, we have extended the previous finding by validating the prognostic impacts of CD300A in seven independent AML cohorts and comparing its predictive performance with established models. Third, most of our findings were based on RNA‐seq and microarray datasets, future validation using techniques like qPCR and immunohistochemistry (IHC) is needed. Finally, although our bioinformatics analyses gave some immunological insights of CD300s in AML and demonstrated their potential as predictive biomarkers for immunotherapy, experiment‐based information, and prospective clinical assessment are clearly required.
In summary, we found that CD300A‐CD300LF were significantly upregulated and high expression of these genes predicted worse survival in AML. Specifically, CD300A may aid risk stratification in AML and its expression was likely to be regulated by H3K4me3 histone modification. Importantly, we demonstrated CD300A as an essential co‐inhibitory signal that might cause NK cell exhaustion and promotes immune escape of AML cells. CD300A may be a potential candidate for AML therapy via monoclonal antibodies or other specific inhibitory strategies. Prospective clinical study is clearly needed to validate the findings in our study.
AUTHOR CONTRIBUTIONS
JQ and JL conceived and designed the study; Z‐JX, YJ, X‐LZ, and P‐HX collected and assembled data; Z‐JX, X‐MW, and J‐CM performed data analysis; Z‐JX drafted the manuscript; JQ and JL participated in study supervision and commented on the manuscript. All authors read and approved the final manuscript.
CONFLICT OF INTEREST
The authors declare that they have no competing interests.
Supporting information
Data S1
Supinfo S1
Xu Z‐j, Jin Y, Zhang X‐l, et al. Pan‐cancer analysis identifies CD300 molecules as potential immune regulators and promising therapeutic targets in acute myeloid leukemia. Cancer Med. 2023;12:789‐807. doi: 10.1002/cam4.4905
Zi‐jun Xu, Ye Jin, and Xin‐long Zhang contributed equally to this work.
Funding informationThis study was supported by National Natural Science foundation of China (81970118, 81900163), Medical Innovation Team of Jiangsu Province (CXTDB2017002), Zhenjiang Clinical Research Center of Hematology (SS2018009), Social Development Foundation of Zhenjiang (SH2019065, SH2021052), Scientific Research Project of The Fifth 169 Project of Zhenjiang (21).
Contributor Information
Jiang Lin, Email: 2651329493@qq.com.
Jun Qian, Email: qianjun0007@hotmail.com.
DATA AVAILABILITY STATEMENT
The datasets analyzed in this study are available in the following open access repositories:
GTEx, www.gtexportal.org/
CCLE, https://www.broadinstitute.org/ccle
TCGA, https://portal.gdc.cancer.gov/, http://www.cbioportal.org
UCSC Xena, https://xena.ucsc.edu/
UALCAN, http://UALCAN.path.uab.edu/
GEO, https://www.ncbi.nlm.nih.gov/geo/ (GEO accession numbers: GSE63270, GSE116256, GSE6891, GSE10358, GSE37642, GSE12417, GSE71014, GSE74359, GSE89336, and GSE109619).
FIMM AML scRNA data, https://www.synapse.org (doi: 10.7303/syn21991014).
Human Proteome Map, https://www.humanproteomemap.org/
DiseaseMeth, http://bio‐bigdata.hrbmu.edu.cn/diseasemeth/analyze.html
TIMER 2.0, http://timer.comp‐genomics.org/
REFERENCES
- 1. Topalian SL, Hodi FS, Brahmer JR, et al. Safety, activity, and immune correlates of anti‐PD‐1 antibody in cancer. N Engl J Med. 2012;366:2443‐2454. doi: 10.1056/NEJMoa1200690 [DOI] [PMC free article] [PubMed] [Google Scholar]
- 2. Brahmer JR, Tykodi SS, Chow LQM, et al. Safety and activity of anti‐PD‐L1 antibody in patients with advanced cancer. N Engl J Med. 2012;366:2455‐2465. doi: 10.1056/NEJMoa1200694 [DOI] [PMC free article] [PubMed] [Google Scholar]
- 3. Robert C, Thomas L, Bondarenko I, et al. Ipilimumab plus dacarbazine for previously untreated metastatic melanoma. N Engl J Med. 2011;364:2517‐2526. doi: 10.1056/NEJMoa1104621 [DOI] [PubMed] [Google Scholar]
- 4. Curran EK, Godfrey J, Kline J. Mechanisms of immune tolerance in leukemia and lymphoma. Trends Immunol. 2017;38:513‐525. doi: 10.1016/j.it.2017.04.004 [DOI] [PMC free article] [PubMed] [Google Scholar]
- 5. Taghiloo S, Asgarian‐Omran H. Immune evasion mechanisms in acute myeloid leukemia: a focus on immune checkpoint pathways. Crit Rev Oncol Hematol. 2021;157:103164. doi: 10.1016/j.critrevonc.2020.103164 [DOI] [PubMed] [Google Scholar]
- 6. Teague RM, Kline J. Immune evasion in acute myeloid leukemia: current concepts and future directions. J Immunother Cancer. 2013;1:1. doi: 10.1186/2051-1426-1-13 [DOI] [PMC free article] [PubMed] [Google Scholar]
- 7. Ustun C, Miller JS, Munn DH, Weisdorf DJ, Blazar BR. Regulatory T cells in acute myelogenous leukemia: is it time for immunomodulation? Blood. 2011;118:5084‐5095. doi: 10.1182/blood-2011-07-365817 [DOI] [PMC free article] [PubMed] [Google Scholar]
- 8. Tohumeken S, Baur R, Böttcher M, et al. Palmitoylated proteins on AML‐derived extracellular vesicles promote myeloid‐derived suppressor cell differentiation via TLR2/Akt/mTOR signaling. Cancer Res. 2020;80:3663‐3676. doi: 10.1158/0008-5472.Can-20-0024 [DOI] [PubMed] [Google Scholar]
- 9. Pyzer AR, Stroopinsky D, Rajabi H, et al. MUC1‐mediated induction of myeloid‐derived suppressor cells in patients with acute myeloid leukemia. Blood. 2017;129:1791‐1801. doi: 10.1182/blood-2016-07-730614 [DOI] [PMC free article] [PubMed] [Google Scholar]
- 10. Al‐Matary YS, Botezatu L, Opalka B, et al. Acute myeloid leukemia cells polarize macrophages towards a leukemia supporting state in a growth factor independence 1 dependent manner. Haematologica. 2016;101:1216‐1227. doi: 10.3324/haematol.2016.143180 [DOI] [PMC free article] [PubMed] [Google Scholar]
- 11. Xu ZJ, Gu Y, Wang CZ, et al. The M2 macrophage marker CD206: a novel prognostic indicator for acute myeloid leukemia. Onco Targets Ther. 2020;9:1683347. doi: 10.1080/2162402x.2019.1683347 [DOI] [PMC free article] [PubMed] [Google Scholar]
- 12. Wherry EJ. T cell exhaustion. Nat Immunol. 2011;12:492‐499. doi: 10.1038/ni.2035 [DOI] [PubMed] [Google Scholar]
- 13. Borrego F. The CD300 molecules: an emerging family of regulators of the immune system. Blood. 2013;121:1951‐1960. doi: 10.1182/blood-2012-09-435057 [DOI] [PMC free article] [PubMed] [Google Scholar]
- 14. Clark GJ, Cooper B, Fitzpatrick S, Green BJ, Hart DN. The gene encoding the immunoregulatory signaling molecule CMRF‐35A localized to human chromosome 17 in close proximity to other members of the CMRF‐35 family. Tissue Antigens. 2001;57:415‐423. doi: 10.1034/j.1399-0039.2001.057005415.x [DOI] [PubMed] [Google Scholar]
- 15. Rozenberg P, Reichman H, Moshkovits I, Munitz A. CD300 family receptors regulate eosinophil survival, chemotaxis, and effector functions. J Leukoc Biol. 2018;104:21‐29. doi: 10.1002/jlb.2mr1117-433r [DOI] [PubMed] [Google Scholar]
- 16. Clark GJ, Ju X, Azlan M, Tate C, Ding Y, Hart DNJ. The CD300 molecules regulate monocyte and dendritic cell functions. Immunobiology. 2009;214:730‐736. doi: 10.1016/j.imbio.2009.06.004 [DOI] [PubMed] [Google Scholar]
- 17. Cantoni C, Bottino C, Augugliaro R, et al. Molecular and functional characterization of IRp60, a member of the immunoglobulin superfamily that functions as an inhibitory receptor in human NK cells. Eur J Immunol. 1999;29:3148‐3159. doi: [DOI] [PubMed] [Google Scholar]
- 18. Lankry D, Simic H, Klieger Y, Levi‐Schaffer F, Jonjic S, Mandelboim O. Expression and function of CD300 in NK cells. J Immunol. 2010;185:2877‐2886. doi: 10.4049/jimmunol.0903347 [DOI] [PubMed] [Google Scholar]
- 19. Xu Y, Tarquini F, Romero R, et al. Peripheral CD300a+CD8+ T lymphocytes with a distinct cytotoxic molecular signature increase in pregnant women with chronic chorioamnionitis. Am J Reprod Immunol. 2012;67:184‐197. doi: 10.1111/j.1600-0897.2011.01088.x [DOI] [PMC free article] [PubMed] [Google Scholar]
- 20. Quigley M, Pereyra F, Nilsson B, et al. Transcriptional analysis of HIV‐specific CD8+ T cells shows that PD‐1 inhibits T cell function by upregulating BATF. Nat Med. 2010;16:1147‐1151. doi: 10.1038/nm.2232 [DOI] [PMC free article] [PubMed] [Google Scholar]
- 21. Moshkovits I, Karo‐Atar D, Itan M, et al. CD300f associates with IL‐4 receptor α and amplifies IL‐4‐induced immune cell responses. Proc Natl Acad Sci USA. 2015;112:8708‐8713. doi: 10.1073/pnas.1507625112 [DOI] [PMC free article] [PubMed] [Google Scholar]
- 22. Lee HN, Tian L, Bouladoux N, et al. Dendritic cells expressing immunoreceptor CD300f are critical for controlling chronic gut inflammation. J Clin Invest. 2017;127:1905‐1917. doi: 10.1172/jci89531 [DOI] [PMC free article] [PubMed] [Google Scholar]
- 23. Matsukawa T, Izawa K, Isobe M, et al. Ceramide‐CD300f binding suppresses experimental colitis by inhibiting ATP‐mediated mast cell activation. Gut. 2016;65:777‐787. doi: 10.1136/gutjnl-2014-308900 [DOI] [PMC free article] [PubMed] [Google Scholar]
- 24. Yamanishi Y, Kitaura J, Izawa K, et al. TIM1 is an endogenous ligand for LMIR5/CD300b: LMIR5 deficiency ameliorates mouse kidney ischemia/reperfusion injury. J Exp Med. 2010;207:1501‐1511. doi: 10.1084/jem.20090581 [DOI] [PMC free article] [PubMed] [Google Scholar]
- 25. Peluffo H, Alí‐Ruiz D, Ejarque‐Ortíz A, et al. Overexpression of the immunoreceptor CD300f has a neuroprotective role in a model of acute brain injury. Brain Pathology (Zurich, Switzerland). 2012;22:318‐328. doi: 10.1111/j.1750-3639.2011.00537.x [DOI] [PMC free article] [PubMed] [Google Scholar]
- 26. Coustan‐Smith E, Song G, Clark C, et al. New markers for minimal residual disease detection in acute lymphoblastic leukemia. Blood. 2011;117:6267‐6276. doi: 10.1182/blood-2010-12-324004 [DOI] [PMC free article] [PubMed] [Google Scholar]
- 27. Chen Z, Shojaee S, Buchner M, et al. Signalling thresholds and negative B‐cell selection in acute lymphoblastic leukaemia. Nature. 2015;521:357‐361. doi: 10.1038/nature14231 [DOI] [PMC free article] [PubMed] [Google Scholar]
- 28. Sun X, Huang S, Wang X, Zhang X, Wang X. CD300A promotes tumor progression by PECAM1, ADCY7 and AKT pathway in acute myeloid leukemia. Oncotarget. 2018;9:27574‐27584. doi: 10.18632/oncotarget.24164 [DOI] [PMC free article] [PubMed] [Google Scholar]
- 29. Jiang L, Xu Y, Zeng X, Fang J, Morse HC III, Zhou JX. Suppression of CD300A inhibits the growth of diffuse large B‐cell lymphoma. Oncotarget. 2015;6:31191‐31202. doi: 10.18632/oncotarget.5152 [DOI] [PMC free article] [PubMed] [Google Scholar]
- 30. Ritchie ME, Phipson B, Wu D, et al. Limma powers differential expression analyses for RNA‐sequencing and microarray studies. Nucleic Acids Res. 2015;43:e47. doi: 10.1093/nar/gkv007 [DOI] [PMC free article] [PubMed] [Google Scholar]
- 31. Dufva O, Pölönen P, Brück O, et al. Immunogenomic landscape of hematological malignancies. Cancer Cell. 2020;38:380‐399.e313. doi: 10.1016/j.ccell.2020.06.002 [DOI] [PubMed] [Google Scholar]
- 32. van Galen P, Hovestadt V, Wadsworth MH II, et al. Single‐cell RNA‐seq reveals AML hierarchies relevant to disease progression and immunity. Cell. 2019;176:1265‐1281.e1224. doi: 10.1016/j.cell.2019.01.031 [DOI] [PMC free article] [PubMed] [Google Scholar]
- 33. Liu CJ, Hu FF, Xia MX, Han L, Zhang Q, Guo AY. GSCALite: a web server for gene set cancer analysis. Bioinformatics (Oxford, England). 2018;34:3771‐3772. doi: 10.1093/bioinformatics/bty411 [DOI] [PubMed] [Google Scholar]
- 34. Camp RL, Dolled‐Filhart M, Rimm DL. X‐tile: a new bio‐informatics tool for biomarker assessment and outcome‐based cut‐point optimization. Clin Cancer Res. 2004;10:7252‐7259. doi: 10.1158/1078-0432.ccr-04-0713 [DOI] [PubMed] [Google Scholar]
- 35. Sturm G, Finotello F, Petitprez F, et al. Comprehensive evaluation of transcriptome‐based cell‐type quantification methods for immuno‐oncology. Bioinformatics (Oxford, England). 2019;35:i436‐i445. doi: 10.1093/bioinformatics/btz363 [DOI] [PMC free article] [PubMed] [Google Scholar]
- 36. Liu Z, Li M, Jiang Z, Wang X. A comprehensive immunologic portrait of triple‐negative breast cancer. Transl Oncol. 2018;11:311‐329. doi: 10.1016/j.tranon.2018.01.011 [DOI] [PMC free article] [PubMed] [Google Scholar]
- 37. De Simone M, Arrigoni A, Rossetti G, et al. Transcriptional landscape of human tissue lymphocytes unveils uniqueness of tumor‐infiltrating T regulatory cells. Immunity. 2016;45:1135‐1147. doi: 10.1016/j.immuni.2016.10.021 [DOI] [PMC free article] [PubMed] [Google Scholar]
- 38. Tanaka T, Tahara‐Hanaoka S, Nabekura T, et al. PPARβ/δ activation of CD300a controls intestinal immunity. Sci Rep. 2014;4:5412. doi: 10.1038/srep05412 [DOI] [PMC free article] [PubMed] [Google Scholar]
- 39. Li Z, Herold T, He C, et al. Identification of a 24‐gene prognostic signature that improves the European LeukemiaNet risk classification of acute myeloid leukemia: an international collaborative study. J Clin Oncol. 2013;31:1172‐1181. doi: 10.1200/jco.2012.44.3184 [DOI] [PMC free article] [PubMed] [Google Scholar]
- 40. Ng SW, Mitchell A, Kennedy JA, et al. A 17‐gene stemness score for rapid determination of risk in acute leukaemia. Nature. 2016;540:433‐437. doi: 10.1038/nature20598 [DOI] [PubMed] [Google Scholar]
- 41. Schaafsma E, Fugle CM, Wang X, Cheng C. Pan‐cancer association of HLA gene expression with cancer prognosis and immunotherapy efficacy. Br J Cancer. 2021;125:422‐432. doi: 10.1038/s41416-021-01400-2 [DOI] [PMC free article] [PubMed] [Google Scholar]
- 42. Jiang P, Gu S, Pan D, et al. Signatures of T cell dysfunction and exclusion predict cancer immunotherapy response. Nat Med. 2018;24:1550‐1558. doi: 10.1038/s41591-018-0136-1 [DOI] [PMC free article] [PubMed] [Google Scholar]
- 43. Zhang J, Mai S, Chen HM, et al. Leukocyte immunoglobulin‐like receptors in human diseases: an overview of their distribution, function, and potential application for immunotherapies. J Leukoc Biol. 2017;102:351‐360. doi: 10.1189/jlb.5MR1216-534R [DOI] [PMC free article] [PubMed] [Google Scholar]
- 44. Guo R, Lü M, Cao F, et al. Single‐cell map of diverse immune phenotypes in the acute myeloid leukemia microenvironment. Biomark Res. 2021;9:15. doi: 10.1186/s40364-021-00265-0 [DOI] [PMC free article] [PubMed] [Google Scholar]
- 45. Lepore M, de Lalla C, Gundimeda SR, et al. A novel self‐lipid antigen targets human T cells against CD1c(+) leukemias. J Exp Med. 2014;211:1363‐1377. doi: 10.1084/jem.20140410 [DOI] [PMC free article] [PubMed] [Google Scholar]
- 46. Shao JY, Yin WW, Zhang QF, et al. Siglec‐7 defines a highly functional natural killer cell subset and inhibits cell‐mediated activities. Scand J Immunol. 2016;84:182‐190. doi: 10.1111/sji.12455 [DOI] [PubMed] [Google Scholar]
- 47. Yang L, Feng Y, Wang S, et al. Siglec‐7 is an indicator of natural killer cell function in acute myeloid leukemia. Int Immunopharmacol. 2021;99:107965. doi: 10.1016/j.intimp.2021.107965 [DOI] [PubMed] [Google Scholar]
- 48. Aldinucci D, Borghese C, Casagrande N. The CCL5/CCR5 Axis in cancer progression. Cancer. 2020;12:1765. doi: 10.3390/cancers12071765 [DOI] [PMC free article] [PubMed] [Google Scholar]
- 49. Li Y, Wang K. AML1/ETO represses the expression of a potential tumor suppressor, CST7, IN T(8;21) acute myeloid leukemia through DNA methylation. Exp Hematol. 2016;44:S87‐S88. doi: 10.1016/j.exphem.2016.06.178 [DOI] [Google Scholar]
- 50. Shen K, Moroco JA, Patel RK, et al. The Src family kinase Fgr is a transforming oncoprotein that functions independently of SH3‐SH2 domain regulation. Sci Signal. 2018;11:eaat5916. doi: 10.1126/scisignal.aat5916 [DOI] [PubMed] [Google Scholar]
- 51. Clark GJ, Ju X, Tate C, Hart DN. The CD300 family of molecules are evolutionarily significant regulators of leukocyte functions. Trends Immunol. 2009;30:209‐217. doi: 10.1016/j.it.2009.02.003 [DOI] [PubMed] [Google Scholar]
- 52. Takatsu H, Hase K, Ohmae M, et al. CD300 antigen like family member G: a novel Ig receptor like protein exclusively expressed on capillary endothelium. Biochem Biophys Res Commun. 2006;348:183‐191. doi: 10.1016/j.bbrc.2006.07.047 [DOI] [PubMed] [Google Scholar]
- 53. Abadir E, Gasiorowski RE, Lai K, et al. CD300f epitopes are specific targets for acute myeloid leukemia with monocytic differentiation. Mol Oncol. 2019;13:2107‐2120. doi: 10.1002/1878-0261.12549 [DOI] [PMC free article] [PubMed] [Google Scholar]
- 54. Abadir E, Silveira PA, Gasiorowski RE, et al. Targeting CD300f to enhance hematopoietic stem cell transplantation in acute myeloid leukemia. Blood Adv. 2020;4:1206‐1216. doi: 10.1182/bloodadvances.2019001289 [DOI] [PMC free article] [PubMed] [Google Scholar]
- 55. Shik D, Moshkovits I, Karo‐Atar D, Reichman H, Munitz A. Interleukin‐33 requires CMRF35‐like molecule‐1 expression for induction of myeloid cell activation. Allergy. 2014;69:719‐729. doi: 10.1111/all.12388 [DOI] [PubMed] [Google Scholar]
- 56. Ju X, Zenke M, Hart DN, Clark GJ. CD300a/c regulate type I interferon and TNF‐alpha secretion by human plasmacytoid dendritic cells stimulated with TLR7 and TLR9 ligands. Blood. 2008;112:1184‐1194. doi: 10.1182/blood-2007-12-127951 [DOI] [PubMed] [Google Scholar]
- 57. Nissim Ben Efraim AH, Karra L, Ben‐Zimra M, Levi‐Schaffer F. The inhibitory receptor CD300a is up‐regulated by hypoxia and GM‐CSF in human peripheral blood eosinophils. Allergy. 2013;68:397‐401. doi: 10.1111/all.12092 [DOI] [PubMed] [Google Scholar]
- 58. Le Dieu R, Taussig DC, Ramsay AG, et al. Peripheral blood T cells in acute myeloid leukemia (AML) patients at diagnosis have abnormal phenotype and genotype and form defective immune synapses with AML blasts. Blood. 2009;114:3909‐3916. doi: 10.1182/blood-2009-02-206946 [DOI] [PMC free article] [PubMed] [Google Scholar]
- 59. Costello RT, Sivori S, Marcenaro E, et al. Defective expression and function of natural killer cell‐triggering receptors in patients with acute myeloid leukemia. Blood. 2002;99:3661‐3667. doi: 10.1182/blood.v99.10.3661 [DOI] [PubMed] [Google Scholar]
- 60. Kim TK, Han X, Wang J, et al. PD‐1H (VISTA) induces immune evasion in acute myeloid leukemia. Blood. 2017;130:2658‐2658. doi: 10.1182/blood.V130.Suppl_1.2658.2658 [DOI] [Google Scholar]
- 61. Lamble A, Kosaka Y, Huang F, et al. Enhanced VISTA expression in a subset of patients with acute myeloid leukemia. Blood. 2016;128:4056‐4056. doi: 10.1182/blood.V128.22.4056.4056 [DOI] [Google Scholar]
- 62. Re F, Arpinati M, Testoni N, et al. Expression of CD86 in acute myelogenous leukemia is a marker of dendritic/monocytic lineage. Exp Hematol. 2002;30:126‐134. doi: 10.1016/s0301-472x(01)00768-8 [DOI] [PubMed] [Google Scholar]
- 63. Ozkazanc D, Yoyen‐Ermis D, Tavukcuoglu E, Buyukasik Y, Esendagli G. Functional exhaustion of CD4(+) T cells induced by co‐stimulatory signals from myeloid leukaemia cells. Immunology. 2016;149:460‐471. doi: 10.1111/imm.12665 [DOI] [PMC free article] [PubMed] [Google Scholar]
- 64. Kagiyama Y, Kitaura J, Togami K, et al. Upregulation of CD200R1 in lineage‐negative leukemic cells is characteristic of AML1‐ETO‐positive leukemia in mice. Int J Hematol. 2012;96:638‐648. doi: 10.1007/s12185-012-1207-6 [DOI] [PubMed] [Google Scholar]
- 65. Wang Z, Chen J, Wang M, Zhang L, Yu L. One Stone, two birds: the roles of Tim‐3 in acute myeloid leukemia. Front Immunol. 2021;12:618710. doi: 10.3389/fimmu.2021.618710 [DOI] [PMC free article] [PubMed] [Google Scholar]
Associated Data
This section collects any data citations, data availability statements, or supplementary materials included in this article.
Supplementary Materials
Data S1
Supinfo S1
Data Availability Statement
The datasets analyzed in this study are available in the following open access repositories:
GTEx, www.gtexportal.org/
CCLE, https://www.broadinstitute.org/ccle
TCGA, https://portal.gdc.cancer.gov/, http://www.cbioportal.org
UCSC Xena, https://xena.ucsc.edu/
UALCAN, http://UALCAN.path.uab.edu/
GEO, https://www.ncbi.nlm.nih.gov/geo/ (GEO accession numbers: GSE63270, GSE116256, GSE6891, GSE10358, GSE37642, GSE12417, GSE71014, GSE74359, GSE89336, and GSE109619).
FIMM AML scRNA data, https://www.synapse.org (doi: 10.7303/syn21991014).
Human Proteome Map, https://www.humanproteomemap.org/
DiseaseMeth, http://bio‐bigdata.hrbmu.edu.cn/diseasemeth/analyze.html
TIMER 2.0, http://timer.comp‐genomics.org/


