Abstract
People mobility data sets played a role during the COVID-19 pandemic in assessing the impact of lockdown measures and correlating mobility with pandemic trends. Two global data sets were Apple’s Mobility Trends Reports and Google’s Community Mobility Reports. The former is no longer available online, while the latter is no longer updated since October 2022. Thus, new products are required. To establish a lower bound on data set penetration guaranteeing high adherence between new products and the Big Tech products, an independent mobility data set based on 3.8 million smartphone trajectories is analysed to compare its information content with that of the Google data set. This lower bound is determined to be around 10−4 (1 trajectory every 10,000 people) suggesting that relatively small data sets are suitable for replacing Big Tech reports.
Subject terms: Socioeconomic scenarios, Scientific data
Introduction
People mobility data received considerable attention during the COVID-19 pandemic when they were used to assess the impact of lockdown measures1–7 and to understand the correlation between mobility patterns and pandemic trends8–14. In a smart society, the importance of mobility data is not limited to the pandemic. In general, mobility is affected by global long-term events such as economic crises15–17 and conflicts18, and by local short-term events like social unrest and extreme natural events19–22. Mobility data are also used to better assess exposure to health-threatening phenomena23.
Smartphone mobility data play a key role in estimating mobility patterns24–30. Apple’s Mobility Trends Reports and Google’s Community Mobility Reports were two global data sets made available to researchers during COVID-19 pandemic31–35. The first data set was discontinued on April 14, 202236, while the second is still available but no longer updated after October 15, 202237.
Here, a global mobility data set derived from the Earthquake Network (EQN) citizen science initiative38 is analysed to assess the feasibility of making available to the scientific community mobility products which, in their information content, are similar to Apple and Google products. Since 2012, EQN implements the first smartphone-based earthquake early warning system39,40 allowing citizens to receive real-time alerts directly on their smartphones when seismic waves are incoming. To join the initiative, people install the EQN smartphone app which turns the smartphone into a seismic detector. Once installed, the app regularly collects the smartphone location which is needed by the earthquake detection algorithm41 and to first alert people who are close to the epicentre at the time of the earthquake. As of today, more than 8 million people joined the initiative globally making EQN one of the most active citizen science projects.
The data set provided by EQN includes 6.1 billion location data points collected by its smartphone app from March 11, 2020, to September 22, 2022. From the data set, 3.8 million anonymized spatio-temporal smartphone trajectories are reconstructed and used to produce mobility metrics at the country level. Contrary to Big Tech data sets, which benefits from a high penetration among the population, the analysed data set is relatively small. Thus, the methodology adopted to analyse the data set plays a key role in estimating metrics characterized by the lowest possible bias and accompanied by a measure of uncertainty. Also, the methodology addresses peculiar aspects of smartphone-based location data, such as: the non-negligeable uncertainty on smartphone coordinates, missing data and the non-homogeneous geographical penetration of smartphone apps in the population.
Similarly to Gao et al3, two metrics are provided: daily average travel distance (M1) and the percentage of people who did not move during the 24 h of the day (M2). Analysis is restricted to a group of 17 countries for which uncertainty on the estimated mobility metrics is small enough to allow reasonable comparisons between countries and/or different periods: Argentina (ARG), Chile (CHL), Colombia (COL), Costa Rica (CRI), Ecuador (ECU), Greece (GRC), Guatemala (GTM), Italy (ITA), Mexico (MEX), Nicaragua (NIC), Panama (PAN), Peru (PER), Philippines (PHL), Slovenia (SVN), Turkey (TUR), the United States (USA) and Venezuela (VEN).
Metrics M1 and M2 are provided at daily temporal resolution and at different levels of temporal smoothing, uncertainty included. Mobility metrics time series are correlated with time series of Google’s product in order to compare their mutual information content and to assess a lower bound on the number of smartphone trajectories (with respect to the country population size) which guarantees a high adherence between products.
Mobility data analysed in this work are elaborated daily by EQN and regularly made available on Zenodo through the MobMeter42 data set. To the best of our knowledge, MobMeter is currently the only open source mobility data set covering multiple global countries and an extensive time period up to present. MobMeter is thus a unique instrument for researchers who may benefit from including mobility patterns as covariates in their statistical or stochastic models, with applications in multiple fields including epidemiology, climatology and economics.
Results
Global long-term mobility trends
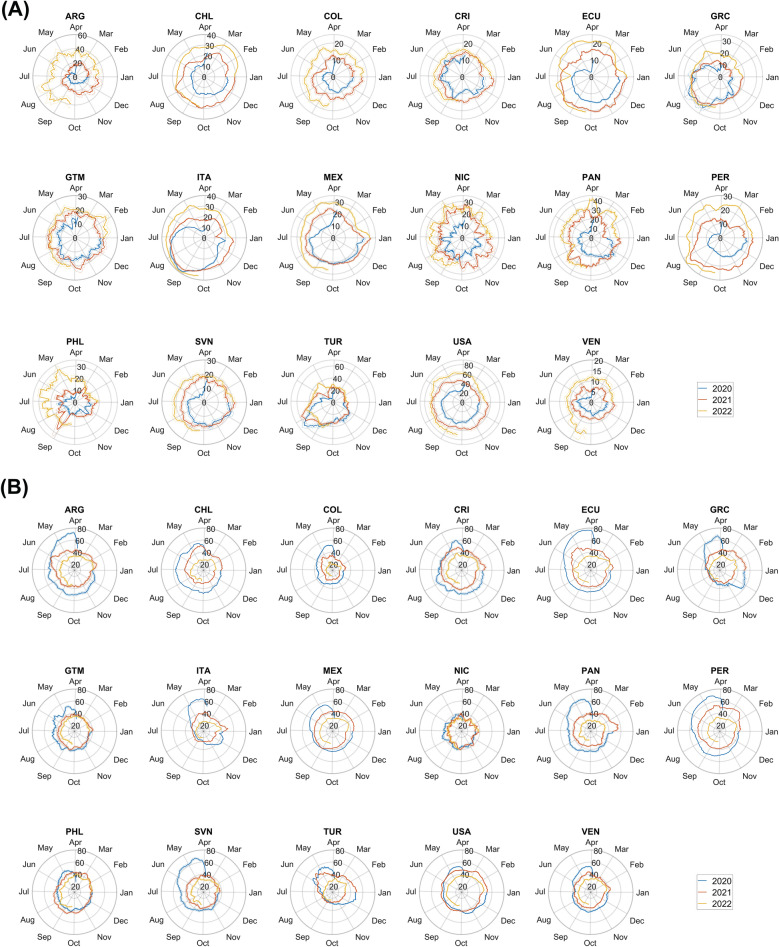
Mobility metrics and their smoothed versions are computed for the aforementioned countries. Figure 1 shows polar plots of M1 and M2 time series based on a 14-day temporal smoothing. All countries show significant decrements in the M1 metric and significant increments in the M2 metric during the few months after March 11, 2020 (initial phase of the COVID-19 pandemic). Differences between countries are observed in the temporal rapidity of the subsequent “recovery”. Some exhibit “lobed” polar plots. This is the case for GRC, ITA and TUR, which show fast recoveries during the summer of 2020 and a contraction of people mobility during the subsequent winter. All other countries exhibit “spiralling” polar plots, which is a sign of a slow recovery. This behaviour is clear for South American countries like ARG, COL, PER and VEN.
Figure 1.
(A) Estimated smoothed mobility metric M1 (daily average travelled distance) and (B) estimated smoothed mobility metric M2 (percentage of people who did not move during the 24 h of the day) based on a 14-day moving average from March 24, 2020, to September 22, 2022. M1 is expressed in kilometres while M2 in percentage. Dashed lines are 95% confidence bands.
Short-local events in mobility metrics
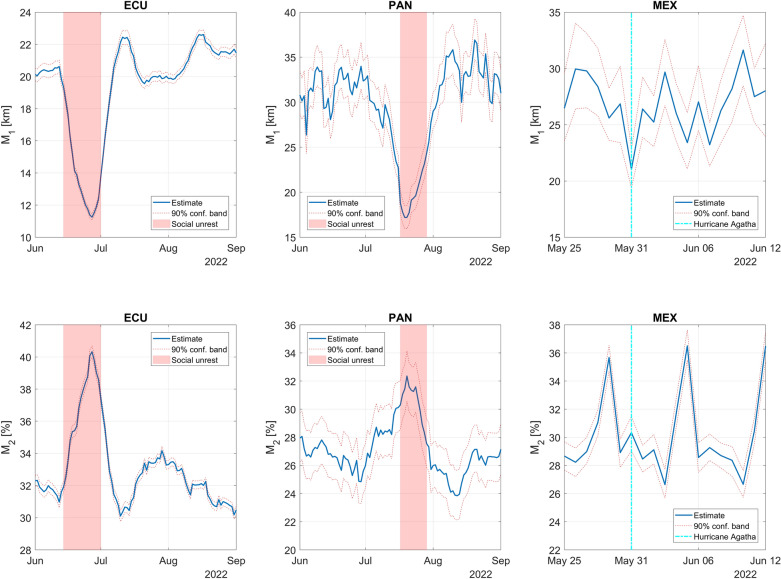
M1 and M2 time series are also affected by short-term local events. Figure 2 shows how mobility metrics significantly changed during social unrest in ECU and PAN and when a hurricane made landfall in MEX. In ECU, social protests43 occurred between June 13 and June 30. M1 dropped from approximately 20 km to 11.5 km, while M2 raised from approximately 32% to 40%. In PAN, social protests44 broke out on July 16 and lasted nearly two weeks. M1 dropped from around 30 km to 17 km, while M2 raised from approximately 27% to 32%. Between May 30 and 31, 2022, Hurricane Agatha hit the Oaxaca state of MEX with flooding and mudslides that killed at least 10 people and left 20 missing45. M1 dropped from an average of around 28 km (on the previous days) to around 22 km. This drop is seen at the country level, so it was mitigated by the relatively small area (with respect to the area of MEX) impacted by the hurricane. M2 did not change significantly with respect to the previous day.
Figure 2.
Variations in mobility metrics M1 and M2 during 2022 social unrest in ECU and PAN and when Hurricane Agatha struck Oaxaca, MEX. For ECU and PAN, mobility metrics are based on 7-day smoothing. For MEX, no smoothing is applied.
Comparison with Google’s Community Mobility Reports
A comparison is made between metrics M1 and M2 and the mobility indices of the Google product. Google’s mobility indices are given as variations (in percentage) in the number of visits to categories of places with respect to a baseline. This means that Google’s indices do not carry exactly the same information of M1 and M2, nor the unit of measure is the same. Nonetheless, all indices are based on smartphone spatio-temporal trajectories, and their linear correlation is expected to be medium–high.
M1 is compared with Google’s “Transit stations”, “Parks” and “Retail and recreation” indices while M2 with Google’s “Residential” and “Workplaces” indices. It is expected that “Transit stations”, “Parks” and “Retail and recreation” indices positively correlate with the daily average distance travelled by people, and that the “Residential” and the “Workplaces” indices correlate (positively and negatively, respectively) with the percentage of people who did not move during the 24 h of the day.
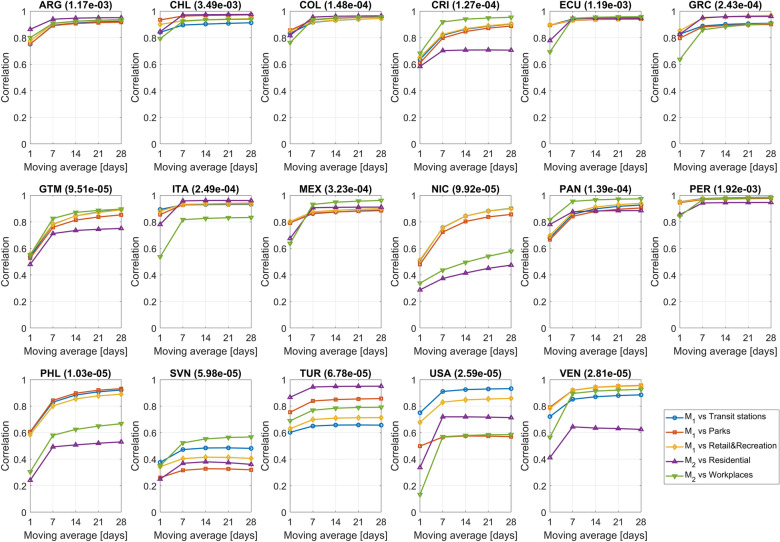
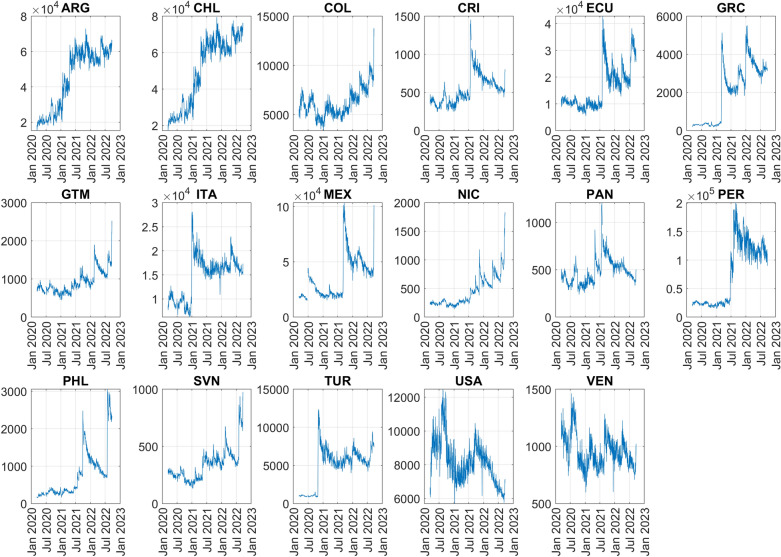
Figure 3 shows, for each country and for different levels of smoothing of the time series, the linear correlation between the metrics and Google’s indices. For most countries, correlations are high and significantly increase when moving from no smoothing to a 7-day moving average smoothing. The lowest correlations are exhibited by NIC, SVL and PHL, which are among the countries with the lowest average number of daily smartphone trajectories (average sample size) in the data set (see Fig. 4). Robustness of above correlations is tested in the Methods section.
Figure 3.
Linear correlation between the M1 mobility metric and Google’s “Transit stations” index, between M1 and Google’s “Parks” index, between M1 and Google’s “Retail and Recreation” index, between the M2 mobility metric and Google’s “Residential” index and between the M2 and Google’s “Workplaces” index. 1-day moving average means no smoothing. All correlations between M2 and Google’s “Workplaces” index are negative but they are reported without sign to assure readability of the plots. In brackets, the average data set penetration in each country.
Figure 4.
Time series of the number of daily smartphone trajectories used to estimate M1 and M2 metrics by country.
Data set penetration analysis
The relationship between correlations and average sample size is better described by accounting for country population size. The average sample size is computed for each country for the period from March 11, 2020, to September 22, 2022, and divided by country population size. This gives the average data set penetration in each country.
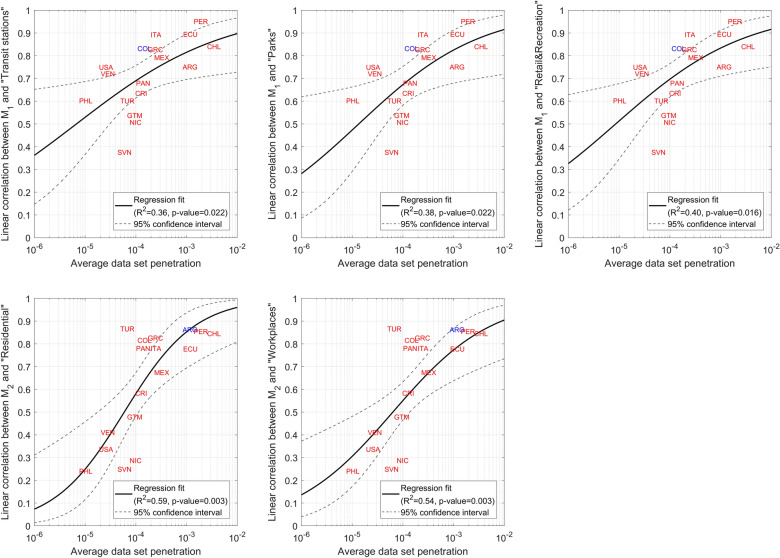
Under the non-smoothing case, for each correlation between metrics and indices the 17 average penetration values are related with the 17 correlations using a beta regression (see Methods section). Figure 5 shows the data and modelling results. In general, the higher the average penetration, the higher the correlation between indices. Additionally, average penetrations between around 10−4 (i.e., 1 smartphone trajectory every 10,000 people) delimit the transition between medium (~ 0.5) to high (> 0.7) correlations.
Figure 5.
Linear correlation between M1 and M2 and Google’s mobility indices vs average data set penetration for the 17 countries under the non-smoothing case. Solid lines are the fits by a beta regression model with logit link function, while dashed lines are 95% confidence intervals on fitted values. R2 are pseudo coefficients of determination, while the p-values refer to an F-test on the regression model, which tests whether the model fits significantly better than a model with only the constant term. Each label is a country. Overlapping labels are in different colours. All correlations between M2 and Google’s “Workplaces” index are negative but they are modelled without sign to keep consistency with Fig. 3 and to allow beta regression.
Discussion
Mobility metrics and indices are proxies of societal health and stress. Their constant monitoring informs assessment of the impact of both long- and short-term adverse events. Thus, location data collected by smartphone apps play an important role, as they carry information on people mobility. With Apple’s Mobility Trends Reports discontinued and Google’s Community Mobility Reports no longer updated, it is crucial to understand whether similar products can be produced from alternative mobility data sets and made available to the scientific community.
This study reconstructs smartphone trajectories from an independent mobility data set provided by the Earthquake Network citizen science initiative. These allow estimation of country-level mobility metrics with relatively high correlations to similar indices by Google. The average data set penetration among the country population requires 1 smartphone trajectory for every 10,000 people. This prove that relatively small data sets are suitable for replacing country-level Big Tech products when their analysis is based on a sound methodology which also provides measures of uncertainty.
Since it happened with Google’s and Apple’s products, it is meaningful to discuss the possible end-of-life of the MobMeter data set. While there is no guarantee that the Earthquake Network initiative will last years or decades, it is likely that citizens' interest in earthquakes and in the EQN smartphone app will not vanish in the foreseeable future. On the other hand, personal mobility data are inevitably connected to the privacy and the security of the individual46. The collection of personal data by smartphone apps is usually regulated by the app-store owner, with Google and Apple, again, as the main actors. This implies that new rules and limits on how personal data are collected may come into place at any time, making the publishing of MobMeter hard or impossible (long before Earth’s seismicity will fade away).
Methods
Trajectory description
The mobility data set analysed in this work includes smartphones trajectories collected from the 17 countries during the period from March 11, 2020, to September 22, 2022 (926 days). Each trajectory covers any possible subset of the 926 days (from only one day to the full period).
In general, the th trajectory, , is composed of observations, with the total number of trajectories. The th observation, , of the th trajectory is given by.
| 1 |
where is the anonymized smartphone/trajectory identifier, and are the latitude and longitude smartphone coordinates, is the uncertainty on smartphone coordinates, and is the timestamp.
Uncertainty is in metres and represents the standard deviation (sigma) of two independent normal distributions centred on each smartphone coordinate. Timestamp is based on the country local time and refers to the time and are observed by the smartphone. Timestamps have the following constraint: min.
Trajectory sanitation
Trajectory observations which exhibit a latitude and longitude equal to zero are removed from the trajectory. Zero values are returned by a smartphone when geolocation is not possible. Also, values equal to zero or negative are replaced with an uncertainty equal to 25 m. This is the typical uncertainty when a smartphone localizes itself using Wi-Fi networks and/or cell phone antennas. The percentage of trajectory observations affected by the replacement is 0.08%.
Daily estimates of M1 and M2 metrics
M1 and M2 mobility metrics are estimated with daily temporal resolution. For each day , only trajectories with at least 12 observations between 00:00:00 and 23:59:59 local time and with a temporal span of at least 12 h between the first and the last observation contribute to the estimate of M1 and M2. At the th day and the th country, the number of daily trajectories that satisfy the constraints above is denoted by . In general, for .
For any two consecutive trajectory observations, the geodetic distance between and is computed. The following transformation is then applied:
| 2 |
The transformation implies that the estimated travelled distance between time and is greater than zero only if the 1-sigma uncertainty disks do not overlap. The daily travelled distance by the th smartphone is given by:
| 3 |
where is 1 if timestamp is within day and 0 otherwise (with the timestamp related with midnight of day ). Since is computed using the last trajectory observation of day and the first of day , Eq. (3) implies that any travel occurring across midnight contributes to the total travelled distance on day .
Moreover, let
| 4 |
be a binary variable equal to 1 if the smartphone does not move during the 24 h of the day and 0 otherwise. The threshold 0.2 is set to accommodate for indoor smartphone movements during the day that may sum up to a small distance.
For each country, first-level administrative divisions (regions) are considered. Each region is described in terms of multiple polygons defined in the geographical space. These polygons are freely available for download at diva-gis.org/gdata. The number of first-level administrative divisions by country is given in Table 1.
Table 1.
Number of first-level administrative divisions by country.
| Country | Number of first-level administrative divisions |
|---|---|
| Argentina | 24 |
| Chile | 16 |
| Colombia | 32 |
| Costa Rica | 7 |
| Ecuador | 24 |
| Greece | 8 |
| Guatemala | 22 |
| Italy | 20 |
| Mexico | 32 |
| Nicaragua | 18 |
| Panama | 13 |
| Peru | 26 |
| Philippines | 81 |
| Slovenia | 14 |
| Turkey | 81 |
| United States | 52 |
| Venezuela | 25 |
The daily average travelled distance for the th region of the th country is given by:
| 5 |
where is equal to 1 if the daily average smartphone coordinates are in the region, and 0 otherwise. is the number of daily trajectories in the th region.
Let be the population count of the th region, The daily average distance for the th country (mobility metric M1) is given by
| 6 |
where
| 7 |
is a weight based on the region population. The adoption of this weighting approach is dictated by three reasons: (1) the spatial distribution of smartphone-app users does not necessarily mimic the population distribution; (2) events affecting people mobility may be limited to some regions, or their strength vary across regions47; (3) in general, a weighting approach based on a population stratification helps reduce the bias of estimates48.
By replacing with in Eq. (5) and following the same procedure described above, the mobility metric M2 (i.e., ) is computed for each day and country.
Uncertainty assessment
Uncertainty on daily M1 and M2 figures (i.e., and , respectively) is assessed using a non-parametric bootstrap approach49. At the th bootstrap iteration, , values and , , are sampled with replacements from the observed and values restricted to the th region. Following Eqs. (5)–(7), the resampled values are used to produce the bootstrap sample and the bootstrap sample . Fixing , bootstrap samples are used to compute their empirical distribution. This allows evaluation of bootstrap confidence intervals50 on the and estimates, with equal to 5 in this work.
Temporal smoothing
Temporal smoothing of and time series is based on a -day moving average, with equal to 7, 14, 21 and 28. The smoothed version of is
| 8 |
Similarly, is defined by replacing with in Eq. (8). Confidence intervals on and are based on bootstrap samples which include days of resampled data. This allows obtaining confidence intervals with the correct width.
Comparison with Google’s Community Mobility Reports
Community Mobility Reports by Google gives percentages of variation in the number of visits to place categories with respect to a baseline. The categories are “Retail and recreation”, “Grocery and pharmacy”, “Parks”, “Transit stations”, “Workplaces” and “Residential”. For each category, time series of percentages of variation are available at both country and regional levels with daily temporal resolution.
M1 and M2 time series are compared with Google’s country-level time series by computing linear correlations. M1 is correlated with “Transit stations”, “Parks” and “Retail and recreation” indices while M2 with “Workplaces” and “Residential” indices. Comparison is made using both non-smoothed and smoothed time series (i.e., ). A highly positive or highly negative correlation means that M1 and/or M2 carry information on people mobility similar to that of Google’s community mobility reports.
Robustness analysis
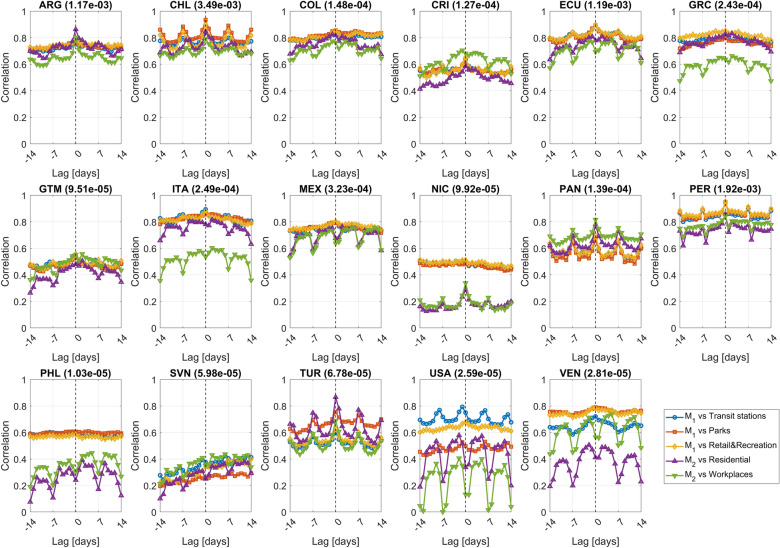
To test robustness of the comparison described in the previous section, a time-shifted correlation analysis is also implemented. Whenever two time series are considered, one time series is shifted by a lag of days and linear correlation is computed. Figure 6 shows results for the 17 countries.
Figure 6.
Time-shifted correlation graphs for correlations computed between the M1 and M2 metrics and the Google’s indices.
For countries with a relatively high average data set penetration (see for instance ARG, CHL and PER), correlations are maximum when and, due to the weekly cycle, they also tend to be high when . When penetration is lower this behaviour is disrupted and the maxima are not necessarily at (or not all of them are at ). TUR is an exception since peaks of the time-shifted correlation graph are located where expected despite the low penetration.
Beta regression on correlations vs average penetration
A beta regression is adopted to describe the relationship between the average data set penetration and the correlations without sign between the non-smoothed M1 and M2 metrics and Google’s indices. Beta regression is imposed by .
For the generic th country, , where is the precision parameter of the beta distribution and , with the logit link function, the vector of regressors and the vector of unknown model parameters. Here, , with the average data set penetration for the th country. Model fitting capability is described by the pseudo coefficient of determination , with the model estimate. An F-test on the regression model is used to tests whether the model fits significantly better than a model with only the constant term (i.e., = 1).
Sensitivity analysis
Estimates of M1 and M2 are based on three arbitrary choices. First, only trajectories with at least observations within a span of at least hours are used (). Second, only if (, see Eq. (2)). Third, if (, see Eq. (4)).
The choice of affects both M1 and M2, while the choice of and only affects M2. Values used in this work are the result of a sensitivity analysis. Considering ITA and the period from March 11, 2020, to September 22, 2022, the correlation without sign between M1 (non-smoothed) and the “Transit stations” index by Google and the correlation without sign between M2 (non-smoothed) and the “Residential” index by Google are estimated for each combination of , and .
Considering all combinations, ranges between 0.878 and 0.893, while ranges between 0.766 and 0.781. Correlations are not significantly affected by large variations in , and . For both and , the maximum is reached when , and .
Author contributions
The author is the sole contributor of the paper.
Data availability
The MobMeter data set which includes the mobility metrics produced in this work is available on Zenodo at https://zenodo.org/record/6984638. Google’s Community Mobility Reports are available at https://www.google.com/covid19/mobility/.
Competing interests
The author declares no competing interests.
Footnotes
Publisher's note
Springer Nature remains neutral with regard to jurisdictional claims in published maps and institutional affiliations.
References
- 1.Chang S, et al. Mobility network models of COVID-19 explain inequities and inform reopening. Nature. 2021;589:1–10. doi: 10.1038/s41586-020-2923-3. [DOI] [PubMed] [Google Scholar]
- 2.Galeazzi A, et al. Human mobility in response to COVID-19 in France, Italy and UK. Sci. Rep. 2021;11:1–10. doi: 10.1038/s41598-021-92399-2. [DOI] [PMC free article] [PubMed] [Google Scholar]
- 3.Gao S, et al. Association of mobile phone location data indications of travel and stay-at-home mandates with COVID-19 infection rates in the US. JAMA Netw. Open. 2020;3:2020485. doi: 10.1001/jamanetworkopen.2020.20485. [DOI] [PMC free article] [PubMed] [Google Scholar]
- 4.Hu T, et al. Human mobility data in the COVID-19 pandemic: Characteristics, applications, and challenges. Int. J. Digit. Earth. 2021;14:1126–1147. doi: 10.1080/17538947.2021.1952324. [DOI] [Google Scholar]
- 5.Lee M, et al. Human mobility trends during the early stage of the COVID-19 pandemic in the United States. PLoS ONE. 2020;15:241468. doi: 10.1371/journal.pone.0241468. [DOI] [PMC free article] [PubMed] [Google Scholar]
- 6.Xiong C, et al. Mobile device location data reveal human mobility response to state-level stay-at-home orders during the COVID-19 pandemic in the USA. J. R. Soc. Interface. 2020;17:173. doi: 10.1098/rsif.2020.0344. [DOI] [PMC free article] [PubMed] [Google Scholar]
- 7.Finazzi F, Fassò A. The impact of the Covid-19 pandemic on Italian mobility. Signif. 2020;17:17. doi: 10.1111/1740-9713.01400. [DOI] [PMC free article] [PubMed] [Google Scholar]
- 8.Jia JS, et al. Population flow drives spatio-temporal distribution of COVID-19 in China. Nature. 2020;582:389–394. doi: 10.1038/s41586-020-2284-y. [DOI] [PubMed] [Google Scholar]
- 9.García-Cremades S, et al. Improving prediction of COVID-19 evolution by fusing epidemiological and mobility data. Sci. Rep. 2021;11:1–16. doi: 10.1038/s41598-021-94696-2. [DOI] [PMC free article] [PubMed] [Google Scholar]
- 10.Gargoum SA, Gargoum AS. Limiting mobility during COVID-19, when and to what level? An international comparative study using change point analysis. J. Transp. Health. 2021;20:101019. doi: 10.1016/j.jth.2021.101019. [DOI] [PMC free article] [PubMed] [Google Scholar]
- 11.Grantz KH, et al. The use of mobile phone data to inform analysis of COVID-19 pandemic epidemiology. Nat. Commun. 2020;11:1–8. doi: 10.1038/s41467-020-18190-5. [DOI] [PMC free article] [PubMed] [Google Scholar]
- 12.Praharaj S, Han H. Human mobility impacts on the surging incidence of COVID-19 in India. Geographical Res. 2022;60:18–28. doi: 10.1111/1745-5871.12502. [DOI] [Google Scholar]
- 13.Wellenius GA, et al. Impacts of social distancing policies on mobility and COVID-19 case growth in the US. Nat. Commun. 2021;12:1–7. doi: 10.1038/s41467-021-23404-5. [DOI] [PMC free article] [PubMed] [Google Scholar]
- 14.Ilin C, et al. Public mobility data enables COVID-19 forecasting and management at local and global scales. Sci. Rep. 2021;11:1–11. doi: 10.1038/s41598-021-92892-8. [DOI] [PMC free article] [PubMed] [Google Scholar]
- 15.Papagiannakis A, Baraklianos I, Spyridonidou A. Urban travel behaviour and household income in times of economic crisis: challenges and perspectives for sustainable mobility. Transp. Policy. 2018;65:51–60. doi: 10.1016/j.tranpol.2016.12.006. [DOI] [Google Scholar]
- 16.Maciejewska M, Marquet O, Miralles-Guasch C. Changes in gendered mobility patterns in the context of the Great Recession (2007–2012) J. Transp. Geogr. 2019;79:102478. doi: 10.1016/j.jtrangeo.2019.102478. [DOI] [Google Scholar]
- 17.Spelta A, Pagnottoni P. Mobility-based real-time economic monitoring amid the COVID-19 pandemic. Sci. Rep. 2021;11:1–15. doi: 10.1038/s41598-021-92134-x. [DOI] [PMC free article] [PubMed] [Google Scholar]
- 18.Tai XH, Mehra S, Blumenstock JE. Mobile phone data reveal the effects of violence on internal displacement in Afghanistan. Nat. Hum. Behav. 2022;6:624–634. doi: 10.1038/s41562-022-01336-4. [DOI] [PMC free article] [PubMed] [Google Scholar]
- 19.Hong B, Bonczak BJ, Gupta A, Kontokosta CE. Measuring inequality in community resilience to natural disasters using large-scale mobility data. Nat. Commun. 2021;12:1–9. doi: 10.1038/s41467-021-22160-w. [DOI] [PMC free article] [PubMed] [Google Scholar]
- 20.Manawadu, L. & Wijeratne, V.P.I.S. Human mobility response to natural disasters and environmental change. in Climate Change, Disaster and Adaptations. 229–242 (Springer, 2022).
- 21.Wang Q, Taylor JE. Quantifying human mobility perturbation and resilience in Hurricane Sandy. PLoS ONE. 2014;9:112608. doi: 10.1371/journal.pone.0112608. [DOI] [PMC free article] [PubMed] [Google Scholar]
- 22.Yamamoto L, Serraglio DA, de Salles Cavedon-Capdeville F. Human mobility in the context of climate change and disasters: A South American approach. Int. J. Clim. Chang. Strateg. Manag. 2018;10:19. [Google Scholar]
- 23.Finazzi F, Paci L. Quantifying personal exposure to air pollution from smartphone-based location data. Biometrics. 2019;75:1356–1366. doi: 10.1111/biom.13100. [DOI] [PubMed] [Google Scholar]
- 24.Birenboim A, Shoval N. Mobility research in the age of the smartphone. Ann. Am. Assoc. Geogr. 2016;106:283–291. [Google Scholar]
- 25.Del Rosario MB, Redmond SJ, Lovell NH. Tracking the evolution of smartphone sensing for monitoring human movement. Sensors. 2015;15:18901–18933. doi: 10.3390/s150818901. [DOI] [PMC free article] [PubMed] [Google Scholar]
- 26.Pérez-Arnal R, et al. Comparative analysis of geolocation information through mobile-devices under different COVID-19 mobility restriction patterns in Spain. ISPRS Int. J. Geogr. Inf. 2021;10:73. doi: 10.3390/ijgi10020073. [DOI] [Google Scholar]
- 27.Kurkcu, A., Ozbay, K. & Morgul, E.F. Evaluating the usability of geo-located twitter as a tool for human activity and mobility patterns: A case study for NYC. in Transportation Research Board’s 95th Annual Meeting. (2016).
- 28.Terroso-Saenz F, Muñoz A, Arcas F, Curado M. An analysis of twitter as a relevant human mobility proxy. GeoInformatica. 2022;26:677–706. doi: 10.1007/s10707-021-00460-z. [DOI] [PMC free article] [PubMed] [Google Scholar]
- 29.Pourebrahim N, Sultana S, Niakanlahiji A, Thill JC. Trip distribution modeling with Twitter data. Comput. Environ. Urban Syst. 2019;77:101354. doi: 10.1016/j.compenvurbsys.2019.101354. [DOI] [Google Scholar]
- 30.Finazzi F, Paci L. Kernel-based estimation of individual location densities from smartphone data. Stat. Model. 2019;20:617–633. doi: 10.1177/1471082X19870331. [DOI] [Google Scholar]
- 31.Cot C, Cacciapaglia G, Sannino F. Mining Google and Apple mobility data: Temporal anatomy for COVID-19 social distancing. Sci. Rep. 2021;11:1–8. doi: 10.1038/s41598-021-83441-4. [DOI] [PMC free article] [PubMed] [Google Scholar]
- 32.Paez A. Using Google community mobility reports to investigate the incidence of COVID-19 in the United States. Transport Findings. 2020;12976:32866. [Google Scholar]
- 33.Ramadhan MS, Syakurah RA. Community mobility reports predict the national spread of COVID-19 in Indonesia in the new normal era. Int. J. Public Health. 2021;10:2. [Google Scholar]
- 34.Sulyok M, Walker M. Community movement and COVID-19: A global study using Google's community mobility reports. Epidemiol. Infect. 2020;2020:148. doi: 10.1017/S0950268820002757. [DOI] [PMC free article] [PubMed] [Google Scholar]
- 35.Zhu D, Mishra SR, Han X, Santo K. Social distancing in Latin America during the COVID-19 pandemic: An analysis using the stringency index and Google Community Mobility Reports. J. Travel Med. 2020;27:125. doi: 10.1093/jtm/taaa125. [DOI] [PMC free article] [PubMed] [Google Scholar]
- 36.Apple Inc. https://covid19.apple.com/mobility.
- 37.Google LLC. https://www.google.com/covid19/mobility/.
- 38.Finazzi F. The earthquake network project: A platform for earthquake early warning, rapid impact assessment, and search and rescue. Front. Earth Sci. 2020;8:243. doi: 10.3389/feart.2020.00243. [DOI] [Google Scholar]
- 39.Bossu R, Finazzi F, Steed R, Fallou L, Bondár I. “Shaking in 5 seconds!”—Performance and user appreciation assessment of the earthquake network smartphone-based public earthquake early warning system. Seismol. Res. Lett. 2022;93:137. doi: 10.1785/0220210180. [DOI] [Google Scholar]
- 40.Finazzi F. The earthquake network project: Toward a crowdsourced smartphone-based earthquake early warning system. Bull. Seismol. Soc. Am. 2016;106:1088. doi: 10.1785/0120150354. [DOI] [Google Scholar]
- 41.Finazzi F, Fassò A. A statistical approach to crowdsourced smartphone-based earthquake early warning systems. Stoch. Environ. Res. Risk Assess. 2017;31:1649. doi: 10.1007/s00477-016-1240-8. [DOI] [Google Scholar]
- 42.Finazzi F. 2022. MobMeter: A global human mobility data set based on smartphone trajectories. Zenodo. [DOI]
- 43.The Associated Press. Ecuador protests take increasingly violent turn in capital. in ABC News. https://abcnews.go.com/International/wireStory/ecuador-protests-increasingly-violent-turn-capital-85544481 (2022).
- 44.The Associated Press. “What Sparked the Biggest Protests in Years in Panama?” Los Angeles Times. https://www.latimes.com/espanol/internacional/articulo/2022-07-19/que-desato-las-mayores-protestas-en-anos-en-panama (2022).
- 45.The Associated Press. “Deaths Amid Flooding and Mudslides as Hurricane Agatha Hits Mexico”. The Guardian. https://www.theguardian.com/world/2022/may/31/hurricane-agatha-mexico-strongest-landfall-may (2022).
- 46.De Montjoye YA, Hidalgo CA, Verleysen M, Blondel VD. Unique in the crowd: The privacy bounds of human mobility. Sci. Rep. 2013;3:1–5. doi: 10.1038/srep01376. [DOI] [PMC free article] [PubMed] [Google Scholar]
- 47.Ren X. Pandemic and lockdown: A territorial approach to COVID-19 in China, Italy and the United States. Eurasian Geogr. Econ. 2020;61:423–434. doi: 10.1080/15387216.2020.1762103. [DOI] [Google Scholar]
- 48.DuMouchel WH, Duncan GJ. Using sample survey weights in multiple regression analyses of stratified samples. J. Am. Stat. Assoc. 1983;78:535–543. doi: 10.1080/01621459.1983.10478006. [DOI] [Google Scholar]
- 49.Efron B, Tibshirani RJ. An Introduction to the Bootstrap. CRC Press; 1994. [Google Scholar]
- 50.DiCiccio TJ, Efron B. Bootstrap confidence intervals. Stat. Sci. 1996;11:189–228. doi: 10.1214/ss/1032280214. [DOI] [Google Scholar]
Associated Data
This section collects any data citations, data availability statements, or supplementary materials included in this article.
Data Citations
- Finazzi F. 2022. MobMeter: A global human mobility data set based on smartphone trajectories. Zenodo. [DOI]
Data Availability Statement
The MobMeter data set which includes the mobility metrics produced in this work is available on Zenodo at https://zenodo.org/record/6984638. Google’s Community Mobility Reports are available at https://www.google.com/covid19/mobility/.


