Abstract
Four-dimensional flow magnetic resonance imaging (i.e., 4D flow MRI) has become a valuable tool for the in vivo assessment of blood flow within large vessels and cardiac chambers. As wall shear stress (WSS) has been correlated with the development and progression of cardiovascular disease, focus has been directed at developing techniques to quantify WSS directly from 4D flow MRI data. The goal of this study was to compare the accuracy of two such techniques – termed the velocity and flow-based methods – in the setting of simplified and complex flow scenarios. Synthetic MR data were created from exact solutions to the Navier-Stokes equations for the steady and pulsatile flow of an incompressible, Newtonian fluid through a rigid cylinder. In addition, synthetic MR data were created from the predicted velocity fields derived from a fluid-structure interaction (FSI) model of pulsatile flow through a thick-walled, multi-layered model of the carotid bifurcation. Compared to the analytical solutions for steady and pulsatile flow, the flow-based method demonstrated greater accuracy than the velocity-based method in calculating WSS across all changes in fluid velocity/flow rate, tube radius, and image signal-to-noise (p<0.001). Furthermore, the velocity-based method was more sensitive to boundary segmentation than the flow-based method. When compared to results from the FSI model, the flow-based method demonstrated greater accuracy than the velocity-based method with average differences in time-averaged WSS of 0.31 ± 1.03 Pa and 0.45 ± 1.03 Pa, respectively (p<0.005). These results have implications on the utility, accuracy, and clinical translational of methods to determine WSS from 4D flow MRI.
Keywords: biomechanics, cardiac MRI, fluid-structure interaction, hemodynamics, phase-contrast magnetic resonance imaging
1. Introduction
Four-dimensional flow magnetic resonance imaging (i.e., 4D flow MRI) is a non-invasive, nonionizing radiation-based imaging modality that permits the interrogation of the in vivo hemodynamic environment (Markl, M., et al., 2007; Soulat, G., et al., 2020). The acquired volumetric data, which includes time-resolved 3D phase-contrast MRI with three-directional velocity encoding, allows examination of kinematic quantities of the flowing blood within the heart and large vessels. Importantly, 4D flow MRI has been applied in the clinical setting as a diagnostic tool to evaluate and quantify complex flow patterns in the setting of several cardiovascular pathologies (Eriksson, J., et al., 2013; François, CJ., et al., 2012; Garcia, J., et al., 2017; Roldán-Alzate, A., et al., 2013). While technical advances continue to extend the capabilities of 4D flow MRI, establishing accurate clinically relevant measurements warrants continued investigation to realize its full potential.
Since seminal works demonstrated the correlative role of wall shear stress (WSS) in the development of atherosclerotic lesions, there has been interest in establishing technologies to quantify WSS in vivo and advance the prognostic strategies for treating cardiovascular disease (Caro, CG., et al., 1969; Friedman, MH., et al., 1981; Zarins, CK., et al., 1983). In contrast to computationally-expensive modeling approaches (Marsden, AL., et al., 2015; Taylor, CA., et al., 2009), methods have been established to quantify WSS directly from 4D flow MRI data. The most common approach determines the spatial gradient in 4D flow-derived velocities at the wall and multiplies this value by the fluid dynamic viscosity (Stalder, AF., et al., 2008). Herein termed the velocity-based method, this approach has been applied to examine WSS in the setting of valvular disease, pulmonary hypertension, and intracranial aneurysms (Barker, AJ., et al., 2012, 2014; Schnell, S., et al., 2014; Gilles, S., et al., 2022). A recent approach utilizes 2D phase-contrast MR (PCMR)-derived volumetric flow waveforms and the Womersley solution to calculate WSS (Iffrig, E., et al., 2022). Herein termed the flow-based method, this approach has demonstrated sex differences in WSS patterns in the abdominal aorta. While some validation has been performed on each method, neither approach has undergone extensive examination to assess accuracy in WSS calculations across a range of simplified and complex fluid kinematic environments. Furthermore, there has been no comparative study between the two methods.
Thus, the purpose of this study was threefold. First, we sought to extend the flow-based method to calculate WSS from 4D flow MRI data. Second, we aimed to examine the accuracy of the velocity and flow-based methods to calculate WSS against analytical solutions of the Navier-Stokes equations. Third, we aimed to evaluate the accuracy of each method against WSS values predicted from an image-based fluid-structure interaction (FSI) model of pulsatile flow in the carotid bifurcation. Due to the limited resolution of MRI to capture near-wall fluid velocities, we hypothesized that the flow-based method would provide a more accurate calculation of WSS than the velocity-based method and be less sensitive to image noise and boundary segmentation.
2. Methods
2.1. Creation of Synthetic 4D Flow MRI Data
To provide ground-truth values of WSS for comparison to values derived from the velocity and flow-based techniques, synthetic image data were generated from exact solutions to the Navier-Stokes equations for the steady (Poiseuille flow) and unsteady (Womersley solution) flow of an incompressible, Newtonian fluid through a rigid cylinder (Fig. 1; Nichols, WW., et al., 2011). The flow was assumed fully developed, with a prescribed fluid dynamic viscosity of 3.5e-3 Pa·s. To evaluate the robustness of the techniques, variations in tube radius (2.4–4.2 mm), maximum velocities (0.1–100 cm/s), and image signal-to-noise ratio (SNR; 20–80) were examined, with ranges derived from carotid artery anatomy and physiology and clinical cMRI acquisition. Further, variations in the number of sectors, which are partial areas within the cross-section of interest where WSS is spatially averaged, were examined. For the steady flow solution, the inlet velocity ranged from (0.1–100 cm/s), whereas for the unsteady (pulsatile) solution, the inlet flow waveform was scaled (0.5–2.0 ×). Steady and unsteady WSS values (τw) were calculated as,
| (1) |
and
| (2) |
respectively, where μ is the dynamic viscosity, Q is the volumetric flow rate, r is the tube radius, n is the (Fourier) harmonic, is Fourier coefficient for the decomposed pressure gradient, α is the Womersley number, i is the imaginary number, ρ is the density, ω is the frequency, and J0 and J1 are Bessel functions of the first-kind for orders 0 and 1, respectively.
Fig. 1.
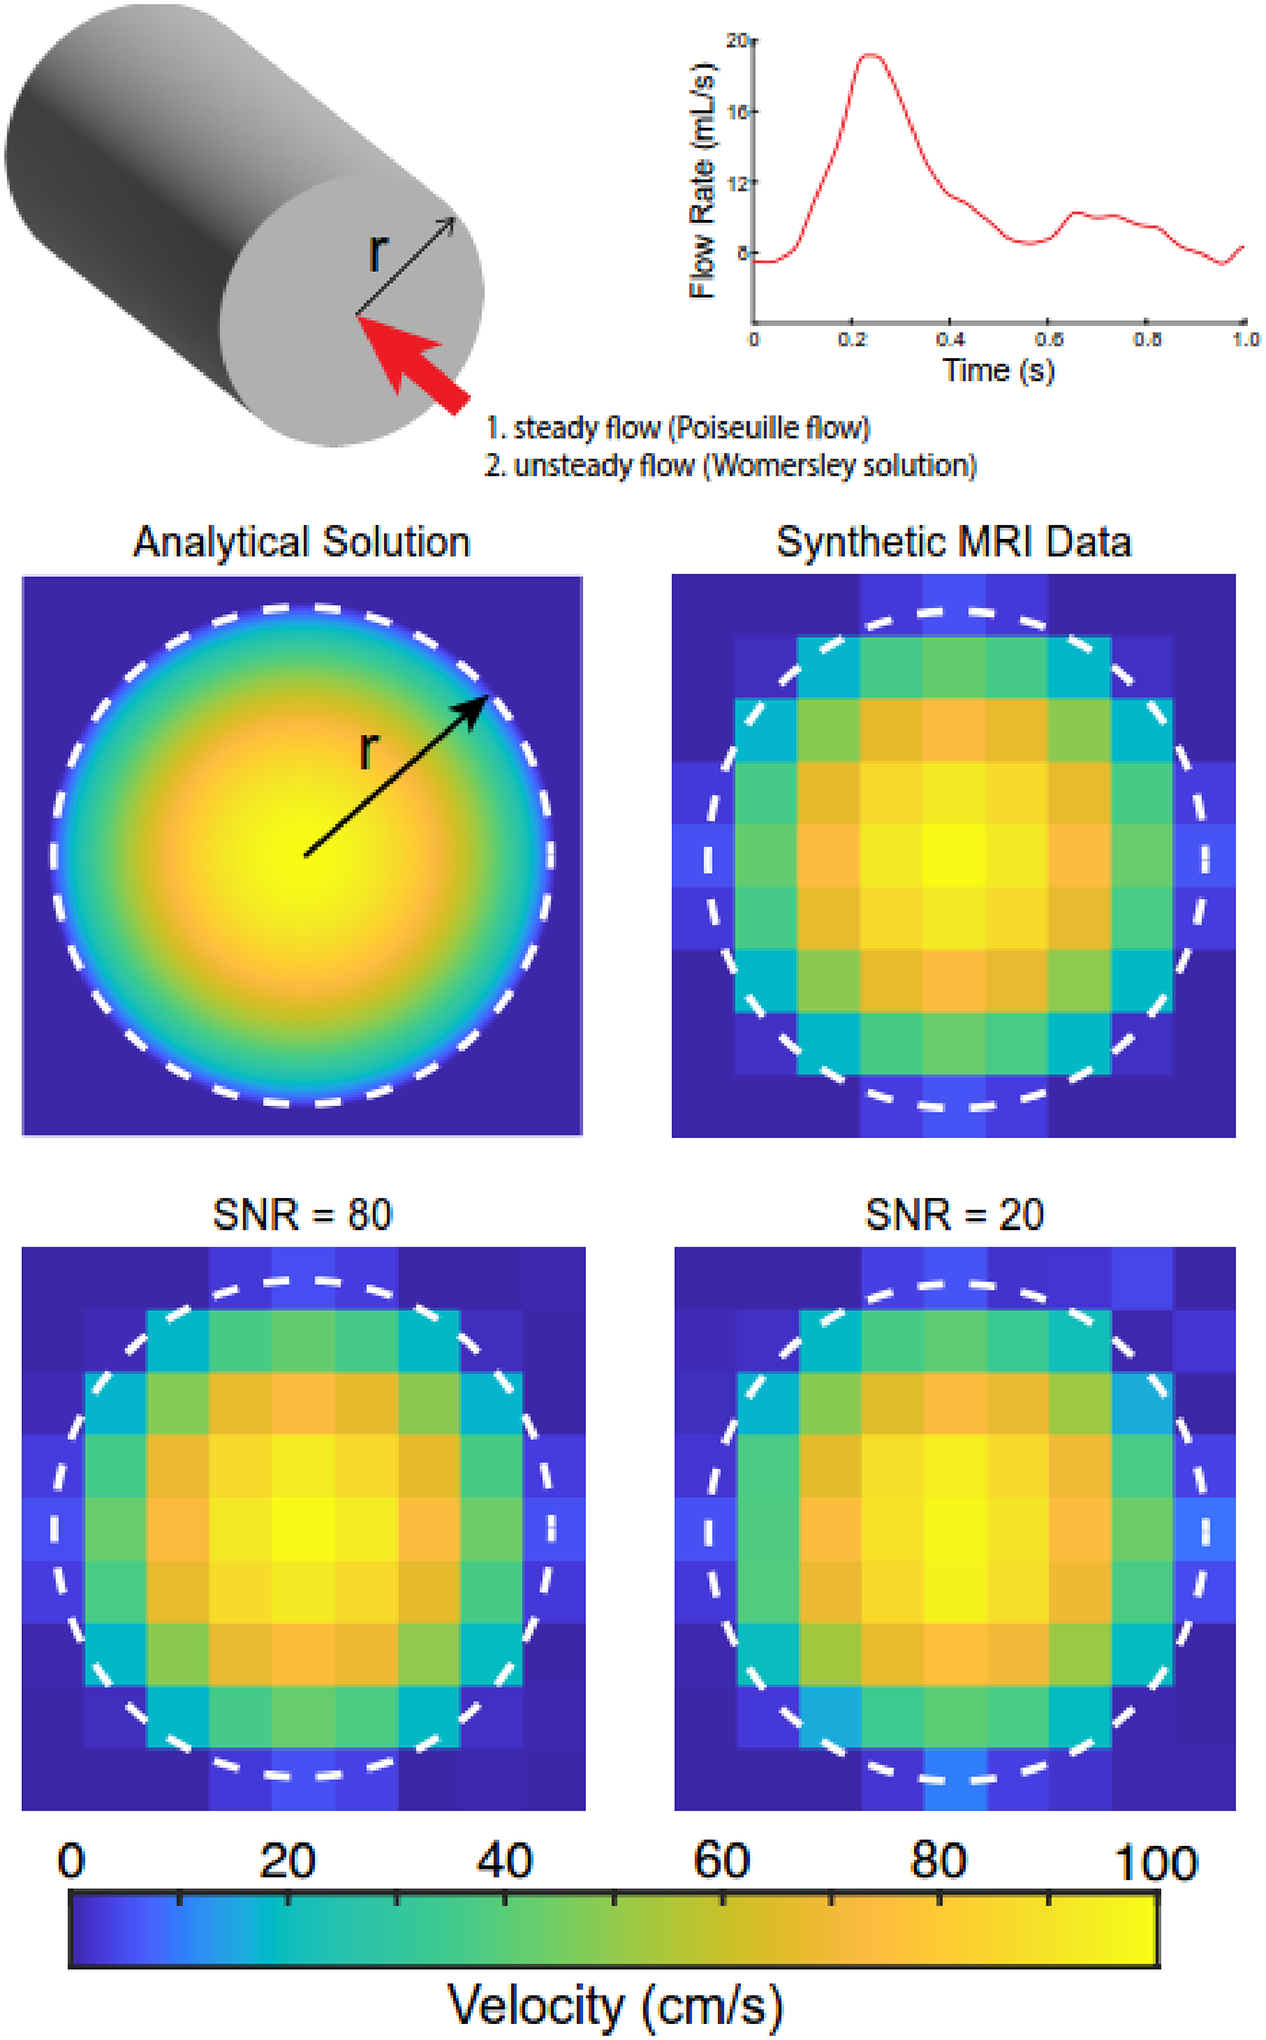
Analytical solutions derived from evaluating fully-developed steady and unsteady (i.e., pulsatile) flows in cylindrical vessels with radius (r). The pulsatile waveform was r representative of flow in the common carotid artery. Synthetic magnetic resonance imaging (MRI) data were generated by resampling the fully-developed velocity profiles (i.e., parabolic profiles) to an isotropic in-plane resolution of 1.2 mm. Synthetic MRI data were modified to account for variations in the signal-to-noise ratio (SNR). The white dotted line indicates the cylinder boundary.
Synthetic MRI data were created at an isotropic in-plane resolution of 1.2 mm for the velocity profiles under steady and unsteady (30-time points) flow conditions (Fig. 1). This resolution is consistent with clinical 4D flow MRI scans of the carotid bifurcation (Hurd, ER., et al., 2022). Images were generated by averaging velocity values within each pixel. Noise was added to image data by including fluctuations of background intensity with varying levels of deviation from a mean value of 0 to create the desired SNR. The noise was distributed randomly throughout the image before data analysis, and 100 iterations were evaluated to assess error distribution across this random variable.
2.2. Velocity and Flow-based Methods to Calculate WSS from 4D Flow MRI Data
Synthetic MRI data were processed using the velocity and flow-based methods to calculate WSS by reproducing previously established methods (Fig. 2). The velocity-based method takes the product of the identified velocity gradient at the wall and the viscosity to calculate WSS (Stalder, AF., et al., 2008). Synthetic image data were resampled using 2D nearest-neighbor interpolation. The resampled resolution had an isotropic resolution of 0.6 mm, which was 50% smaller than the pixel size in the original image. At 256 equally spaced points around the boundary circumference, a cubic B-spline was fit to discrete velocity values defined on a line extending across the resampled velocity profile, passing through the boundary centroid, and enforcing a zero velocity at the wall. WSS was calculated by multiplying the derivative of the B-spline with respect to the radial direction (i.e., velocity gradient) by the fluid dynamic viscosity. Finally, WSS values were spatially averaged within 12 sectors, each defined by a central angle of 30°.
Fig. 2.
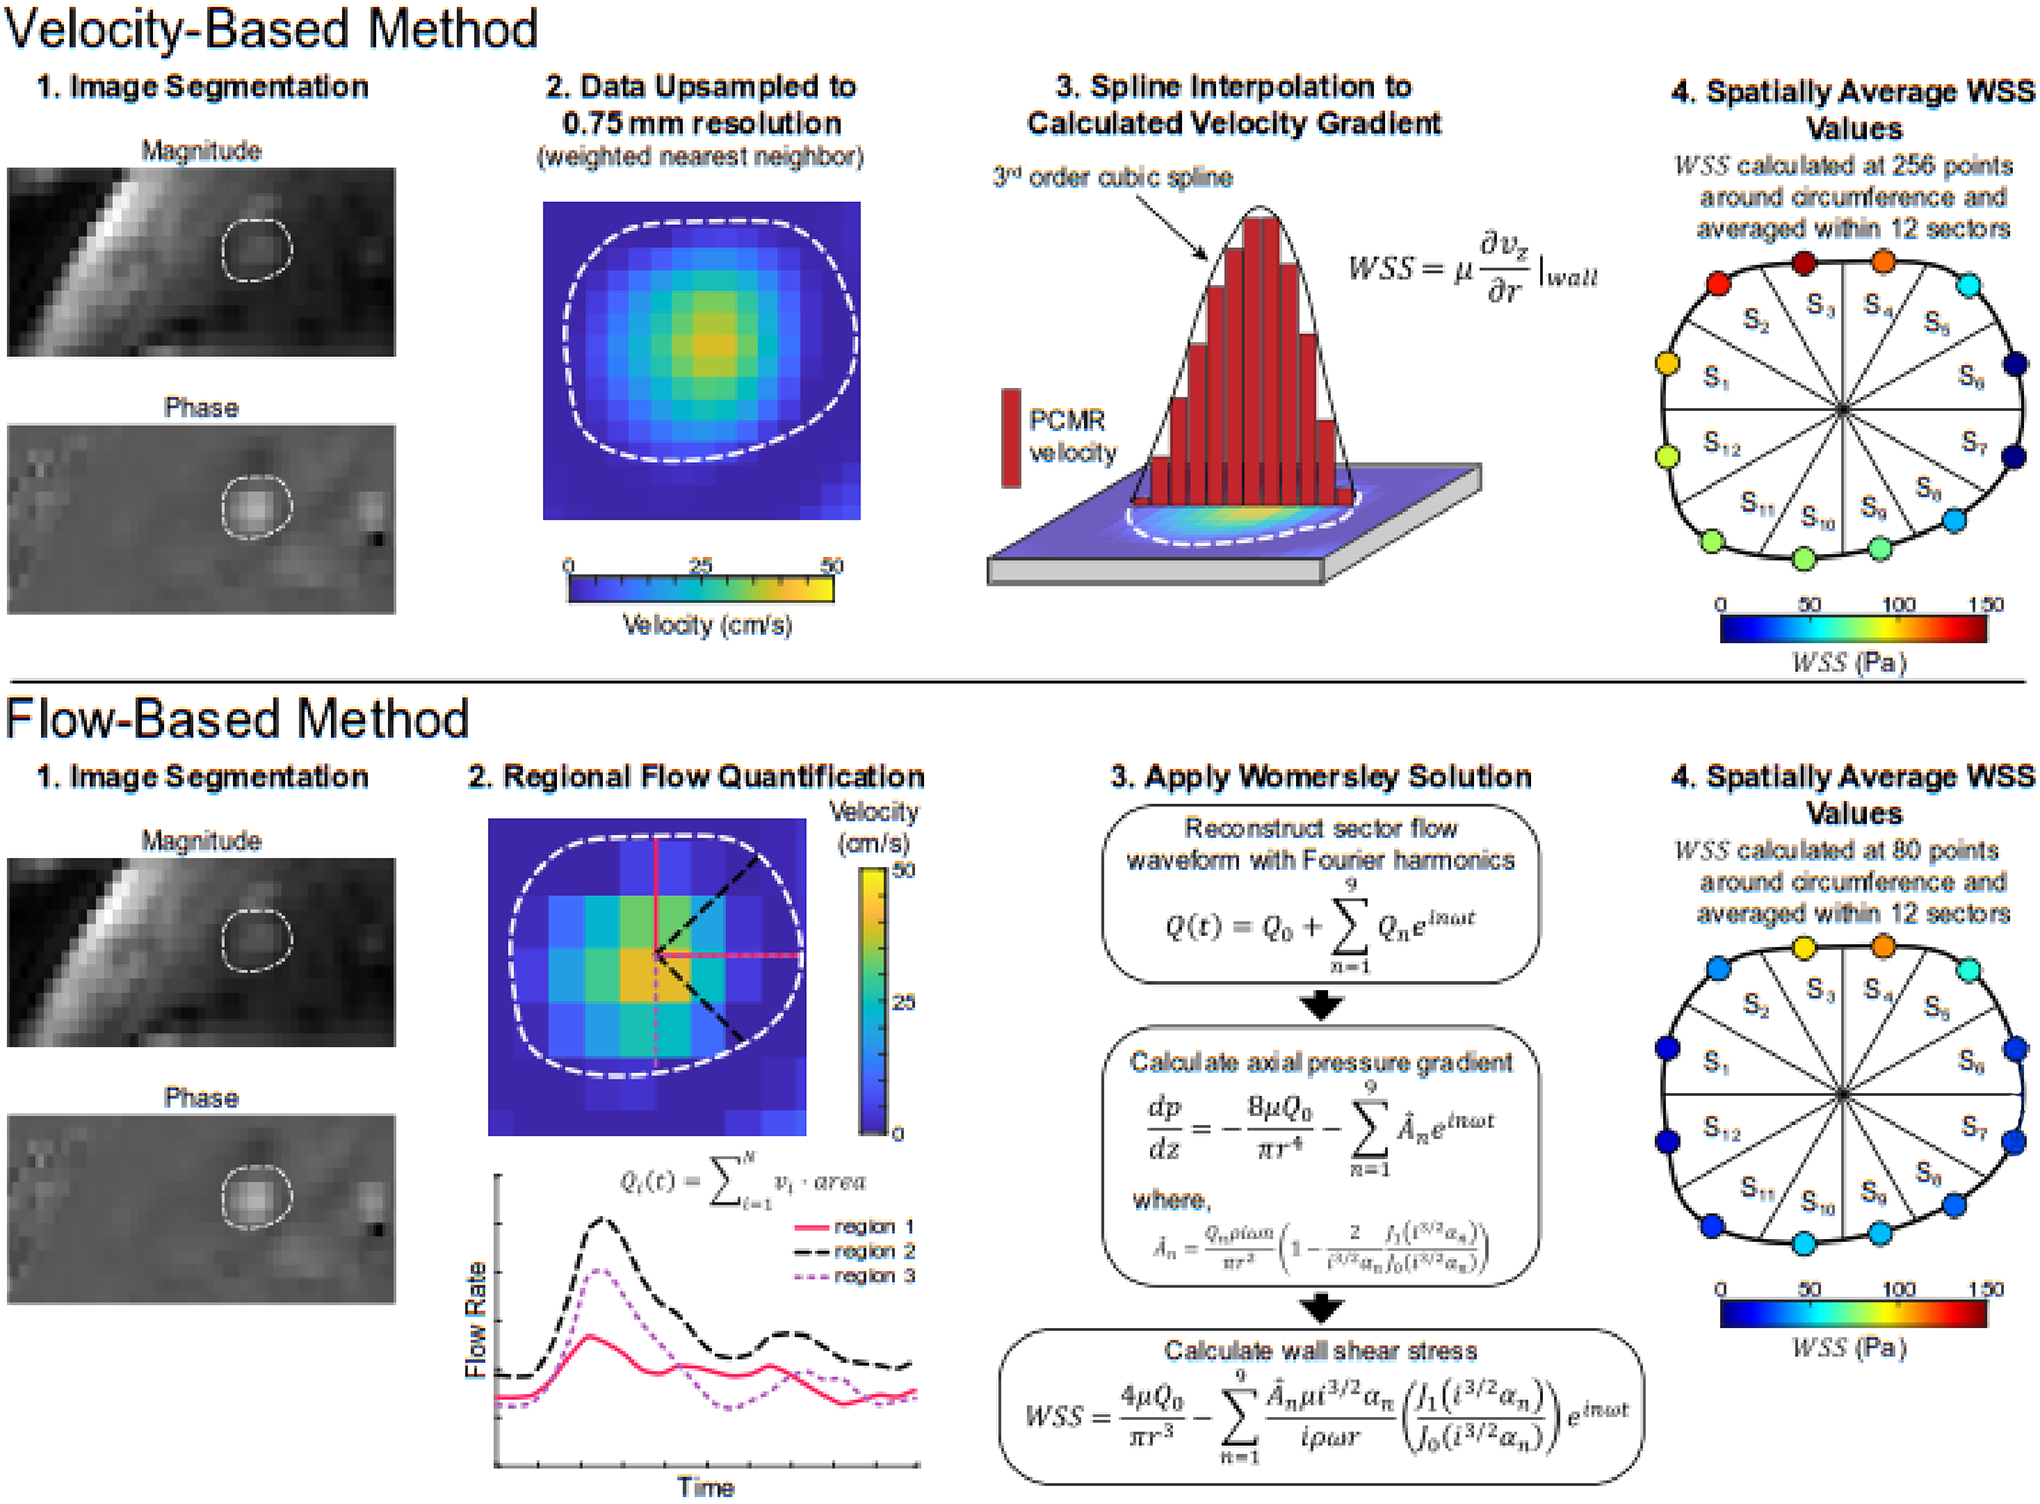
Illustrative diagram of processing frameworks for the velocity-based (Stalder, AF., et al., 2008) and flow-based (Iffrig, E., et al., 2022) methods to quantify the rz-component of the wall shear stress (WSS) vector from 4D flow MRI data. For the velocity-based method (top row), segmented image data are resampled, and a cubic B-spline is fit to phase-contrast MR (PCMR) derived velocity values across the full diameter at varying circumferential positions. WSS values are calculated at 256 circumferential positions and averaged within 12 sectors. The flow-based method (bottom row) quantifies regional through-plane flow waveforms in overlapping areas defined by rays originating at the lumen centroid with a central angle of 90°. The Womersley solution was applied to quantify WSS in 80 overlapping areas around the vessel circumference, and values were averaged within 12 sectors.
The flow-based method applies the Womersley solution to PCMR-derived flow waveforms within the vessel cross-section to calculate WSS (Iffrig, E., et al., 2022). Synthetic image data were divided into 80 overlapping regions, each defined by a central angle of 90° originating at the boundary centroid. For each region, a unique flow waveform was determined by summing the product of through-plane velocity (i.e., axial velocity component; vz) and area for each pixel within the region. A pixel was included in the region if >50% of its area fell within the region. Flow waveforms were decomposed via a Fourier series and reconstructed with the first 10 harmonics. WSS values were calculated via the Womersley solution (He, X., et al., 1993), resulting in 80 values of WSS around the boundary circumference. It should be highlighted that sensitivity analysis has been previously performed on the sector central angle (90°) and number (80) and demonstrated that these values are sufficient to capture the localized hemodynamic from PCMR image data (Iffrig, E., et al., 2022). To allow direct comparison with the velocity-based method, values were spatially averaged within 12 sectors.
2.3. Fluid-Structure Interaction Computational Model
To evaluate each method’s accuracy in a complex flow field, WSS values calculated by the velocity and flow-based methods were compared to numerical predictions from an FSI model of the pulsatile flow of a Newtonian fluid in an anatomic, thick-walled, multi-layered model of the carotid bifurcation. The model was obtained from the model repository in the FEBio software suite (Maas, SA., et al., 2012, 2017). Extensive details on implementing the FSI solver in the open-source finite element code FEBio have been reported (Shim, JJ., et al., 2019). In brief, the FSI formulation is based on mixture theory, whereby the computational domain is described as a mixture of solid and fluid constituents, each with unique motions. Coupling between the fluid and solid domains is achieved by prescribing a traction boundary condition, termed fluid-FSI traction, at the fluid-solid interface to ensure domain deformations are continuous at the interface. The arterial wall consisted of a medial and adventitial layer, each with distinct material properties described by a microstructurally-motived strain energy function (i.e., fiber-reinforced composite; Holzapfel, GA., et al., 2000; Sommer, G., et al., 2012; Fig. 3). The artery was embedded in a rectangular block that was modeled as a compressible Neo-Hookean solid. Boundary conditions included: pulsatile inlet velocity with a parabolic spatial profile, time-varying physiological pressure at the outlets, no-slip at the wall, fluid-FSI traction at the fluid-solid interface, welded contact at the fluid-media and media-adventitia interfaces, and tied contact at the adventitia-compressible solid interface. The walls of the rectangular block were fixed in space to prevent rigid body motion. The model was set to run for three cardiac cycles with 300 time-steps per cycle (Δt=2.9 ms). At the model inlet, the Reynolds number ranged from 300–900, and the Womersley number was approximately 4. Mesh independence was confirmed by increasing the mesh density in both the fluid and solid domains by approximately 50% until changes in predicted axial velocity components (vz) between successive mesh densities were <3%. The final number of elements for the fluid and solid domains were ~164,000 and ~31,000, respectively, with average element lengths of 0.4 and 0.5 mm, respectively.
Fig. 3.
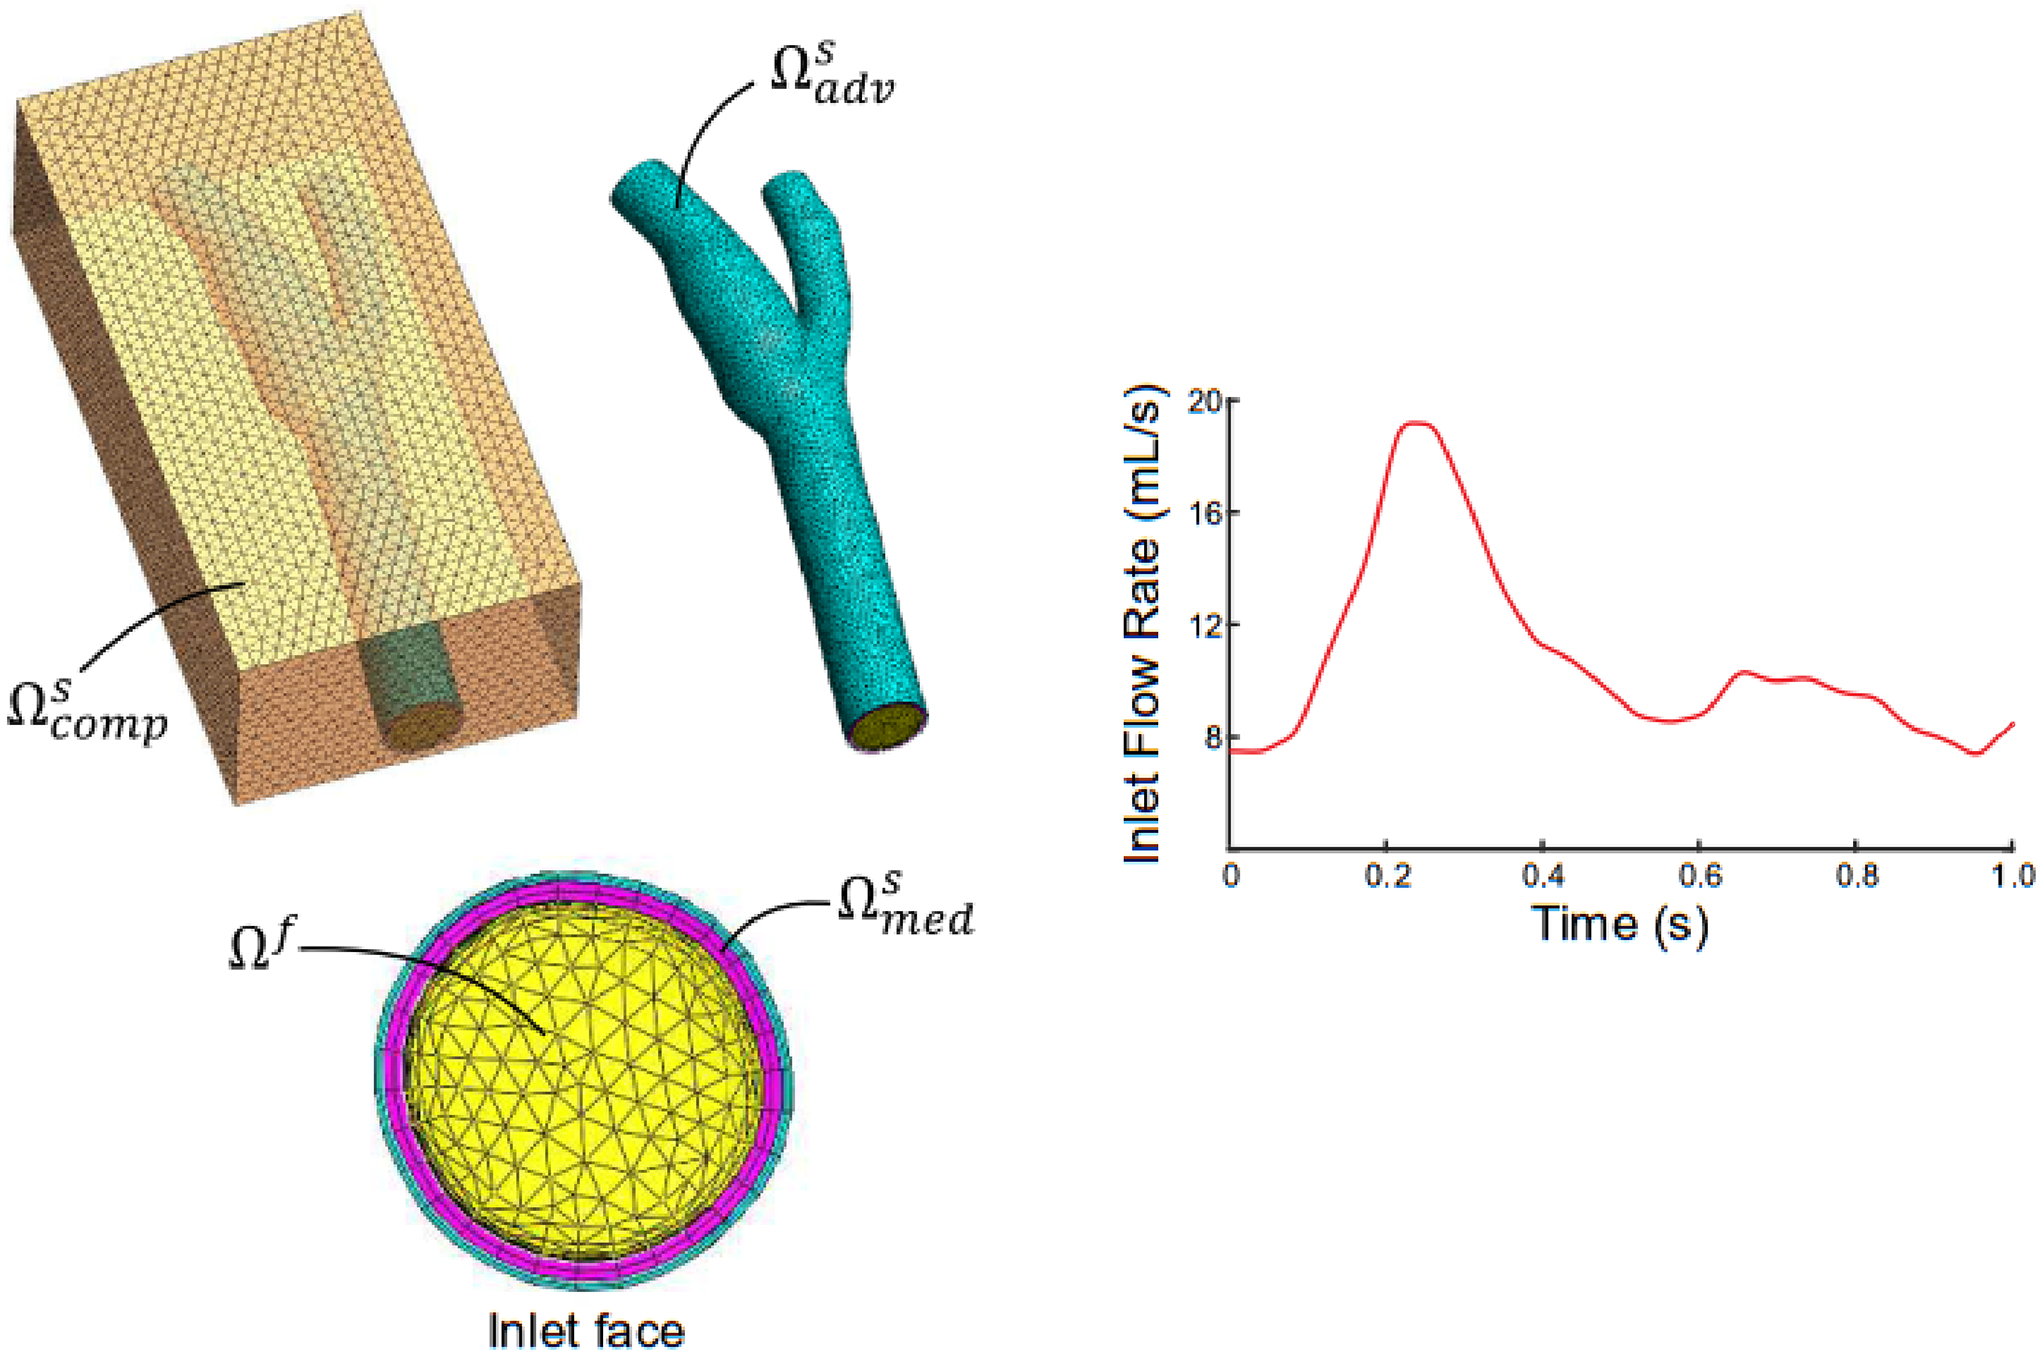
Fluid-structure interaction computational model of a carotid bifurcation embedded in a compressible solid (transparent orange; ). The arterial wall consisted of medial (magenta; ) and adventitial (cyan; ) layers, and the medial layer interfaced with the fluid (yellow; Ωf). A pulsatile carotid flow waveform was prescribed at the fluid inlet and physiological fluid pressures were prescribed at model outlets.
Following solution convergence, vz data were extracted at planes perpendicular to the centerline in the common, internal, and external carotid arteries (CCA, ICA, and ECA, respectively). Data were collected at 30 equally spaced time points in the last cardiac cycle of the simulation. As the computational mesh was radially-biased to have a higher mesh density at the fluid-solid interface, velocity values were resampled on a uniform grid at a resolution of 1.1 mm. Synthetic MRI data were created from these velocity profiles utilizing the methods described in Section 2.1. The velocity and flow-based methods were applied to the synthetic data to calculate WSS. In addition, WSS values from the FSI model were obtained at the same spatial and temporal positions.
2.4. Statistical Analysis
The two-tailed paired Student’s t-test was used to compare errors in WSS values derived from the velocity and flow-based methods compared to values from the analytical solutions. For the FSI model, Bland-Altman analysis (Bland, JM., et al., 1986) and calculation of the concordance correlation coefficient (CCC; Lin, LI-K., 1989) were performed to assess agreement. In addition, an unpaired one-way ANOVA with Tukey post-hoc analysis for pairwise comparisons was performed. Significance was defined as p ≤ 0.05. Statistical analyses were performed using Prism 9 (GraphPad Software, Inc.).
3. Results
3.1. Steady Flow
Data from the steady flow examples demonstrated that the flow-based method had greater accuracy than the velocity-based method in calculating WSS across changes in fluid velocity, tube radius, and image SNR (Fig. 4a–c). That is to say, the flow-based method had significantly lower errors than the velocity-based method when compared to values derived from the analytical solution (p<0.001 for all comparisons). For example, the flow-based method resulted in significantly lower errors in WSS than the velocity-based method when compared to the analytical solution for all variations in maximum fluid velocity (p<0.001; Fig. 4a). WSS values calculated with the flow and velocity-based methods differed by approximately 6% and 19%, respectively, from the analytical solution (note velocity and WSS scale linearly). The same trend in WSS accuracy was held when evaluating changes in tube radius (Fig. 4b). Across the radii values investigated, WSS values derived from the flow-based method differed by approximately 3% from the analytical solution values, whereas values from the velocity-based differed by approximately 16%. While neither technique was sensitive to changes in image SNR, the addition of noise had a greater impact on the velocity-based method (19% difference from analytical value) than the flow-based method (6%). In addition, WSS values calculated with either method were not sensitive to the number of sectors (Fig. 4d). Aside from the WSS data on changes in tube radius, the velocity-based method always had larger standard deviations in calculated WSS values than the flow-based method.
Fig. 4.
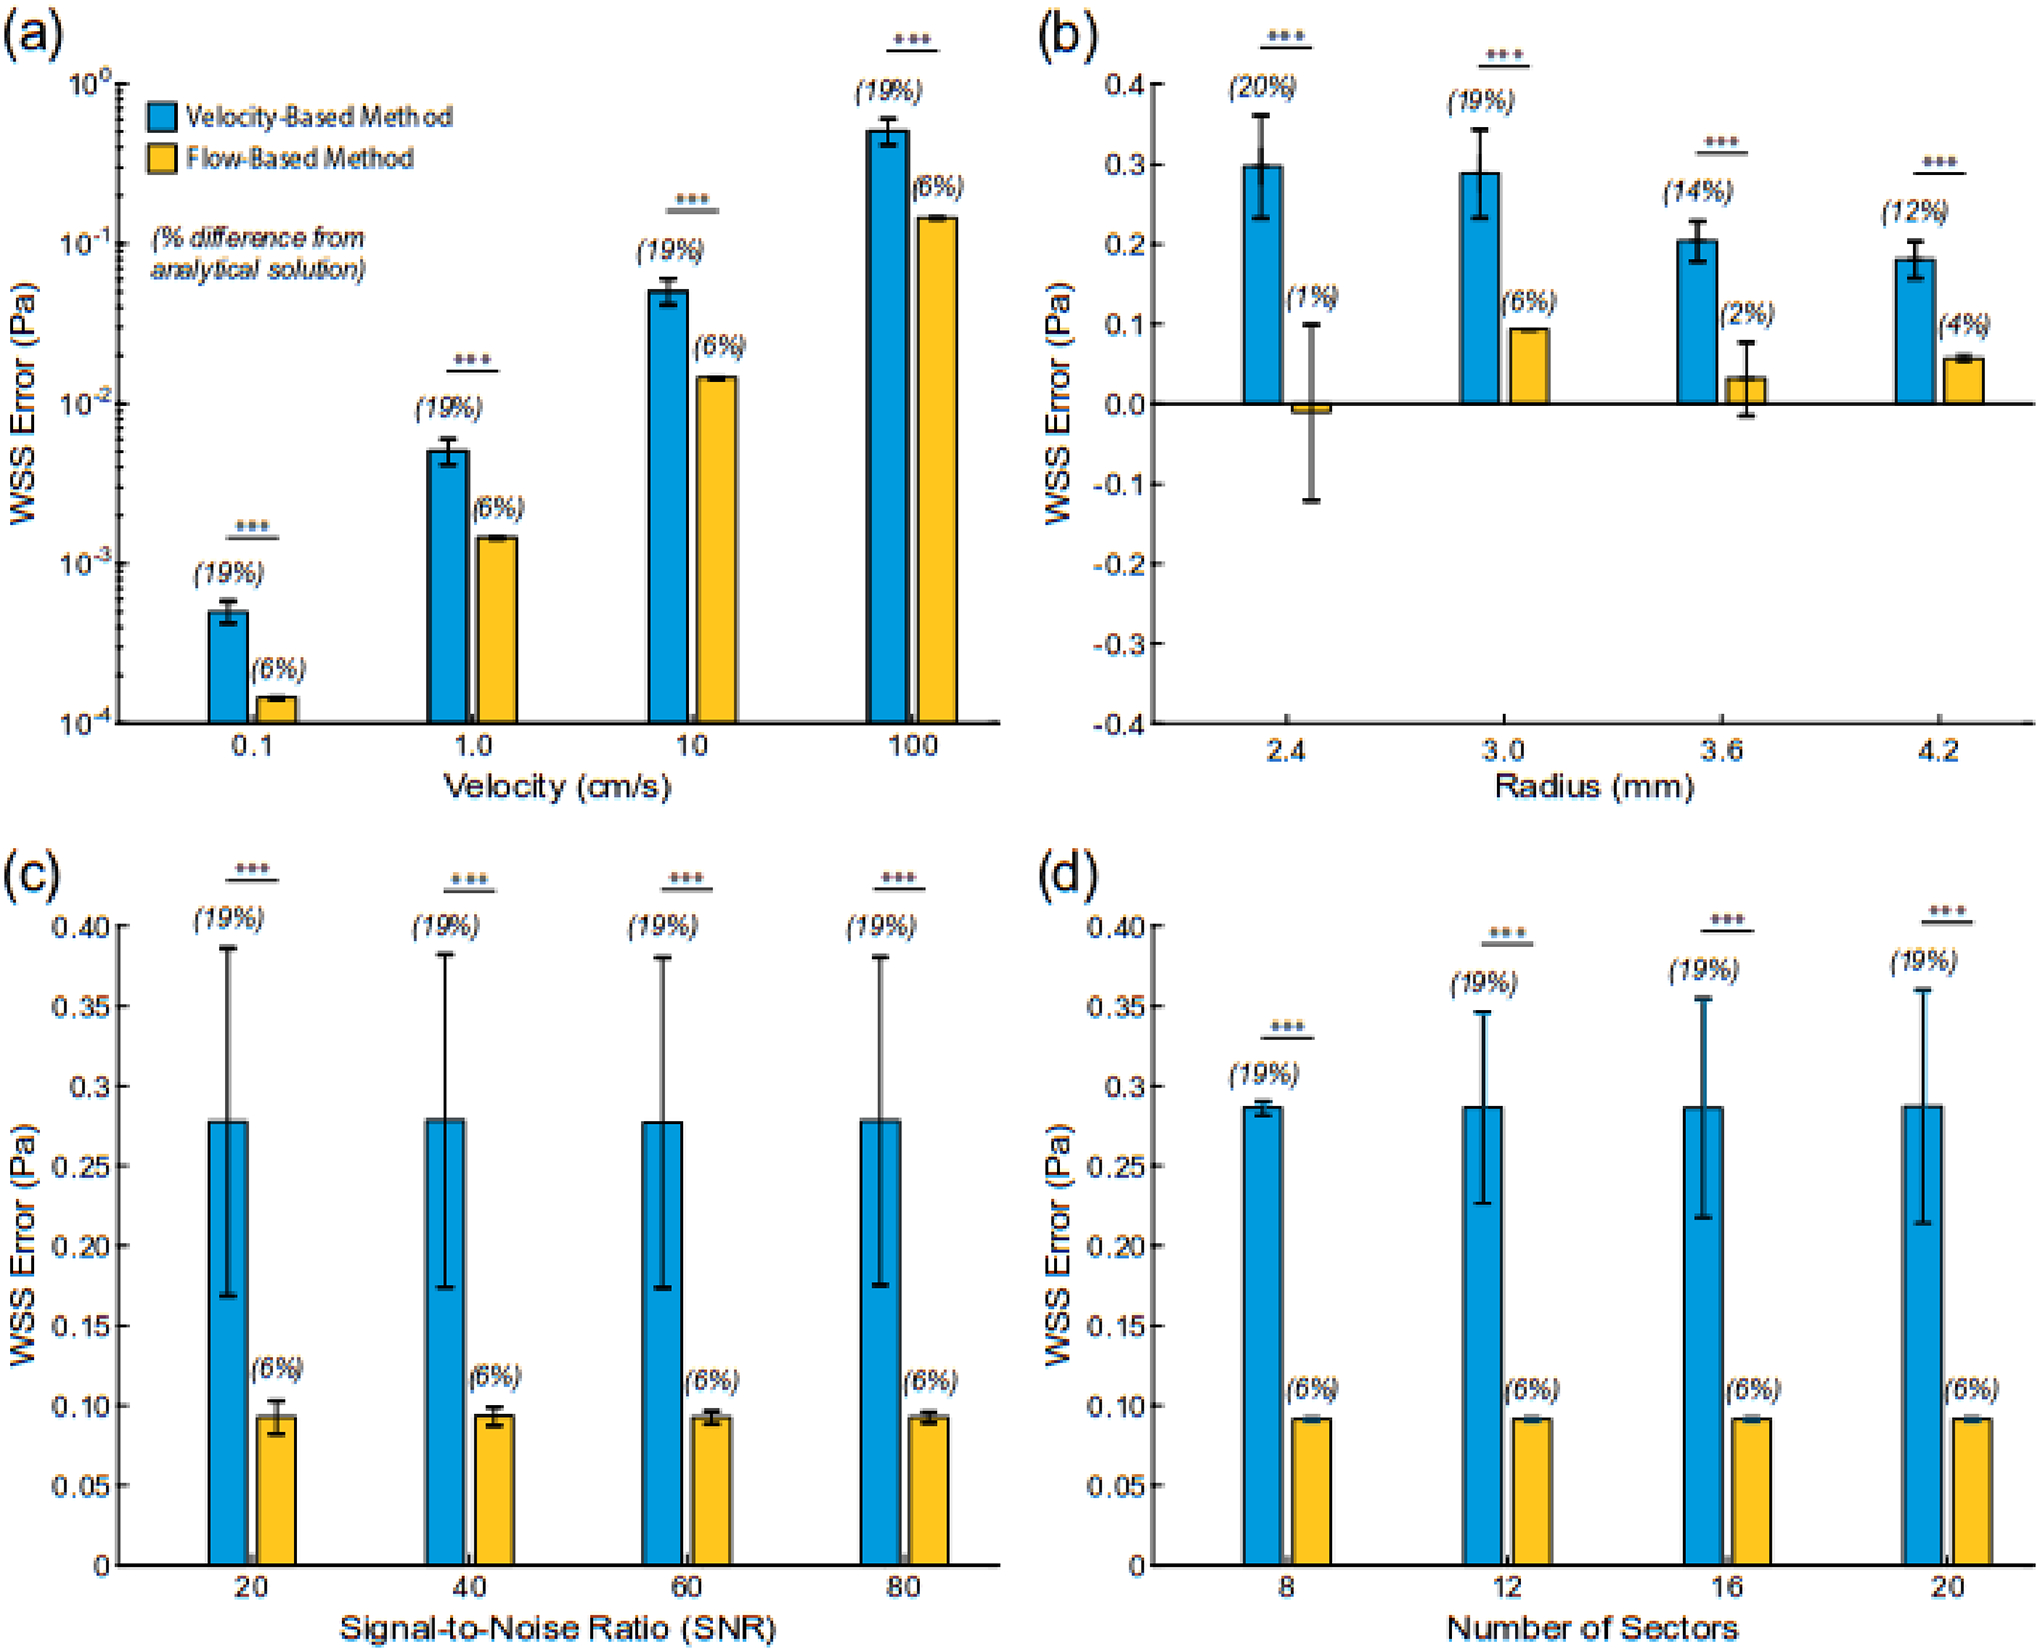
Differences in wall shear stress values (WSS) derived from the analytical solution (WSSanalyt) and velocity or flow-based method under steady flow conditions in a cylindrical vessel (i.e., Poiseuille flow). Changes in (a) peak velocity (r = 3 mm), (b) radius (WSSanalyt = 1.5 Pa), (c) signal-to-noise ratio (r = 3 mm, WSSanalyt = 1.5 Pa), and (d) number of circumferential sectors (r = 3 mm, WSSanalyt = 1.5 Pa). *** indicates p< 0.001.
Results demonstrated that the velocity-based method had greater sensitivity to the defined location of the wall boundary than the flow-based method. At a tube radius of 3.0 mm and a steady and peak velocity of 0.64 cm/s (WSSanalytical=1.5 Pa), adjusting the radius by ± 20% resulted in WSS error values of ~75% for the velocity-based method when compared to the analytical solution (Fig. 5). Across all modifications of the boundary location, the flow-based method had a more accurate calculation of WSS. Furthermore, the flow-based method had nearly 50% less error than the velocity-based method when radii values were increased. These same trends in WSS sensitivity to boundary location were observed for the velocity and flow-based methods across variations in tube radius (2.4–4.2 mm).
Fig. 5.
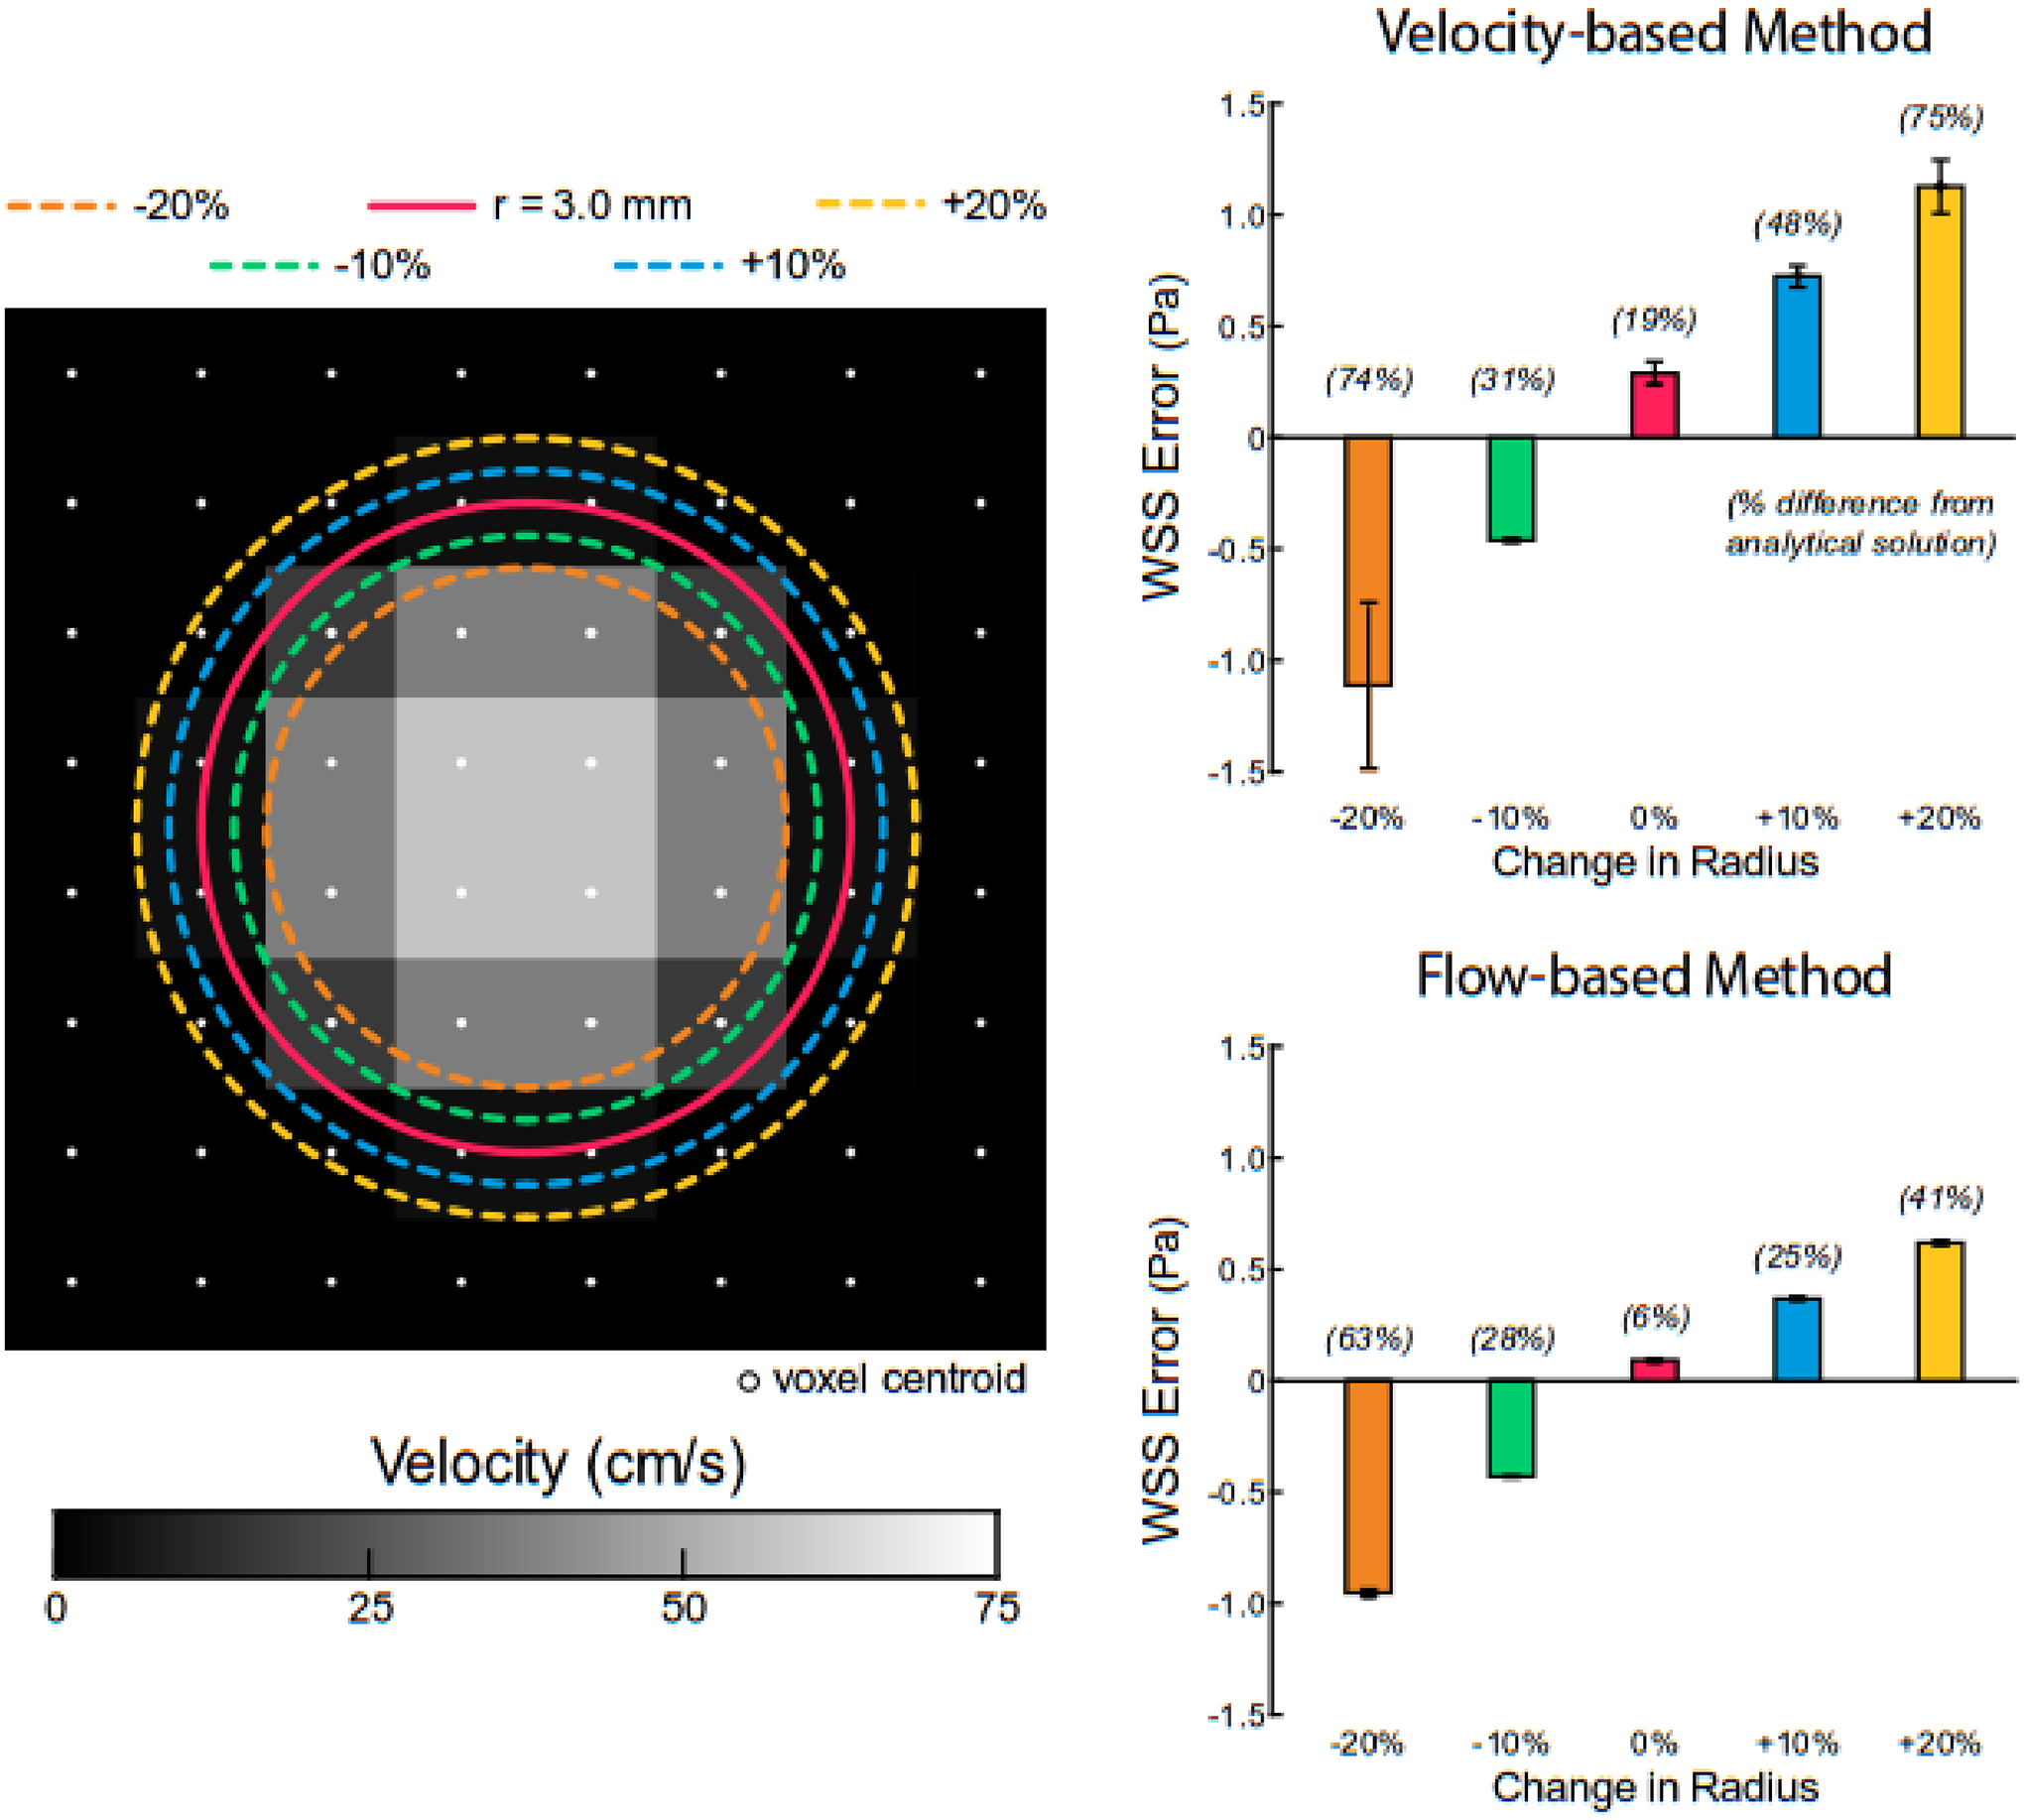
Sensitivity of velocity and flow-based methods to defined wall boundary under steady flow conditions (WSSanalyt = 1.5 Pa). Error was defined as the difference between the analytical solution and velocity or flow-based method. The true tube radius is 3.0 mm (solid red line).
3.2. Pulsatile Flow
Whether examining time-averaged or peak WSS, the flow-based method always had significantly lower absolute error than the velocity-based method when compared to values derived from the analytical solution for pulsatile flow (p<0.001 for all comparisons; Fig. 6). Furthermore, variations in tube radius and scaled mean flow rate resulted in identical trends observed in the steady flow cases. For example, the percent error in calculated time-averaged WSS values with the velocity-based method increased from 11% to 19% with a reduction in tube radius (4.2 to 2.4 mm), however, the error only ranged from 4% to 14% with the flow-based method (Fig. 6a). Notably, the percent errors in calculated peak WSS values were >2 × larger with the velocity-based method than the flow-based technique and always >20%, as compared to values from the Womersley solution (Fig. 6b). Finally, time-averaged and peak WSS values derived from the flow-based method across a range of scaled flow rates resulted in errors of 7% and 11%, respectively, whereas errors using the velocity-based approached were 19% and 27%, respectively (Fig. 6c,d). Similar to results from the steady flow cases, the velocity-based method always had larger standard deviations in calculated WSS values than the flow-based method.
Fig. 6.
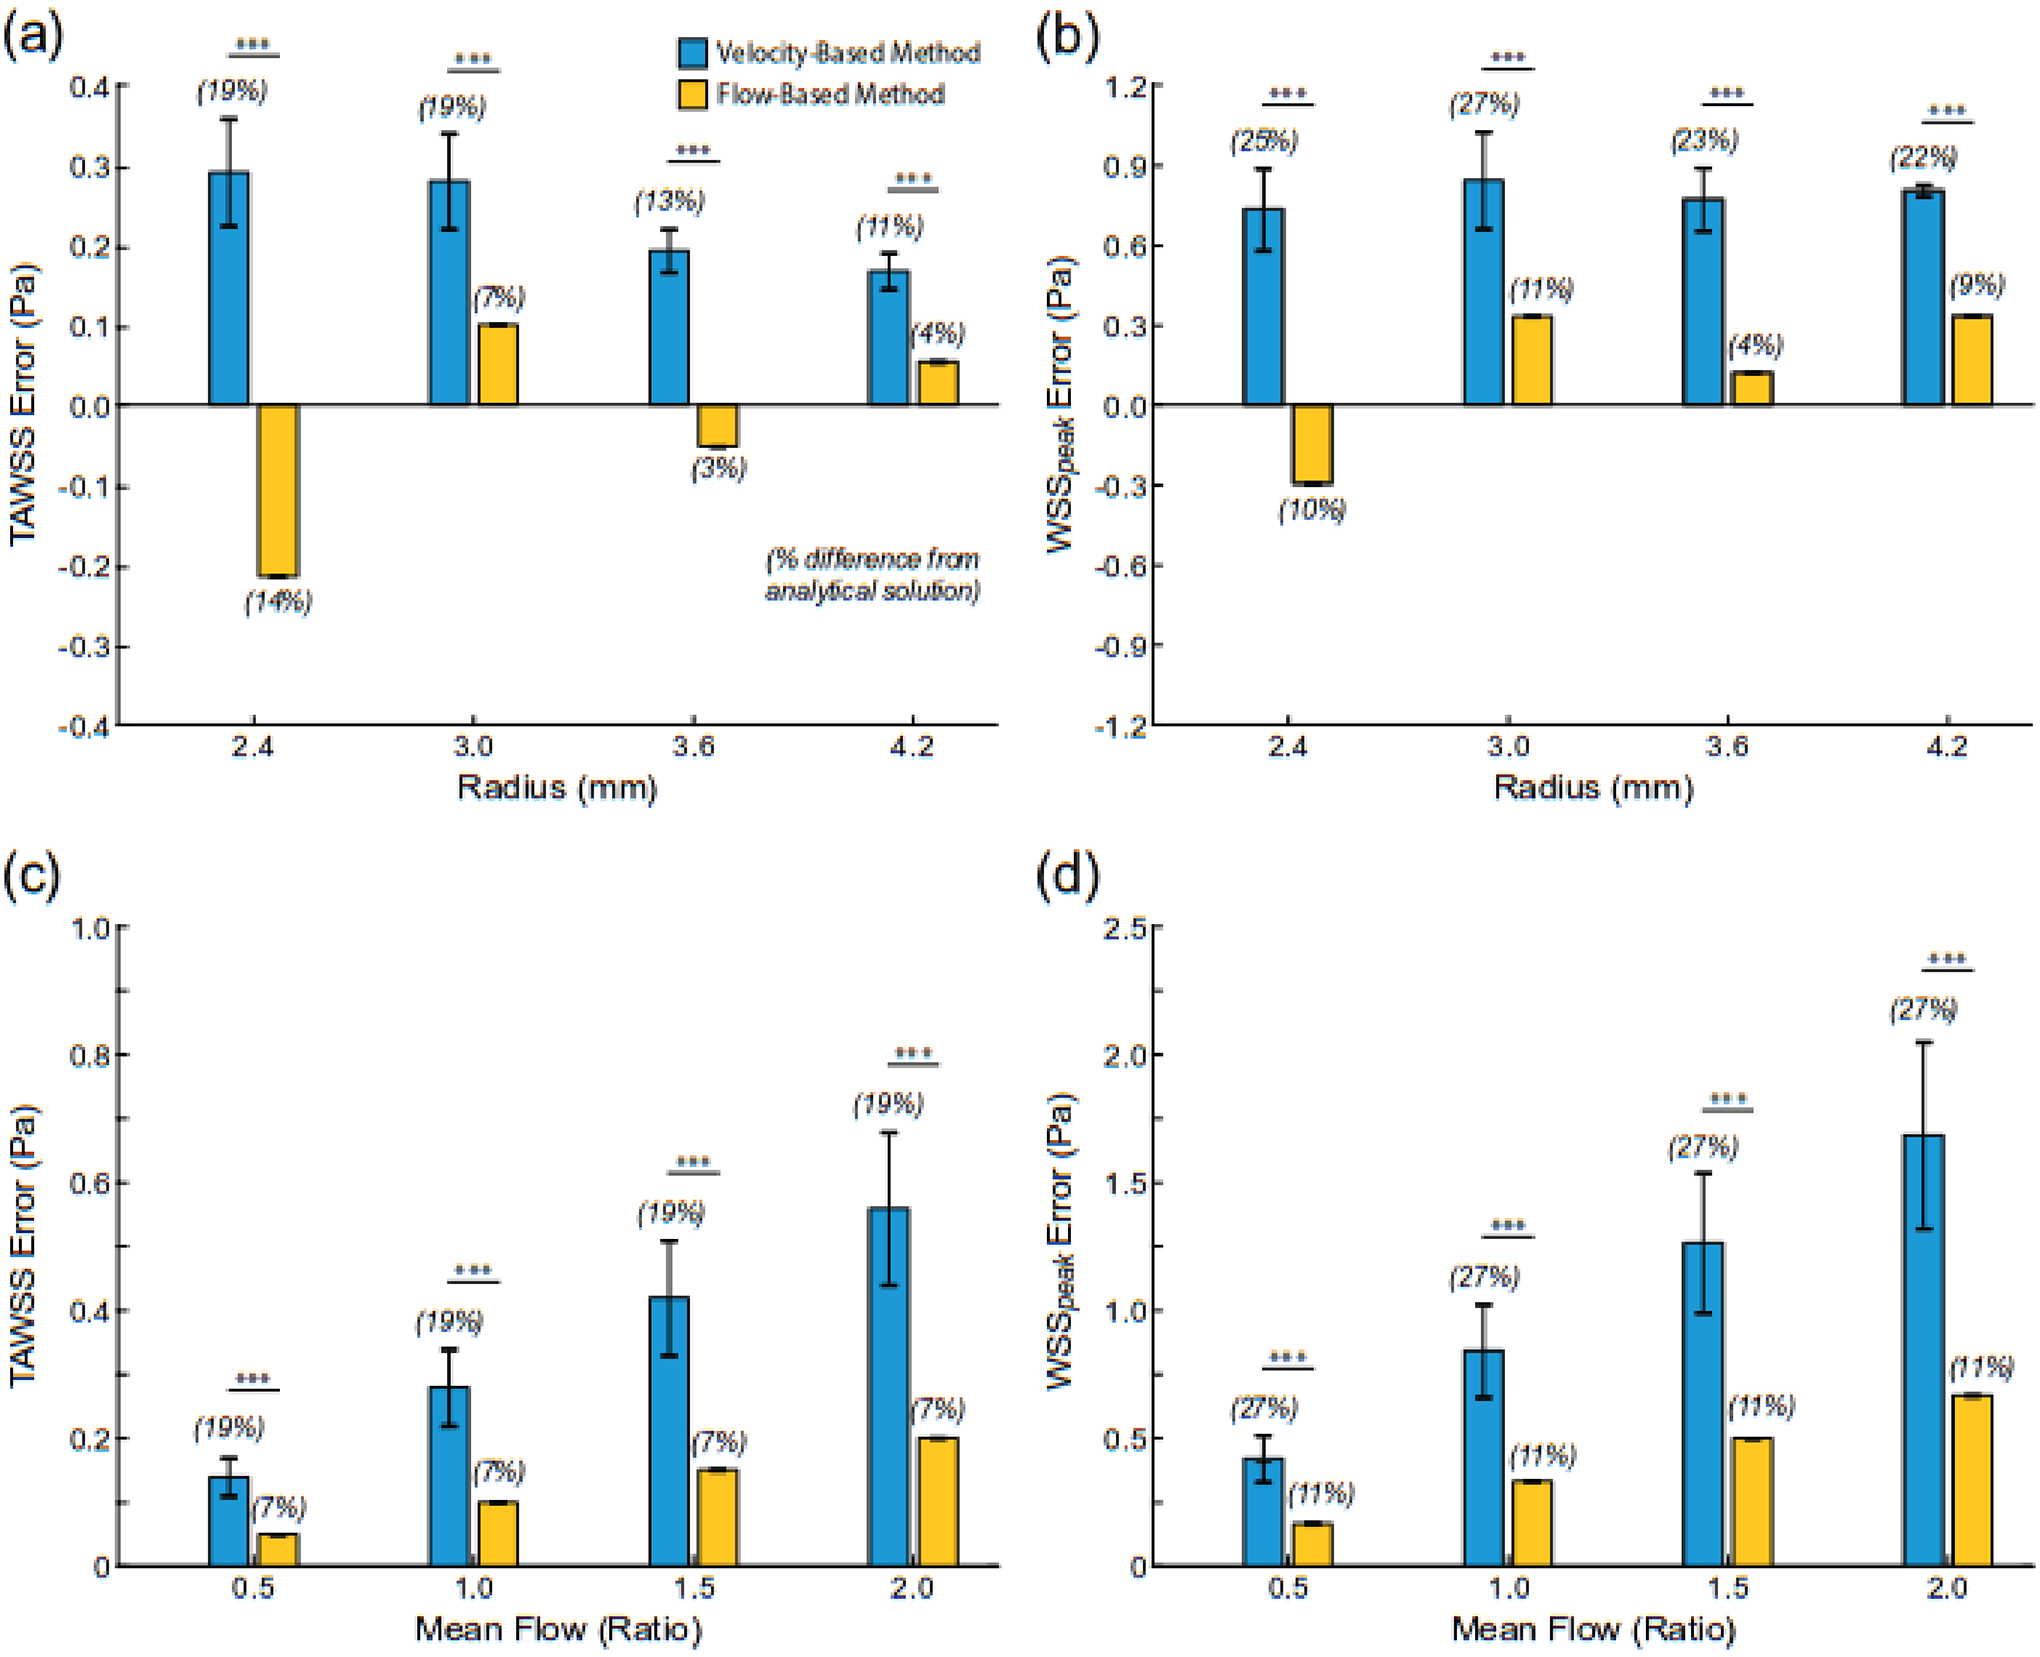
Differences in time-average (TAWSS) and peak (WSSpeak) wall shear stress values derived from the analytical solution and velocity- or flow-based method under unsteady flow conditions in a cylindrical vessel (i.e., Womersley flow). The flow waveform is shown in Figure 2. Changes in (a, b) radius (TAWSSanalyt = 1.5 Pa) and (c,d) volumetric flow rate. *** indicates p < 0.001.
3.3. Fluid-Structure Interaction Model
Results from the FSI model demonstrated the presence of complex flow patterns within the carotid bifurcation (e.g., recirculation zone in the carotid sinus; Fig. 7). Furthermore, model results highlight the spatial heterogeneity in time-averaged WSS values in the carotid bifurcation that were a product of skewed (i.e., non-symmetric) velocity profiles across the flow field. Importantly, the spatially resolved flow features from the FSI model were lessened when resampling the data to create the synthetic MRI data. For example, high time-averaged axial velocity values (vz) at the inner walls of the ICA and ECA were reduced by ~50%. Low axial velocity values were observed in the carotid sinus (sectors 3–6 in the ICA) across the simulated cardiac cycle leading to time-averaged WSS values <0.1 Pa.
Fig. 7.
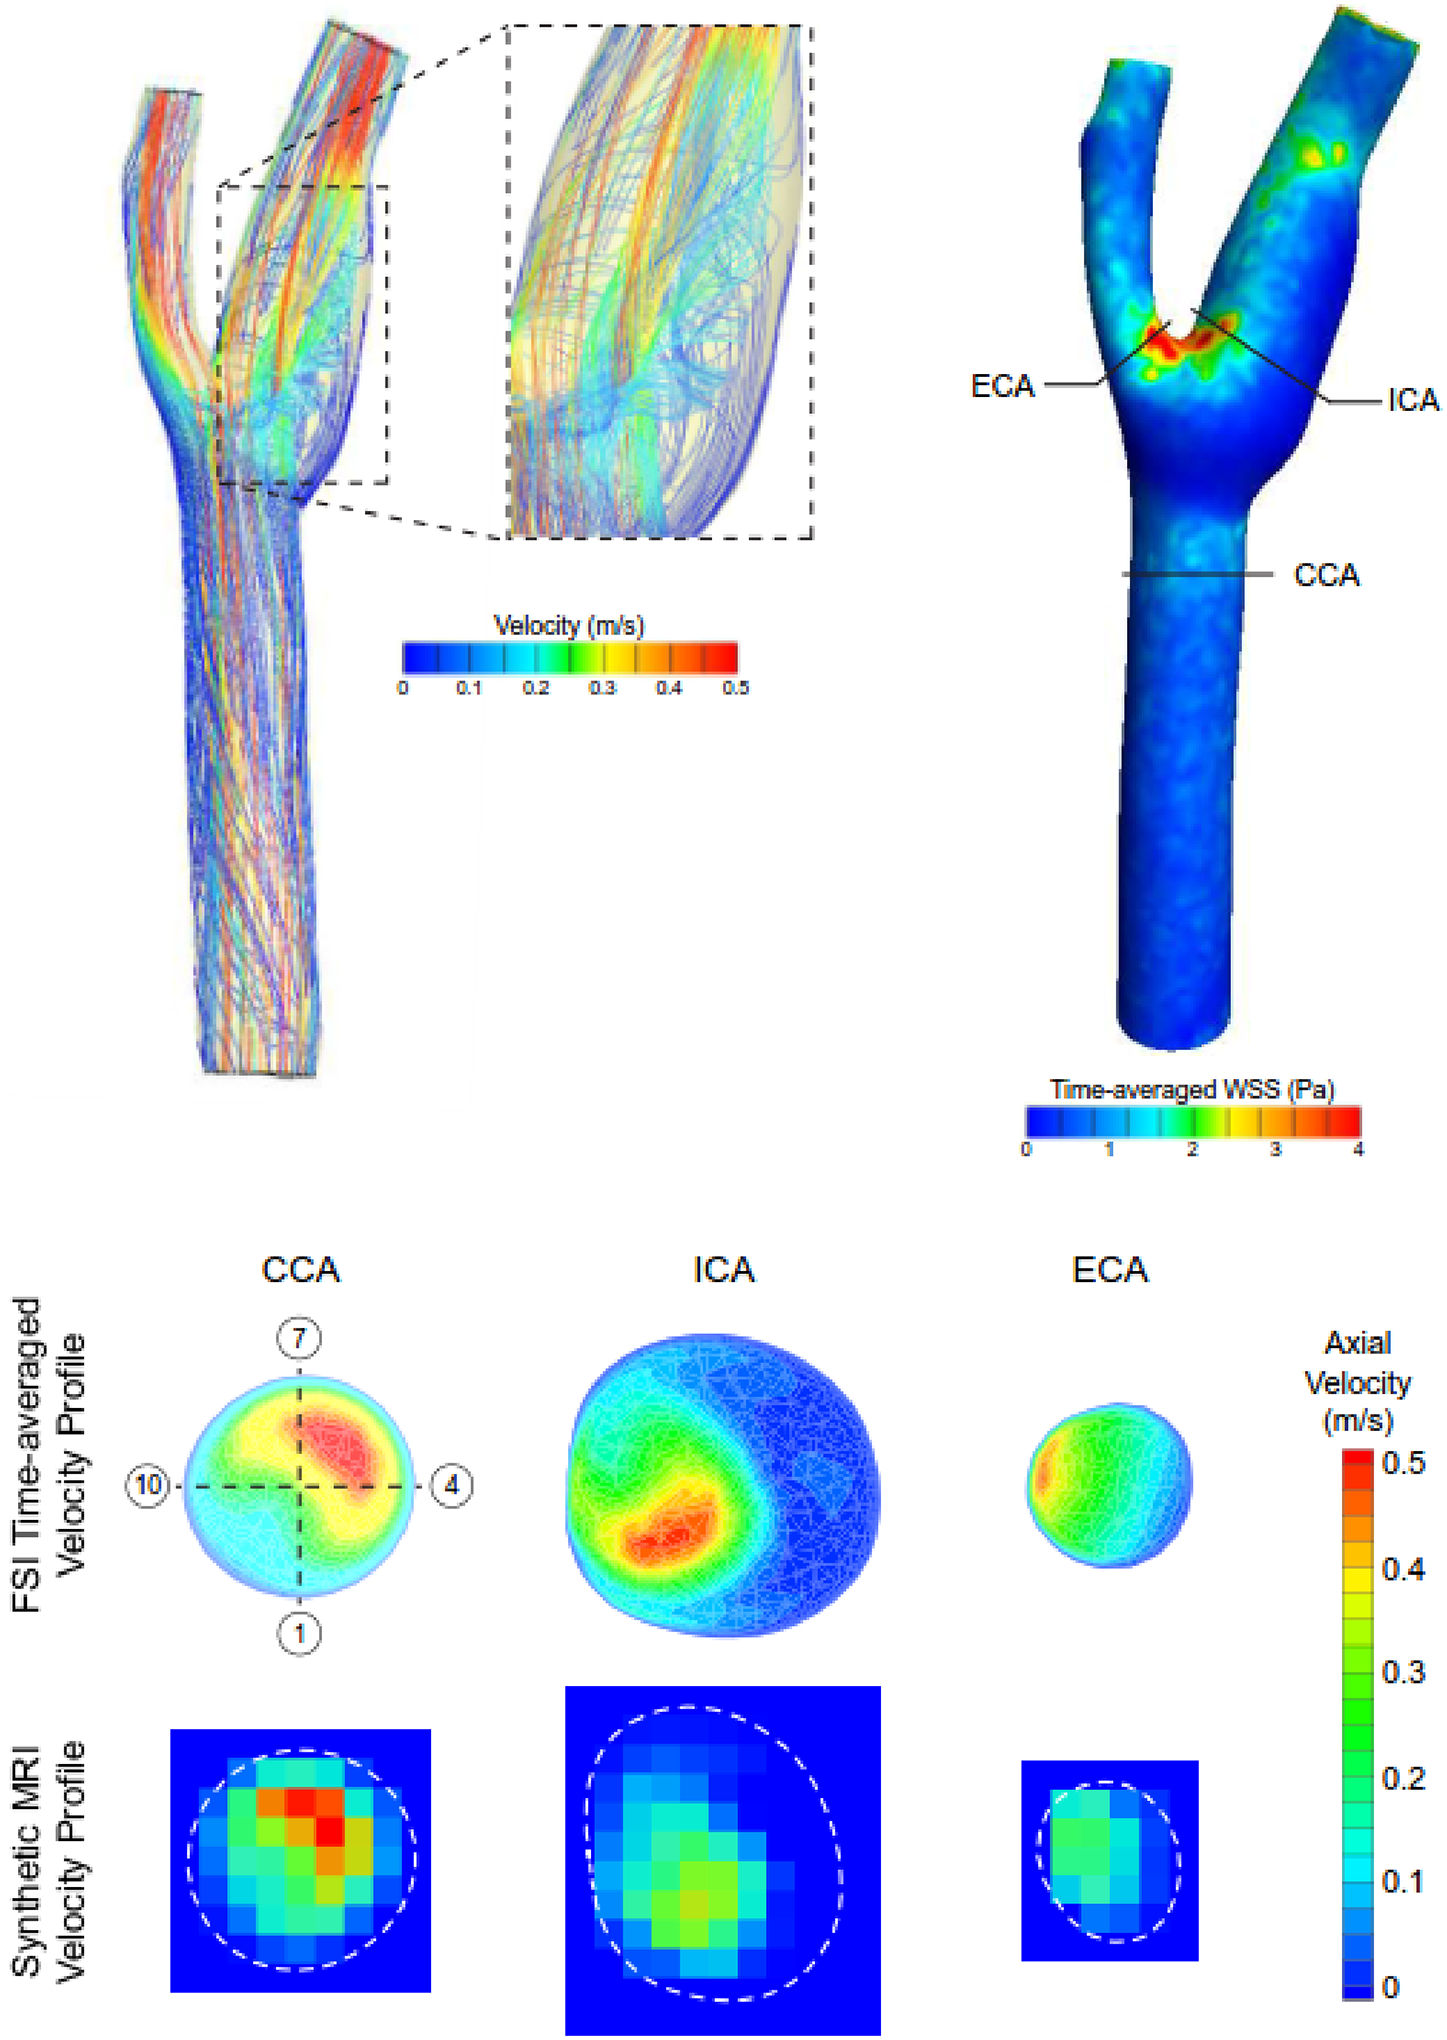
FSI model predicted flow streamlines encoded with velocity magnitude at peak systole and time-averaged WSS magnitude values in the carotid bifurcation. Solid black lines in the WSS fringe plot indicate the location where predicted velocity profiles were extracted in the common, internal, and external carotid arteries (CCA, ICA, and ECA, respectively) and resampled to generate synthetic MRI data (dashed white lines indicate wall boundary). The numbers in the open circles indicate the sector location where WSS values were calculated.
The flow-based method demonstrated increased accuracy and robustness over the velocity-based method in calculating WSS values when compared to the FSI predictions. Across all evaluated anatomic locations (Fig. 7), the 4D flow MRI-derived calculations of WSS against FSI predictions showed similar and moderate agreement in time-averaged and peak WSS values across (Table 1). Overall, both methods followed similar trends in WSS as the FSI model (Fig. 8), and each underestimated the FSI-derived values. The flow-based method resulted in more accurate WSS values in the ICA and ECA, whereas the velocity-based method demonstrated slightly higher accuracy in the CCA. Notably, the flow-based method was more accurate in the ICA, where flow disturbances are present, with an average difference of 0.09 Pa compared to the FSI-derived values. Although adding noise to the resampled FSI velocity data did not affect the calculated time-averaged WSS values in the ICA for either method (Supp. Fig. 1), changes in boundary location were consistent with those observed in the analytical solution results (Supp. Fig. 2).
Table 1.
Evaluation of agreement between fluid-structure interaction (FSI) model predicted and 4D flow MRI derived calculations of wall shear stress (WSS). The agreement was evaluated at 3 anatomic locations with 12 sectors at each location. CCC: concordance correlation coefficient, CI: confidence interval, std: standard deviation.
| Parameter | Common Carotid Artery | Internal Carotid Artery | External Carotid Artery | |||
|---|---|---|---|---|---|---|
| Time-averaged WSS | Peak Systolic WSS | Time-averaged WSS | Peak Systolic WSS | Time-averaged WSS | Peak Systolic WSS | |
| CCC | ||||||
| FSI vs. Velocity-based Method | 0.69 | 0.68 | 0.77 | 0.71 | 0.42 | 0.31 |
| FSI vs. Flow-based Method | 0.49 | 0.48 | 0.89 | 0.84 | 0.41 | 0.31 |
| Bias (95% CI), [Pascals] | ||||||
| FSI vs. Velocity-based Method | 0.19 (0.94) | 0.39 (1.50) | −0.03 (0.35) | −0.20 (0.80) | −1.26 (2.61) | −3.52 (6.51) |
| FSI vs. Flow-based Method | 0.31 (0.93) | 0.60 (1.43) | 0.03 (0.24) | −0.15 (0.60) | −1.07 (2.78) | −3.16 (6.77) |
| Absolute Difference (mean +/− std), [Pascals] | ||||||
| FSI vs. Velocity-based Method | 0.43 ± 0.25 | 0.70 ± 0.46 | 0.11 ± 0.14 | 0.23 ± 0.39 | 1.26 ± 1.33 | 3.52 ± 3.32 |
| FSI vs. Flow-based Method | 0.45 ± 0.33 | 0.80 ± 0.48 | 0.09 ± 0.08 | 0.17 ± 0.29 | 1.20 ± 1.30 | 3.29 ± 3.32 |
Fig. 8.
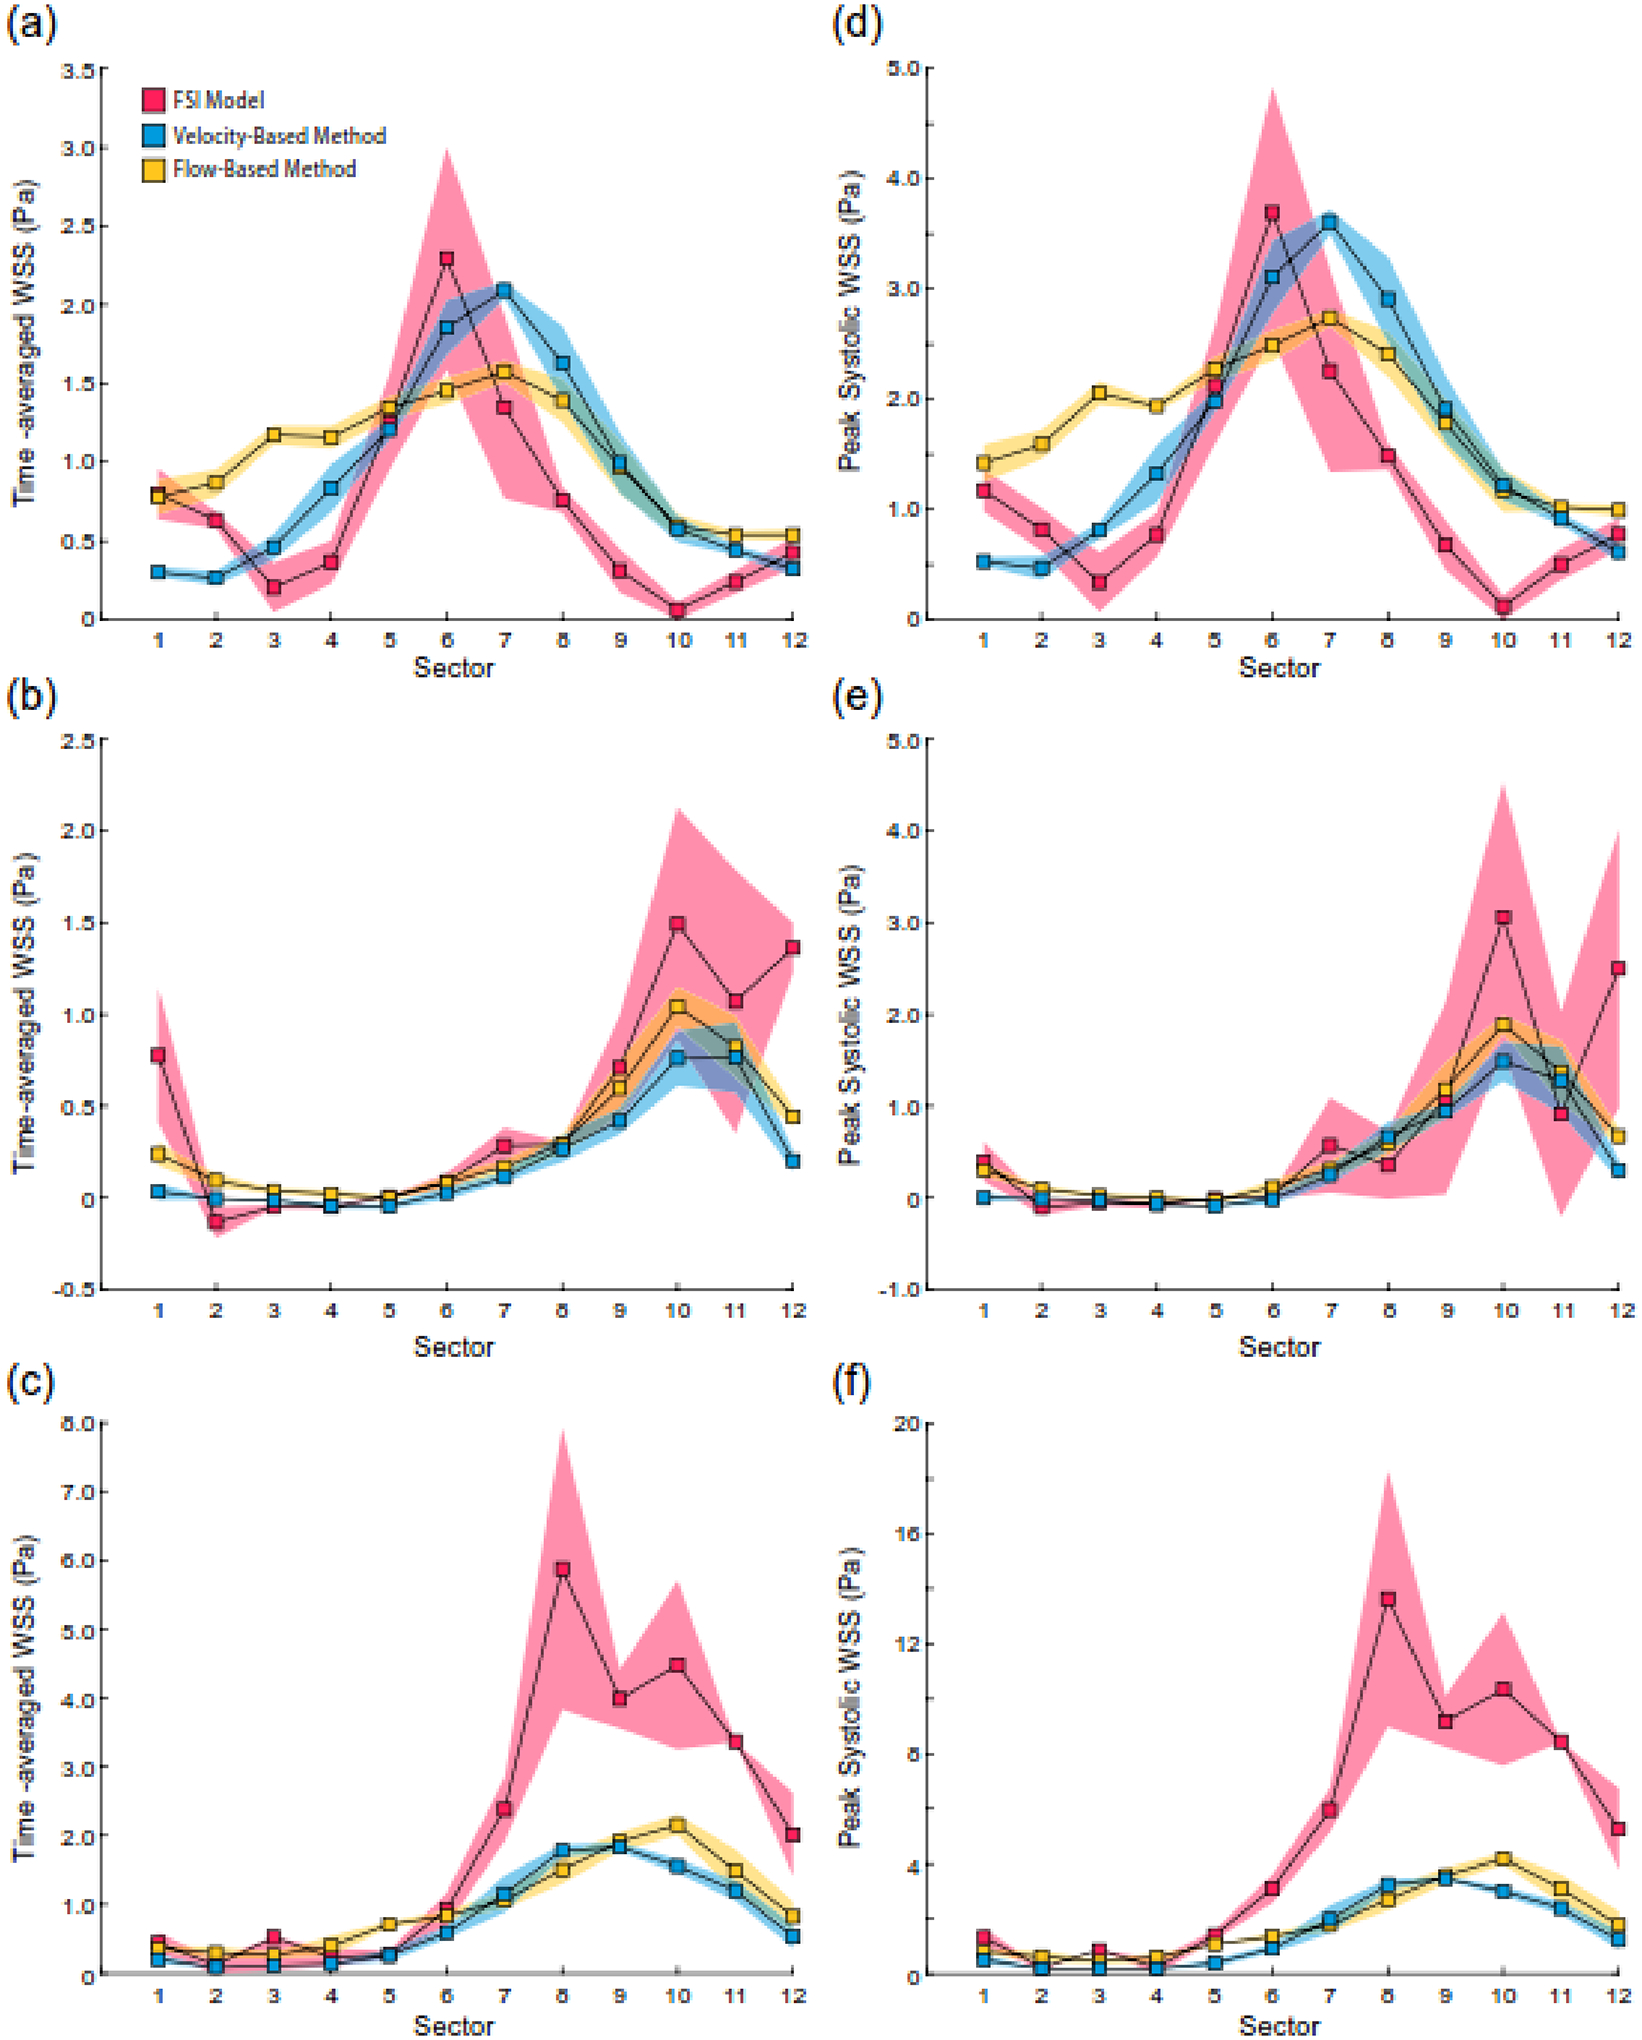
Comparison of FSI model predicted WSS values with values calculated with the velocity and flow-based methods. Time-averaged WSS in the analysis plane at the (a) CCA, (b) ICA, and (c) ECA. Peak WSS in the (d) CCA, (e) ICA, and (f) ECA. Shaded regions correspond to standard deviations.
Discussion
This study compared the accuracy of two approaches to calculate WSS from 4D flow MRI data – the velocity and flow-based methods. Utilizing analytical solutions to the governing equations for steady and pulsatile flow of an incompressible, Newtonian fluid, this study demonstrated that the flow-based method had greater accuracy in calculating WSS than the velocity-based across ranges in tube diameter, velocity/flow rate, and image SNR. Furthermore, the flow-based method was less sensitive to changes in boundary segmentation when examining concentric changes in the boundary under steady flow. These results were corroborated in the setting of a complex flow environment (pulsatile flow in the carotid bifurcation), as the flow-based method showed increased robustness than the velocity-based method in calculating WSS when compared to values derived from an FSI model.
The spatial resolution of 4D flow MRI remains a concern when seeking to calculate WSS. Methods to resample the image data have been implemented to overcome this limitation; however, all lead to systemic underestimation of WSS (Stalder, AF., et al., 2008; Cibis, M., et al., 2014; Oshinski, JN., et al., 1995). As Figure 2 illustrates, the velocity-based method resamples the image data to increase resolution and ensure sufficient discrete velocity data points to fit a spline. Data suggest that at least 8 voxels across the diameter of the vessel are required to reliably estimate WSS with this approach (Potters, W V., et al., 2015). Our data support this finding, as the velocity-based method demonstrated poor accuracy when fewer than 8 pixels were within the tube diameter. (Figs. 4b,5,6a). Furthermore, the velocity-based method greatly underestimated WSS in the ECA, which only has 4 voxels across the diameter (Figs. 7,8). In contrast, the flow-based method, which does not require image resampling, is more accurate at lower resolutions. This observation is not surprising given that the flow-based method depends on calculating the volumetric flow rates and not near-wall velocity gradients. Although a direct comparison of partial volume effects between the two methods has not been performed, sharp gradients in intra-voxel velocity distributions typically occur, leading to high error levels in the WSS calculation with the velocity-based method (Rothenberger, SM., et al., 2022). We have previously shown that including partial volumes with the flow-based method changed instantaneous WSS values by <0.1 Pa (Iffrig, E., et al., 2022). Thus, limited spatial resolution and partial volume effects minimally impact WSS values calculated with the flow-based technique, but greatly velocity-based approaches. While methods have been proposed to increase the fidelity of 4D flow MRI data (e.g., CFD-trained neural networks; Rutkowski, DR., et al., 2021), these methods are likely to further increase the accuracy of the flow-based method over velocity-based approaches.
Across the varied geometric and kinematic quantities to evaluate the robustness of the velocity and flow-based methods, WSS values were most sensitive to changes in the location of the lumen boundary. For the velocity-based method, a reduction in the lumen boundary leads to higher velocity gradients at the wall and thus higher WSS values, while the opposite holds true for an increase in the lumen boundary. For the flow-based technique, reducing the lumen boundary causes a decrease in the calculated volumetric flow rate, which would decrease the WSS. However, WSS is inversely proportional to radius (Eqs. 1,2), so a decrease in radius leads to an increase in WSS that has a stronger effect than the influence of flow rate. The impact of the flow rate calculation is lessened when the lumen boundary is overestimated, as the new pixels added have no velocity values and do not contribute to the total flow rate calculation, but the increase in radius causes a decrease in WSS. These counteracting factors explain why the flow-based method is less sensitive to changes in the lumen boundary than the velocity-based method. Importantly, the trends we observed with both methods for changes in the boundary are consistent with the reported data (Iffrig, E., et al., 2022; Potters, W V., et al., 2015). Furthermore, one study showed that changes in segmentation affect calculated volumetric flow rates less than WSS values calculated with the velocity-based method (Markl, M., et al., 2011). While methods to improve segmentation with the use of a contrast agent or to automate the process with deep learning approaches (Berhane, H., et al., 2020), the flow-based approach would remain more accurate with improved segmentation accuracy. Lastly, our results demonstrated that neither method was sensitive to image SNR, which has been previously reported (Stalder, AF., et al., 2008). This result could also be interpreted as neither method is sensitive to changes in VENC that keep the SNR within a range from 20 to 80, which was explored herein. However, to ensure highly resolved velocity data are captured within the imaging volume, a VENC value closer to the maximum blood velocity will ensure detailed complexes of the local flow field are captured (Dyverfeldt, P., et al., 2015).
Notably, this is the first study that utilized an FSI computational model to assess the accuracy of the 4D flow MRI-based methods to evaluate WSS in a patient-specific geometry. All previous investigations that sought to validate 4D flow MRI-derived (or 2D PCMR-derived) calculations of WSS utilized computational fluid dynamics (CFD) modeling and assumed a rigid wall (Iffrig, E., et al., 2022; Cibis, M., et al., 2014; van Ooij, P., et al., 2013), which leads to an overestimation of WSS (Perktold, K., et al., 1995). It is recognized that FSI modeling techniques have underlying assumptions, and thus the reported WSS values cannot be considered ground-truth values like the analytical solution data. However, the FSI model provided complex velocity field data to process with the MRI-based methods and WSS values to compare these methods against. In the presented FSI model, the average 1st principal strain at peak systole on the lumen surface was 0.25±0.03, with maximum values approaching 0.60 at the carotid sinus. Assuming an initial radius of 3 mm and a steady inlet velocity, a 25% strain in the circumferential direction (i.e., 1st principal direction), would lead to an ~18% reduction in WSS as compared to assuming a rigid wall. Thus, the error between MRI-based methods and numerical approaches to determine WSS is magnified using CFD techniques. The deformation of the arterial wall impacts near-wall blood flow patterns and must be accounted for when validating the accuracy of novel approaches to calculate WSS. Future investigations proposing novel techniques to extract hemodynamic metrics from 4D flow MRI data should recognize and incorporate advancements in computational biomechanics to provide an accurate assessment of technique error.
It is important to recognize and note the limitations of this study. First, the 4D flow MRI-based techniques to calculate WSS were compared to model data from only one physiologic flow environment – pulsatile flow in a healthy carotid bifurcation. Continued application of these techniques and direct comparisons across other vascular territories, in the setting of health and disease, are warranted to understand better the advantages, and potential shortcomings, of either technique. Second, given the underlying assumptions of the Womersley solution, its application to 4D flow MRI data acquired in non-cylindrical conduits (e.g., cardiac chamber) is not well-founded. Understanding the impact of these assumptions across cardiovascular domains is necessary to assess accuracy. Third, due to the assumptions for Womersley flow, the flow-based method can only quantify the rz-component of the WSS vector, whereas the velocity-based method can also evaluate the rθ-component. While assessing additional WSS vector components provides further understanding of the flow field, validation is required to demonstrate calculation accuracy. Lastly, this study did not explore the clinical value of WSS values derived from each technique. Future longitudinal clinical studies that compare the prognostic value of these methods are needed to understand the clinical benefit of either technique.
In conclusion, this study highlights the importance of rigorous validation of approaches to quantify biologically relevant hemodynamic parameters. We demonstrate across a range of simplified and complex flow scenarios that the flow-based method provides a more accurate and robust calculation of WSS than the velocity-based approach from 4D flow MRI data. Future clinical investigations are warranted to appreciate the significance of these findings in the setting of cardiovascular disease.
Supplementary Material
Supplemental Fig. 1. Sensitivity of velocity and flow-based method calculations of time-averaged WSS to image noise in the resampled velocity data from the ICA in the FSI model. Shaded regions correspond to standard deviations.
Supplemental Fig. 2. Sensitivity of velocity and flow-based method calculations of time-averaged WSS on the defined wall boundary of the ICA in the FSI model. The location of the FSI model boundary was changed by ± 5,10% to quantify the impact of boundary segmentation in the setting of complex flow patterns. Shaded regions correspond to standard deviations.
Acknowledgments
This study was supported, in part, by funding from the National Institutes of Health - R01 HL150608, (LHT), R21 NS114602 (JNO), and the Stimulating Access to Research in Residency (R38 AI140299; EI). The sponsor had no involvement in the study design, in the collection, analysis, and interpretation of data, in the writing of the manuscript, and in the decision to submit the manuscript for publication. The authors would like to thank Professor Gerard Ateshian at Columbia University for his assistance with the FSI model.
Footnotes
Publisher's Disclaimer: This is a PDF file of an unedited manuscript that has been accepted for publication. As a service to our customers we are providing this early version of the manuscript. The manuscript will undergo copyediting, typesetting, and review of the resulting proof before it is published in its final form. Please note that during the production process errors may be discovered which could affect the content, and all legal disclaimers that apply to the journal pertain.
Conflict of Interest Statement
The authors declare that they have no known competing financial interests or personal relationships that could have appeared to influence the work reported in this paper.
References
- 1.Markl M, Harloff A, Bley TA., Zaitsev M, Jung B, Weigang E, Langer M, Frydrychowicz A, 2007. Time-Resolved 3D MR Velocity Mapping at 3T : Improved Navigator-Gated Assessment of Vascular Anatomy and Blood Flow. J. Magn. Reson. Imaging, 824–831. [DOI] [PubMed] [Google Scholar]
- 2.Soulat G, McCarthy P, Markl M, 2020. 4D Flow with MRI. Annu. Rev. Biomed. Eng, 103–126. [DOI] [PubMed] [Google Scholar]
- 3.Eriksson J, Bolger AF., Ebbers T, Carlhäll C-J, 2013. Four-Dimensional Blood Flow-Specific Markers of LV Dysfunction in Dilated Cardiomyopathy. Eur. Hear. journal. Cardiovasc. Imaging, 417–424. [DOI] [PMC free article] [PubMed] [Google Scholar]
- 4.François CJ., Srinivasan S, Schiebler ML, Reeder SB, Niespodzany E, Landgraf BR, Wieben O, Frydrychowicz A, 2012. 4D Cardiovascular Magnetic Resonance Velocity Mapping of Alterations of Right Heart Flow Patterns and Main Pulmonary Artery Hemodynamics in Tetralogy of Fallot. J. Cardiovasc. Magn. Reson, 16. [DOI] [PMC free article] [PubMed] [Google Scholar]
- 5.Garcia J, Barker AJ., Collins JD, Carr JC, Markl M, 2017. Volumetric Quantification of absolute Local Normalized Helicity in Patients with Bicuspid Aortic Valve and Aortic Dilatation. Magn. Reson. Med, 689–701. [DOI] [PMC free article] [PubMed] [Google Scholar]
- 6.Roldán-Alzate A, Frydrychowicz A, Niespodzany E, Landgraf BR., Johnson KM, Wieben O, Reeder SB, 2013. In vivo Validation of 4D Flow MRI for Assessing the Hemodynamics of Portal Hypertension. J. Magn. Reson. Imaging, 1100–1108. [DOI] [PMC free article] [PubMed] [Google Scholar]
- 7.Caro CG., Fitz-Gerald JM, Schroter RC, 1969. Arterial Wall Shear and Distribution of Early Atheroma in Man. Nature, 1159–1161. [DOI] [PubMed] [Google Scholar]
- 8.Friedman MH., Hutchins GM, Bargeron CB, Deters OJ, Mark FF, 1981. Correlation Between Intimal Thickness and Fluid Shear in Human Arteries. Atherosclerosis, 425–436. [DOI] [PubMed] [Google Scholar]
- 9.Zarins CK., Giddens DP, Bharadvaj BK, Sottiurai VS, Mabon RF, Glagov S, 1983. Carotid Bifurcation Atherosclerosis. Quantitative Correlation of Plaque Localization With Flow Velocity Profiles and Wall Shear Stress. Circ. Res, 502–514. [DOI] [PubMed] [Google Scholar]
- 10.Marsden AL., Esmaily-Moghadam M, 2015. Multiscale Modeling of Cardiovascular Flows for Clinical Decision Support. Appl. Mech. Rev, 67. [Google Scholar]
- 11.Taylor CA., Figueroa CA, 2009. Patient-Specific Modeling of Cardiovascular Mechanics. Annu. Rev. Biomed. Eng, 109–134. [DOI] [PMC free article] [PubMed] [Google Scholar]
- 12.Stalder AF., Russe MF., Frydrychowicz A, Bock J, Hennig J, Markl M, 2008. Quantitative 2D and 3D Phase Contrast MRI: Optimized Analysis of Blood Flow and Vessel Wall Parameters. Magn. Reson. Med, 1218–1231. [DOI] [PubMed] [Google Scholar]
- 13.Barker AJ., Markl M, Bürk J, Lorenz R, Bock J, Bauer S, Schulz-Menger J, von Knobelsdorff-Brenkenhoff F, 2012. Bicuspid Aortic Valve is Associated With Altered Wall Shear Stress in the Ascending Aorta. Circ. Cardiovasc. Imaging, 457–466. [DOI] [PubMed] [Google Scholar]
- 14.Barker AJ., Roldán-Alzate A, Entezari P, Shah SJ, Chesler NC, Wieben O, Markl M, François CJ, 2014. Four-Dimensional Flow Assessment of Pulmonary Artery Flow and Wall Shear Stress in Adult Pulmonary Arterial Hypertension: Results From Two Institutions. Magn. Reson. Med, 1904–1913. [DOI] [PMC free article] [PubMed] [Google Scholar]
- 15.Schnell S, Ansari SA., Vakil P, Wasielewski M, Carr ML, Hurley MC, Bendok BR, Batjer H, Carroll TJ, Carr J, Markl M, 2014. Three-Dimensional Hemodynamics in Intracranial Aneurysms: Influence of Size and Morphology. J. Magn. Reson. Imaging, 120–131. [DOI] [PMC free article] [PubMed] [Google Scholar]
- 16.Gilles S, SM B, AB D, Ryan A, BR O, Chris MS, Patrick M, FP WM, BA J, Michael M, 2022. Association of Regional Wall Shear Stress and Progressive Ascending Aorta Dilation in Bicuspid Aortic Valve. JACC Cardiovasc. Imaging, 33–42. [DOI] [PMC free article] [PubMed] [Google Scholar]
- 17.Iffrig E, Timmins LH., El Sayed R, Taylor WR, Oshinski JN, 2022. A New Method for Quantifying Abdominal Aortic Wall Shear Stress Using Phase Contrast Magnetic Resonance and the Womersley Solution. J. Biomech. Eng, 144. [DOI] [PMC free article] [PubMed] [Google Scholar]
- 18.Nichols WW., O’Rourke MF, Vlachopoulos C, 2011. McDonald’s Blood Flow in Arteries Theoretical, Experimental and Climical Principles. Boca Raton: CRC Press.Boca Raton, [Google Scholar]
- 19.Hurd ER., Han M, Mendes JK, Hadley JR, Johnson CR, Dibella EVR, Oshinski JN, Timmins LH, 2022. Cardiovascular Engineering and Technology Comparison of Prospective and Retrospective Gated 4D Flow Cardiac MR Image Acquisitions in the Carotid Bifurcation. Cardiovasc. Eng. Technol (In Press., [DOI] [PubMed] [Google Scholar]
- 20.He X, Ku DN., Moore JEJ, 1993. Simple Calculation of the Velocity Profiles for Pulsatile Flow in a Blood Vessel Using Mathematica. Ann. Biomed. Eng, 45–49. [DOI] [PubMed] [Google Scholar]
- 21.Maas SA., Ellis BJ, Ateshian GA, Weiss JA, 2012. FEBio: Finite Elements for Biomechanics. J. Biomech. Eng, 134. [DOI] [PMC free article] [PubMed] [Google Scholar]
- 22.Maas SA., Ateshian GA, Weiss JA, 2017. FEBio: History and Advances. Annu. Rev. Biomed. Eng, 279–299. [DOI] [PMC free article] [PubMed] [Google Scholar]
- 23.Shim JJ., Maas SA, Weiss JA, Ateshian GA, 2019. A Formulation for Fluid–Structure Interactions in FEBio Using Mixture Theory. J. Biomech. Eng, 141. [DOI] [PMC free article] [PubMed] [Google Scholar]
- 24.Holzapfel GA., Gasser TC, Ogden RW, 2000. A New Constitutive Framework for Arterial Wall Mechanics and a Comparative Study of Material Models. J. Elast. Phys. Sci. solids, 1–48. [Google Scholar]
- 25.Sommer G, Holzapfel GA., 2012. 3D Constitutive Modeling of the Biaxial Mechanical Response of Intact and Layer-Dissected Human Carotid Arteries. J. Mech. Behav. Biomed. Mater, 116–128. [DOI] [PubMed] [Google Scholar]
- 26.Bland JM., Altman DG, 1986. Statistical Methods for Assessing Agreement Between Two Methods of Clinical Measurement. 307–310. [PubMed]
- 27.Lin LI-K, 1989. A Concordance Correlation Coefficient to Evaluate Reproducibility. Biometrics, 255–268. [PubMed] [Google Scholar]
- 28.Cibis M, Potters WV, Gijsen FJH, Marquering H, vanBavel E, van der Steen AFW, Nederveen AJ, Wentzel JJ, 2014. Wall shear stress calculations based on 3D cine phase contrast MRI and computational fluid dynamics: a comparison study in healthy carotid arteries. NMR Biomed, 826–834. [DOI] [PubMed] [Google Scholar]
- 29.Oshinski JN., Ku DN, Mukundan SJ, Loth F, Pettigrew RI, 1995. Determination of wall shear stress in the aorta with the use of MR phase velocity mapping. J. Magn. Reson. Imaging, 640–647. [DOI] [PubMed] [Google Scholar]
- 30.Potters WV, Van Ooij P, Marquering H, VanBavel E, Nederveen AJ, 2015. Volumetric arterial wall shear stress calculation based on cine phase contrast MRI. J. Magn. Reson. Imaging, 505–516. [DOI] [PubMed] [Google Scholar]
- 31.Rothenberger SM., Zhang, Brindise MC, Schnell S, Markl M, Vlachos PP, Rayz VL, 2022. Modeling Bias Error in 4D Flow MRI Velocity Measurements. IEEE Trans. Med. Imaging, 1802–1812. [DOI] [PMC free article] [PubMed] [Google Scholar]
- 32.Rutkowski DR., Roldán-Alzate A, Johnson KM, 2021. Enhancement of cerebrovascular 4D flow MRI velocity fields using machine learning and computational fluid dynamics simulation data. Sci. Rep, 1–11. [DOI] [PMC free article] [PubMed] [Google Scholar]
- 33.Markl M, Wallis W, Harloff A, 2011. Reproducibility of flow and wall shear stress analysis using flow-sensitive four-dimensional MRI. J. Magn. Reson. Imaging, 988–994. [DOI] [PubMed] [Google Scholar]
- 34.Berhane H, Scott M, Elbaz M, Jarvis K, McCarthy P, Carr J, Malaisrie C, Avery R, Barker AJ., Robinson JD, Rigsby CK, Markl M, 2020. Fully automated 3D aortic segmentation of 4D flow MRI for hemodynamic analysis using deep learning. Magn. Reson. Med, 2204–2218. [DOI] [PMC free article] [PubMed] [Google Scholar]
- 35.Dyverfeldt P, Bissell M, Barker AJ., Bolger AF, Carlhäll C-J, Ebbers T, Francios CJ, Frydrychowicz, Geiger J, Giese D, Hope MD, Kilner PJ, Kozerke S, Myerson S, Neubauer S, Wieben O, Markl M, 2015. 4D flow cardiovascular magnetic resonance consensus statement. J. Cardiovasc. Magn. Reson, 72. [DOI] [PMC free article] [PubMed] [Google Scholar]
- 36.van Ooij P, Potters WV, Guédon A, Schneiders JJ, Marquering HA, Majoie CB, vanBavel E, Nederveen AJ, 2013. Wall shear stress estimated with phase contrast MRI in an in vitro and in vivo intracranial aneurysm. J. Magn. Reson. Imaging, 876–884. [DOI] [PubMed] [Google Scholar]
- 37.Perktold K, Rappitsch G, 1995. Computer simulation of local blood flow and vessel mechanics in a compliant carotid artery bifurcation model. J. Biomech, 845–856. [DOI] [PubMed] [Google Scholar]
Associated Data
This section collects any data citations, data availability statements, or supplementary materials included in this article.
Supplementary Materials
Supplemental Fig. 1. Sensitivity of velocity and flow-based method calculations of time-averaged WSS to image noise in the resampled velocity data from the ICA in the FSI model. Shaded regions correspond to standard deviations.
Supplemental Fig. 2. Sensitivity of velocity and flow-based method calculations of time-averaged WSS on the defined wall boundary of the ICA in the FSI model. The location of the FSI model boundary was changed by ± 5,10% to quantify the impact of boundary segmentation in the setting of complex flow patterns. Shaded regions correspond to standard deviations.


