Abstract
By predicting ERα bioactivity and mining the potential relationship between Absorption, Distribution, Metabolism, Excretion, Toxicity (ADMET) attributes in drug research and development, the development efficiency of specific drugs for breast cancer will be effectively improved and the misjudgment rate of R&D personnel will be reduced. The quantitative prediction model of ERα bioactivity and classification prediction model of Absorption, Distribution, Metabolism, Excretion, Toxicity properties were constructed. The prediction results of ERα bioactivity were compared by XGBoot, Light GBM, Random Forest and MLP neural network. Two models with high prediction accuracy were selected and fused to obtain ERα bioactivity prediction model from Mean absolute error (MAE), mean squared error (MSE) and R2. The data were further subjected to model-based feature selection and FDR/FPR-based feature selection, respectively, and the results were placed in a voting machine to obtain Absorption, Distribution, Metabolism, Excretion, Toxicity classification prediction model. In this study, 430 molecular descriptors were removed, and finally 20 molecular descriptors with the most significant effect on biological activity obtained by the dual feature screening combined optimization method were used to establish a compound molecular descriptor prediction model for ERα biological activity, and further classification and prediction of the Absorption, Distribution, Metabolism, Excretion, Toxicity properties of the drugs were made. Eighty variables were selected by the model ExtraTreesClassifier Classifie, and 40 variables were selected by the model GradientBoostingClassifier to complete the model-based feature selection. At the same time, the feature selection method based on FDR/FPR is also selected, and the three classification models obtained by the two methods are placed into the voting machine to obtain the final model. The experimental results showed that the model‘s evaluation indexes and roc diagram were excellent and could accurately predict ERα bioactivity and Absorption, Distribution, Metabolism, Excretion, Toxicity properties. The model constructed in this study has high accuracy, fast convergence and robustness, has a very high accuracy for Absorption, Distribution, Metabolism, Excretion, Toxicity and ERα classification prediction, has bright prospects in the biopharmaceutical field, and is an important method for energy conservation and yield increase in the future.
Keywords: machine learning, ERα bioactivity, ADMET, breast cancer, drug development
1 Introduction
With the development of the times, more and more people began to pay attention to their own health problems. In today’s society, breast cancer is one of the most common and lethal cancers. Estrogen receptors have a close correlation with the development of breast cancer, and according to related studies, estrogen receptor alpha (ERα) in estrogen has a strong promoting effect on the dominant characterization of breast cancer (Lempereur et al., 2016).
At present, the main treatment for breast cancer patients is to inhibit the expression of ERα gene using anti-hormone therapy, and then control the estrogen level in patients through the modulation of estrogen receptor activity, so as to achieve the inhibition of breast cancer spread and malignant trend, and gradually combine drugs and radiochemotherapy to achieve effective treatment of breast cancer (Ali and Coombes, 2002; Mohla et al., 2009; Huang et al., 2015). Drugs developed based on the corresponding compounds have been widely used in clinical treatment.
Drug R&D involves the discovery and development of new drugs, and the difference between these two stages is the determination of candidate drugs, candidate drugs represent active compounds involved in clinical research, so it is necessary to screen active compounds for drug research and development. Active compounds are compounds with certain biological or pharmacological activities obtained through various ways and methods, in the screening process, we should do research on biological activity, pharmacokinetics, toxicity analysis, etc. while synthesizing, so as to find the molecules needed for drug development. Then it is necessary to conduct tests related to biological activity and pharmacological data, that is, the quantitative structure activity relationship (QSAR) model (Bolboaca and Jäntschi, 1900; Singh et al., 2013; Ezugwu et al., 2021) of the compound. After the screening work is completed, in order to avoid the late risk of drug development (Samuel et al., 2021; Sun et al., 2022), also needs to verify whether it has ADMET (Absorption, Distribution, Metabolism, Excretion, Toxicity) properties. In the compound database, the construction vector can select compounds with excellent ADMET properties and biological activities (Deng, 2013). Mining tacit knowledge in drug data and using machine learning prediction can reduce the R&D cost of pharmaceutical processes (Guo et al., 2022), and deep learning algorithms accelerate drug target recognition efficiency (Fenglei et al., 2021). Construction of prediction models for protein hotspot residues based on machine learning algorithms can assist drug development (Hu, 2019). Further mining the activity of drugs against tumor therapeutic targets and the sensitivity of tumor cell lines can efficiently develop novel tumor drugs (Li, 2021). The ADMET classification prediction model has good performance in predicting the properties of anti-breast cancer drugs (Yaqin et al., 2022). Scholars have found that some genes as well as core TFs can evaluate the efficacy of adjuvant therapy for breast cancer, of which E2F1 can regulate MAPK signaling pathways involved in pharmaceutical processes (Ye et al., 2022). Recognizing that AI is a very effective tool in disease assessment, patient data are collected through machine learning to develop mathematical models and predict outcomes (Suh and Lee, 2017; Fu et al., 2022; Zheng et al., 2022), a large number of researchers have investigated interpretable disease diagnostic models (Casteleiro-Roca et al., 2020; Tjoa and Guan, 2021; Xu et al., 2022).
Jiang and other scholars established an easy to understand OPLS-DA model based on only two descriptors, and the accuracy of the model was as high as 93% and 79% (Matsson et al., 2007; Jiang et al., 2020). Pan and other scholars trained 79, 99 and 780 compounds respectively, and achieved high accuracy (Jiang et al., 2020). Although good results have been achieved, there is still room for optimization in terms of descriptors and the number of compounds. Based on 1974 compounds (samples) and 729 molecular descriptors (variables) provided by candidate compound data set, this paper solves the problem of low reliability caused by previous model development based on relatively small data set. In addition, the application value of the existing ADMET model in specific drug screening work is still unclear, based on this, this study, first, a dual feature screening combination method is proposed to screen data variables; then, the combination of Bagging algorithm and random forest algorithm is used to realize ERα’ Bioactivity prediction; finally, different target values are introduced to test the performance of the prediction model, so as to improve the development efficiency of breast cancer specific drugs, as well as reducing the error judgment rate of R&D personnel.
2 Materials and methods
2.1 Data acquisition
The main ways to obtain drug data include laboratories, online public publications, biochemical databases, and so on. In this paper, the optimized modeling (2021) dataset of anti-breast cancer drug candidates provided by the China Association for Science and Technology is used as the candidate compound dataset.
Taking anti-breast cancer drugs as an example to test the prediction framework for the following reasons: First, breast cancer is the largest cancer in the world, and breast cancer patients in China account for a relatively large proportion; second, researchers have accumulated a large number of R&D data of anti-breast cancer drugs over the years, laying the foundation for further machine-learning-based prediction research; third, predecessors have left sufficient literature data on breast cancer characteristic targets, which plays a guiding role in the establishment of the validation prediction framework.
2.2 Data processing
According to the data of 1974 compounds (samples) and 729 molecular descriptors (variables) provided by the candidate compound dataset, 20 main variables were screened, which made the selected main variables have a good effect on ERα biological activity. Data preprocessing is performed first, and column variables (molecular descriptors) are cleaned. Different screening algorithms were used to analyze the distribution characteristics of the cleaned data. In order to obtain more accurate screening results, gray relational degree method and Spearman rank correlation coefficient analysis are selected to reduce the dimension of the data and data screening, and the two are further combined analysis, and a dual feature screening combined optimization method is proposed. The specific analysis is divided into k steps, and the flow chart is shown in Figure 1.
FIGURE 1.
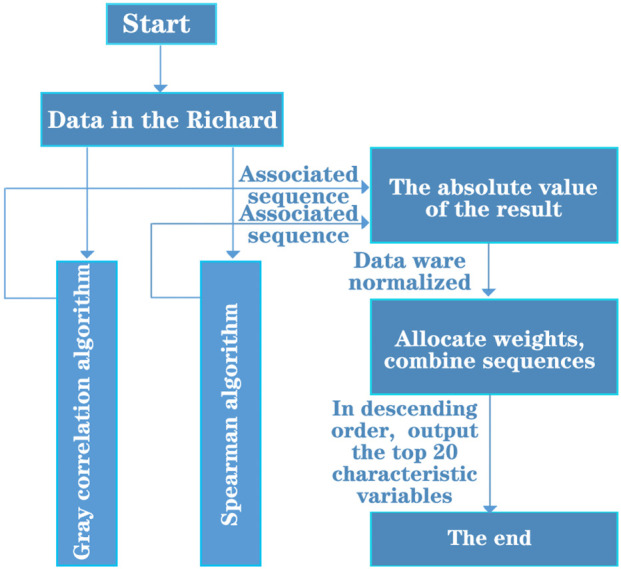
Flow chart of combined optimization method for dual feature screening.
Step 1
Relevance calculation. The data were processed using Algorithm I (grey correlation analysis) and Algorithm III (Spearman rank correlation analysis) to obtain the corresponding correlation coefficient sequences and .
Grey correlation analysis method, which takes the difference value between curves as the correlation degree. There are several comparison sequences (x 1, x 2,…, x n ) for a reference sequence x 0, correlation coefficient of each comparison sequence and reference sequence at each time (i.e., each point in the curve) β(x i ) can be calculated by the following formula: ρ is the resolution coefficient, generally between 0 and 1, usually taken as 0.5. Δmin represents the second level minimum difference, Δmax represents the maximum difference between two levels. Δ oi (k) represents the absolute difference between each point on the comparison series x i curve and each point on the reference series x 0 curve. Therefore, the correlation coefficient β(x i ) can also be simplified as follows:
(1) Because the correlation coefficient is the value of the correlation degree between the comparison sequence and the reference sequence at each time (i.e., each point in the curve), it has more than one number, and the information is too scattered to facilitate the overall comparison. Therefore, it is necessary to centralize the correlation coefficient of each time (i.e., each point in the curve) into one value, that is, to calculate its average value, as a quantitative expression of the correlation degree between the comparison sequence and the reference sequence, the formula of correlation degree c i is as follows:
(2) Spearman rank correlation coefficient is generally considered as Pearson linear correlation coefficient between ranked variables, in actual calculation, there are simpler calculation methods. Assume that the original data x i , y i has been arranged from large to small, put x’ i , y’ i as the location of the original x i , y i data after arrangement, then d i = x’ i −y ’i represents the difference of rank between x i , y i .
If there is no same rank, Spearman rank correlation coefficient can be expressed as:
(3) If the same rank exists, it is necessary to calculate Pearson’s linear correlation coefficient between ranks:
(4)
Step 2
Take absolute value. Because the correlation degree derived by the two algorithms may be positive or negative, but in fact the correlation degree is similar to the concept of “distance,” neither positive correlation nor negative correlation affects the judgment of the correlation size. Therefore, the correlation degree is taken as the absolute value to more clearly represent the correlation between variables. The formula is shown below.
(5)
Step 3
Data normalisation. As two different correlation analysis methods are used in this paper, the correlation values and derived from the two algorithms need to be normalised in order to obtain the final screening results. The normalisation algorithm used in this paper is (0, 1) normalisation and the formula is shown below.
(6)
Step 4
Assignment of weights. By comparing the magnitude and distribution of correlation under the two analysis methods, it is approximated that the screening process of the data set by Algorithm 1 (grey correlation analysis method) can obtain a higher correlation value. Therefore, a weight of 0.6 was assigned to sequence and a weight of 0.4 to sequence . By assigning weights, the final correlation degree sequence is obtained. The calculation formula is shown below.
(7)
Step 5
Sorting. The normalised variable data is sorted according to the magnitude of the correlation values to produce the top 20 most significant sub-descriptors for biological activity.
2.3 Data modelling
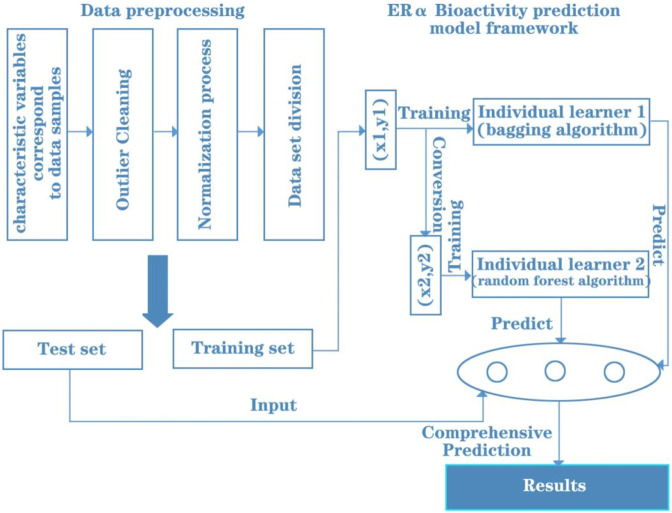
The 20 main variables (i.e., molecular descriptors) obtained from data processing were used to model the prediction of ERα biological activity by molecular descriptors of compounds. Data standardisation was first performed to achieve uniformity of magnitude. The dataset was then partitioned by K-fold cross-validation to achieve adequate use of the dataset to fit the prediction model. Finally, integrated learning is used to combine the Bagging and Random Forest algorithms through the Stacking method to build the entire prediction model framework. In summary, the immediate ERα bioactivity prediction model framework is shown in Figure 2.
FIGURE 2.
Framework of ERα bioactivity prediction model.
In order to make further classification predictions of the ADMET properties of the drug, the original 729 molecular descriptor variables were processed for data in this paper, and a total of 300 molecular descriptor variables were retained for data analysis. After normalizing the data, the data were subjected to model-based feature selection and FDR/FPR-based feature selection, respectively. After the two model selections, the classification models obtained from the two methods were placed into a voting machine to obtain the final model, and the entire prediction model framework was constructed. In summary, the classification prediction model framework for the five specific compound classes is shown in Figure 3.
FIGURE 3.
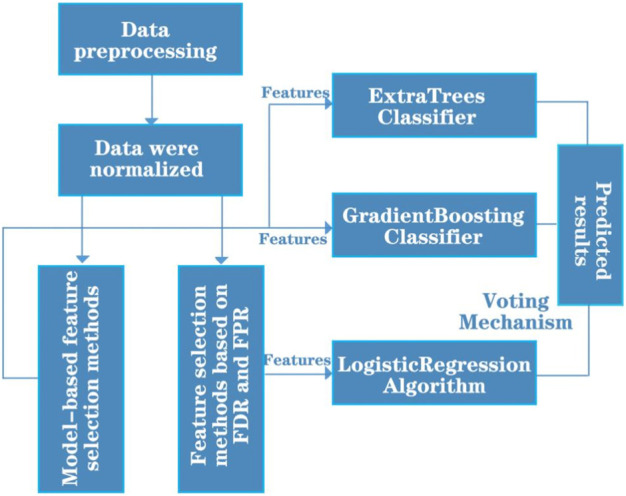
Schematic diagram of the classification prediction model framework.
2.4 Evaluation of the ERα bioactivity prediction model
For the ERα bioactivity prediction model, three evaluation metrics shown in Table 1 are used in this paper.
TABLE 1.
Evaluation metrics for regression problems.
| Full name | Abbreviations | Meaning |
|---|---|---|
| Mean squared error | MSE | Mean square error |
| Mear absolute error | MAE | Mean absolute error |
| Coefficient of determination | Decidability factor |
The mean squared error (MSE) reflects the degree of correlation between the independent and dependent variables; the MSE evaluates the degree of variation in the data.
Mean absolute error (MAE) is the average of the absolute errors and is often used to reflect the reality of the error in the predicted values.
This coefficient is often used to reflect the degree of reliability of changes in the dependent variable in a regression model. The higher the value, the better the predicted value fits the true value.
2.5 Evaluation of classification prediction models for ADMET properties of compounds
The experimental data was designed to reduce the rate of misclassification by drug developers, in order to ensure robustness. In this paper, five performance comparison metrics were selected: accuracy, precision, recall, F1 value, Cohen’s Kappa coefficient and ExtraTreesClassifier accuracy. The formulae for each evaluation metric are shown below.
The accuracy rate is calculated as shown in Table 2.
| (8) |
where TP is a positive example judged to be positive, FP is a negative example judged to be positive, TN is a negative example judged to be negative and FN is a positive example judged to be negative.
TABLE 2.
The 20 most significant sub-descriptors (i.e., variables) for biological activity.
| Molecular descriptors | Grey correlation | Spearman’s rank correlation coefficient | Normalised and weighted score values |
|---|---|---|---|
| MDEC-23 | 0.7997 | 0.5491 | 0.9999 |
| MLogP | 0.7943 | 0.5452 | 0.9872 |
| LipoaffinityIndex | 0.7954 | 0.5249 | 0.9707 |
| CrippenLogP | 0.7861 | 0.4738 | 0.9081 |
| SwHBa | 0.7895 | 0.4457 | 0.8883 |
| nC | 0.7641 | 0.4868 | 0.8821 |
| nT6Ring | 0.7809 | 0.4383 | 0.8668 |
| n6Ring | 0.7861 | 0.4281 | 0.8665 |
| BCUTp-1h | 0.7821 | 0.4329 | 0.8639 |
| SP-5 | 0.7764 | 0.4427 | 0.8631 |
| C2SP2 | 0.7686 | 0.4430 | 0.8499 |
| SP-6 | 0.7775 | 0.4201 | 0.8444 |
| ATSp4 | 0.7642 | 0.4444 | 0.8437 |
| ATSp2 | 0.7601 | 0.4443 | 0.8365 |
| ATSp5 | 0.7537 | 0.4514 | 0.8321 |
| ATSp3 | 0.7648 | 0.4296 | 0.8312 |
| maxsOH | 0.7460 | 0.4619 | 0.8284 |
| ATSp1 | 0.7550 | 0.4439 | 0.8274 |
| nHaaCH | 0.7632 | 0.4226 | 0.8221 |
| naaCH | 0.7632 | 0.4226 | 0.8221 |
The accuracy rate is calculated by the formula:
| (9) |
The recall is calculated as:
| (10) |
The F1 value is calculated using the formula:
| (11) |
The Cohen’s Kappa coefficient is calculated as:
| (12) |
Where, p 0 represents the observed compliance rate and p e represents the opportunity compliance rate.
2.6 ROC curve
Horizontal axis FPR: 1-TNR, 1-Specificity. The larger the FPR, the more actual negative classes in the predicted positive classes. Vertical axis TPR: Sensitivity. The larger the TPR, the more actual positive classes in the predicted positive classes. The closer the ROC curve is to the (0, 1) point, the more it deviates from the 45° diagonal, the better.
3 Results
3.1 Dataset description
The optimized modelling of anti-breast cancer drug candidates (2021) dataset provided by CCSA was used. The 729 molecular descriptors of 1974 compounds in it were used as dependent variables to find the molecular descriptors among them that could significantly affect ERα activity as feature variables for subsequent questions. Inevitably, there are some anomalies in the data used as dependent variables, which will interfere with the selection of the characteristic variables and have a collateral negative impact on the solution of the subsequent problem. For example, a large proportion of the numerical columns of the molecular descriptors have null (0) or almost null (0) values.
If there are too many null values, the data reliability of the variable will be low, and it is considered that the molecular descriptors corresponding to these data are unlikely to become feature variables and will waste arithmetic power in the subsequent screening of the feature vectors. Therefore, in this step, the numerator descriptors with 95% of the data items being null are eliminated. The data visualisation also revealed some outliers in the data, and a scatter plot of one of the columns is shown in Figure 4.
FIGURE 4.
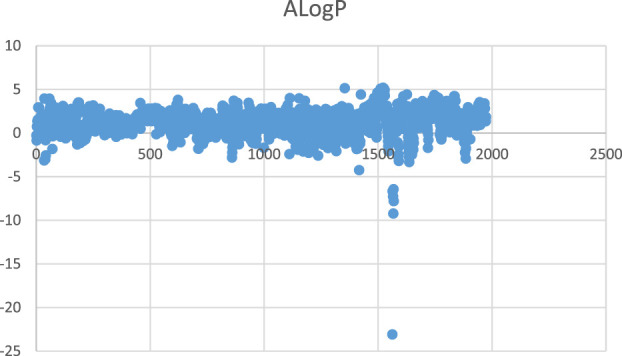
Scatter plot of ALogP.
The raw data was normalised and after noise and dimensionality reduction to form the experimental dataset. Using the KS test, the study found that the data samples did not satisfy a normal distribution, which in turn led to the use of an outlier treatment based on box plot analysis.
After sorting each column of data from smallest to largest, the interval between the values of the first and third quartiles is taken as the acceptable range, where the upper bound is the third quartile—IQR (IQR = third quartile–first quartile) and the lower bound is the first quartile—IQR, and numbers outside this value area are considered outliers. These outliers are taken to correspond to the element values, with outliers over the upper bound being taken to the upper bound and those over the lower bound being taken to the lower bound, otherwise they remain as they are. Then go back to Step 1 and clear the column with the higher number of null values. As shown in Figure 5.
FIGURE 5.
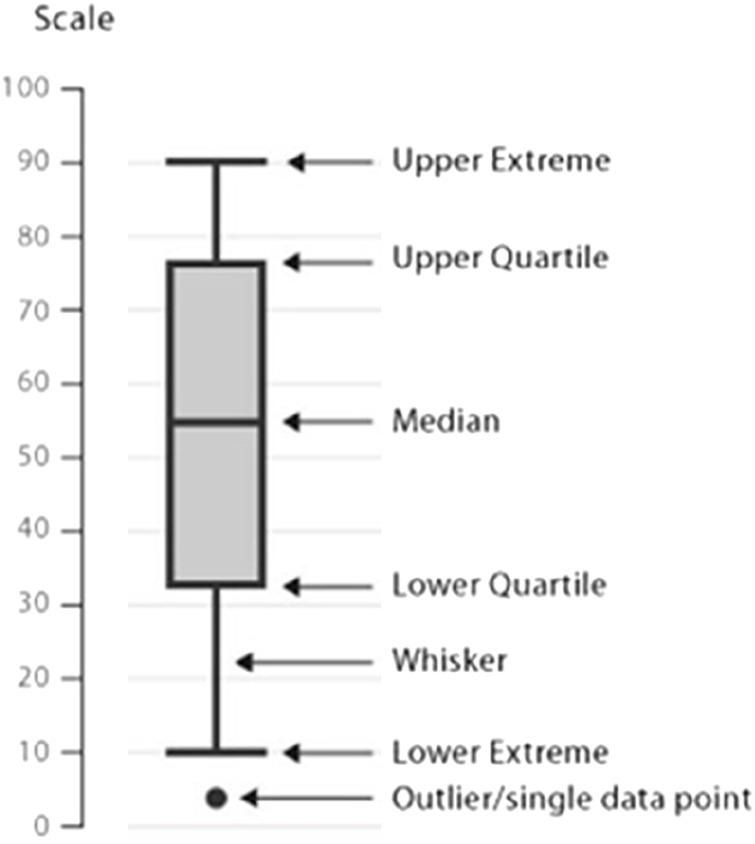
Schematic diagram of the box line diagram.
Through the above data processing, a total of 430 molecular descriptors were removed. The final 20 molecular descriptors (i.e., variables) with the most significant impact on bioactivity as a result of the dual feature screening combined optimisation method are shown in Table 3.
TABLE 3.
Descriptions of null-valued columns (e.g., nB).
| Count | 1974 |
|---|---|
| Mean | 0 |
| Std | 0 |
| Min | 0 |
| 25% | 0 |
| 50% | 0 |
| 75% | 0 |
| Max | 0 |
The results of the Spearman rank correlation coefficient processing for this study are shown in Figures 6, 7
FIGURE 6.
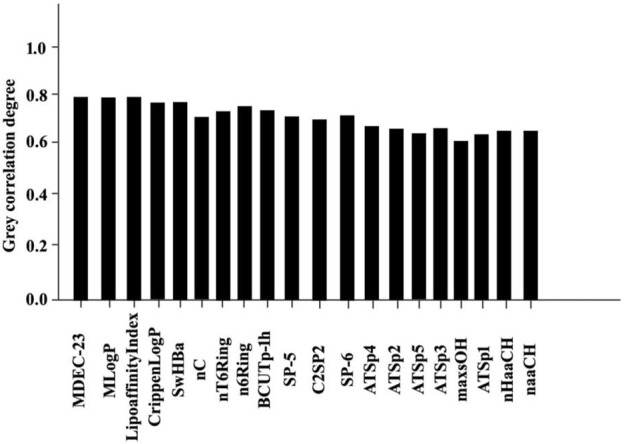
Statistical results of 20 bioactive molecules based on Grey correlation analysis.
FIGURE 7.
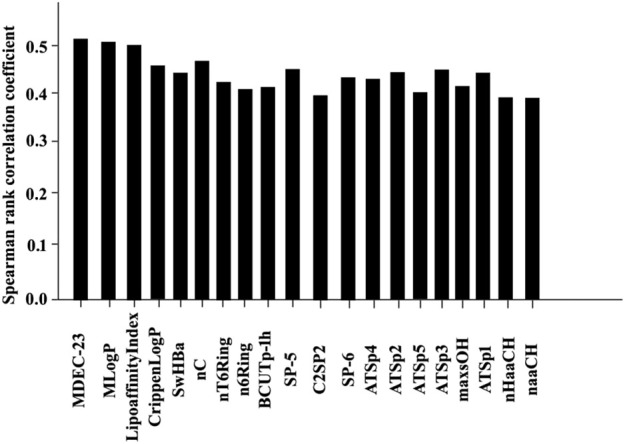
Statistical results of 20 bioactive molecules based on Spearman rank correlation coefficient analysis.
3.2 Data set variable screening combination optimisation
The 20 features derived from the dual feature screening combination optimisation method, Spearman’s algorithm and the grey correlation algorithm were substituted into the correlation regression model and the MAE, MSE and R2 were used to evaluate the advantages and disadvantages of the three methods. The table below shows the results of the above experiments. From the data in the table, it is analysed that the dual feature screening combination optimisation method used in this paper has better results. As shown in Table 4.
TABLE 4.
Evaluation data of the dual feature screening combination optimisation method.
| Weighted score | MAE | MSE | R2 |
|---|---|---|---|
| MLPRegressor | 1.3723 | 3.2465 | −0.6000 |
| GradientBoostingRegressor | 0.6828 | 0.8280 | 0.5900 |
| RandomForestRegressor | 0.6104 | 0.6873 | 0.6607 |
| AdaBoostRegressor | 0.8500 | 1.1100 | 0.4500 |
3.3 Model performance
3.3.1 ERα bioactivity prediction model evaluation
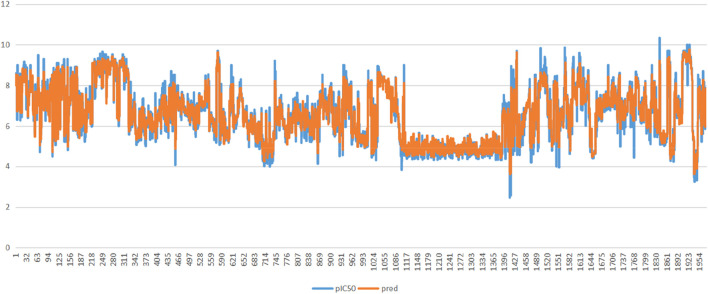
By analysing the various algorithm evaluation metrics, we found that the MLP performed poorly regardless of the metrics, and the r2 value of AdaBoostRegressor was consistently below 0.5, so it was also out of our selection range. The final model is the result of fusing the random forest and GradientBoostingRegressor after tuning the parameters through a grid search. As shown in Figure 8.
FIGURE 8.
Feature variables and pIC50 fit results.
The results in Table 5 show that the model after stacking performs better than the original two models in all three scoring metrics, and also that this model is realistic in the field of machine learning when the R2 value is greater than 0.7 and the fitted function is more realistic.
TABLE 5.
Evaluation metric values for each algorithm.
| MAE | MSE | R2 | |
|---|---|---|---|
| GradientBoostingRegressor | 0.6732 | 0.7927 | 0.6087 |
| RandomForestRegressor | 0.6180 | 0.6752 | 0.6600 |
| Stacking | 0.5940 | 0.6436 | 0.7002 |
3.3.2 Evaluation of classification prediction models for the ADMET properties of compounds
For the classification prediction models of the ADMET properties of compounds, the results of the evaluation of the five target value related classification models are given below. It can be seen that in most cases, the model set up in this paper prevails. Of course, the effect is not significant due to the inherently low scores of the initial models. As shown in Table 6.
TABLE 6.
Evaluation of classification models for each algorithm with CYP3A4 as the target value.
| Algorithms | Accuracy | Accuracy | Recall rate | F1 value | Cohen’s Kappa coefficient |
|---|---|---|---|---|---|
| LogisticRegression | 0.9367 | 0.9626 | 0.9529 | 0.9577 | 0.8321 |
| ExtraTreesClassifier | 0.9367 | 0.9564 | 0.9596 | 0.9580 | 0.8298 |
| RandomForestClassifier | 0.9468 | 0.9600 | 0.9697 | 0.9648 | 0.8560 |
| Integrated learning models based on Stacking methods | 0.9538 | 0.9668 | 0.9581 | 0.9634 | 0.8816 |
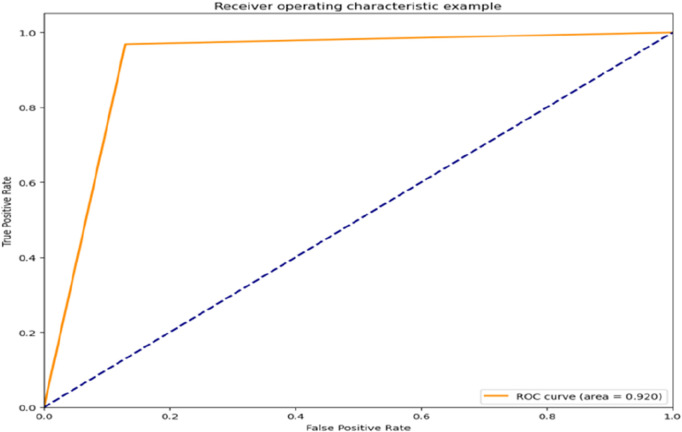
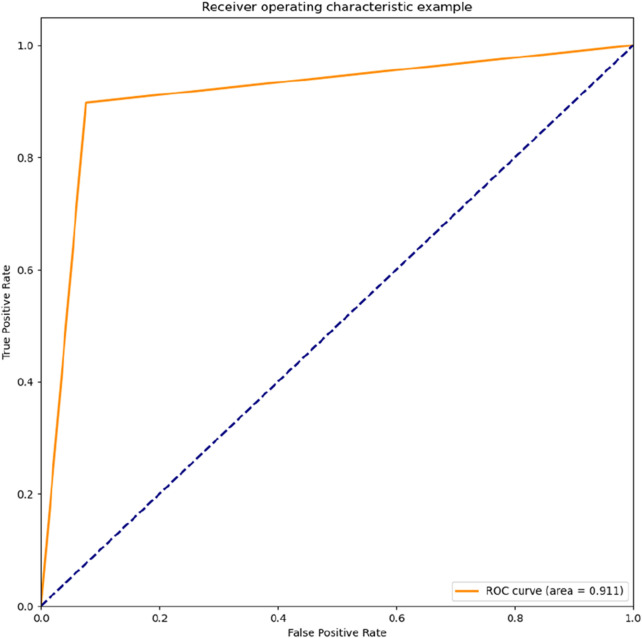
In the following results, the roc diagram about the two toxicity indicators is given. Figures 9, 10, it can be seen that the classification effect for these two indicators is good.
FIGURE 9.
Classification model roc curve with hERG as the target value.
FIGURE 10.
Classification model roc curve with MN as the target value.
The resulting three classification models were placed into the voting machine, which is the final model. Five final models were obtained on five validation sets with accuracy: 0.92,0.95,0.91,0.76,0.96; F1 values: 0.91,0.96,0.92,0.80,0.97 respectively.
4 Discussion
In today‘s society, breast cancer is the most common and lethal cancer and is the leading cause of cancer death in women (Desantis et al., 2015), and related studies have confirmed that breast cancer is genetically risky (Lilyquist et al., 2018). The expression of estrogen receptor ERα is closely related to the development of breast cancer, and this gene is involved in the proliferation and differentiation of breast cancer cells (Geng, 2016). Currently ERα is considered an important target for the treatment of breast cancer (Xu, 2018). Researchers have found that the ADMET module ensures that the corresponding compound becomes a candidate with good pharmacokinetic properties and safety (Dejun et al., 2018). Thus, machine learning can effectively reduce the cost of drug research and development and improve the stability and accuracy of prediction models (Wang et al., 2006). Scholars have determined that the optimal cut-off values for E2 and FSH in serum can assess CIA in breast cancer populations in southern China (Yang et al., 2022). Estrogen receptors alpha (ERα) in estrogen has been found to be an important target for the treatment of breast cancer (Chang et al., 2013).
We collected data on anti-breast cancer drug candidates provided by the China Association for Science and Technology, which provided 974 compounds (samples) and 729 molecular descriptors (variables) information. The dataset is therefore highly representative and generalizable. In this study, random forest algorithm and Bagging regression algorithm were used to construct a quantitative prediction model of ERα bioactivity by compounds, and two model selection features, ExtraTreesClassifier and GradientBoostingClassifier, were selected. According to the actual situation, taking into account the properties of target value, fdr-based method is adopted to improve F1 value in feature selection. At the same time, the feature selection method based on model also has high accuracy. Both vote to ensure the accuracy of the final model.
It is shown that the weighted scores obtained by grey correlation and Spearman coefficient are more suitable for the data distribution characteristics of anti-breast cancer candidates. In this study, 20 molecular descriptors with strong antagonistic effects were selected from 729 molecular descriptors. These are MDEC-23, MLogP, LipoaffinityIndex, etc. Random forest algorithm and Bagging regression algorithm were selected to construct the model, and then Stacking model fusion method was used to establish the prediction model framework. The model showed good performance in MAE, MSE and three scoring indexes after Stacking, and the predicted result value of the model on the validation set was 0.7, which proved that the model could accurately predict. According to the classification prediction model of ADMET properties of compounds, two feature selection methods were used to screen the features, and three classification models obtained by the two methods were placed into the voting machine to obtain high accuracy and F1 values. Therefore, the model established in this study is of great significance in assisting prediction of ERα biological activity and improving the development efficiency of specific drugs for breast cancer.
Despite the good results, there are limitations in this study. In future anti-breast cancer drug screening efforts, this study should attempt to collect more datasets for machine learning training, draw on expert opinion, and continuously optimise the feature generation tools to improve the accuracy and stability of the model. Through the interdisciplinary collaboration between machine learning and biopharmaceuticals, we can reduce the cost of pharmaceuticals, reduce the error rate of drug developers, and provide a reference for similar drug development work.
5 Conclusion
A quantitative prediction model for ERα bioactivity and a classification prediction model for ADMET properties of compounds were developed, which can assist in the development of specific drugs for breast cancer. With the high accuracy of the models, the cost of drug development and the rate of misclassification by developers can be effectively reduced.
Data availability statement
The original contributions presented in the study are included in the article/Supplementary Material, further inquiries can be directed to the corresponding author.
Author contributions
TA contributed to the conception of the study; YuC performed the experiment; YeC contributed significantly to analysis and manuscript preparation; LM and JW performed the data analyses and wrote the manuscript; JZ helped perform the analysis with constructive discussions.
Funding
Key R&D Plan of Changchun Science and Technology Bureau (21ZGM29), Jilin Province Disabled Accessibility Technology and Intelligent Device Innovation Team (20200301054RQ), Jilin Provincial Key Laboratory for Human Health Status Identification and Function Enhancement (20200601004JC), and Science and Technology Development Plan Project of Jilin Provincial Science and Technology Department (20200404207YY).
Conflict of interest
The authors declare that the research was conducted in the absence of any commercial or financial relationships that could be construed as a potential conflict of interest.
Publisher’s note
All claims expressed in this article are solely those of the authors and do not necessarily represent those of their affiliated organizations, or those of the publisher, the editors and the reviewers. Any product that may be evaluated in this article, or claim that may be made by its manufacturer, is not guaranteed or endorsed by the publisher.
Supplementary material
The Supplementary Material for this article can be found online at: https://www.frontiersin.org/articles/10.3389/fgene.2022.1087273/full#supplementary-material
References
- Ali S., Coombes R. C. (2002). Endocrine-responsive breast cancer and strategies for combating resistance. Nat. Rev. Cancer 2 (2), 101–112. 10.1038/nrc721 [DOI] [PubMed] [Google Scholar]
- Bolboaca S. D., Jäntschi L. (1900). Comparison of quantitative structure-activity relationship model performances on carboquinone derivatives. Sci. Worl. J. 9, 1148–1166. 10.1100/tsw.2009.131 [DOI] [PMC free article] [PubMed] [Google Scholar]
- Casteleiro-Roca J. L., Jove E., Gonzalez-Cava J. M., Mendez Perez J. A., Calvo-Rolle J. L., Blanco Alvarez F. (2020). Hybrid model for the ANI index prediction using Remifentanil drug and EMG signal. Neural comput. Appl. 32, 1249–1258. 10.1007/s00521-018-3605-z [DOI] [Google Scholar]
- Chang Y. H., Chen J. Y., Hor C. Y., Chuang Y. C., Yang C. B., Yang C. N. (2013). Computational study of estrogen receptor-alpha antagonist with three-dimensional quantitative structure-activity relationship, support vector regression, and linear regression methods. Int. J. Med. Chem. 2013, 743139. 10.1155/2013/743139 [DOI] [PMC free article] [PubMed] [Google Scholar]
- Dejun Y., Xiangcao Y., Chongyuan X., Shilin Z., Huang (2018). Molecular docking of uric acid-lowering activity and ADMET properties of small molecule compounds from red fennel. Chin. J. Clin. Pharmacol. 34 (23), 2750–2752+2777. 10.13699/j.cnki.1001-6821.2018.23.019 [DOI] [Google Scholar]
- Deng Z. L. (2013). Prediction of compound activity based on biorelation spectra and its web service implementation. Wuhan, China: Huazhong Agricultural University. Available at: https://kns.cnki.net/KCMS/detail/detail.aspx?dbcode=CMFD&dbname=CMFD201401&filename=1013336348.nh&v= . [Google Scholar]
- Desantis C. E., Bray F., Ferlay J., Lortet-Tieulent J., Anderson B. O., Jemal A. (2015). International variation in female breast cancer incidence and mortality rates. Cancer Epidemiol. Biomarkers Prev. 24 (10), 1495–1506. 10.1158/1055-9965.EPI-15-0535 [DOI] [PubMed] [Google Scholar]
- Ezugwu A. E., Shukla A. K., Agbaje M. B., Oyelade O. N., Jose-Garcia A., Agushaka J. O. (2021). Automatic clustering algorithms: A systematic review and bibliometric analysis of relevant literature. Neural comput. Appl. 33, 6247–6306. 10.1007/s00521-020-05395-4 [DOI] [Google Scholar]
- Fenglei L., Qiaoyu H., Ruofan X., Fang B. (2021). A deep learning-based approach to drug design. J. Nat. 43 (5), 383–390. [Google Scholar]
- Fu D., Mo K., Deng W., Zhao Y., Ding Q., Hong S., et al. (2022). Application value of machine learning method in measuring gray matter volume of AIDS patients. Dis. Markers 2022, 1210002. 10.1155/2022/1210002 [DOI] [PMC free article] [PubMed] [Google Scholar]
- Geng C. (2016). Mechanisms of curcumin promotion of tamoxifen sensitivity in ER alpha-negative breast cancer. Jinan, China: Shandong University. Available at: https://kns.cnki.net/KCMS/detail/detail.aspx?dbcode=CDFD&dbname=CDFDLAST2016&filename=1016203756.nh&v= . [Google Scholar]
- Guo Y., Luo M., Xing R. (2022). A knowledge discovery-oriented approach to drug ADMET intelligence prediction. Intell. Sci., 1–14. [Google Scholar]
- Hu S. (2019). Research on mining and prediction of drug interactions data. Hefei, China: Anhui University. Available at: https://kns.cnki.net/KCMS/detail/detail.aspx?dbcode=CDFD&dbname=CDFDLAST2019&filename=1019130317.nh&v= . [Google Scholar]
- Huang B., Warner M., Gustafsson J. Å. (2015). Estrogen receptors in breast carcinogenesis and endocrine therapy. Mol. Cell. Endocrinol. 418, 240–244. 10.1016/j.mce.2014.11.015 [DOI] [PubMed] [Google Scholar]
- Jiang D., Lei T., Wang Z., Shen C., Cao D., Hou T. (2020). ADMET evaluation in drug discovery. 20. Prediction of breast cancer resistance protein inhibition through machine learning. J. Cheminform. 12 (12), 16. 10.1186/s13321-020-00421-y [DOI] [PMC free article] [PubMed] [Google Scholar]
- Lempereur M., Majewska C., Brunquers A., Wongpramud S., Valet B., Janssens P., et al. (2016). Tetrahydro-iso-alpha acids antagonize estrogen receptor alpha activity in MCF-7 breast cancer cells. Int. J. Endocrinol. 2016, 9747863. 10.1155/2016/9747863 [DOI] [PMC free article] [PubMed] [Google Scholar]
- Li X. (2021). Research on the mechanism of action of antitumor drugs based on deep learning. University of Chinese Academy of Sciences, Shanghai Institute of Pharmaceutical Sciences, Chinese Academy of Sciences. Available at: https://kns.cnki.net/KCMS/detail/detail.aspx?dbcode=CDFD&dbname=CDFDLAST2021&filename=1021609355.nh&v= . [Google Scholar]
- Lilyquist J., Ruddy K. J., Vachon C. M., Couch F. J. (2018). Common genetic variation and breast cancer risk—past, present, and future. Cancer Epidemiol. Biomarkers Prev. 27 (4), 380–394. 10.1158/1055-9965.EPI-17-1144 [DOI] [PMC free article] [PubMed] [Google Scholar]
- Matsson P., Englund G., Ahlin G., Bergström C. A. S., Norinder U., Artursson P. (2007). A global drug inhibition pattern for the human ATP-binding cassette transporter breast cancer resistance protein (ABCG2). J. Pharmacol. Exp. Ther. 323, 19–30. 10.1124/jpet.107.124768 [DOI] [PubMed] [Google Scholar]
- Mohla S., Stearns V., Sathyamoorthy N., Rosenfeld M. G., Nelson P. (2009). The biology of hormone refractory breast and prostate cancer: An NCI workshop report. Cancer Biol. Ther. 8 (21), 1975–1985. 10.4161/cbt.8.21.9918 [DOI] [PubMed] [Google Scholar]
- Samuel Y., Garg A., Mulugeta E. (2021). Synthesis, DFT analysis, and evaluation of antibacterial and antioxidant activities of sulfathiazole derivatives combined with in silico molecular docking and ADMET predictions. Biochem. Res. Int. 2021, 7534561. 10.1155/2021/7534561 [DOI] [PMC free article] [PubMed] [Google Scholar]
- Singh S., Das S., Pandey A., Paliwal S., Singh R. (2013). Quantitative structure activity relationship studies of topoisomerase I inhibitors as potent antibreast cancer agents. J. Chem. 2013, 1–9. 10.1155/2013/849793 [DOI] [Google Scholar]
- Suh K. H., Lee E. C. (2017). Contactless physiological signals extraction based on skin color magnification. J. Electron. Imaging 26 (6), 1. 10.1117/1.jei.26.6.063003 [DOI] [Google Scholar]
- Sun J., Liu B., Wang R., Yuan Y., Wang J., Zhang L. (2022). Computation-based discovery of potential targets for rheumatoid arthritis and related molecular screening and mechanism analysis of traditional Chinese medicine. Dis. Markers 2022, 1905077. 10.1155/2022/1905077 [DOI] [PMC free article] [PubMed] [Google Scholar]
- Tjoa E., Guan C. (2021). A survey on explainable artificial intelligence (XAI): Toward medical XAI. IEEE Trans. Neural Netw. Learn. Syst. 32 (11), 4793–4813. 10.1109/TNNLS.2020.3027314 [DOI] [PubMed] [Google Scholar]
- Wang Z., Rao H., Li Z. (2006). Machine learning approach for the prediction model of selective cyclooxygenase-2 inhibitor activity. Chem. Res. Appl. (11), 1317–1321. [Google Scholar]
- Xu H., Zheng Q., Zhu J., Xie Z., Cheng H., Li P., et al. (2022). A deep learning model incorporating knowledge representation vectors and its application in diabetes prediction. Dis. Markers 2022, 7593750. 10.1155/2022/7593750 [DOI] [PMC free article] [PubMed] [Google Scholar]
- Xu Z. W. (2018). Molecular mechanism of CHES1 affecting breast cancer proliferation by regulating ERα activity. Dalian, China: Dalian University of Technology. Available at: https://kns.cnki.net/KCMS/detail/detail.aspx?dbcode=CDFD&dbname=CDFDLAST2019&filename=1019006898.nh&v= . [Google Scholar]
- Yang L., Li R., Yu M., Huang F., Zeng J., Lu Y., et al. (2022). Determining the optimal cut-off values of serum E2 and FSH for evaluating the menopausal status of breast cancer patients in a southern Chinese population. Dis. Markers 2022, 8716160. 10.1155/2022/8716160 [DOI] [PMC free article] [PubMed] [Google Scholar]
- Yaqin Q., Yulan X., Mengyuan L., Jinrui W., Jiming X. (2022). Predictive modeling of ADMET properties of anti-breast cancer active compound. Natural Science Edition. J. Yunnan Univ., 1–8. [Google Scholar]
- Ye X., Zhou J., Tong D., Wang D., Wang H., Guo J., et al. (2022). E2F1 affects the therapeutic response to neoadjuvant therapy in breast cancer. Dis. Markers 2022, 8168517. 10.1155/2022/8168517 [DOI] [PMC free article] [PubMed] [Google Scholar] [Retracted]
- Zheng G., Shi L., Liu J., Zhao Y., Du F., He Y., et al. (2022). Registered trials of artificial intelligence conducted on chronic liver disease: A cross-sectional study on ClinicalTrials.gov. Dis. Markers 2022, 6847073. 10.1155/2022/6847073 [DOI] [PMC free article] [PubMed] [Google Scholar] [Retracted]
Associated Data
This section collects any data citations, data availability statements, or supplementary materials included in this article.
Supplementary Materials
Data Availability Statement
The original contributions presented in the study are included in the article/Supplementary Material, further inquiries can be directed to the corresponding author.


