

Summary
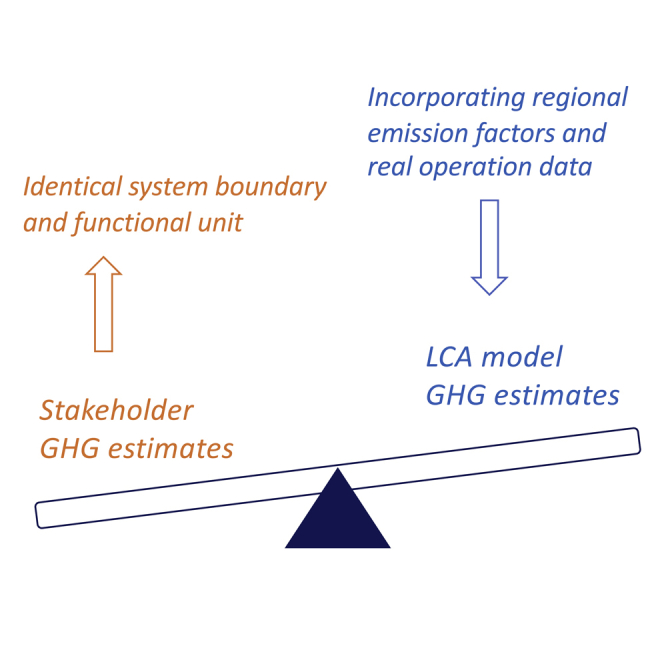
There has been a notable disagreement between life cycle GHG emission estimates reported by research communities and key energy sector stakeholders as many LCA models are not validated against real operation data. This is originated from lack of collaboration and knowledge exchange between model developers and company experts. We present a pragmatic procedure for engaging company experts to advance the assumptions, models, and information used in an open-source LCA simulator (OPGEE). Using real operation and local emission factor data, two oil sands SAGD fields GHG emissions are compared rigorously against the scope 1 and 2 reported emissions. By introducing consistent region-specific input data, system boundaries, and assumptions, OPGEE carbon intensity estimates are within 1%–5% of reported data by companies. The system boundary expansion (e.g., expanding from direct emissions to also include offsite emissions from natural gas co-production, diluent source emission) impacts the GHG intensities estimates for both fields.
Subject areas: Energy Resources, Energy modeling, Environmental Science
Graphical abstract
Highlights
-
•
Demonstrating a successful partnership between LCA model developers and stakeholders
-
•
Validation of SAGD operation LCA model for GHG estimates with real operation data
-
•
System boundary inconsistency as the key source of discrepancies/disputes in LCA
-
•
Key to incorporate regional assumptions/emission factors for accurate assessment
Energy Resources, Energy modeling, Environmental Science
Introduction
Life cycle assessment (LCA) has become an emerging decision-making methodology to assess and compare greenhouse gas (GHG) emissions (or carbon intensity – CI) of different conventional and unconventional energy systems. LCA outcomes are recognized as foundation of performance-oriented policies—e.g., US West Coast/British Columbia low carbon fuel standard,1,2 EU fuel quality directive,3 and a nationwide Canada fuel quality standard—to quantify and regulate atmospheric carbon footprint of different fuel types. LCA is a core methodological approach for stakeholders to assess their process performance and to strategize future mitigation practices. In a climate-constrained world, financial institutions are also interested to gauge carbon risk of their project candidates via LCA to minimize climate-related financial risk associated with investments.4,5 Therefore, improving robustness of LCA models and accuracy of result estimates are essential.
One very important missing piece in many LCA models is the absence of model validation and verification with real operational data. This is mainly due to lack of transparency and access to publicly available data because of collaboration and knowledge exchange absence between model developers (mostly academic, consulting, and research & development affiliates) and stakeholders’ experts. This lack of engagement is due to several different reasons that exploring them is not the subject of this work, but the collaboration lack has caused disagreements and disputes regarding the magnitude of GHG emissions of different energy facilities in scientific and professional communities. Development and implementation of LCA-oriented public regulations have motivated stakeholders and model developers to fill this engagement gap.
In oil and gas sector, Oil Production Greenhouse Gas Emissions Estimator (OPGEE)6,7,8 has become a well-known open-source LCA simulator used by academic research groups, companies, financial institutions, thinktanks, and energy agencies.9,10,11,12,13 OPGEE is an engineering-based bottom-up LCA simulator based on integration of several rigorous sub-models to cover and estimate atmospheric GHG emissions associated with almost any type of crude oil extraction technology, and processing and transportation to the refinery gate (well-to-refinery). OPGEE has provided GHG and energy intensity insight on varying scales and resolutions, from a country-wide level down to specific well sites.14,15,16,17 Although performance of some of OPGEE’s sub-models are already validated (e.g., drilling and hydraulic fracturing model17), it is of great importance to further examine the performance of OPGEE’s other sub-models and total CI estimates against real operating data.
For crude oil production from Canadian oil sands resources in particular, numerous previous studies have specifically analyzed GHG footprints from Canadian oil sands operations.18,19,20,21,22,23,24 These studies utilize different models/tools with different assumptions, e.g., on the system boundary, emissions allocation, emission factors, etc. However, one typical limitation of these studies is that the model utilized generic/simplified assumptions that are not necessarily representative of the region-specific and real operating conditions.9,25 The uniqueness of unconventional crude sources has also resulted in conventional GHG estimation methods being inadequate in estimating and projecting Canada’s GHG emissions from oil sands wells.26
Therefore, validation of GHG emissions estimates from oil sands industry is of great interest. Canada’s unconventional oil sands are a significant contributor to the global fuel supply, and its size is projected to grow. In 2018, Canada’s production of petroleum and other liquid fuels increased by more than 0.3 million bbl/d to 5.3 million bbl/d. Crude oil (including condensate) accounted for 4.3 million bbl/d while biofuels, natural gas (NG), and other natural gas liquids (NGL) accounted for 1 million bbl/day.27 Producing 2.9 million bbl/d in 2018, crude derived from oil sands is the fastest-growing resource of the Canadian oil industry.28 For most of 2019, oil sands accounted for approximately 55 billion CAD$/month in gross domestic product, slightly higher than oil and gas.29 Canada federal government expects oil sands production to increase by 55% by 2040 compared to 2018 and reach 4.5 million bbl/d.27
The expansion of Canadian oil production has resulted in higher emissions of GHGs, with Canada’s overall GHG being 700–730 MT CO2eq. (megatonnes of carbon dioxide equivalent) from 2011–2019. Emissions from the oil and gas industry has increased from 153 (2011) to 191 MT CO2eq. (2019).30 Canada, along with other nations concerned with the potential impacts of anthropogenic climate change, has implemented different carbon emission reduction programs to incentivize lowering GHG emissions by companies. Most of these initiatives use a market-based policy design such as Alberta’s Technology Innovation and Emissions Reduction Regulation (TIER) and its predecessors Carbon Competitiveness Incentive Regulation (CCIR) and Specific Gas Reporting Regulation (SGER). Large emitters, such as those operating oil sands-based sites, must lower their emissions to meet benchmarks set by the program or purchase technology fund credits. The proceeds of technology fund credits purchases collected by government are then used to invest in low-carbon technologies.31 Companies may also remit Alberta-based carbon offset credits from facilities that do not have a compliance obligation under TIER (e.g., renewable electricity generation) or emissions performance credits from other regulated facilities that have exceed their compliance obligation under TIER.32 Companies participating in these programs rely on accurate measurements and models of carbon emissions to evaluate the impact of process changes and emerging technologies. These measurement and reporting programs are prescribed by national and subnational governments and align with UN international GHG reporting frameworks.33 All emissions reports are independently verified to a reasonable level of assurance by an accredited verification body.34 Thus, a consistent bank of dataset is established to examine if open-source LCA tools can reproduce stakeholders’ reported emissions.
Here, we present a pragmatic way for engaging company experts to enhance the employed assumptions and models for LCA (see Figure 1). This work offers the chance to assess the robustness of OPGEE LCA models to estimate GHG intensities of two Cenovus Energy Inc. oil sands in situ (steam-assisted gravity drainage – SAGD) facilities (i.e., Foster Creek [FC] and Christina Lake [CL]), and to inform and improve these models where appropriate. SAGD accounted for 38% of Canada’s raw bitumen production in 2018 at 1.2 million bbl/d and is predicted to increase to 50% of total production by 2035.25 With OPGEE’s modules giving a quantified breakdown of the emissions of each process, the output of the model can be used to identify areas that need improvement. This study can therefore serve as a template for other SAGD operations. The presented successful collaborative effort will also improve discourse about contentious agreements (e.g., inconsistencies in LCA results and stakeholder emissions estimates) that can be utilized to further informed dialog.11 This work also represents an example for policy makers on how to engage research entities with stakeholders to improve LCA models for further decision-making practices, and stakeholders’ reporting data to governments (see Figure 1).
Figure 1.

Synergistic interactions between stakeholder, LCA model developer, and policy/decision-maker
Results and discussions
Year 2015 results
Here, all presented results are based on reference year 2015 (see Figures S5, S6, S7 and S8 for year 2018 and 2019 results). Figures 2 and 3 present FC and CL GHG emissions results using Cenovus input data and modified version of OPGEE. For each figure, the left-hand side stacked bar shows WTR direct and indirect emissions estimated by OPGEE, whereas the middle bar only illustrates part of OPGEE emission estimates based on the scope of reporting emissions in SGER (i.e., direct emissions and electricity generation credits). The right-hand side stacked bar shows the company reported data to government based on SGER.
Figure 2.

2015 Foster Creek upstream GHG emissions and comparison with SGER reported data
Figure 3.

2015 Christina Lake upstream GHG emissions and comparison with SGER reported data
The modified OPGEE and SGER net life cycle emission results for FC and CL are in good agreement and within 0.5% and 8.1% of each other, respectively. The negative elements of the bars in Figure 2 are associated with GHG credit for FC on-site electricity generation via turbine. There is no on-site electricity generation for CL in 2015. The OPGEE estimated net power generated for FC is 1,538.4 MWh/d, whereas the SGER reported data are 1,545.6 MWh/d which are in good agreement.
Fuel combustion emissions during bitumen production that are mainly originated from natural gas combustion during steam generation are the major direct source of GHG emissions. These emissions are underestimated in OPGEE for both FC and CL in situ fields. This could be due to several operational assumptions and design differences between OPGEE models and Cenovus steam gen. facilities. OPGEE models are not calibrated by incorporating additional waste heats from different process units. OPGEE combustion (or production) emissions estimate could be improved by improving the corresponding sheets (e.g., Steam Generation sheet) with additional real operation data. OPGEE 2.0 steam generation can also be modeled more rigorously by incorporating additional components (e.g., economizer, air preheater, and blowdown water treatment which is modeled as waste in the current version), and validation based on operation data. It should be noted that OPGEE version 3.0 steam generation models are under improvement by collaborating with the oil sands industry (see OPGEE 3.0 user guide for more details35).
One of the major indirect (or offsite) sources of emission with high uncertainty which is not covered in SGER reporting is related to the diluent that is blended with the produced bitumen. The added diluent results in high GHG emissions contribution (dark blue in left hand bar chart) (see sensitivity analysis). Unlike many other global oil fields (see Masnadi et al.14 Figure S20), the surface processing GHG emissions are low for both Cenovus fields due to very low gas production rates from these two fields.
A major discrepancy is observed between the OPGEE-estimated venting, flaring, and fugitive VFF emissions and SGER-reported data (light blue in Figures 2 and 3) that could be due to the fact that OPGEE 2.0 venting & fugitive emissions are mainly estimated based on emission factors from the ARB survey data which are not representative of all operation practices in oil industry. A more methodological, rigorous, and global treatment of venting & fugitives emissions is under development in OPGEE version 3.0.35,36,37 In addition, all major process units of Cenovus facilities are equipped with VRUs. Cenovus facility licenses (granted by the AER) also prohibit routine venting. However, the company does not have an accurate estimate of “percentage of total vents and fugitives recovered” (which is needed in OPGEE as an input data in Venting & Fugitives sheet). Therefore, this parameter is kept as 0% (OPGEE default) and VRU is only considered for the dehydrator unit resulting in overestimation of VFF emissions. Additional sensitivity analysis is performed to understand the effect of “percentage of total vents and fugitives recovered” on the VFF and life cycle GHG emissions results (see sensitivity analysis). Results for year 2018 and 2019 follow the same trend and are discussed in Figures S5, S6, S7, and S8.
Figure 4 shows the impact of input data on upstream GHG emissions using Cenovus input data that the company’s engineers provided and the data used in the study by Masnadi et al.14 Original OPGEE with no modification is used for all cases. The FC and CL corresponding results are in close agreement revealing a good data quality in the work by Masnadi et al.14 The FC Cenovus results are higher than Masnadi et al. estimates mainly due to higher reported steam-to-oil ratio (SOR) by Cenovus, whereas the CL Cenovus results are lower than Masnadi et al. estimates mainly due to lower flaring-to-oil ratio reported by Cenovus.
Figure 4.

Impact of input data on upstream GHG emissions of FC and CL fields by using Cenovus data and the data used in Masnadi et al.14 study
Original OPGEE with no modification is used for all cases.
The study by Masnadi et al.14 was conducted in a global scale and incorporating regional-specific secondary inputs was not possible (due to lack of operation data) and was out of the scope of that work. Figure 5 examines that to what extent modifications made in OPGEE based on local factors (e.g., Alberta’s electricity grid mix, see Tables 1 and 2 in the STAR∗Methods) and Cenovus operation data affect the GHG emissions results relative to the original OPGEE 2.0 used in the study by Masnadi et al.. Using modified OPGEE, results for both FC and CL fields are >10% lower mainly due to less drilling emissions as Cenovus drilling operations are fully electrified, and lower production emissions as multiple secondary parameters (e.g., pump efficiency, well head pressure, electricity as prime mover, steam quality, etc.) are changed in the modified OPGEE version (see method details for more details).
Figure 5.

Comparison between upstream GHG emissions estimates using original OPGEE and modified OPGEE based on Alberta’s regional and Cenovus operation data
The input data for all runs are provided by Cenovus. The “∗” symbol in the x axis refers to the results generated by the modified version of OPGEE.
Table 1.
Electricity mix and efficiencies
| Electricity type | Displaced electricity |
Purchased grid electricitya |
||
|---|---|---|---|---|
| Power Mix (%) | Efficiency (%) | Power Mix (%) | Efficiency (%) | |
| Biomass | 0 | 22.1 | 2.6 | 22.1 |
| Coal | 0 | 36 | 50.70 | 36 |
| Natural Gas | 100 | 50.1 | 39.50 | 50.1 |
| Nuclear | 0 | 100 | 0 | 100 |
| Renewables | 0 | 100 | 6.81 | 100 |
| Oil | 0 | 34.5 | 0.39 | 34.5 |
Alberta’s grid mix.
Table 2.
Indirect emission factors for electricity exported and imported
| Indirect emission factors | Grid transmission efficiency, % | |
|---|---|---|
| Electricity exported, tonne CO2eq./MWh | 0.418a and 0.37b | 93.5 |
| Electricity imported, tonne CO2eq./MWh | 0.696c | 93.5 |
For year 2015 based on SGER.
For year 2018 and 2019 based on CCIR.
Alberta grid-average emissions intensity derived from.59
Considering OPGEE well-to-refinery system boundary (direct and indirect emissions, see section Methods details), Figure 6 combines multiple results in order to compare the environmental impacts of FC and CL fields in different years. In addition, GHG estimates of both fields in 2015 by applying the low-end diluent emission factor based on the sensitivity analysis (see sensitivity analysis) are presented as the best-case scenarios (last four stacked bars in Figure 6). The first six stacked bar charts show the WTR carbon intensities of FC and CL in 2015, 2018, and 2019 by combining the SGER/CCIR-reported direct emissions with other sources of emissions that are out of the scope of SGER/CCIR but are covered by OPGEE. It is evident that the CI of FC and CL is increased from 2015 to 2019 mainly due to higher SOR, and partly due to jump in flaring rates in 2019. The OPEE/OPGEE∗-labeled four stacked bar charts summarize FC and CL 2015 GHG emissions by using Cenovus input dataset, one time with the original version of OPGEE used in Masnadi et al. publication,14 and one time with the updated version of OPGEE (shown as OPGEE∗) based on regional/Cenovus data. Clearly, the results by using OPGEE∗ are in better agreement with the first two stacked bar charts revealing that OPGEE can make reliable estimates if its sub-models are supported by regional and real operation data. The last four stacked bar charts are best-case GHG estimates of FC and CL fields based on assuming the low-end diluent emission factor of 6.4 g CO2eq./MJ (reported by Senobari38). Under these best-case scenarios, the total life cycle GHG emissions are 24% and 29% lower than corresponding OPGEE∗ estimates for CL and FC, respectively.
Figure 6.

Direct and indirect emissions: summary of upstream GHG emissions based on combination of reported data to government and OPGEE estimates, OPGEE estimates, and OPGEE estimates based on low-end diluent emission factor
In the x axis, “OPGEE” refers to original version of OPGEE used in Masnadi et al. publication,14 whereas “OPGEE∗” refers to the modified version of OPGEE based on regional/Cenovus data.
Figure 7 compares actual scope 1 and 2 Cenovus emissions data at FC and CL in 2015, 2018, and 2019 with the OPGEE estimates (adjusted to reflect a comparable life cycle boundary with SGER/CCIR) of FC and CL. Since SGER/CCIR scope 1 and 2 emissions reporting is based on the amount of bitumen produced (no diluent blending is included), the functional unit is changed from MJ of diluent produced to MJ of bitumen produced.
Figure 7.

Direct emissions: summary of upstream GHG emissions based on SGER/CCIR scope 1 and 2, and comparison with OPGEE estimates
In the x axis, “OPGEE” refers to original version of OPGEE used in Masnadi et al. publication,14 whereas “OPGEE∗” refers to the modified version of OPGEE based on regional/Cenovus data.
The net electricity debit/credit is calculated by subtracting the MWh of electricity imported from the MWh of electricity exported. As shown in Figure 7, FC and CL are net electricity exporters for some years. It is again evident that the direct GHG emission of FC and CL is increased from 2015 to 2019 mostly due to higher combustion emissions associated with steam generation. The modified version of OPGEE net life cycle emissions estimates are in good agreement with scope 1 and 2 Cenovus emissions.
Sensitivity analysis
The sensitivity analysis result based on 2015 input data on WTR parameters of FC and CL are presented in Figures 8 and 9, respectively. Following the two recent studies,11,39 the sensitivity analysis parameters are classified as parameter uncertainty (uncert.) or variability (var.) (see Figures 8 and 9 y axis label). Uncertainty reflects a lack of data, whereas, variability refers to the assessment inherent heterogeneity of data.40 Note that electricity sensitivity analysis was not performed for CL as no electricity was generated on-site in 2015 at CL facility.
Figure 8.

Sensitivity analysis for Foster Creek field WTR GHG emissions
Figure 9.

Sensitivity analysis for Christina Lake field WTR GHG emissions
As both FC and CL fields blend the extracted raw bitumen with considerable amount of diluent, the natural gas supply indirect emission factor has the highest influence on the estimated life cycle CIs, shown in Figures 8 and 9. The uncertainty associated with NG supply emission factor should be reduced by further region-specific and supply path-specific research work.
Closing remarks
Here, we aimed to show how industry partnership, transparency, and data sharing could improve LCA discussions and address origins of discrepancies. This study presents atmospheric emissions results for two oil sands in situ projects with the operation data that reflect the facility and local region. The presented study clearly illustrated how LCA tools can be improved by real industry operating data and region-specific consideration. While OPGEE can make estimates based on generic defaults which are insightful and can capture the major sources of GHG emissions, the tool’s estimates are improved by incorporating Cenovus and Alberta’s data in OPGEE’s sub-models. We showed that when region- and project-specific input data, system boundaries, and defaults are aligned, OPGEE generates CI estimates that are within 1%–5% of reported data by the stakeholder. However, when the system boundary is expanded to include indirect emissions (i.e., to also include offsite emissions from indirect activities associated with natural gas production, electricity and diluent supply, and LUC), upstream CIs for both FC and CL oil fields can increase significantly (in some cases, >100% when non-operational emissions are considered), but the uncertainty associated with a wide-boundaries LCA also increase significantly. Thus, this collaborative work clearly demonstrates the importance of the system boundary in LCA and complete transparency that is needed for public reporting of industrial emissions.
There are still some major sources of uncertainties in assessing non-operational GHG emissions from in situ projects. For example, as shown above, diluent supply indirect emissions have major contribution in the total life cycle GHG emissions out of Cenovus’s facilities. While the condensate (diluent) emission factor that is employed in this work is derived from the U.S. Department of Energy’s Argonne National Laboratory’s GREET model, Cenovus’s condensate is not exclusively supplied from the U.S. Canada has seen significant increases in NGL production in the Montney (with methane reduction regulations in place in Alberta). In addition, their diluent gets recycled through refinery, so assuming using fresh condensate is not accurate. The rigor and transparency of the current Canadian natural gas/NGL supply CI estimates are currently inadequate, and additional meticulous research work is needed to further validate these estimates.
It is important to note that to be consistent in comparison, as a regional upstream NG GHG intensity be employed for the oil sands in global crude GHG intensity estimates, regional upstream data should also be used for all other global oil fields as each region has its own operation specifications and regional context. Similar to the study performed on global CI of crude oil production,14 the presented work clearly identifies the need of regional/global estimate of life cycle GHG emissions of natural gas and condensates supply.
The collaborative work with Cenovus to better portray the region-specific operation should be expanded to other major industrial players in Canada and internationally in order to have a more accurate assessment of GHG emissions from oil and gas upstream operations.
Limitations of the study
As discussed above, natural gas (diluent representative) emission factor has the major impact on the GHG emissions estimation of oil sands facilities. This work was limited by using literature data on regional natural gas production GHG emissions. Further market analysis should be performed to identify the major sources of oil sands diluent supply. Subsequently, OPGEE should be utilized to estimate regional field-level natural gas production carbon intensity by employing region-specific data.
STAR★Methods
Key resources table
| RESOURCE | SOURCE | IDENTIFIER |
|---|---|---|
| Software and algorithms | ||
| Mohammad S. Masnadi (m.masnadi@pitt.edu) | https://github.com/arbrandt/OPGEE/tree/master/model | |
| Deposited data | ||
| Cenovus Inc. | Data S1 | |
Resource availability
Lead contact
Further information and requests for resources should be directed to and will be fulfilled by the lead contact, Mohammad S. Masnadi (m.masnadi@pitt.edu).
Materials availability
All materials needed are presented in the manuscript.
Method details
Principles
We followed the principles and approaches guideline taken by Chen et al.39 in the presented study: 1) using transparent data and assumptions; 2) maintaining the research team independence; 3) operational insights from stakeholder are shared and considered in the study; 4) regular interaction between the research team and company experts to ensure assumptions used are consistent with the realities on the ground (see Figure 1).
Detail project objectives
OPGEE uses two classes of data for its assessment: primary data that are entered in the main input sheet, and secondary data that are inserted in multiple back-sheets. Primary data (see Data S1) include mainly reservoir and surface production parameters (e.g., crude API gravity, gas production rate, etc.) that have the main impact on the energy intensities associated with different crude extraction operations. The secondary data are associated with more detailed assumptions on underlying models (e.g., pump efficiency, turbine type, etc.).
Here, we follow the approach taken by Sleep et al.11 supported by AlbertaInnovates39 to validate LCA models based on real operation data. We first compare OPGEE estimates using company provided primary data with the results presented by Masnadi et al.14 in a peer-reviewed comprehensive global study using a combination of public and commercial datasets. We take this as a Reference case. Next, we modify OPGEE back-sheet defaults (secondary input data) and models based on specific operation data and process configuration of Cenovus fields, and regional considerations (e.g., Alberta atmospheric temperature, electricity grid mix, etc.). Finally, we compare the modified OPGEE output estimates, to Cenovus’s GHG emissions reported to the Alberta regulator and the federal government in Canada (see Data S1) for the two in-situ oil sands facilities and analyze the differences between OPGEE estimates and emissions reported to the government agencies. We also perform a sensitivity analysis on the upstream emissions results by varying some major input parameters.
Oil sands facilities
Upstream GHG intensities from two Cenovus Energy Inc. oil sands fields, Foster Creek (FC) and Christina Lake (CL) were examined. Both fields use SAGD-technology for in-situ bitumen extraction in AB Canada. FC is located about 330 km northeast of Edmonton Alberta and began as a pilot project in 1997. In 2001 it was the first commercial field to use SAGD for bitumen extraction in an oil sands field. The oil at FC is about 450 m below the surface. while CL is located approximately 120 km southeast of Fort McMurray. Construction of pilot project at CL began in 2000 and first production occurred two years later. The oil at CL is about 375 m underground. Here, the analysis is based on 2015, 2018, and 2019 operation years.41
LCA simulator
The life cycle GHG intensities of each field are generated using OPGEE version 2.06, an open-source engineering-based field-specific model. Contrary to top-down LCA models that use macroeconomic data,42,43,44,45 OPGEE is a bottom-up tool and therefore, it can explain fundamental physical drivers of energy consumption and emissions from oil field facilities. Bottom-up models require intensive data as input parameters are not readily available in public literature. This necessitates inputs and actual data from operators in order to maximize the accuracy of OPGEE estimates.
OPGEE makes estimates of emissions intensities using up to 50 parameters as input data for each modeled oil field. OPGEE includes emissions from exploration, drilling & development, production & extraction, surface processing, maintenance, waste disposal, and crude transport. OPGEE estimates emissions using engineering models of production methods (e.g., steam flooding), reservoir properties (e.g., pressure and temperature), fluid properties (e.g. crude density), processing practices (e.g., application of acid wet gas removal for associated gas processing), and crude oil transportation (e.g. via ocean tanker or pipeline). See the user guide for more details on physical models of each process stage.35
Most OPGEE default inputs for the oil sands pathways (SAGD, mining employing paraffinic froth treatment, and mining employing naphthenic froth treatment) were taken from Alberta Energy Regulator (AER) statistical reports and Canada’s Oil Sands Innovation Alliance (COSIA) mine templates. OPGEE’s crude upgrading was developed based on the Oil Sands Technologies Upgrading Model (OSTUM46).
Steam generation for thermal oil recovery is modeled using these technologies: via once-through steam generators (OTSG), and steam and electricity co-production via combination of gas turbine and heat recovery steam generator (HRSG), and via solar thermal technology.35 For reference year 2015, a combination of OTSG and HRSG is employed for FC, whereas only OTSG is used for CL oil fields. For year 2018 and 2019, a combination of OTSG and HRSG are used for both fields.
Canadian SAGD operations OPGEE default data are taken from a variety of public sources. By using the COSIA template (Base case, warm lime softening – OTSG)47 (see user guide6). “When the template does provide the required data, we supplement that data with AER company reported data including statistical reports47 and in-situ performance presentations47 and expert feedback when no public data is available”.6
GHG intensity
In this work, “GHG intensities” and “carbon intensities (CIs)” are equivalent terminologies. GHGs included in this work are: CO2, CO, CH4, N2O, and non-methane volatile organic compounds (NMVOCs) to all air receptacles. GHGs are converted to CO2eq. using the following global warming potential (GWP) factors: The reference case results presented here (i.e., original OPGEE) are based on pulse emissions over a 100-year time frame – AR5/GWP100 (without carbon feedback)48 as Masnadi et al.14 study was originally based on AR5. As the reported data to the Alberta government (Specified Gas Emitters Regulation – SGER, and Carbon Competitiveness Incentive Regulation – CCIR) are based on the Fourth Assessment Report of the IPCC,49 the OPGEE modified version results are presented based on pulse emissions over 100-year time frame – AR4/GWP100.
Life cycle co-product accounting
Two main methods exist for accounting the energy use/emissions of fields with co-products (i.e. electricity, NG, NGLs, upgraded process gas, diesel, residual fuel, and petroleum coke). Two methods of co-product displacement and Allocation by energy6,50 can be used in OPGEE. Since most of the regulatory reporting documents (e.g., SGER) and available datasets (e.g. the U.S. Argonne National Laboratory’s GREET model) use co-product displacement as their default method to deal with co-products emissions debits or credits, this method is used by default in this work.
Data source & availability
OPGEE Primary input data for both FC and CL oil fields (see Data S1) are extracted from publicly available company reports (i.e., AER ST60 and ST53, annual In-Situ Performance Presentations – ISPP). These data are cross checked and verified by the company. Additional supplemental primary data are obtained by Cenovus (see Data S1). The primary input data are used for both OPGEE original and modified runs.
As OPGEE default setting uses generic assumptions that do not account for regional variability, its secondary inputs are modified to Alberta region-specific values, where appropriate. These data are related to more detailed parameters of OPGEE back-sheets. The secondary input data are received by consulting with Cenovus engineers. These data are only used for the results associated with the modified version of OPGEE (see Data S1).
System boundary
Different system boundaries can be used for life cycle production and usage of petroleum driven hydrocarbons (see Figure S1). There are several LCA study examples that come up with different estimates for life cycle emissions of a similar system mainly due to considering different system boundaries. The presented life cycle OPGEE results are based on WTR system boundary (see Figure S1).
LCA functional unit
The original functional unit (or unit of analysis) in OPGEE 2.0 for oil sands is 1 MJ (or bbl) of dilbit (i.e., a blend of bitumen and diluent) delivered to the refinery entrance gate (see Figure S1). For the cases where only the estimated OPGEE direct emissions are compared with Cenovus reported emissions (based on SGER and/or CCIR), the functional unit is 1 MJ (or bbl) of bitumen extracted.
Direct & indirect emissions
Direct emissions are generated on-site, whereas indirect emissions are released offsite but are associated with the on-site operation. Both direct and indirect (or offsite or fuel cycle) emissions are accounted in OPGEE, as follows: 1) On-site fuels combustion emissions (e.g., natural gas combustion for SAGD steam generation units); 2) Indirect emissions debit (or credit) associated with electricity import (or export), diluent import, natural gas import, etc.; 3) Land use change (LUC) emissions; 4) Methane venting, flaring, and fugitive (VFF) emissions. These emissions are reported as part of drilling & development emissions in OPGEE. 5) Embodied emissions originated from the oilfield infrastructure materials (e.g., steel for injection wells). Embodied emissions are reported as part of offsite emissions in OPGEE.
Alberta Specified Gas Emitters Regulation (SGER) and Carbon Competitiveness Incentive Regulation (CCIR)51 are focused on scope 1 and 2 emissions only, and not scope 3 (which indirect diluent emissions would be included). Thus, the company reported emissions to the Albertan government (SGER and CCIR) only include direct on-site stationary fuel combustion and corresponding VFF emissions (see Data S1), as well as deemed GHG emissions from electricity generation (emissions credit). The embodied emissions are excluded in Masnadi el al.14 work and therefore, they are also ignored in this work and the presented results.
Default values of OPGEE direct and indirect emissions factors are used for the original OPGEE runs. These emission factors are gathered from GREET1_2016 model52 (see Table S1). Different electricity emission factors are used for the modified version of OPGEE (see Method details).
Emissions intensities estimates for Canadian natural gas supply (indirect emissions factors in Table S1) vary widely in the literature. The life cycle GHG intensities of both FC and CL are highly sensitive to the natural gas indirect emission factor as both fields blend the extracted bitumen with diluent, and the fact that natural gas supply emission factor is used to account for the diluent supply. Different values between 6,224.8-14,032.2 g CO2eq./mmBtu are reported for Canadian national average, western Canadian, and shale gas from Canadian fields.53,54,55,56 The challenge is that there are very limited references for Canada-specific NG CI. IHS Markit reports that in total about 55% of oil sands diluent demand is met by domestically produced condensate and about 15% is met by imported condensate. The balance of non-condensate diluent demand, about 125,000 b/d in 2019, is supplied by imports from the United States.57 For this work we followed Sleep et al.11 approach to use an upstream natural gas indirect emission factor of 6752.3 g CO2eq./mmBtu (LHV) (or 6.4 g CO2eq./MJ) from Senobari38 for local natural gas emission factor in western Canada. See sensitivity analysis for the effect of this emission factor on the WTR GHG emissions.
Heating values
The low heating value of dilbit is calculated based on the heating values of the produced bitumen and diluent and volume fraction of diluent in the blend:
See Table S2 and Table S3 and for heating value of crude oil and gaseous components.
Electricity grid mix
OPGEE electricity mix is modified to follow Alberta’s grid mix using 2015 Alberta Utilities Commission reported data58 (see Table 1). Both OPGEE and Carbon Competitiveness Incentive Regulation (CCIR)51 assume that the exported electricity to the Alberta grid displaces electricity generated by combined natural gas cycle power plant (see Table 1).
Indirect electricity emission factors: As shown in Table 2, exported and imported electricity indirect emissions factors are modified in OPGEE to represent Alberta’s region-specific fuel cycle.
Land use change
Drilling and development results in land use impacts, which can release biogenic carbon from disturbed ecosystems and soils.60 A reduced time frame modified version of land use change (LUC) emissions estimates from Yeh et al.60 for oil sands are included in original OPGEE 2.0 model (see emission factors in Tables S2 and S3). Moderate crude ecosystem carbon richness and field development intensity are assumed for the original OPGEE results presented in this work.
However later using remote sensing technique, Yeh et al.61 explored the historical and potential land use change of oil sands industry in Canada for oil sands mines and in situ projects (see Figures S2 and S3). Low end and high-end LUC emissions estimates on a per MJ of bitumen produced are presented for in-situ fields. The original OPGEE LUC model is modified by adopting LUC emissions reported by Yeh et al.61 for Christina Lake oil field. Yeh et al. estimated LUC impacts from the entire lifetime of the project for Christina Lake is between 0.56 and 0.94 g CO2eq./MJ bitumen extracted. Here, an estimated average of 0.75 g CO2eq./MJ is used for both Cenovus Foster Creek and Christina Lake oil fields. This is much lower than the original average LUC emissions (1.26 g CO2eq./MJ) employed in OPGEE based on Yeh et al.60
We used one of the most developed LUC emission data available in literature for this work. However, LUC emissions are highly uncertain in LCA studies. It is believed that the LUC impact data sources used in this work are several years old and might not represent recent efforts by the Canadian oil sands industry (e.g., to increase bitumen recovery rates and reduce the impacted land area and the tailings ponds).39 In addition, Cenovus operation is not a mining operation and does not include tailing ponds. Hence, the LUC emissions are likely overestimated in this work. As such, a wide range of emissions intensities are included in the sensitivity analysis to reflect the LUC impact uncertainties (see sensitivity analysis).
Surface processing units
The produced associated gas is processed in a selected gas processing path in OPGEE, where the user can select from eight gas processing paths to simulate a variety of field conditions and production choices6 (Figure S4 shows a simplified depiction of the associated gas processing paths in OPGEE containing four main branches). Both FC and CL oil fields use dehydrator and H2S removal facilities as their surface processing units to treat the produced associated gas. Cenovus’s fields use liquid triethylene glycol (TEG) desiccant as their dehydration method. A similar glycol dehydrator unit is modeled and used as default in OPGEE 2.0 (see OPGEE user guide6).
For the H2S removal, Cenovus’s fields employ non-regenerative H2S scavengers using Triazine non-regenerative scavenger recovery units (NRSU). Traizine is the reaction result of an amine, MEA in this case and Formaldehyde. The NRSU is a continuous gas flow contactor and the chemical is injected in continuous basis and removed based on the efficiency of H2S removal with continuous removal flow. The NRSU is a single stage chemical package, and the spent chemistry (the reacted byproduct) is blended with methanol and disposed off via deep well disposal in 1B class wells. However, the original version of OPGEE 2.0 only includes regenerative H2S (and CO2) removal units (amine-based process using MEA, DGA, DEA, DEA-High Load, MDEA) which is likely more energy and emissions intensive due to regeneration of aqueous alkanolamine solution. A combination of Dehydrator + Amine Process (Associated Gas Processing Path #3 in OPGEE Inputs sheet) is selected for the presented results that the original version of OPGEE 2.0 is used. In the modified version of OPGEE, a new non-regenerative H2S path is modeled and added in the Surface Processing sheet using Cenovus H2S removal unit process specifications and process flow diagram. The major sources of emissions out of Cenovus NRSU are from: 1) chemical, methanol, and circulation pumps electricity consumption; 2) spent chemicals heater natural gas consumption; 3) methanol fuel cycle emissions: the methanol supply indirect GHG emissions are estimated based on methanol production from natural gas feedstock which is estimated to be 20.9 g CO2eq./MJ.62 The environmental impacts associated with the spent chemical are not accounted in this work.
Drilling & development
OPGEE drilling energy consumption estimates are based on volume of diesel consumed. However, Cenovus drilling operations are fully powered by electricity (based on Cenovus data). Hence, the original OPGEE estimated total daily amount of diesel consumed (in mmBtu) is converted to equivalent daily electricity consumed (in kWh), and GHG emission associated with the estimated consumed electricity is included in the modified version of OPGEE.
Venting & fugitives
The default venting and fugitives emission factors for OPGEE 2.0 are generated from the California Air Resources Board (CARB) survey data.63 These defaults represent the average case in California, hence, in some instances they might not be a good representation of the level of venting and fugitives in Canada. This is particularly true where practices and environmental regulations are significantly different than California regulations. These default settings can be modified by the user to reflect changes in equipment condition, practices, and environmental regulations.6 For original runs, no vapor recovery unit (VRU) is incorporated, whereas for modified runs, VRU emission factors are included for dehydrator venting and fugitive emissions estimation. A sensitivity analysis is also performed to explore the impact of percentage of total vents and fugitives recovered on the life cycle GHG emissions of both fields (see sensitivity analysis).
Modified version of OPGEE
As discussed above, inputs are modified to Alberta-specific and Cenovus-specific values, where appropriate. Here is a summary of changes made in the modified version of OPGEE in order to estimate FC and CL WTR emissions more accurately: 1) GWP based on AR4; 2) Secondary input data of OPGEE back sheets; 3) Electricity grid mix and indirect electricity emission factors; 4) LUC emissions based on the most recent available data for CL field; 5) Vapor recovery units are added for venting and fugitive emissions; 6) Drilling electrification.
Quantification and statistical analysis
All presented quantifications are based on the developed open-source simulator (i.e., OPGEE). Additional sensitivity analysis is performed to study the impact of the key parameters on the final result estimates.
ACKNOWLEDGMENTS
Work at the University of Pittsburgh on this project was primarily funded by Cenovus Energy. Some co-authors are employed by industry. Every effort was made to maintain independence and accuracy in this work. Industry collaborations were vital to obtaining and accurately analyzing the detailed oilfield data used in this study.
Author contributions
M.S.M. led the project and conducted the entire analysis and documentation. K.M. helped to frame and edit the manuscript and improved the introduction section. J.F. and T.T. provided the company data and constructive feedbacks over the course of the project and during manuscript preparation.
Declaration of interests
There are no competing interests.
Published: February 17, 2023
Footnotes
Supplemental information can be found online at https://doi.org/10.1016/j.isci.2022.105859.
Supplemental information
Data and code availability
-
•
Code location: OPGEE can be accessed publicly at: https://github.com/arbrandt/OPGEE/tree/master/model.
-
•
OPGEE is an open-source simulator and no access code is required.
-
•
Any additional information required to reanalyze the data reported in this paper is available from the lead contact upon request.
References
- 1.California Environmental Protection Agency/Air Resources Board Low Carbon Fuel Standard (LCFS) https://www.arb.ca.gov/fuels/lcfs/lcfs.htm
- 2.Government, B. 2021. BC Renewable & Low Carbon Fuel Requirements Regulation.https://www2.gov.bc.ca/gov/content/industry/electricity-alternative-energy/transportation-energies/renewable-low-carbon-fuels [Google Scholar]
- 3.European Union . 2021. EU Fuel Quality Directive.https://ec.europa.eu/clima/eu-action/transport-emissions/fuel-quality_en [Google Scholar]
- 4.Baron R., Fischer D. Organ. Coopération Développement Économiques(OECD); 2015. Divestment and Stranded Assets in the Low-Carbon Transition. [Google Scholar]
- 5.Caldecott B.L., McDaniels J. Smith School of Enterprise and the Environment, University of Oxford; 2014. Stranded Generation Assets: Implications for European Capacity Mechanisms, Energy Markets and Climate Policy. [Google Scholar]
- 6.El-Houjeiri H.M., Masnadi M.S., Vafi K., Duffy J., Brandt A.R. Stanford University; 2017. Oil Production Greenhouse Gas Emissions Estimator OPGEE v2.0a, User Guide & Technical Documentation. [Google Scholar]
- 7.California Air Resources Board . 2017. LCFS Crude Oil Lifecycle Assessment.https://www.arb.ca.gov/fuels/lcfs/crude-oil/crude-oil.htm [Google Scholar]
- 8.OPGEE . 2021. The Oil Production Greenhouse Gas Emissions Estimator.https://eao.stanford.edu/opgee-oil-production-greenhouse-gas-emissions-estimator [Google Scholar]
- 9.Israel B., Gorski J., Lothian N., Severson-Baker C., Way N. Pembin. Inst; 2020. The Oilsands in a Carbon-Constrained Canada.https://www.pembina.org/pub/oilsands-carbon-constrained-canada [Google Scholar]
- 10.Bošković B., Leach A. Leave it in the ground? Oil sands development under carbon pricing. Can. J. Econ. 2020;53:526–562. [Google Scholar]
- 11.Sleep S., Dadashi Z., Chen Y., Brandt A.R., MacLean H.L., Bergerson J.A. Improving robustness of LCA results through stakeholder engagement: a case study of emerging oil sands technologies. J. Clean. Prod. 2021;281:125277. [Google Scholar]
- 12.Guo J., Orellana A., Sleep S., Laurenzi I.J., MacLean H.L., Bergerson J.A. Statistically enhanced model of oil sands operations: well-to-wheel comparison of in situ oil sands pathways. Energy. 2020;208:118250. [Google Scholar]
- 13.Raimi D. Resources for the Future; 2021. Mapping County-Level Exposure and Vulnerability to the US Energy Transition. [Google Scholar]
- 14.Masnadi M.S., El-Houjeiri H.M., Schunack D., Li Y., Englander J.G., Badahdah A., Monfort J.C., Anderson J.E., Wallington T.J., Bergerson J.A., et al. Global carbon intensity of crude oil production. Science. 2018;361:851–853. doi: 10.1126/science.aar6859. [DOI] [PubMed] [Google Scholar]
- 15.Masnadi M.S., Brandt A.R. Climate impacts of oil extraction increase significantly with oilfield age. Nat. Clim. Chang. 2017;7:551–556. [Google Scholar]
- 16.Masnadi M.S., Benini G., El-Houjeiri H.M., Milivinti A., Anderson J.E., Wallington T.J., De Kleine R., Dotti V., Jochem P., Brandt A.R. Carbon implications of marginal oils from market-derived demand shocks. Nature. 2021;599:80–84. doi: 10.1038/s41586-021-03932-2. [DOI] [PubMed] [Google Scholar]
- 17.Brandt A.R., Masnadi M.S., Englander J.G., Koomey J., Gordon D. Climate-wise choices in a world of oil abundance. Environ. Res. Lett. 2018;13:044027. [Google Scholar]
- 18.Brandt A.R. Variability and uncertainty in life cycle assessment models for greenhouse gas emissions from Canadian oil sands production. Environ. Sci. Technol. 2012;46:1253–1261. doi: 10.1021/es202312p. [DOI] [PubMed] [Google Scholar]
- 19.Bergerson J.A., Kofoworola O., Charpentier A.D., Sleep S., MacLean H.L. Life cycle greenhouse gas emissions of current oil sands technologies: surface mining and in situ applications. Environ. Sci. Technol. 2012;46:7865–7874. doi: 10.1021/es300718h. [DOI] [PubMed] [Google Scholar]
- 20.Brandt A.R. Department of Energy Resources Engineering, Stanford University; 2011. Upstream Greenhouse Gas (GHG) Emissions from Canadian Oil Sands as a Feedstock for European Refineries. [Google Scholar]
- 21.Cai H., Brandt A.R., Yeh S., Englander J.G., Han J., Elgowainy A., Wang M.Q. Well-to-wheels greenhouse gas emissions of Canadian oil sands products: implications for US petroleum fuels. Environ. Sci. Technol. 2015;49:8219–8227. doi: 10.1021/acs.est.5b01255. [DOI] [PubMed] [Google Scholar]
- 22.Charpentier A.D., Bergerson J.A., MacLean H.L. Understanding the Canadian oil sands industry’s greenhouse gas emissions. Environ. Res. Lett. 2009;4:014005. [Google Scholar]
- 23.Charpentier A.D., Kofoworola O., Bergerson J.A., MacLean H.L. Life cycle greenhouse gas emissions of current oil sands technologies: GHOST model development and illustrative application. Environ. Sci. Technol. 2011;45:9393–9404. doi: 10.1021/es103912m. [DOI] [PubMed] [Google Scholar]
- 24.Lattanzio R.K. Congressional Research Service; 2012. Canadian Oil Sands: Life-Cycle Assessments of Greenhouse Gas Emissions. [Google Scholar]
- 25.Canada Energy Regulator . Supplement: Oil Sands Production; 2018. Canada’s Energy Futures. [Google Scholar]
- 26.Liggio J., Li S.-M., Staebler R.M., Hayden K., Darlington A., Mittermeier R.L., O’Brien J., McLaren R., Wolde M., Worthy D., Vogel F. Measured Canadian oil sands CO 2 emissions are higher than estimates made using internationally recommended methods. Nat. Commun. 2019;10:1863–1869. doi: 10.1038/s41467-019-09714-9. [DOI] [PMC free article] [PubMed] [Google Scholar]
- 27.U.S. Energy Information Administration (EIA Excutive Production Summary. https://www.eia.gov/international/analysis/country/CAN
- 28.U.S. Energy Information Administration (EIA Short-term Energy Outlook. https://www.eia.gov/outlooks/steo/report/global_oil.php
- 29.Canadian Energy Research Institute . 2020. Economic Recovery Pathways for Canada’s Energy Industry: Part 2 - Canadian Crude Oil and Natural Gas.https://ceri.ca/assets/files/Study_192B_Full_Report.pdf [Google Scholar]
- 30.Government of Canada Greenhouse Gas Emissions. https://www.canada.ca/en/environment-climate-change/services/environmental-indicators/greenhouse-gas-emissions.html
- 31.ERA Emissions Reduction Alberta. https://eralberta.ca/about-era/
- 32.Alberta government (2020) Emissions Management and Climate Resilience Act. http://extwprlegs1.fao.org/docs/pdf/al77679.pdf
- 33.Alberta Government . 2021. Alberta Greenhouse Gas Quantification Methodologies. Version 2.https://open.alberta.ca/publications/alberta-greenhouse-gas-quantification-methodologies [Google Scholar]
- 34.Alberta Government . 2020. Standard for Validation, Verification and Audit. Version 5.https://open.alberta.ca/publications/standard-for-validation-verification-and-audit-version-5#detailed [Google Scholar]
- 35.Masnadi M., El-Houjeiri H., Rutherford J., Chen Y., Vafi K., Perrier P., Duffy J., Brandt A. 2019. Oil Production Greenhouse Gas Emissions Estimator OPGEE v3.0a, User Guide & Technical Documentation.https://github.com/arbrandt/OPGEE/tree/master/documentation [Google Scholar]
- 36.OPGEE . 2019. Oil Production Greenhouse Gas Emissions Estimator Version 3.0 (OPGEE 3.0)https://github.com/arbrandt/OPGEE [Google Scholar]
- 37.Rutherford J.S., Sherwin E.D., Ravikumar A.P., Heath G.A., Englander J., Cooley D., Lyon D., Omara M., Langfitt Q., Brandt A.R. Closing the methane gap in US oil and natural gas production emissions inventories. Nat. Commun. 2021;12:4715–4812. doi: 10.1038/s41467-021-25017-4. [DOI] [PMC free article] [PubMed] [Google Scholar]
- 38.Senobari Vayghan E. Master’s Thesis, University of Calgary; 2016. Greenhouse Gas Emissions from Natural Gas Development in Western Canada: A Gap Analysis. [Google Scholar]
- 39.Chen Y., Dadashi Z., Sleep S., Brandt A., MacLean H., Bergerson J. Alberta Innov; 2019. Life cycle analysis (LCA) of GHG emissions of oil sands reference facilities and emerging technologies.https://albertainnovates.ca/app/uploads/2021/01/LCA-Oil-Sands-Final-Report-December-10th-2019.pdf [Google Scholar]
- 40.EPA Uncertainty and Variability. https://www.epa.gov/expobox/uncertainty-and-variability#faq1
- 41.Cenovus Energy Oil Sands. https://www.cenovus.com/operations/oilsands.html
- 42.Gagnon N., Hall C., Brinker L. A preliminary investigation of energy return on energy investment for global oil and gas production. Energies. 2009;2:490–503. [Google Scholar]
- 43.Guilford M.C., Hall C.A., O’Connor P., Cleveland C.J. A new long term assessment of energy return on investment (EROI) for US oil and gas discovery and production. Sustainability. 2011;3:1866–1887. [Google Scholar]
- 44.Cleveland C. Net energy from the extraction of oil and gas in the United States. Energy. 2005;30:769–782. [Google Scholar]
- 45.Court V., Fizaine F. Long-term estimates of the global energy-return-on-investment (EROI) of coal, oil, and gas global productions. Ecol. Econ. 2017;138:145–159. [Google Scholar]
- 46.Pacheco D., MacLean H.L. Tech. Report. Univ. Toronto; 2016. Oil sands technology upgrading model (OSTUM) model documentation. [Google Scholar]
- 47.COSIA . Can. Oil Sands Innov. Alliance; 2014. COSIA in Situ Reference Facility - SAGD. [Google Scholar]
- 48.Myhre G., Shindell D., Bréon F.-M., Collins W., Fuglestvedt J., Huang J., Koch D., Lamarque J.-F., Lee D., Mendoza B., et al. In: Climate Change 2013: The Physical Science Basis. Contribution of Working Group I to the Fifth Assessment Report of the Intergovernmental Panel on Climate Change. Stocker T.F., Qin D., Plattner G.-K., Tignor M., Allen S.K., Boschung J., Nauels A., Xia Y., Bex V., Midgley P.M., editors. Cambridge University Press; 2013. Anthropogenic and natural radiative forcing. [Google Scholar]
- 49.Pachauri R.K., Reisinger A. IPCC; 2007. IPCC Fourth Assessment Report. [Google Scholar]
- 50.Wang M., Huo H., Arora S. Methods of dealing with co-products of biofuels in life-cycle analysis and consequent results within the US context. Energy Pol. 2011;39:5726–5736. [Google Scholar]
- 51.Alberta Government Alberta Government Carbon Competitiveness Incentive Regulation. https://www.alberta.ca/carbon-competitiveness-incentive-regulation.aspx
- 52.Wang M. Cent. Transp. Res. Argonne Natl. Lab. Argonne; 2016. Greenhouse Gas, Regulated Emissions, and Energy Use in Transportation (GREET) Model, Version GREET1_2016 Fuel Cycle Model. [Google Scholar]
- 53.Liu R.E., Ravikumar A.P., Bi X.T., Zhang S., Nie Y., Brandt A., Bergerson J.A. Greenhouse gas emissions of western Canadian natural gas: proposed emissions tracking for life cycle modeling. Environ. Sci. Technol. 2021;55:9711–9720. doi: 10.1021/acs.est.0c06353. [DOI] [PubMed] [Google Scholar]
- 54.Sapkota K., Oni A.O., Kumar A. Techno-economic and life cycle assessments of the natural gas supply chain from production sites in Canada to north and southwest Europe. J. Nat. Gas Sci. Eng. 2018;52:401–409. [Google Scholar]
- 55.Shale Gas Update for Ghgenius . 2011. S&T2 Consult. (S&T)2 Consult. Inc.https://ghgenius.ca/reports/ShaleGasUpdateFinalReport.pdf [Google Scholar]
- 56.GHGenius v5.0e . 2019. S&T2 Consult. (S&T)2 Consult. Inc.https://ghgenius.ca/index.php/downloads/45-ghgenius-5-0e [Google Scholar]
- 57.IHS Markit . S&P Global; 2021. Canadian Oil Sands Diluent Demand: A 750,000 B/d Market.https://ihsmarkit.com/research-analysis/canadian-oil-sands-diluent-demand.html [Google Scholar]
- 58.AUC . Alberta Utiities Commission; 2015. Alberta Electric Energy Generation (GWH) by Resource.http://www.auc.ab.ca/Shared Documents/2015CapGenInterchange.pdf [Google Scholar]
- 59.Alberta Government . Alberta Government; 2018. Electricity Grid Displacement Factor Draft Discussion Paper. [Google Scholar]
- 60.Yeh S., Jordaan S.M., Brandt A.R., Turetsky M.R., Spatari S., Keith D.W. Land use greenhouse gas emissions from conventional oil production and oil sands. Environ. Sci. Technol. 2010;44:8766–8772. doi: 10.1021/es1013278. [DOI] [PubMed] [Google Scholar]
- 61.Yeh S., Zhao A., Hogan S.D., Brandt A.R., Englander J.G., Beilman D.W., Wang M.Q. 2015. Past and Future Land Use Impacts of Canadian Oil Sands and Greenhouse Gas Emissions. [Google Scholar]
- 62.Ellis J., Svanberg M. 2018. SUMMETH--Sustainable Marine Methanol Deliverable D5. 1 Expected Benefits, Strategies, and Implementation of Methanol as a Marine Fuel for the Smaller Vessel Fleet. [Google Scholar]
- 63.Lee S. Calif. Environ. Prot. Agency, Air Resour. Board; 2011. Oil and Gas Industry Survey Results: Draft Report. [Google Scholar]
Associated Data
This section collects any data citations, data availability statements, or supplementary materials included in this article.
Supplementary Materials
Data Availability Statement
-
•
Code location: OPGEE can be accessed publicly at: https://github.com/arbrandt/OPGEE/tree/master/model.
-
•
OPGEE is an open-source simulator and no access code is required.
-
•
Any additional information required to reanalyze the data reported in this paper is available from the lead contact upon request.