

Summary
Cancer prognosis prediction is critical to the clinical decision-making process. Currently, the high availability of transcriptome datasets allows us to extract the gene modules with promising prognostic values. However, the biomarker identification is greatly challenged by tumor and patient heterogeneity. In this study, a framework of three subnetwork-based strategies is presented, incorporating hypothesis-driven, data-driven, and literature-based methods with informative visualization to prioritize candidate genes. By applying the proposed approaches to a head and neck squamous cell cancer (HNSCC) transcriptome dataset, we successfully identified multiple HNSCC-specific gene modules with improved prognostic values and mechanism information compared with the standard gene panel selection methods. The proposed framework is general and can be applied to any type of omics data. Overall, the study demonstrates and supports the use of the subnetwork-based approach for distilling reliable and biologically meaningful prognostic factors.
Subject areas: Gene network, Bioinformatics, Cancer
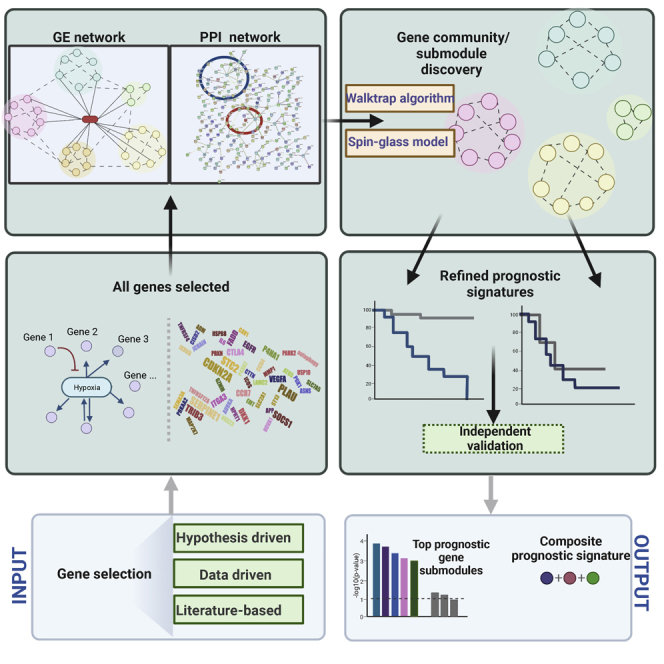
Graphical abstract
Highlights
-
•
A subnetwork-based framework was established to distill prognostic gene submodules
-
•
Three strategies were proposed to extract reliable prognostic gene submodules
-
•
The hypothesis-driven and data-driven approaches can be integrated in the framework
-
•
A hypoxia-immune joint prognostic signature in HNSCC was successfully identified
Gene network; Bioinformatics; Cancer
Introduction
Cancer prognosis, the estimation of the recovery chance, plays a key role in clinical decision-making. Different statistics such as overall survival (OS) rate or fixed-term survival rate have been used to evaluate the treatment plans for patients. Understanding and identifying the core genes and pathways associated with cancer prognosis is crucial for the treatment decision-making and patient management. Tumor microenvironment (TME) as a complicated and active system around the tumor cell consists of not only immune and stromal cells but also those surrounding tissue components such as blood vessels, fibroblasts, and extracellular matrix.1 The alterations of both the oncogenes and tumor suppressor genes in these cells could regulate the biological pathways interactively and result in different patient outcomes. The tumor heterogeneity, showing differences both within a tumor at the cell level and between individual tumors at the patient level, also challenges the current treatment because the therapeutic biomarker is difficult to target. Hence, as a leading cause of death globally, cancer demands a better prognosis for accurate clinical decision-making.
The rapid revolution of next-generation sequencing such as DNA sequencing and RNA sequencing (RNA-seq) enlarges the genomics database and allows scientists to gain more comprehensive insights into cancer prognostic genes. Gene expression holds a unique midpoint between upstream DNA mutation and downstream protein expression, directly measuring the dynamic cell status and activities.2 The cell-specific mRNA dysregulation, as a major contributor to tumor progression, is instructive for cancer prognosis studies. RNA-seq is undergoing a revolution with the transition from bulk tissue RNA-seq to single-cell RNA-seq (scRNA-seq), which investigates all cells simultaneously more efficiently and quantifies the individual cell expression more specifically. In consideration of the interactions between genes according to the cell heterogeneity as well, RNA-seq has become a mainstay in cancer research.3
With the revolution of high-throughput sequencing technology, the amount of available genomics data is increasing drastically. The aggregation of the exhaustive data with convoluted relationships such as protein-protein and protein-RNA interactions makes the prognostic gene selection more complicated and challenging. Network-based topology thereby has been introduced for gene panel analysis with visualization such as gene expression and protein-protein interaction (PPI) network. A combination of the data-driven estimated network and the gene regulatory database-derived network with Laplacian matrix constraint has been proposed for feature selection in a generalized linear model.4 Meanwhile, gene information redundancy, as the overlapping functions and intercorrelated expression levels, is a major problem to consider in both gene expression analysis and network-based methodology. The basic network analysis could not capture and interpret the genome-wide transcriptome data thoroughly as the gene nodes are numerous with compact edges based on the intricate interactions.5 Taking the sparsity and heterogeneity of gene expression profiles into account, cancer types have also been studied by subgroup clustering and stratification.6 Because no single methodology could work perfectly for top biomarker candidate prioritization, we consolidated the strategy by integrating both data-driven and literature-based subnetwork analyses to prioritize informative prognostic genes. This de novo subnetwork-based framework is able to enhance the prognosis accuracy by providing interconnection information, such as gene regulatory and PPI with visualization.
In this article, we illustrate the use of network-based and subnetwork-based approaches for mining the prognostic genes with the head and neck squamous cell cancer (HNSCC) transcriptome dataset. The growing cases and low survival rates of head and neck cancer have attracted more attention these years, while the treatment for this cancer is still a struggle because of the absence of clearly defined prognostic factors.7 To this end, we demonstrate that the integrated and systematic subnetwork framework can identify hallmark prognostic units or submodules such as the immune-related and hypoxia-related signatures. Three different subnetwork-based strategies—(1) hypothesis-driven, (2) data-driven, and (3) literature-driven—were proposed to explore the HNSCC-specific candidate biomarkers. The overall rationale is that by exploiting the gene subnetworks (based on gene coexpression patterns, PPIs, or the combination), we can extract more reliable and optimized prognostic gene panels from the heterogeneous candidate gene pools.
Results
Overview of subnetwork-based strategies for prioritizing prognostic genes
In this study, three different subnetwork-based strategies—(1) hypothesis-driven, (2) data-driven, and (3) literature-driven—were proposed to study the cancer-type-specific prognostic biomarkers. The analytical workflow for each strategy is illustrated in Figure 1.
Figure 1.

Three subnetwork strategies for prioritizing prognostic genes
(A) The hypothesis-driven approach focuses on the individual prognostic cancer mechanistic pathways. Based on the genes involved in 1 mechanism, the gene expression analysis by extracting subnetworks (e.g., exploratory graph analysis [EGA]) is applied to refine the prognostic signatures.
(B) The data-driven strategy examines all genes by their prognostic significance simultaneously. A PPI network is then used as a complementary affirmation to prioritize the top candidate genes.
(C) The literature-based strategy is a combination of data-driven and hypothesis-driven approaches. The functional/cellular submodule of the candidate gene is first explored in the context of the anchor genes discovered based on the scRNA-seq. Both the gene expression (GE) analysis and the PPI network information will be utilized in this approach.
The hypothesis-driven strategy focuses on the specific cancer molecular pathways such as hypoxia signature and tumor interferon (IFN) signaling. Considering the hypoxia pathway as an example, there are more than 135 gene biomarkers responsible for oxygen deprivation. It is yet uncertain as to which candidate genes have the largest impact on HNSCC survival. To address this issue, we will apply the gene expression-based (GE-based) subnetwork analysis to empirically classify the hypoxia-related genes into different gene submodules. The prognostic significance of each submodule is then tested based on the log-rank test on Kaplan-Meier estimate or the Cox regression analysis. The data-driven strategy directly adopts the genome-wide scan for the top prognostic genes based on the univariable or multivariable Cox regression. A PPI network8,9,10 is then applied on these top genes with the goal to identify hub gene modules that can be used to construct the final prognostic joint signature. In the last strategy, a literature search is first conducted to collect all prognostic genes related to a caner type in the published studies. We then propose to apply subnetwork analysis to broadly categorize these genes (1 at each time) into malignant, immune, and stromal cellular communities. We will leverage single-cell transcriptome data to generate “orthogonal” seed genes that can best delineate the different cellular communities for each cancer tissue type.
Hypothesis-driven prognostic submodule discovery based on exploratory graph analysis
Hypoxia, resulting from a low-oxygen condition in a TME, is a hostile hallmark in most solid tumors such as head and neck cancer. Emerging evidence has revealed that tumor hypoxia is associated with cancer progression and therapy resistance.11 However, there is no consensus on gene signatures of hypoxia across cancer types.12 To investigate cancer-specific gene signatures, we performed an unsupervised subnetwork analysis by combining the genes from three existing hypoxia signatures, i.e., Buffa signature,13 Hu signature,14 and Winter signature.15 Exploratory graph analysis (EGA) was conducted on the gene expression data of 135 unique hypoxia biomarker genes, which are derived from the pan-cancer-normalized The Cancer Genome Atlas Head-Neck Squamous Cell Carcinoma (TCGA-HNSC) dataset. EGA, introduced originally in psychometric, is a popular framework for estimating the number of “dimensions” or subnetworks in a given multivariate dataset based on the graphical lasso and walktrap community detection algorithms.16,17,18,19 Based on the weighted network community analysis, the results of EGA (Figure 2A with anchor gene) indicate a total of 8 gene communities underlying the HNSC hypoxia transcriptomic data. We further tested the association between each single gene and patients’ OS. The univariable Cox regression analysis showed 9 genes with p values less than 0.01, and two of them (PGK1 and P4HA1) with extremely high significance (p value = 1.7 × 10⁻⁶ and 8.2 × 10⁻⁵, respectively). As indicated by the significance levels in the plot, most prognostic candidate genes are enriched in community 1 (represented by the genes GPN3 and KIF20A), community 2 (represented by PFKP and PGK1), and community 3 (represented by PSMD2, PLAU, and P4HA1). Furthermore, the lasso-penalized Cox multivariable regression analysis indicated that genes PGK1, P4HA1, and PLAU were selected in the final predictive model. Pathway enrichment analysis using MSigDB hallmark gene sets shows that both community 2 and community 3 are highly enriched for hypoxia and glycolysis pathways, while the community 1 is significantly enriched for cell cycle pathways (G2M checkpoint and E2F targets). Together, these results suggest that the core prognostic hypoxia submodules for head and neck cancer exist in the discovered gene communities 2 and 3, represented by the leading genes PGK1 and P4HA1, respectively.
Figure 2.

Unsupervised gene communities detected with EGA in HNSCC
(A) Eight gene communities grouped by EGA based on the hypoxia gene signature.
(B) p Values of cox models after -log10 transformation. The yellow bar represents the p values from the EGA-selected prognostic submodule, and the green bar represents the p values from all genes among 7 hypoxia-enriched cancer types: uterine corpus endometrial carcinoma (UCEC), ovarian cancer (OV), lung squamous cell carcinoma (LUSC), HNSC, colon adenocarcinoma (COAD), cervical squamous cell carcinoma and endocervical adenocarcinoma (CESC), and bladder urothelial carcinoma (BLCA).
As a comparison, we also performed the same EGA analysis on the hypoxia-related gene expression extracted from the TCGA bladder cancer (TCGA-BLCA) dataset. Bladder cancer is also a solid tumor, and its prognosis is known to be affected by the tumor hypoxia characteristics. As shown in Figure S1A, the prognostic genes show a distinct pattern in the hypoxia gene expression network. Compared with HNSC, there are more genes significantly associated with patient survival in bladder urothelial carcinoma (BLCA). According to the univariable Cox regression, there were 22 genes with p values less than 0.01, while none of them exhibited predominating prognostic significance (PLOD1 had the lowest p value at 0.4 × 10⁻⁴). The finding suggests that more genes could be incorporated to create a hypoxia-driven prognostic signature in BLCA, and a less-robust ridge-penalized (rather than lasso-penalized) Cox model might be considered. The EGA plot also shows that most prognostic genes fall within the communities 3, 4, and 5. The gene enrichment analysis revealed that community 3 was significantly enriched for cell cycle pathways, and communities 4 and 5 were enriched for the glycolysis pathway. The differences in the prognostic subnetworks thus confirm the heterogeneity in hypoxia signature and partially explain the previous observation that a hypoxia metagene signature predicts therapeutic benefits in laryngeal cancer but not bladder cancer.12 For a more comprehensive validation of this strategy, the EGA subgroup analysis is performed on additional hypoxia-related cancer types, including uterine corpus endometrial carcinoma, ovarian cancer, lung squamous cell carcinoma, HNSC, colon adenocarcinoma, cervical squamous cell carcinoma and endocervical adenocarcinoma, and BLCA. Gene set scores for each of the 135 hypoxia-related genes and EGA-clustered gene subgroups are produced using the enrichment technique single-sample GSEA, which is implemented in the R package “GSVA.” As expected, the EGA-refined gene subgroup signatures demonstrated a more significant association with survival when compared with the all-gene panel (Figure 2B).
The IFN signaling in tumor is another hallmark of cancer. Recent studies have shown that tumor IFN-gamma (IFNG) signaling plays a dual role in regulating both innate and adaptive immune responses.20 Due to its essential role in immune regulation, a large cascade of genes are involved in the IFN/IFNG signaling. Consequently, a small subset of the IFN signature, known as the ISG resistance signature (ISG.RS), has been proposed as a more effective prognostic signature and potential biomarker for immunotherapies.20,21 Same as hypoxia signatures, it is unclear whether these IFN signatures and their subsets are generalizable across different cancer types. To further explore the IFN heterogeneity, we applied a similar EGA analysis based on the IFN-related genes in the TCGA-HNSC dataset. There were 224 genes from the IFNG and IFN-alpha hallmark pathways included in the analysis. As shown in the Figure S1B, the EGA network analysis suggests 7 unsupervised gene communities. Importantly, the results show that the majority of the ISG.RS genes are within or around two major clusters: community 6 and community 4. In addition, a small cluster is formed by three ISG.RS genes (HLA-B, HLA-G, and CXCL10), which was included in the immune-related submodules as expected. This pattern indicates the ISG.RS signature, originally discovered using melanoma datasets, that also has a high relevance in head and neck tumors. It also suggests that the other genes around these two clusters, especially the remaining genes in the community 6 (such as RSAD2 and DDX58), are potential candidate biomarkers for the HNSC-specific ISG.RS signature.
Data-driven prognostic genes prioritization based on PPI networks
Based on the HNSC transcriptome dataset, this section presents a data-driven strategy for prognostic gene discovery. As illustrated in Figure 1, this strategy begins with a genome-wide scan by testing the association between each gene and survival outcomes, i.e., using the Cox regression model. Genes are then ranked by their significance levels, and the top-ranked genes will be selected for the downstream network and subnetwork analyses. We applied the screening method based on the standard Cox regression in order to prioritize the prognostic genes. With the aim to build predictive models in the future, lasso-penalized and elastic-net Cox regressions are proposed with all genes included in the model. In this way, the candidate genes selected in the final model can be used for the subsequent analysis. For the HNSC gene expression data, the processed RNA-seq data of a total of 20,501 genes from 520 tumor samples were used as input. After filtering genes with low expression values and low variations across all samples (detailed in the STAR Methods section), a total of 17,663 genes were included in the initial Cox-regression-based screening analysis for testing their association with OS and progression-free survival. The same analysis steps were conducted after excluding those human papillomavirus-positive (HPV-positive) patients (resulting in 446 samples). The top 30 prognostic genes (ranked by their p values) from the HPV-negative population are summarized in Figure 3A. There are only 8 overlapping genes in the OS screening analyses between the whole group and the HPV-negative subsamples, suggesting that the HPV status contributes significantly to sample heterogeneity. In the second stage of the analysis, we further prioritize these candidate genes by incorporating PPI networks from the STRING database. The rationale is that the closely connected genes in PPI networks are more prone to have functional significance than the sparse neighbors. We used the STRING multiprotein toolkit to construct the network based on the top 200 prognostic genes selected from the HPV-negative subsample of the HNSC OS screening. The resulting STRING network map is shown Figure 3B, where singleton nodes that are not connected in the PPI network have been filtered. The prognostic network analysis reveals many functional subnetworks whose functions can be recognized by the associated hub genes. For example, the center of the PPI network is connected by multiple hypoxia-related hub genes that were also discovered by the EGA analysis discussed above, including PGK1, HK1, PKLR, and P4HA1. Adjacent to the hypoxia subnetwork is the DNA repair subnetwork, represented by the hub genes POLR1D, GPN3, and ADCY4. The subnetwork at the top of the plot (Figure 3B) is made up of the immune-related genes, e.g., CCL22, CD79A, TNFRSF4, and CCR7. The genes shown at the bottom of the plot are associated with E2F targets and the glycolysis pathway, including SPDL1, HMMR, KNSTRN, RACGAP1, and DEPDC1. Overall, the PPI map from the top prognostic genes reveals two major subnetworks (hypoxia-related and immune-related) in HNSC.
Figure 3.

Gene prioritization results from the data-driven strategy workflow
(A) Top genes selected by Cox models for all patients and the stratified HPV-negative patients subgroup. (using both OS and progression-free survival [PFI] as the outcome)
(B) PPI network demonstrated the key hub genes and subnetwork around them. The hypoxia and immune gene hubs are highlighted with blue and red circles.
(C) Kaplan-Meier curve plot for patients stratified by risk score quartiles with OS as the outcome. Patients with higher predicted risk scores (fourth quartile) resulted in lower OS probabilities for the training dataset.
(D) Kaplan-Meier curve plot for patients stratified by risk score quartiles with disease-free survival (DFS) as the outcome. Consistent with the trend shown in panel C, patients with higher predicted risk scores resulted in lower DFS rates for the test dataset.
To further translate the findings from the aforementioned network analysis, we propose a joint prognostic signature based on the genes discovered in the hypoxia and immune networks. The lasso-penalized Cox regression model was trained with the TCGA-HNSC OS data. The final hypoxia-immune joint signature is constructed with the 11 genes selected by the lasso model (with non-zero coefficients): PGK1, GPN3, SLC2A14, HK1, HPRT1, PLOD2, POLR2C, ZAP70, GRAP, TNFRSF4, and S1PR4. The corresponding coefficient estimates of these genes in the final Cox predictive model are 0.30, 0.069, 0.15, 0.33, 0.18, 0.06, 0.20, 0.13, −0.12, −0.06, and −0.08, respectively. As expected, most hypoxia-related genes have positive coefficients (hazard ratio >1) while immune-related genes have negative coefficients (hazard ratio <1). To validate the prediction performance of the proposed prognostic model, we calculated the risk score based on an external HNSC dataset (GSE27020), which contains 109 patients. After the batch effect correction, the predicated risk scores based on the TCGA and GSE27020 showed similar distributions with corresponding quantiles (Figure S2). As shown in the Kaplan-Meier plots stratified by the risk score quartiles (Figures 3C and 3D), patients with higher predicted risk scores tend to have worse survival rates in both the training and validation datasets.
Classifying literature-based prognostic genes using gene subnetworks
The literature-based approach is to discover and validate the prognostic biomarkers based on previous publications or databases, which has emerged as a popular alternative to the data-driven approach. However, too many prior publications for a certain disease could also result in a large pool of candidate biomarkers. Therefore, subnetwork analyses that can classify candidate genes into cellular submodules can be of great aid in the downstream analysis. Here, we continue our demonstration based on the head and neck cancer dataset.
A systematic literature survey via PubMed on March 18, 2022, resulted in 73 publications reporting gene-expression-based prognostic biomarkers in head and neck cancers (the associated PMIDs and biomarkers are listed in the Table S1). In the PubMed search, the keyword “head and neck squamous carcinoma prognostic gene” was used. The inclusion criteria include studies in English, with human subjects and full text available. As an immunogenic cancer type, higher tumor immune infiltration in HNSCs is associated with favorable patient survival. Differentially expressed genes in immune cells are often found significantly associated with survival. However, the observed expression of these immune-related genes from the bulk tumor is also highly confounded by tumor purity and cellular compositions. Therefore, it is important to first classify the literature-discovered genes more specifically and determine whether a gene signature is driven by the immune or stroma compartments.
scRNA-seq makes it feasible to compute the correlations among genes within each cell and identify the most indicative genes for the three compartments: stroma, malignant, and immune. We thereby applied the differential expression analysis using “one-vs-all” comparison to distinguish the genes of 1 compartment from the other two. The top five most differentially expressed anchor genes were selected for each community (immune: RGS1, CXCR4, SRGN, PTPRC, LCP1; stromal: ACTA2, DCN, SPARCL1, A2M, MGP; malignant: KRT17, KRT14, KRT6A, KRT5, EPCAM), resulted in a 15-gene marker panel.
The genes derived from previous literature (Table S1) are then assigned individually to one of the three communities according to the scRNA-seq-derived gene marker panel with the spin-glass model, which is a community detection clustering algorithm. We applied the “cluster_spinglass” function from the “igraph” R package for this graphical community detection.22,23,24 For example, the gene “GZMA” is classified as an immune biomarker based on the 15 principal genes (Figure 4A). Alternatively, the PPI plot derived from the STRING database (Figure 4B) shows that “GZMA” is also connected directly to the key immune gene CD4. It is noteworthy that, in the PPI plot with or without a query gene (Figure S3), all three communities are connected around the hub gene EFGR (epidermal growth factor receptor), which is known to play a critical role in HNSCC tumor initiation, progression, and metastasis.8 Next, we examined the prognostic significance of the literature-based genes assigned to each cellular community in two datasets: TCGA and GSE27020. As shown in Figure 4C, while more than half of the genes are significantly associated with survival outcome in at least 1 dataset, only a small proportion of genes are significant in both datasets. The subnetwork-based stratification provides more informative insights into the potential cellular compartments that those double-validated prognostic genes are functioning in. For example, the hypoxia-related genes PLAU and ENO1 were classified in the malignant gene community; multiple well-known immune-related genes such as CD3G and CTLA4 were in the immune gene community. The gene set enrichment analysis (Figures 4D, S4 and S5) further revealed the biological pathways associated with the double-validated genes in each cellular community.
Figure 4.

Gene subnetwork delineated by the literature-based strategy
(A) The “Spinglass” algorithm clusters the candidate gene into 1 of the three compartments: immune, stroma, or tumor. As an example, the input gene “GZMA” highlighted with red asterisk was assigned to the immune community.
(B) The PPI network of the representative anchor gene and “GZMA” based on the STRING database.
(C) Overlapped (significant) prognostic genes in TCGA and Gene Expression Omnibus (GEO) datasets. The yellow bars are the literature-based genes selected in both datasets, gray bars represent the number of genes selected in one dataset, and the blue bars reveal the number of genes selected in neither dataset.
(D) Gene enrichment analysis of genes assigned in the malignant group, including Msigdb Hamllmark, Kyoto Encyclopedia of Genes and Genomes (KEGG) pathway, and gene ontology pathways (Gene Ontolgy Biological Process (GOBP), Gene Ontolgy Molecular Function (GOMF), and Gene Ontolgy Cellular Component (GOCC)).
Discussion
As most research studies in transcriptomic data disregard the tumor cell heterogeneity in prognostic biomarker discovery, our study focuses on network and subnetwork approaches by integrating both data-driven and hypothesis-driven methods. For all three proposed strategies, we applied graph-based network algorithms to optimize and verify the delineation of subcommunities, which narrow down the massive potential candidates with straightforward visualization. By integrating data-driven statistical models with evidence-based findings as well, an effective and efficient translational regulation analysis is provided to prioritize cancer-type-specific prognostic genes. It is also notable that we decode the tumor heterogeneity by confirming the cancer-specific signature and conducting gene-submodule-level stratification for a more detailed while less-biased biomarker discovery.
The hypothesis-based strategy first specifies the particular cancer gene subsets according to prior knowledge, e.g., hypoxia, which is a remarkable hallmark in several tumor types. The workflow combines a series of statistical models for gene prioritization, EGA for subnet layout, and gene set enrichment analysis for verification, providing both statistical significance and information visualization. Our results reveal that hypoxia is an ideal signature for biomarker identification in HNSCC yet less dominant in bladder cancer, whereas another immune-related signature (ISG.RS) originally derived from melanoma is confirmed to be valuable for HNSCC as well. With this strategy, both tumor heterogeneity and biomarker generalizability could be accounted for in the prognostic gene optimization. The data-driven strategy starts from the whole transcriptome data directly, leading to a less-biased and more-inclusive analysis. Considering the potential false-positive rates caused by genetic heterogeneity and unequal sample size, we ran Cox models on the whole population and the HPV-positive excluded patient subgroup. As expected, the top genes selected from the two groups were distinct after cross-checking, and we further investigated the HPV-positive excluded group with submodules. Given the fact that gene expression data can be unreliable with many confounding factors, we introduce the PPI network after filtering the redundant genes to further confirm our data-driven results. The hypoxia-related hub genes such as PGK1 and P4HA1 were prioritized by both strategy 1 and strategy 2, which confirmed the consistency and accuracy of our strategies.
Cancer studies are accumulated over time due to the prevalence of high-throughput sequencing technology, leading to the large-scale reusable gene expression profiles in the public domain. As many prognostic studies use the same source of public dataset, such as TCGA, different but correlated genes (or genes with similar functions) have been reported redundantly in multiple studies. The studies that focus on a targeted mechanism could also introduce bias into biomarker prioritization. For example, hypoxia as a remarkable condition of various cancer types has been examined by several HNSCC studies, resulting in generic hub genes being the prognostic genes prioritized, i.e., oxygen deficiency contributors. Besides the substantial candidates, another challenge for gene identification is bulk gene sequencing only provides average gene expression instead of looking into the individual cell. scRNA-seq with a higher granular resolution is incorporated into the third strategy for bulk RNA sequence deconvolution to reveal the orthogonal genes representing the tumor, immune, and stromal compartments. Our strategy 3 starts with the scRNA-seq-identified seed genes and use an unsupervised clustering algorithm to classify the candidate genes into 1 of three tumor compartments. Standard PPI is used for further verification. By utilizing this divide-and-conquer strategy, we were able to classify genes according to their functional modules in the context of HNSCC.
In summary, we demonstrate how data-driven and hypothesis-driven methods could be integrated together with network-based methods for prognostic biomarker discovery. For different cancer or disease types, the choice of the best strategy depends on the real data structure and the available data resources. For example, if there are several prior studies, the literature-oriented strategy will be a suitable choice for a full-scale investigation at a low cost. Instead, if the whole transcriptome data are available, then the data-driven strategy is recommended to examine all genes objectively. The hypothesis-based strategy will be the most appropriate option when certain signatures are required to study or there are well-established hallmarks for the disease already.
Limitations of the study
Despite the promise of our framework, several limitations remain. For the hypothesis-based approach, the EGA algorithm is heavily dependent on distance metrics and parameter settings, which might cluster genes in different communities randomly. Similar to other unsupervised learning methodologies, the results might be hard to interpret and reproduce. The PPI network in strategy 2 requires professional domain knowledge to delineate the subnetworks. Although dominant hub genes could be found in this study for HNSCC, it could be less obvious for other cancer types. One drawback for the strategy 3 is reporting bias because only those significant findings would be published with positive results in general. Besides, it is difficult to extract and cover all the literature information for analysis. For subsequent studies, the literature-selected genes could be further classified into data-driven or mechanism-derived to reduce bias and refine the network. Meanwhile, good-quality reference scRNA-seq data might not exist for all cancer types. Altogether, our framework of the subnetwork analysis with integration of a data-driven and literature-based methodology is able to prioritize prognostic genes efficiently in a flexible manner, offering a promising tool for fostering precision medicine.
STAR★Methods
Key resources table
| REAGENT or RESOURCERESOURCE | SOURCE | IDENTIFIER |
|---|---|---|
| Deposited data | ||
| TCGA raw and analyzed data | The Pan-Cancer Atlas (PanCanAtlas) https://gdc.cancer.gov/about-data/publications/pancanatlas |
TCGA-HNSC TCGA-UCEC TCGA-BLAC TCGA-OV TCGA-LUSC TCGA-COAD TCGA-CESC |
| GEO raw and analyzed data | Gene Expression Omnibus https://www.ncbi.nlm.nih.gov/geo/query/acc.cgi?acc=GSE27020 |
GSE27020 |
| Software and algorithms | ||
| STRING | STRING: functional protein association networks | https://string-db.org |
| R 4.2.0 | The R Foundation | https://www.r-project.org |
| Igraph | Igraph R package | https://igraph.org/r |
| EGAnet | EGAnet: Exploratory Graph Analysis | https://cran.r-project.org/web/packages/EGAnet |
| Survival | survival R package | https://cran.r-project.org/web/packages/survival |
| Survminer | survminer R package | https://cran.r-project.org/web/packages/survminer |
Resource availability
Lead contact
Further information and requests for resources and reagents should be directed to and will be fulfilled by the Lead Contact, Xuefeng Wang (xuefeng.wang@moffitt.org).
Materials availability
This study did not generate new unique reagents.
Method details
Processing of cancer transcriptome data
The processed whole transcriptome data (RNAseq) from the TCGA-HNSC and other TCGA cancer types (TCGA-UCEC,TCGA-BLAC, TCGA-OV,TCGA-LUSC,TCGA-COAD and TCGA-CESC) was downloaded from the Pan-Cancer Atlas (https://gdc.cancer.gov/about-data/publications/pancanatlas). All data used are open access. After excluding normal tissue samples, the gene expression data from a total of 520 primary tumor samples were utilized in the proposed prognostic analysis. To facilitate an efficient genome-wide screening, we employed three criteria to filter out low-expression or low-variant genes: (1) the median of the gene expression values is greater than 0; (2) the 90th-percentile of the gene expression values is greater than 0.1; and (3) the variance of the gene expression is greater than 0.1. In the TCGA-HNSC dataset, a total of 17,663 genes (out of 20,501 genes in the input dataset) passed these filters. The same processing steps were applied to the transcriptome data of ther cancer types. The gene expression and clinical data from the validation HNSCC dataset were downloaded from GEO (Accession number GSE27020) using the R package “GEOquery”.25,26 When building prognostic signatures, we used the “ComBat” function implemented in the “sva” R package to adjust for the potential batch effects across the two gene expression datasets.
Gene set analysis
In this study, a series of gene set based analyses were applied on gene expression values. The single-sample gene set enrichment analysis "ssgsea" implemented in the R package "GSVA" was applied to generate the pathway enrichment scores for each EGA clustered gene subset and the full hypoxic gene set in difference cancer types. The web-based tool “Enrichr” (maayanlab.cloud/Enrichr) was used to explore and visualize the enriched signatures of the Gene Ontology (GO) pathways, KEGG, and the Molecular Signatures Database (MSigDB) Hallmark of the identified literature-based genes.
Hypoxia and IFNG hallmark signature
The hypoxia signature genes were identified based on three published signatures: (1) the Buffa signature, which contains 51 genes; (2) the Winter signature, which contains 101 genes; and (3) the Hu signature, which contains 13 core genes. A total of 135 unique hypoxia genes were selected for the downstream subnetwork analysis as described in the Strategy 1. The IFNG hallmark gene panel was generated by combining two hallmark gene sets: HALLMARK_INTERFERON_ALPHA_RESPONSE and HALLMARK_INTERFERON_GAMMA_RESPONSE annotated in MSigDB, yielding a total of 224 unique genes. The ISG.RS gene signature was based on 38 genes proposed in the original publication.
Network analysis based on EGA
Exploratory graph analysis (EGA) was used to discover functional submodules based on a selected subset of candidates based on their gene expression values. We used the ‘EGA’ function from the R package ‘EGAnet’ with the ‘glasso’ model implemented for Graphical Lasso algorithm, which applied extended Bayesian information criterion to optimize regularization parameter.27 The algorithm started with the calculation of the correlation matrix of the variables observed. We then used ‘glasso’ to derive the sparse inverse covariance matrix with the extended version of BIC (EBIC) defined regularization parameter over 100 different values. Next, we used the graph theory based algorithm ‘Walkstrap’ to determine the number of clusters of the partial correlation matrix computed derived with ‘glasso’, which equals to the number of latent factors in the HNSCC gene expression dataset. Then ‘boostEGA’ was used to check the optimum number of dimensions (communities) of 500 bootstrap iterations. Bootstrap using the resampling from the empirical dataset (non-parametric). We applied this on the hypoxia and ISG.RS signature in HNSCC. We checked the submodule derived from EGA based on pathway enrichment analysis of using Enrichr (https://maayanlab.cloud/Enrichr/).
Univariate Cox regression and lasso-penalized cox regression for prioritizing top prognostic gene
We screened the full transcriptome data to select the top prognostic genes based on the Cox proportional hazards regression model, which is from the R package ‘survival’. We ran the test on both overall survival (OS) and progression-free survival (PFI). Taking the sample heterogeneity into account, we conducted the tests separately on 1) all patients (n = 520), 2) HPV-pos excluded patients (n = 446). Top 200 genes were selected for the downstream PPI analysis to discover the potential prognostic gene hubs and modules.
We applied both lasso Cox and elastic-net Cox regression models on the hypoxia and immune signature genes using the ‘Coxnet’ function from the R package ‘Coxnet’.28 5-fold cross validation was used to determine the optimized hyperparameter for the final regression model. The prognostic significance of the generated signatures (e.g., hypoxia and immune) was visualized by the Kaplan-Meier (KM) plot using the ‘ggsurvplot’ function implemented in the ‘survminer’ R package.29 Patient subgroups of the KM plot were stratified based on the proposed risk scores quartiles. Then we used the Log -rank test for the statistical significance of the separation of the KM curves.
Same procedures were applied on the TCGA HNSC and BLCA datasets.
PPI analysis based on STRING database
Protein-protein interaction (PPI) analysis based on the “Multiple proteins” searching utility in STRING database (https://string-db.org/) was used to explore the relationships and network graphs among the selected genes. The minimum required interaction score was set as the medium confidence (0.400) and other parameters were set based on the default setting in the database. In order to highlight the hub gene and modules, we removed those sporadic gene nodes unconnected with any other nodes. To facilitate automatic search, we use https://string-db.org/api/svg/network?identifiers=[identifiers]&[optional_parameters] by setting the ‘optional_parameters’ to “network_flavor = evidence&limit = 5&species = 9606".
Malignant-Immune-Stromal anchor gene selection based on scRNA-seq
Processed single-cell RNA-seq data of tumors from 21 head and neck squamous cell carcinoma (HNSCC) patients30 were downloaded from GSE103322, which contains transcript per million (TPM) values for 23,686 analyzed genes across 5902 cells. Data was analyzed for cell annotation as described previously.31 Three major cell types and 11 subtypes were identified from this dataset, including Malignant cells, Stromal cells (Fibroblasts and Endothelial cells), and Immune cells (B cells, Macrophages, Dendritic cells, Mast cells, CD4+ T cells, regulatory T cells, CD8+ T cells, and CD8+ exhausted T cells). Differential expression analysis was performed using the Wilcoxon test on log2(TPM+1) values between Malignant cells, two Stromal types, and 8 immune types. The cell-type-specific markers for the three major cell types were determined as follow: 1) Malignant cells, genes significantly highly expressed compared to both Stromal cell types, and at least 5 subtypes of the immune cells; 2) Stromal cells, genes significantly highly expressed in both Fibroblasts and Endothelial cells, compared to Malignant cells, and at least 5 subtypes of the immune cells; 3) Immune cells, genes significantly highly expressed in at least 5 subtypes, compared to Malignant cells, Fibroblasts and Endothelial cells, respectively. Genes with log2FoldChange >3 and Benjamini-Hochberg adjusted p value <0.05 were considered as significantly highly expressed.
Gene cellular community discovery via spin-glass model
To perform the clustering analysis of each input gene and malignant-immune-stromal anchor genes, we used the spin-glass algorithm and simulated annealing based on the “cluster_spinglass” function implemented in the R package “igraph”. The function “graph_from_adjacency_matrix” in the package was first used to create the input (undirected) graph. The spin-glass clustering was then run with default settings. The final three groups achor genes for detecting the major gene communities are: (1) RGS1, CXCR4, SRGN, PTPRC, LCP1; (2) ACTA2, DCN, SPARCL1, A2M, MGP; (3) KRT17, KRT14, KRT6A, KRT5, EPCAM, corresponding to the immune, stromal, and malignant community, respectively. In most cases, a gene will be clustered into one of the three subnetwork communities. For example, GZMA was assigned to the community containing all the immune genes. If a gene is not assigned into any of the three communities, it will be labeled as not unclassified (0).
Acknowledgments
This work has been supported in part by a National Institutes of Health grant R01DE030493; the James and Esther King Biomedical Research Grant (21K04); and Biostatistics and Bioinformatics Shared Resources at the H. Lee Moffitt Cancer Center & Research Institute, an NCI-designed Comprehensive Cancer Center (P30-CA076292).
Author contributions
Conceptualization, B.C., K.B.P., S.Y., and X.W.; methodology, software, and formal analysis, B.C., T.L., S.Y., and X.W.; investigation, C.H.C., K.B.P., and X.W.; writing-original draft, X.W.; writing-review and editing, K.B.P, T.L., and X.W.; funding acquisition, C.H.C.; supervision, C.H.C, K.B.P., and X.W.
Declaration of interests
C.H.C. has received honoraria from Sanofi, Merck, and Brooklyn ImmunoTherapeutics, and Exelixis for serving in ad hoc scientific advisory boards. All other authors declare no conflict interest.
Inclusion and diversity
We support inclusive, diverse, and equitable conduct of research.
Published: February 17, 2023
Footnotes
Supplemental information can be found online at https://doi.org/10.1016/j.isci.2022.105915.
Supplemental information
Data and code availability
-
•
All gene expression data used in this study have been downloaded from sites in the public domain. Accession numbers are listed in the key resources table.
-
•
This paper does not report original code. The key software packages utilized are listed in the key resources table.
-
•
Any additional information required to replicate the analysis reported in this paper is available from the lead contact upon request.
References
- 1.Kuksin M., Morel D., Aglave M., Danlos F.X., Marabelle A., Zinovyev A., Gautheret D., Verlingue L. Applications of single-cell and bulk RNA sequencing in onco-immunology. Eur. J. Cancer. 2021;149:193–210. doi: 10.1016/j.ejca.2021.03.005. [DOI] [PubMed] [Google Scholar]
- 2.Kukurba K.R., Montgomery S.B. RNA sequencing and analysis. Cold Spring Harb. Protoc. 2015;2015:top084970. doi: 10.1101/pdb.top084970. [DOI] [PMC free article] [PubMed] [Google Scholar]
- 3.Hwang B., Lee J.H., Bang D. Single-cell RNA sequencing technologies and bioinformatics pipelines. Exp. Mol. Med. 2021;53:1005–1014. doi: 10.1038/s12276-021-00615-w. [DOI] [PMC free article] [PubMed] [Google Scholar]
- 4.Li K., Wang X., Kuan P.F. Mixture network regularized generalized linear model with feature selection. bioRxiv. 2019:678029. doi: 10.1101/678029. Preprint at. [DOI] [Google Scholar]
- 5.Kim Y., Kim T.-K., Kim Y., Yoo J., You S., Lee I., Carlson G., Hood L., Choi S., Hwang D. Principal network analysis: identification of subnetworks representing major dynamics using gene expression data. Bioinformatics. 2011;27:391–398. doi: 10.1093/bioinformatics/btq670. [DOI] [PMC free article] [PubMed] [Google Scholar]
- 6.Hofree M., Shen J.P., Carter H., Gross A., Ideker T. Network-based stratification of tumor mutations. Nat. Methods. 2013;10:1108–1115. doi: 10.1038/nmeth.2651. [DOI] [PMC free article] [PubMed] [Google Scholar]
- 7.Cadoni G., Giraldi L., Petrelli L., Pandolfini M., Giuliani M., Paludetti G., Pastorino R., Leoncini E., Arzani D., Almadori G., Boccia S. Prognostic factors in head and neck cancer: a 10-year retrospective analysis in a single-institution in Italy. Acta Otorhinolaryngol. Ital. 2017;37:458–466. doi: 10.14639/0392-100X-1246. [DOI] [PMC free article] [PubMed] [Google Scholar]
- 8.Bonetta L. Interactome under construction. Nature. 2010;468:851–854. doi: 10.1038/468851a. [DOI] [PubMed] [Google Scholar]
- 9.Sardiu M.E., Washburn M.P. Building protein-protein interaction networks with proteomics and informatics tools. J. Biol. Chem. 2011;286:23645–23651. doi: 10.1074/jbc.R110.174052. [DOI] [PMC free article] [PubMed] [Google Scholar]
- 10.Franceschini A., Szklarczyk D., Frankild S., Kuhn M., Simonovic M., Roth A., Lin J., Minguez P., Bork P., von Mering C., Jensen L.J. STRING v9. 1: protein-protein interaction networks, with increased coverage and integration. Nucleic Acids Res. 2013;41:D808–D815. doi: 10.1093/nar/gks1094. [DOI] [PMC free article] [PubMed] [Google Scholar]
- 11.Ye Y., Hu Q., Chen H., Liang K., Yuan Y., Xiang Y., Ruan H., Zhang Z., Song A., Zhang H., et al. Characterization of hypoxia-associated molecular features to aid hypoxia-targeted therapy. Nat. Metab. 2019;1:431–444. doi: 10.1038/s42255-019-0045-8. [DOI] [PMC free article] [PubMed] [Google Scholar]
- 12.Eustace A., Mani N., Span P.N., Irlam J.J., Taylor J., Betts G.N.J., Denley H., Miller C.J., Homer J.J., Rojas A.M., et al. A 26-gene hypoxia signature predicts benefit from hypoxia-modifying therapy in laryngeal cancer but not bladder CancerGene signature predicts benefit from antihypoxia therapy. Clin. Cancer Res. 2013;19:4879–4888. doi: 10.1158/1078-0432.CCR-13-0542. [DOI] [PMC free article] [PubMed] [Google Scholar]
- 13.Buffa F.M., Harris A.L., West C.M., Miller C.J. Large meta-analysis of multiple cancers reveals a common, compact and highly prognostic hypoxia metagene. Br. J. Cancer. 2010;102:428–435. doi: 10.1038/sj.bjc.6605450. [DOI] [PMC free article] [PubMed] [Google Scholar]
- 14.Hu Z., Fan C., Livasy C., He X., Oh D.S., Ewend M.G., Carey L.A., Subramanian S., West R., Ikpatt F., et al. A compact VEGF signature associated with distant metastases and poor outcomes. BMC Med. 2009;7:9–14. doi: 10.1186/1741-7015-7-9. [DOI] [PMC free article] [PubMed] [Google Scholar]
- 15.Winter S.C., Buffa F.M., Silva P., Miller C., Valentine H.R., Turley H., Shah K.A., Cox G.J., Corbridge R.J., Homer J.J., et al. Relation of a hypoxia metagene derived from head and neck cancer to prognosis of multiple cancers. Cancer Res. 2007;67:3441–3449. doi: 10.1158/0008-5472.CAN-06-3322. [DOI] [PubMed] [Google Scholar]
- 16.Golino H.F., Epskamp S. Exploratory graph analysis: a new approach for estimating the number of dimensions in psychological research. PLoS One. 2017;12:e0174035. doi: 10.1371/journal.pone.0174035. [DOI] [PMC free article] [PubMed] [Google Scholar]
- 17.Golino H.F., Demetriou A. Estimating the dimensionality of intelligence like data using Exploratory Graph Analysis. Intelligence. 2017;62:54–70. [Google Scholar]
- 18.Golino H., Shi D., Christensen A.P., Garrido L.E., Nieto M.D., Sadana R., Thiyagarajan J.A., Martinez-Molina A. Investigating the performance of exploratory graph analysis and traditional techniques to identify the number of latent factors: a simulation and tutorial. Psychol. Methods. 2020;25:292–320. doi: 10.1037/met0000255. [DOI] [PMC free article] [PubMed] [Google Scholar]
- 19.Pons P., Latapy M. Computing communities in large networks using random walks. J. Graph Algorithms Appl. 2006;10:191–218. [Google Scholar]
- 20.Benci J.L., Johnson L.R., Choa R., Xu Y., Qiu J., Zhou Z., Xu B., Ye D., Nathanson K.L., June C.H., et al. Opposing functions of interferon coordinate adaptive and innate immune responses to cancer immune checkpoint blockade. Cell. 2019;178:933–948.e14. doi: 10.1016/j.cell.2019.07.019. [DOI] [PMC free article] [PubMed] [Google Scholar]
- 21.Jain M.D., Zhao H., Wang X., Atkins R., Menges M., Reid K., Spitler K., Faramand R., Bachmeier C., Dean E.A., et al. Tumor interferon signaling and suppressive myeloid cells are associated with CAR T-cell failure in large B-cell lymphoma. Blood. 2021;137:2621–2633. doi: 10.1182/blood.2020007445. [DOI] [PMC free article] [PubMed] [Google Scholar]
- 22.Csardi G., Nepusz T. The igraph software package for complex network research. InterJournal, complex systems. 2006;1695:1–9. [Google Scholar]
- 23.Newman M.E.J., Girvan M. Finding and evaluating community structure in networks. Phys. Rev. E Stat. Nonlin. Soft Matter Phys. 2004;69:026113. doi: 10.1103/PhysRevE.69.026113. [DOI] [PubMed] [Google Scholar]
- 24.Reichardt J., Bornholdt S. Statistical mechanics of community detection. Phys. Rev. E Stat. Nonlin. Soft Matter Phys. 2006;74:016110. doi: 10.1103/PhysRevE.74.016110. [DOI] [PubMed] [Google Scholar]
- 25.Davis S., Meltzer P.S. GEO.: A bridge between the gene expression omnibus (GEO) and bioconductor. Bioinformatics. 2007;14:1846–1847. doi: 10.1093/bioinformatics/btm254. [DOI] [PubMed] [Google Scholar]
- 26.Barrett T., Wilhite S.E., Ledoux P., Evangelista C., Kim I.F., Tomashevsky M., et al. NCBI GEO: Archive for Functional Genomics Data Sets-Update. Nucleic Acids Res. 2013;41(Database Issue):D991–D995. doi: 10.1093/nar/gks1193. [DOI] [PMC free article] [PubMed] [Google Scholar]
- 27.Golino H., Christensen A.P. R Package version 1.1.1; 2022. EGAnet: Exploratory Graph Analysis – a Framework For Estimating the Number of Dimensions in Multivariate Data Using Network Psychometrics. [Google Scholar]
- 28.Therneau T.M., Grambsch P.M. Springer; 2000. Modeling Survival Data: Extending the Cox Model. [Google Scholar]
- 29.Kassambara A., Kosinski M., Biecek P. R Package version 0.4.9.; 2021. 2021. survminer: Drawing Survival Curves Using ‘ggplot2’.https://CRAN.R-project.org/package=survminer [Google Scholar]
- 30.Puram S.V., Tirosh I., Parikh A.S., Patel A.P., Yizhak K., Gillespie S., Rodman C., Luo C.L., Mroz E.A., Emerick K.S., et al. Single-cell transcriptomic analysis of primary and metastatic tumor ecosystems in head and neck cancer. Cell. 2017;171:1611–1624.e24. doi: 10.1016/j.cell.2017.10.044. [DOI] [PMC free article] [PubMed] [Google Scholar]
- 31.Yu X., Chen Y.A., Conejo-Garcia J.R., Chung C.H., Wang X. Estimation of immune cell content in tumor using single-cell RNA-seq reference data. BMC Cancer. 2019;19:715–811. doi: 10.1186/s12885-019-5927-3. [DOI] [PMC free article] [PubMed] [Google Scholar]
Associated Data
This section collects any data citations, data availability statements, or supplementary materials included in this article.
Supplementary Materials
Data Availability Statement
-
•
All gene expression data used in this study have been downloaded from sites in the public domain. Accession numbers are listed in the key resources table.
-
•
This paper does not report original code. The key software packages utilized are listed in the key resources table.
-
•
Any additional information required to replicate the analysis reported in this paper is available from the lead contact upon request.