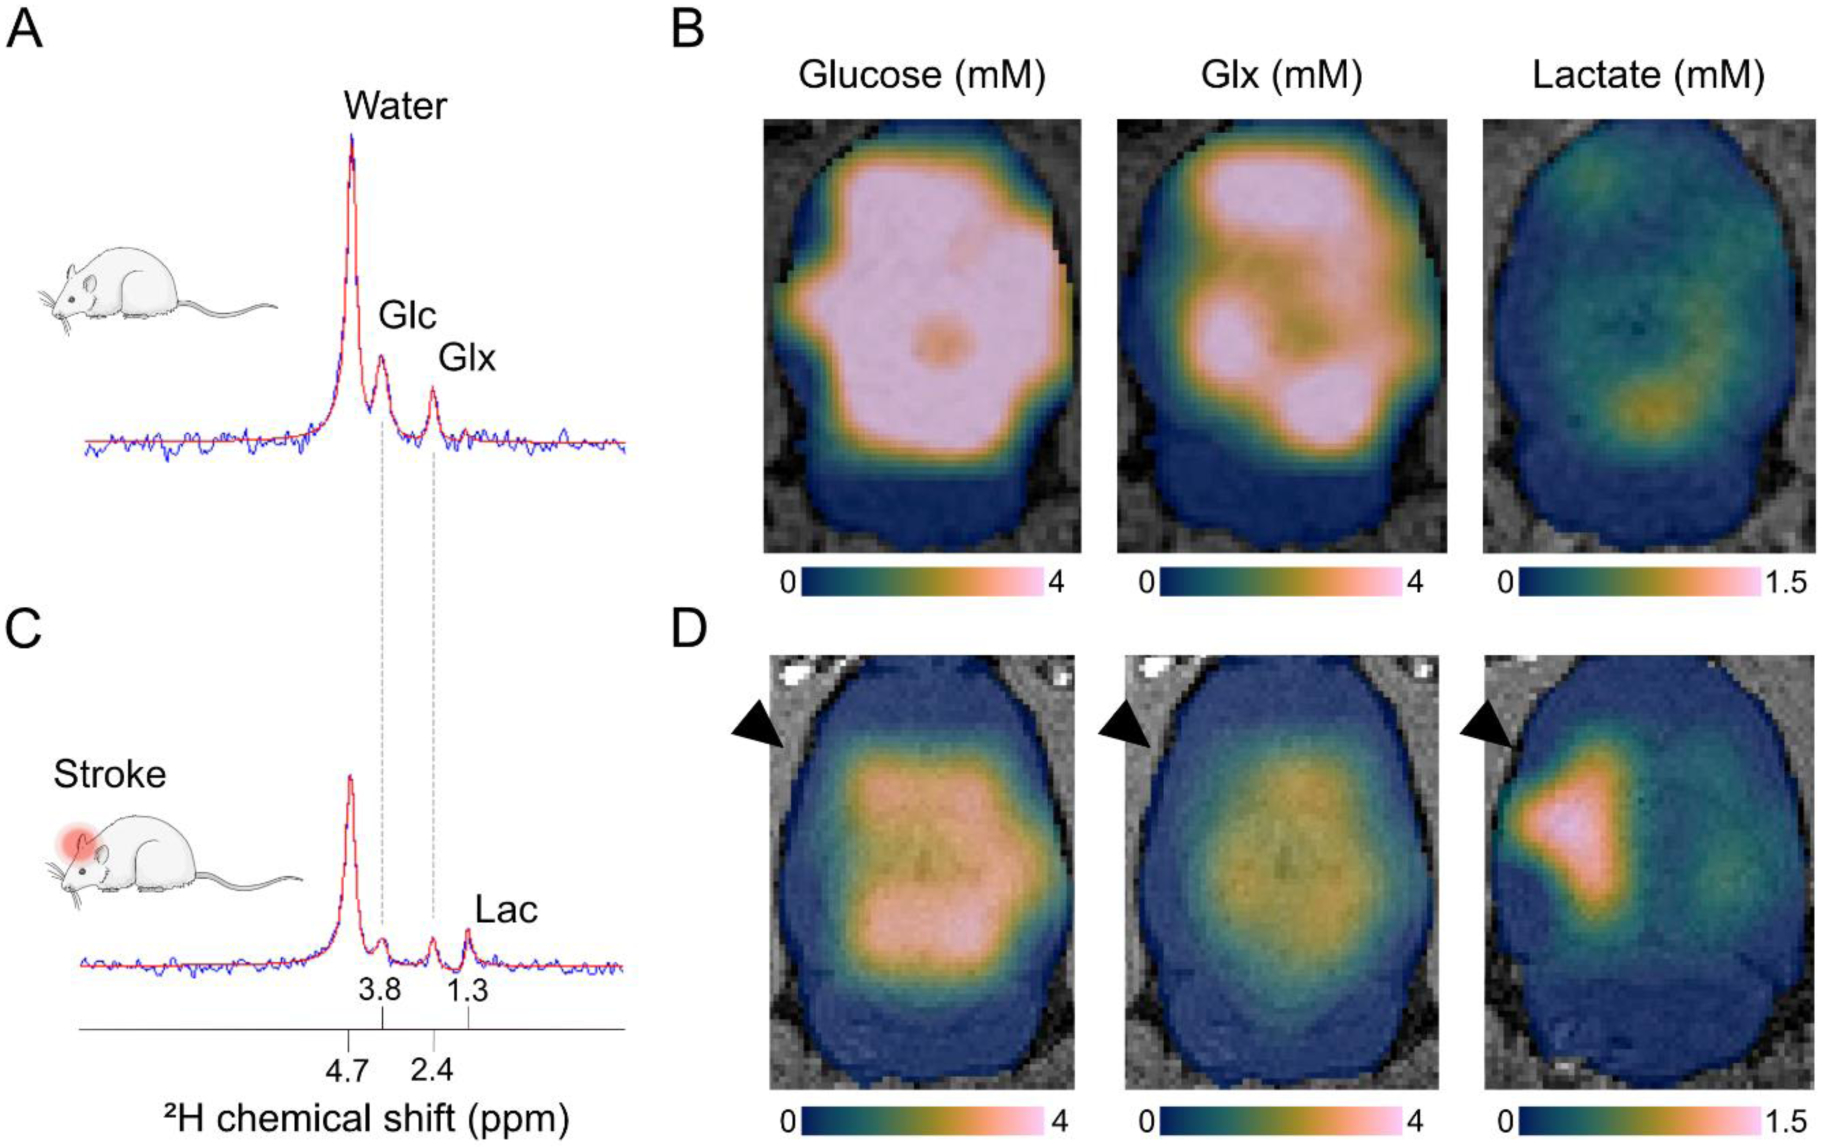
Figure 1.

DMI captures altered glucose metabolism after ischemic stroke in rats. We acquired steady state DMI data at 9.4 T with 3 × 3 × 3 mm3 = 27 μl nominal spatial resolution in approximately 35 min (repetition time = 400 ms; 8 averages). A) A typical single-voxel DMI spectrum from a healthy rat brain acquired at 60–90 minutes after start of intravenous infusion with 2H-labeled glucose (1.95 g/kg in 120 minutes). B) Maps of glucose uptake and metabolic products, i.e. glutamate and glutamine (Glx) and lactate, across the healthy rat brain reveal even distribution of glucose delivery and uptake and oxidative phosphorylation (reflected by the Glx pool), while anaerobic glycolysis (i.e. lactate formation) is minimal. C) A DMI spectrum from a single-voxel placed in a rat’s ischemic brain hemisphere shortly after unilateral middle cerebral artery occlusion shows active lactate formation, indicative of anaerobic glucose metabolism. The infusion of 2H-labeled glucose was started directly after occlusion of the middle cerebral artery. D) Acutely after stroke induction, we observed lactate formation in and around the ischemic lesion coupled with reduction in oxidative phosphorylation indicated by a lowered Glx signal. In B and D, color-coded (Crameri, 2020) glucose and metabolite maps, expressed in millimolar concentrations, are overlaid on T2-weighted anatomical MR images of the brain. The black arrowheads mark the ischemic hemisphere. Abbreviations: Glc = glucose, Glx = glutamate & glutamine, Lac = lactate.
