Abstract
Sequential segmentation creates modular body plans of diverse metazoan embryos1-4. Somitogenesis establishes segmental pattern of vertebrate body axis. A molecular segmentation clock in the presomitic mesoderm (PSM) sets the pace of somite formation4. However, how cells are primed to form a segment boundary at a specific location remained unknown. Here we developed precise reporters for the clock and double phosphorylated ERK (ppERK) gradient in zebrafish. We discovered that the Her1/7 oscillator drives segmental commitment by periodically lowering ppERK, thus projecting its oscillation on the ppERK gradient. Pulsatile inhibition of the ppERK gradient can fully substitute the role of the clock and kinematic clock waves are dispensable for sequential segmentation. The clock functions upstream of the ppERK, which in turn enables neighboring cells to discretely establish somite boundaries in zebrafish5. Molecularly divergent clocks and morphogen gradients were identified in sequentially segmenting species3,4,6-8. Our findings imply versatile clocks may establish sequential segmentation in diverse species as long as they inhibit gradients.
Somite periodicity is imposed by a molecular oscillator called the segmentation clock9-13. Disruption of conserved Hes/her oscillator results in segmentation defects in all vertebrates including humans4. Clock oscillations are locally synchronized among neighboring cells and establish kinematic stripes moving from posterior PSM (pPSM) to anterior PSM (aPSM)12,14. Various models are proposed to explain sequential somite segmentation9,15,16. The popular clock and wavefront (CW) model (Fig. 1a) posits a gradient (i.e., the wavefront, Fig.1a, green) moving over cells posteriorly4. Cells falling below a threshold of the gradient become competent to segmentation. During a cycle, the clock (Fig.1a, magenta) triggers a group of competent cells commit to segmentation in mid-PSM (Fig. 1a, cyan). This group eventually form a new somite in aPSM (Fig. 1a, red)4. Supportively, PSM cells experience Fgf/ppERK and Wnt/β-Catenin gradients (Fig. 1a, green)17-19 influencing somite sizes5,17,18,20. However, various molecules in the Fgf and Wnt signaling pathways oscillate in mice and chick21-23, but not in zebrafish embryos18,24. Thus, whether these morphogens function as a universal wavefront is questioned. Moreover, it is unknown how an oscillatory signal could provide reliable positional information by thresholds. Due to these critical knowledge gaps, alternative models omitting the wavefront were also proposed for somite segmentation15,16. Until sequential segmentation of somites is reconstructed at will using key sets of molecules, a mechanistic understanding of the process will be missing.
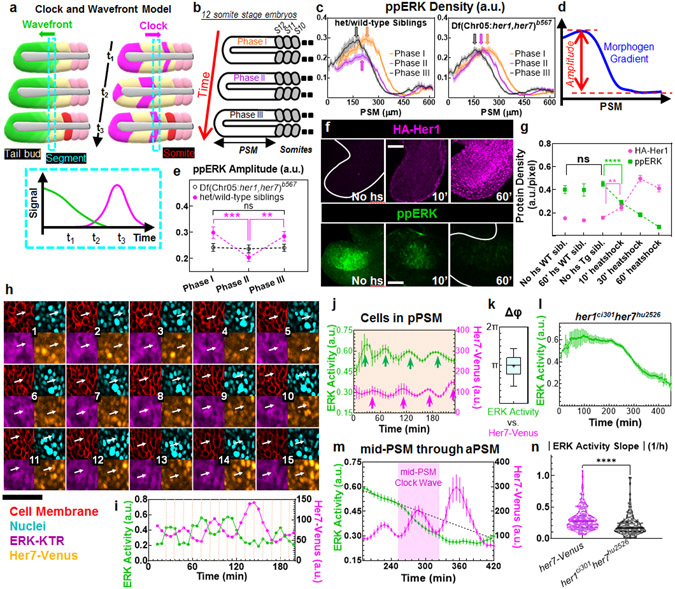
Fig. 1: Segmentation clock driven dynamics of ppERK gradient.
a, The CW model: The wavefront (a threshold of gradient, green) regresses following tail elongation. Segmentation clock (magenta) displays kinematic waves in opposite direction. Group of cells (cyan dashed box) commit to form next segment when the clock triggers them (bottom) and later buds off as a somite (red). b, Three phases of same stage embryos by their PSM lengths. c, ppERK dynamics in clock-intact siblings (left, n=24, 26, and 26 embryos over N=3 for Phases I, II, and III respectively) and clock-deficient mutants (right, n=22, 25, and 23 embryos over N=3 for Phases I, II, and III respectively). Data aligned from anterior (lab frame). d, Gradient amplitude: the difference between gradient peak and trough. e, Amplitude dynamics in (c). In mutants: p=0.95, 0.76, and 0.79; in siblings: p=0.0002, 0.54, and 0.0042 for Phases I-II, I-III, and II-III respectively. f, IHC for HA-Her1 (top) and ppERK (bottom). g, HA-Her1 levels (magenta, n= 42, 31, 28, 42, 39, and 28 embryos from left to right, over N=3) and ppERK gradient amplitudes (green, n=17, 15, 17, 44, 36, and 36 embryos from left to right, over N=3). p=0.013 (HA-Her1) and 0.0108 (ppERK); no heatshock transgenic controls – 10’ heatshock. p>0.9198 for ppERK, between no heatshock transgenic and two other controls. h, Snaphots (12 min intervals) of Her7-Venus (orange), ERK activity (purple), cell membrane (mCherry-CAAX, red), and nuclei (H2B-iRFP, cyan). Arrow tracks a pPSM cell for 3 hours. ERK activity reporter translocates between cytoplasm and nucleus periodically. i, ERK activity and clock dynamics for the tracked cell in (h). j, Clock (magenta) and ERK activity (green) dynamics for pPSM cells (orange shade, n=271 tracked cells from 8 embryos over N=5). Arrows indicate peaks. k, Phase difference between ERK activity and clock (n=133 pPSM cells from 8 embryos over N=5; Box (median and interquartile range) and whisker (10th – 90th percentile) plot. Plus is mean. l, ERK activity in clock mutants (n=242 cells from 7 embryos over N=4). m, Clock (magenta) and ERK activity (green) dynamics for cells displaced through mid-PSM to aPSM (n=271 cells from 8 embryos over N=5). Dashed line is linear fit to 30 min data preceding mid-PSM clock wave (purple shade). n, ERK activity decline during mid-PSM clock waves of clock-intact embryos (magenta, n=197 cells from 8 embryos over N=5) and corresponding interval in mutants (black, n=169 cells from 7 embryos over N=4). Violin plots with median (solid) and quartiles (dashed lines). p<0.0001. More details on statistics and reproducibility can be found in the Methods section. All images are lateral view, dorsal is bottom. Posterior is left. Scale bars are 50 μm. N=independent experiments. Data is mean±s.e.m in (c), (e), (g), (j), (l), and (m).
Clock-dependent ERK dynamics
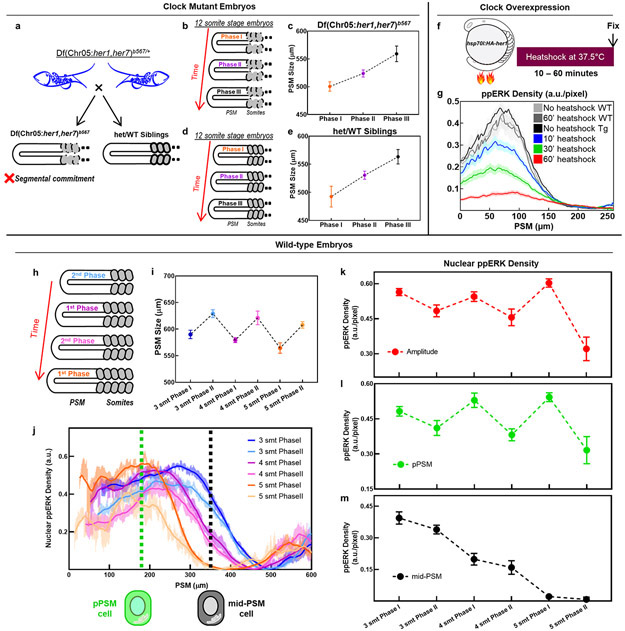
We previously showed that Fgf signaling directly instructs somite boundaries in zebrafish while Wnt signaling acts permissively5. To reevaluate the perceived species-specific differences in Fgf dynamics, we quantified ppERK gradient in clock-intact embryos that retain at least one copy of the her1/7 genes (displaying intact somite boundaries) alongside their clock-deficient mutant siblings (Df(Chr05:her1,her7)b567/b567 where all somite boundaries are disrupted due to chromosomal deficiency including two clock genes25) (Extended Data Fig. 1a). Axis elongation increases the PSM length continually within any given somite stage. Using the PSM length as a proxy for developmental time, we sorted immunohistochemistry (IHC) data from same somite stage embryos into three phases (Fig.1b; Extended Data Fig. 1b-e) and extracted the ppERK dynamics (Fig.1c-e). Surprisingly, we found that the amplitude of ppERK gradient (Fig. 1d) oscillates within a single somite stage in clock-intact embryos (30% change, Fig. 1c, e). In mutants, we observed a monotonous retreat of ppERK gradient (Fig. 1c). Contrary to previous investigations24,26, we observed ppERK gradient displays amplitude oscillations in zebrafish pPSM driven by clock, similar to that of mice21 (see also Extended Data Fig. 1h-l).
To identify whether the clock activates or inhibits ERK activity to drive its oscillation, we abruptly induced a clock gene using heatshock-inducible transgenic embryos (hsp70l:HA-her1)14,21,28 (Extended Data Fig. 1f). Compared to controls, transgenic embryos receiving a short 10 min heatshock produced detectable overexpression of clock protein (Fig. 1f,g) and decreased ppERK amplitude by 35%, demonstrating swift ppERK inhibition by clock protein (Fig. 1f,g; Extended Data Fig. 1g).
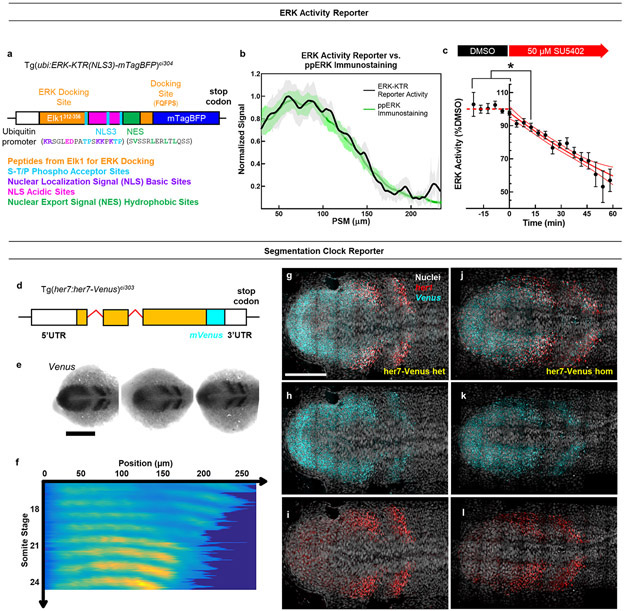
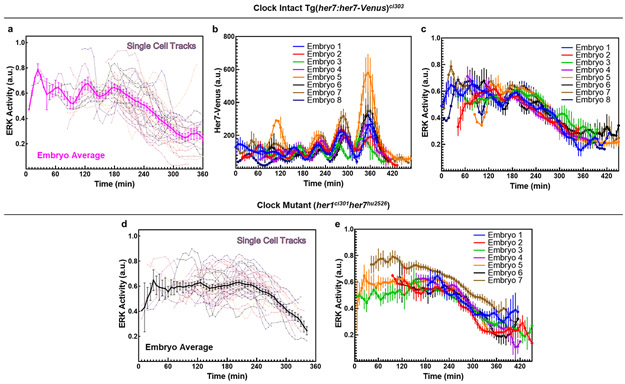
We next sought to simultaneously image the clock and ppERK dynamics in vivo. We generated a new transgenic line for ERK activity by adapting an ERK kinase translocation reporter which translocate from nucleus to cytoplasm upon phosphorylation by active ERK29 (ubi:ERK-KTR(NLS3)-mtagBFP; Extended Data Fig. 2a, see Methods). This reporter quickly responds to ppERK changes in the PSM (Extended Data Fig. 2b,c). Additionally, we generated a new reporter (her7:her7-Venus, see Methods) recapitulating clock dynamics in pPSM (Extended Data Fig. 2d-l). Using our double reporter transgenic fish, we simultaneously imaged the clock and ERK activity at single cell resolution (Fig. 1h,i). We tracked individual pPSM cells longitudinally and found ERK activity oscillating anti-phase with the clock (Fig. 1j,k; Extended Data Fig. 3a-c, Supplementary Video 1). In contrast, ERK activity did not oscillate in PSM cells of her1ci301her7hu2526 clock mutants 30 (Fig. 1l, Extended Data Fig. 3d,e). Live imaging revealed clock-driven anti-phase amplitude oscillations of the ppERK gradient (see also IHC data in Extended Data Fig. 4, Supplementary Discussion 1).
Due to tail elongation, tracked cells consequently occupied mid-PSM and then aPSM. After cells exited pPSM, their ERK activity continuously declined down to the baseline levels in the aPSM, following two trends: 1-) a slower decrease when the clock is not coexpressed, 2-) accelerated decrease when the clock is coexpressed (Fig. 1m; Supplementary Video 1; see also IHC data in Extended Data Fig. 1m). Thus, the clock increased the decline of ERK activity in mid-PSM (Fig.1n).
Reconstructing the somite segmentation
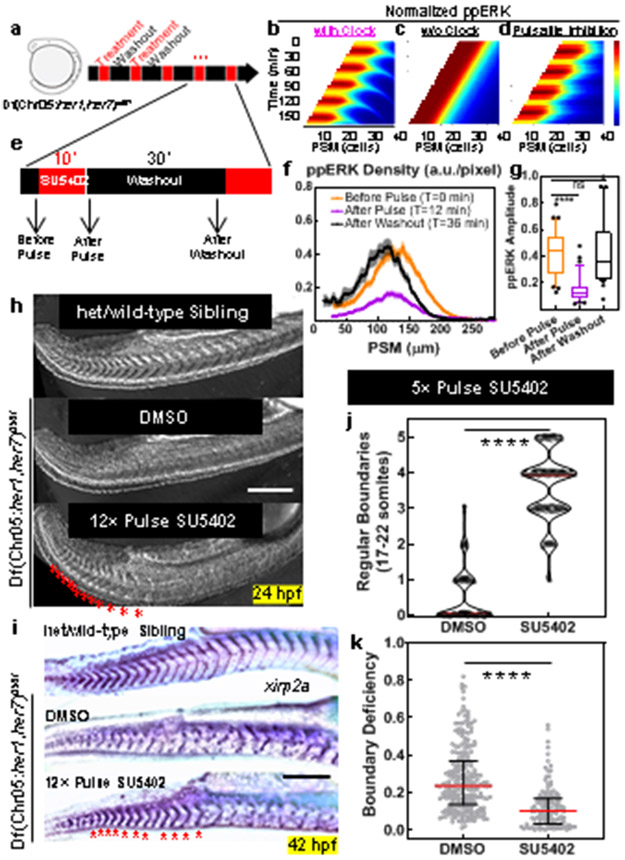
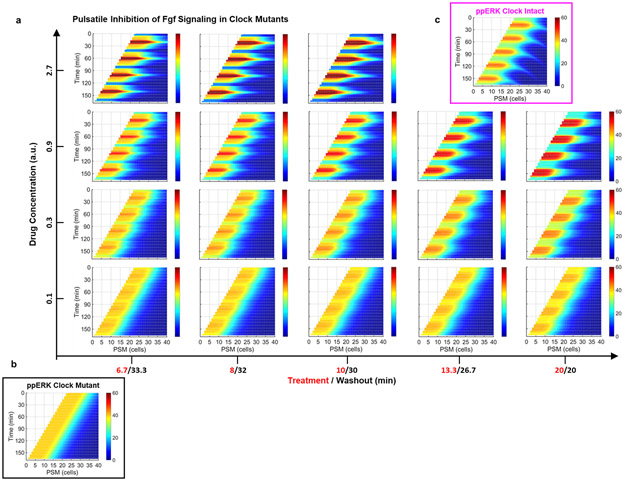
These observations inspired us to revisit the role of clock for driving sequential segmentation. We asked whether the clock drives sequential somite segmentation only by periodically inhibiting the ppERK gradient. If so, the clock can be substituted by pulsatile administration of a drug lowering ppERK levels (Fig. 2a). We simulated the effect of global pulsatile inhibition of Fgf signaling on ppERK dynamics in clock mutants and compared that with the effect of a kinematic clock wave in wild-type embryos (Fig. 2b-d, Methods). Simulations predicted an intermediate strength of inhibition can mimic clock-driven ppERK dynamics (Extended Data Fig. 5a-c). After experimental optimization, we treated clock-deficient mutants with pulses of 30 μM FGFR inhibitor drug SU5402 (or DMSO control) for 10 min separated by 30 min washouts (Fig. 2e). We first observed successful decrease (T0=0 min, T1=12 min) and recovery (T2=36 min) in the amplitude of ppERK gradient (Fig. 2f,g). Importantly, pulsatile inhibition of Fgf signaling in mutants successfully induced somite boundaries (up to 12 somites with 12 pulses, DIC-Nomarski images of live embryos at 24 hours post-fertilization (hpf), Fig. 2h) with sizes similar to those in wild-type embryos (Extended Data Fig. 6a).
Fig. 2: Global periodic inhibition of Fgf signaling drives sequential segmentation of somites in the absence of clock.
a, Design of pulsatile inhibition experiment in clock-deficient mutants. b-d, Simulation kymographs (time vertical down, space, horizontal) of ppERK gradient dynamics under the influence of clock (b), in the absence of clock (c), and with pulsatile inhibition (d). e, Clock-deficient mutants are treated with either 30μM SU5402 or corresponding DMSO dilution (1:333) in a pulsatile manner (10′ treatment and 30′ washout cycles) alongside their clock-intact siblings. f, ppERK gradient of the mutants during SU5402 pulse experiments (mean±s.e.m.). Embryos were fixed right before the 4th pulse (T0=0 min, n=34 embryos), immediately following the 4th pulse (T1=12 min, n=37 embryos), and before the 5th pulse (T2=36 min, n=30 embryos) over 2 independent experiments. g, Gradient amplitude oscillations of data in (f). Box (median and interquartile range) and whisker (10th – 90th percentile) plot with individual outliers. p<0.0001 and p>0.9999 for T0-T1 and T0-T2 respectively (Kruskal-Wallis ANOVA test with Dunn’s multiple comparison correction). h, In-focus plane projection from DIC-Nomarski imaging of live sibling embryos 2 h after the 12 pulses of drug treatment: clock-intact (top), DMSO-treated mutant (middle) and SU5402-treated mutant (bottom). Red stars mark induced boundaries (over 3 independent experiments). i, xirp2a stained clock-intact sibling (top), and DMSO (control, middle) or SU5402 (12 pulses, bottom) treated clock-deficient mutants. Stars show pulse-induced intact boundaries (n=15 embryos over 3 independent experiments). j, Computerized quantification of intact boundaries in DMSO control (n=156 boundaries over 3 independent experiments) or SU5402 treated (n=170 boundaries over 3 independent experiments) clock-deficient mutants. Violin plot with median (red solid) and quartiles (black dashed). Integer data is randomly jittered by ±0.05 to aid visibility. p<0.0001, unpaired two-tailed Welch t-test. k, Deficiency of remaining still-broken boundaries. Median (red) and interquartile range (error bars) with individual data points. p<0.0001 (two-tailed Mann-Whitney test), n=227/240 and n=91/240 boundaries for DMSO and SU5402 respectively. Scale bars are 200 μm. Posterior is left.
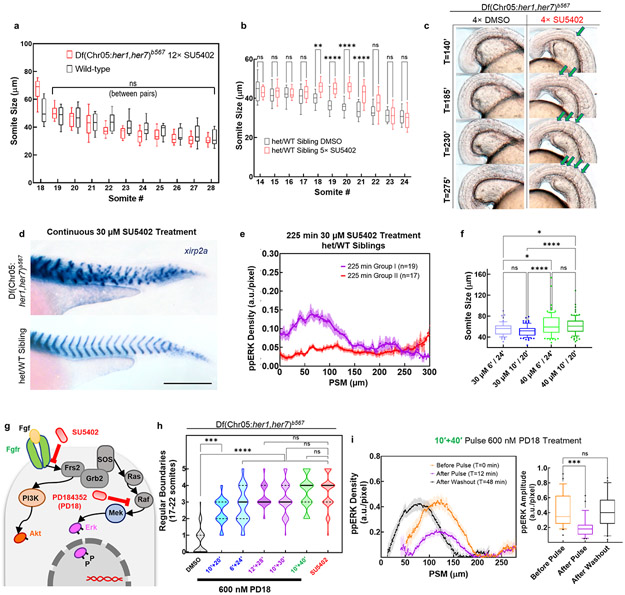
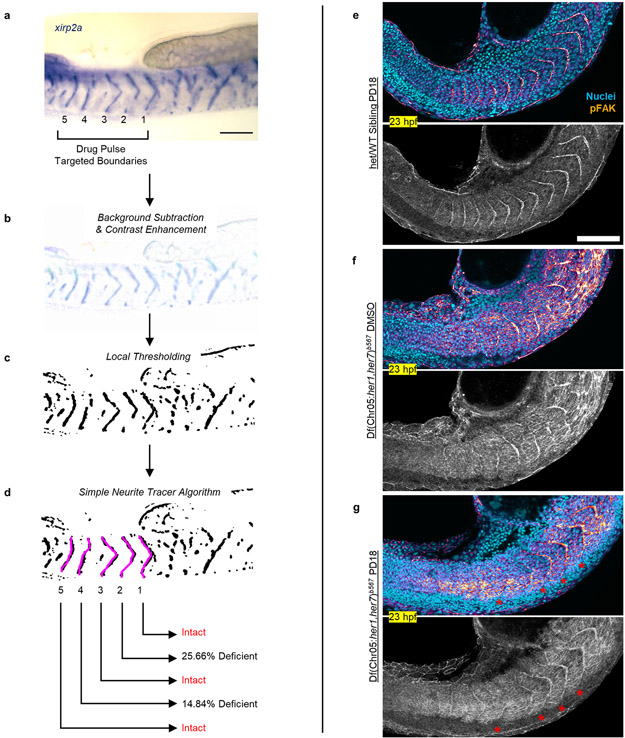
To better discern somite boundaries, we performed in situ hybridization for boundary marker xirp2a at 42 hpf and confirmed induced boundaries in mutants (Fig. 2i). Global inhibition of Fgf signaling resulted in side effects in other tissues and many embryos did not survive to later stages. Thus, for a detailed investigation of boundaries, we decreased the number of pulses to five. We developed an unbiased algorithm to quantify intactness of somite boundaries (Extended Data Fig. 7a-d, Supplementary Methods) and found that mutants successfully formed most of the boundaries targeted by five drug pulses (median = 4, Fig. 2j, median = 0 in DMSO controls) in a sequential manner (Extended Data Fig. 6c). The deficiency of remaining incomplete boundaries in mutants was also ameliorated by 72% with pulsatile SU5402 treatment (in median, Fig. 2k). On the contrary, mutants continuously treated with SU5402 failed to form boundaries whereas a fair portion of clock-intact siblings continuously treated with SU5402 still maintained segmentation until drastic axis truncation (Extended Data Fig. 6d). We also observed sustained ERK activity gradient (Extended Data Fig. 6e) in a group of clock-intact embryos even after long inhibition. These controls supported necessity of pulsatile ERK activity for somite segmentation. We further showed that induced somite sizes can be increased in mutants by increasing SU5402 concentration (Extended Data Fig. 6f). We next directly targeted ERK phosphorylation by inhibiting its upstream kinase, MEK (Extended Data Fig. 6g). Pulsatile MEK inhibition likewise induced somite boundaries in clock mutants (Extended Data Fig. 6h, Extended Data Fig. 8h) and triggered ppERK amplitude oscillations (Extended Data Fig. 6i). Pulsatile inhibition experiments, for the first time, reconstructed sequential segmentation of somites in the absence of the segmentation clock. These striking results suggested that the major role of the clock in segmentation is to periodically inhibit the ppERK gradient.
We next investigated whether drug-induced somite boundaries are properly epithelialized and can confine myofiber lengths. We observed well-defined epithelization of cells (marked with strong pFAK localization, Fig. 3a-d, Extended Data Fig. 7e-g) at induced myotome boundaries in mutants (Fig. 3e). Myofibers successfully attached to the induced boundaries (Fig. 3f-i) and their lengths were regular in induced somites, like in clock-intact siblings (Fig. 3j). We concluded pulsatile drug treatment can replace the clock for somite segmentation.
Fig. 3: Drug-induced somites and the COG model for somitogenesis.
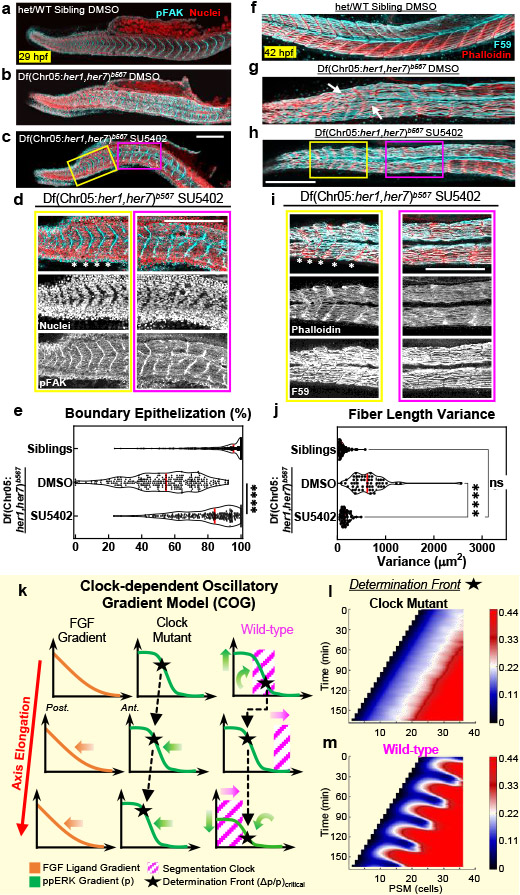
a-c, Phosphorylated focal adhesion kinase (pFAK, cyan) and cell nuclei (red), 29 hpf, of clock-intact siblings (N=2) treated with DMSO (a), and clock-deficient mutants (N=3) treated with DMSO (b) or 30 μM SU5402 (c) in five pulses. d, Magnified (top) and channel-split (bottom) images for the yellow box in SU5402-treated mutants (N=3) covering targeted domain and magenta box covering the broken boundaries prior to targeted domain in (c). Stars mark intact pFAK expression. e, Myotome border pFAK occupancy (percentile) of clock-intact siblings (N=2, n=330 from 66 embryos) and clock-deficient mutants treated with DMSO (N=3, n=290 from 58 embryos) or SU5402 (N=3, n=260 from 52 embryos) pulses (p<0.0001, two-tailed Mann-Whitney test). f-h, F59 (cyan) and Phalloidin (red) muscle markers, 42 hpf, of clock-intact siblings (N=3) treated with DMSO (f), and clock mutants (N=3) treated with five pulses of DMSO (g) or 30μM SU5402 (h). Arrows highlight muscle fibers transcending broken somite boundaries in DMSO-treated mutant (g). i, Magnified (top) and channel-split (bottom) images for the yellow box in SU5402-treated mutant (N=3) covering the targeted domain and magenta box covering the broken boundaries prior to targeted domain in (h). Muscle fibers span regularly between induced boundaries marked with stars. j, Muscle fiber length variance (each data point one embryo) within the targeted somites of clock-intact siblings (N=3, n=3515 fiber lengths from 55 embryos) and DMSO (N=3, n=3790 fiber lengths from 52 embryos) or SU5402-treated (N=3, n=4158 fiber lengths from 60 embryos) clock-deficient mutants. p<0.0001 for DMSO vs. SU5402, p=0.0589 for SU5402 vs. siblings (Brown-Forsythe ANOVA, unpaired two-tailed test with Welch correction). (k) Sketch of Clock-dependent Oscillatory Gradient (COG) model for discrete shifts of the determination front (black stars) with clock (magenta) in wild-type embryos. Determination front (SFC of ppERK, pneighbor/pcell =1+Δp/p) depends both on how absolute ppERK level (p) and the local slope of the gradient (Δp) changes (green arrows). Upstream Fgf signaling gradient is shown in orange (left). (l) Simulations of the COG model shows that SFC of ppERK smoothly regresses in clock mutants. (m) In wild-type, the clock is driving discrete dynamics of the critical SFC of ppERK (light yellow). Because of the assumption of a spatially constant coupling strength between clock and ERK activity, kinematic clock waves cause 1 to 2 cell width fringing in SFC dynamics. Data in (e), and (j) are individual points with the median (red solid) and quartiles (black dashed lines) in violin plots. All images are lateral. Dorsal is bottom. Posterior is left. Scale bars are 200 μm. N=independent experiments.
Clock-dependent Oscillatory Gradient model
We then investigated how an oscillatory ppERK gradient can still provide robust positional information for boundary commitment. We previously had shown that a somite boundary is instructed in the mid-PSM where the spatial fold change (SFC) of ppERK between neighboring cells pass over 22% (i.e., determination front) 5. We here propose a “Clock-dependent Oscillatory Gradient (COG)” model in which the clock periodically triggers discrete shifts of the determination front (Fig. 3k, Supplementary Discussion 2). Simulations predicted smooth regression of the determination front in the absence of the clock (Fig. 3l), but its discrete shifts triggered by kinematic clock oscillations (Fig. 3m).
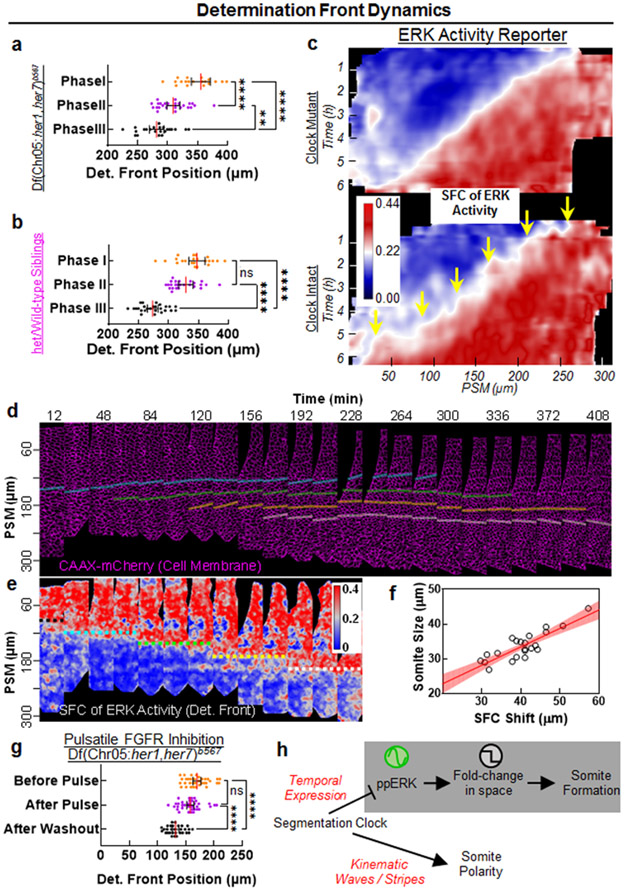
We experimentally validated predictions of the COG model by quantifying the SFC of ppERK from IHC data in clock-deficient mutants and clock-intact siblings. The determination front indeed smoothly regressed in clock-deficient mutants (Fig. 4a), which was also indirectly implied in earlier studies21,26. In clock-intact siblings, while the ppERK gradient amplitude was dramatically decreased in Phase II due to clock (Fig. 1c), determination front did not move (Fig. 4b). In Phase III, ppERK gradient amplitude recovered from repression and the determination front shifted to its next position (Fig. 4b). We further observed determination front dynamics in live embryos (Fig. 4c, Supplementary Video 2). The critical SFC of ERK activity (~22%) regressed gradually in her1ci301her7hu2526 clock mutants (Fig. 4c, top). However, in clock-intact embryos, the critical SFC of ERK activity discretely shifted to its next position (Fig. 4c, yellow arrows). Live tracking verified that cells located at these critical SFC positions later formed the somite boundaries (Fig. 4d-f). Lastly, we found that pulsatile inhibition of Fgf signaling in clock mutants restored the discrete shifts of determination front to induce somites (Fig. 4g).
Fig. 4: Clock discretizes the positional information.
a-b, Regression of determination front position for three phases of clock mutants (a, n=22, 25, and 23 embryos from 3 independent experiments, respectively) and of clock-intact siblings (b, n=24, 26, and 26 embryos from 3 independent experiments, respectively) calculated as the position of critical SFC of ppERK. In mutants: p=0.0029 for Phase II-III, p<0.0001 for Phase I-II and Phase I-III; in clock-intact siblings: p=0.1179 for Phase I-II, p<0.0001 for Phase I-III and Phase II-III (Brown-Forsythe and Welch ANOVA tests with Dunnett’s T3 correction for multiple comparisons). c, SFC of ERK activity kymograph of clock-intact embryos (n=6 embryos over 3 independent experiments) or clock mutants (n=8 embryos over 4 independent experiments). White transition color of look up table matches to the critical SFC value for segmental commitment. Yellow arrows show discrete dynamics of SFC. d-e, Snapshots (18 min intervals) of PSM tissue (lateral view, cell membrane marker, magenta) over the course of a 7h movie of a clock-intact embryo (d) and corresponding snapshots of SFC of ERK activity (e). Cells experiencing the discrete shifts of SFC within the first 4h (determination, dashed colored lines, e) are tracked until they establish somite boundaries (solid lines starting from a frame before determination, d). Tissue is straightened along the A-P axis. Posterior is bottom. Dorsal is left. f, SFC shifts correlate with final somite sizes in tracked boundaries (n=22 somites observed in 6 embryos). Red line is linear fit with 95% C.I. (R2=0.73). g, Determination front position for pulsatile SU5402 treated clock-deficient mutants (Fig. 2f; T0=0 min: n=34; T1=12 min: n=37; T2=36 min: n=30 embryos over 2 independent experiments) as quantified from SFC of ppERK levels for three time points (p=0.0894 for before pulse to after pulse and p<0.0001 for both before pulse to after washout and after pulse to after washout, Kruskal-Wallis ANOVA test with Dunn’s multiple comparison correction). h, The segmentation clock drives segmental commitment in mid-PSM and separately instruct RC polarity in aPSM. Individual data points are shown in panels (a), (b) and (g) together with median (red) and interquartile range (error bars). Posterior is left, except in (d) and (e).
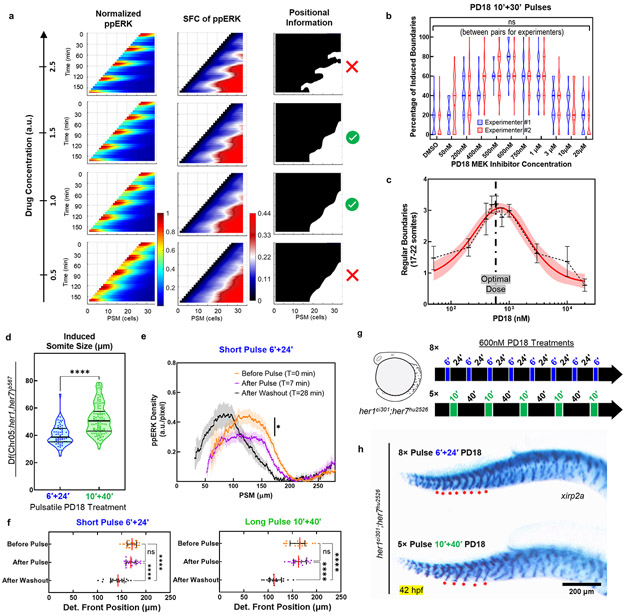
Simulations of the COG model predicted not high or low but only intermediate drug concentrations can create discrete SFC shifts and induce successful segmentation (Extended Data Fig. 8a). We tested this prediction by treating clock-deficient mutants at optimized 10+30 min regimen with MEK inhibitor doses varying over two orders of magnitude (Extended Data Fig. 8b). Confirmatively, we identified an optimal dose above and below of which somite boundary induction fails (Extended Data Fig. 8c).
We next tested whether different pulse periods can induce different sizes of somites. Somites decreased in size by 22% (51.8±0.9μm to 40.4±1.0μm) with a shorter MEK inhibitor pulse (Extended Data Fig. 8d). This pulse was still sufficient to drive ppERK oscillations (29.5% reduction in gradient amplitude, Extended Data Fig. 8e) and discrete SFC shifts (Extended Data Fig. 8f). Interestingly, shorter MEK inhibition pulses induced 8 boundaries within a comparable region where long pulses in same total duration induced only 5 boundaries (Extended Data Fig. 8g, h). Hence, a population of cells can be grouped into varying number of somites by merely changing periodicity of determination front shifts. We concluded that the clock drives segmentation by periodically inhibiting the ppERK and the SFC mechanism could extract discrete positional information from an oscillatory gradient (Fig. 4h).
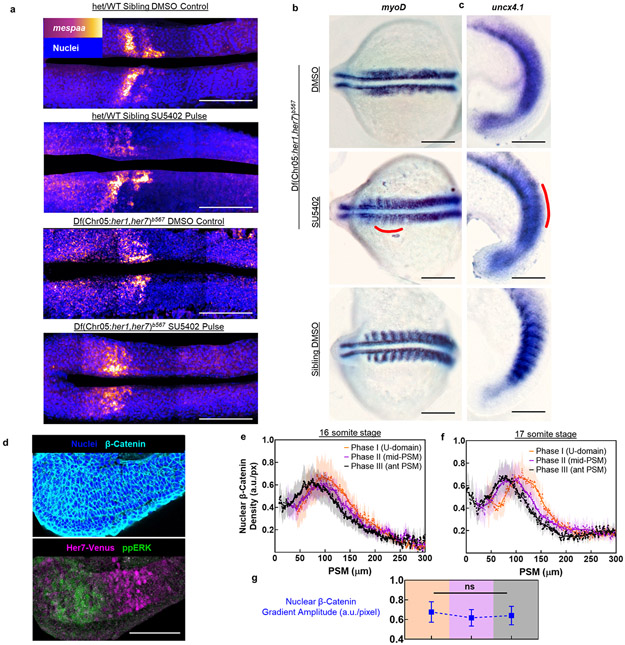
After controlling segmental commitment in mid-PSM, the clock establishes the rostrocaudal (RC) polarity of presumptive somites by interacting with a battery of genes in aPSM28. RC polarity is needed for subsequent differentiation of the somitic mesoderm and segmentation of the peripheral nervous system4,31. Establishment of somite RC polarity depend on kinematic clock waves28, but not on ppERK activity18. Therefore, we predicted that global inhibition of the ppERK will not restore the RC polarity in induced somites. To test this prediction, we performed in situ hybridization for mespaa (rostral marker) (Extended Data Fig. 9a), as well as myoD and uncx4.1 (caudal markers, Extended Data Fig. 9b,c). Unlike sibling control embryos, expression of neither mespaa, nor myoD and uncx4.1 were RC polarized in induced somites. These results untangled two consecutive roles of the clock in the PSM (Fig. 4h): 1) In mid-PSM, the clock determines somite boundaries solely by discretizing the position of the determination front. 2) Anteriorly, the clock establishes RC polarity in presumptive somites independent of ppERK signaling18,28.
Discussion
While the segmentation clock is necessary for sequential segmentation in vivo, how it instructs segmental commitment remained unknown4. Here, we showed the clock acts hierarchically upstream of ppERK gradient triggering its oscillations. However, an oscillatory gradient is unexpected to encode reliable positional information at thresholds (according to the CW model). We here revealed the SFC detection can interpret robust positional information from the oscillatory ppERK gradient, while other plausible alternatives (concentration threshold, slope, and temporal fold change) fail to do so (see Supplementary Discussion 3; Extended Data Fig. 10). Therefore, we propose the COG model in which the clock triggers segmental commitment by discretizing positional information (i.e., as an analog-to-digital converter). Restoring this mechanism can drive segmentation in vivo even in the absence of a molecular clock.
Global inhibition of ppERK triggered a segmentation response only in mid-PSM but not in posterior and anterior PSM cells in clock mutants. For instance, cells located in pPSM at the end of all pulses, which experienced several cycles of ppERK oscillations, still failed to segment. Instead, a single boundary commitment was executed only by mid-PSM cells located at the determination front during each pulse (Extended Data Fig. 6b,c). Thus, our results indicate that the clock acts locally and its kinematic waves are not necessary for segmental commitment.
The segmentation clock was previously reported to only affect regression of ppERK gradient in zebrafish24,26 but trigger oscillations of it in mice21. Our results indicate these findings are two sides of the same coin: Swift reduction of ppERK levels by the clock is manifested as ppERK oscillations in pPSM and an accelerated signal drop in mid-PSM. In clock overexpression experiments, ppERK reduction within 10 min (Fig. 1g) is similar to the changes in ppERK amplitude in wild-type embryos (Fig. 1e; Extended Data Figs. 1k and 4), recapitulating the timescale of zebrafish segmentation clock. Prolonged clock overexpression (60 min), comparable with mice segmentation clock timescale, further suppressed the ppERK levels (Fig. 1f,g; Extended Data Fig. 1g). Thus, our results reveal conservation of ppERK gradient dynamics between zebrafish and mice. Although joint targets of Fgf and Wnt signaling oscillate in mice22,32, it is unknown whether nuclear β-Catenin itself oscillates or not. By IHC, we did not observe oscillations in nuclear β-Catenin gradient in zebrafish (Extended Data Fig. 9d-g). Therefore, with its conserved dynamics, the ppERK gradient may function in a universal segmentation mechanism among vertebrates (see Supplementary Discussion 1). Commitment to segmentation occurs cell non-autonomously 5. Therefore, the mechanism decoding the SFC of ppERK could depend on biochemical or mechanical signaling between cells through cell membrane proteins expressed in the PSM such as ephrins, integrins, and cadherins.
Segmental metamerism is a conserved feature of the body plans of diverse bilateria1-4. Because clocks and morphogen gradients differ dramatically among vertebrates and arthropods, it is unclear whether a common design principle governs segmentation across metazoans3,4,6-8. We hereby propose that while the molecules diverge dramatically among species, sequential segmentation can still be achieved as long as a clock stamps its periodicity on a morphogen gradient. Supportively, clock and gradient interactions were also inferred in sequentially segmenting invertebrates3. Furthermore, in synthetic biology, molecular oscillators, diffusible gradients, and juxtacrine signaling have been generated 33-36. We anticipate our findings will inspire engineering repetitively organized tissues in dish 37,38 by utilizing pulsatile perturbation of signaling gradients.
Methods
Animals
All the fish experiments were performed under the ethical guidelines of Cincinnati Children’s Hospital Medical Center; animal protocols were reviewed and approved by Cincinnati Children’s Hospital Medical Center Animal Care and Use Committee (Protocol # 2020-0031). Transgenic Tg(ubi:ERK-KTR(NLS3)-mTagBFP)ci304 (generated in this study, Extended Data Fig. 2a-c), Tg(her7:her7-Venus)ci303 (generated in this study, Extended Data Fig. 2d-l), Tg(hsp70l:HA-her1;ef1α:EGFP)14, and mutant Df(Chr05:her1,her7)b567/+ 25, her1ci301her7hu2526 30, as well as AB wild-type adult fish were used in experiments. Fish were bred and maintained at 28.5°C on a 14/10-hour light/dark cycle. Non-transgenic littermate controls were used in heatshock experiments. Embryos were manually dechorionated in fish system water using needle tips for all experiments.
Generation of Tg(her7:her7-Venus)ci303 transgenic line
We used the 12,106 bp region between the transcriptional start sites of her1 and her7 genes as the promoter and regulatory sequences for her7. We retrieved these regulatory sequences by using BAC recombination technique39 as previously described40,41 to generate a transgenic line for her7 (Extended Data Fig. 2d), which is more critical than her1 in zebrafish segmentation40,42,43. CH211-283H6, which contains the complete her1/7 locus plus adjacent sequence, was used as the host BAC. We inserted a linker sequence from44 between the genomic sequence of her7 (including 5’UTR, protein coding sequences and the introns, but excluding the stop codon and 3’UTR) and XmaI recognition site. We next inserted mVenus coding sequence downstream of XmaI site but upstream of the stop codon, followed by SbfI and AscI recognition sites. We fused an 870 bp sequence (including 365 bp her7 3’UTR and 505 bp following the 3’UTR) downstream of mVenus (Extended Data Fig. 2d). All of these sequences were cloned into the pDestTol2pA plasmid45. One-cell stage wild-type AB embryos were injected with 1-2 nL of 20 ng/μL Tol2 transpose RNA and 25 ng/μL pDestTol2-her7:her7-Venus circular plasmid. We used Venus forward (TGCAGGATCCATGGTGAGCAAGGGCGAG) and her7-3’UTR reverse (AATTGGGCCCAATGGTGAATATTTCACTTTT) primers to screen adult fish for transgene integration by fin clipping and PCR. The Tg(her7:her7-Venus)ci303 line was generated from a founder fish; it displays reproducibly strong oscillating expression and transmits as a single Mendelian locus. We used the reverse strand of mVenus as a probe for in situ hybridization (ISH). The Venus ISH (Extended Data Fig. 2e) confirmed that the transgene is short-lived, and its expression pattern mimics that of her7 with dynamic stripes in the PSM. Importantly, we did not observe somite boundary defects in these transgenic animals. Heterozygous transgenic embryos had the same number of somites as of wild-type fish whereas homozygous transgenic embryos made one less somite similar to previously published Her1-Venus transgenic embryos44,46.
Generation of Tg(ubi:ERK-KTR(NLS3)-mTagBFP)ci304 transgenic line
We first fused ERK-KTR(NLS3)47 (Addgene plasmid #110165 gifted by Iva Greenwald) with mTagBFP48 (pTagBFP-C1, Evrogen) using Spe1 restriction site and inserted into pCS2+ plasmid using BamHI and XbaI restriction sites. To make the transgenic line, we inserted ERK-KTR(NLS3)-mTagBFP construct into pDestTol2-ubi plasmid downstream of ubiquitin promoter using NotI and ClaI sites. We cloned ubiquitin promoter into pDestTol2pA plasmid45 between ApaI and NotI recognition sites. All the cloning was confirmed by Sanger sequencing. It was noted that mTagBFP had a point mutation converting 20th amino acid from aspartic acid to glycine, but this had no detectable effect on the fluorescence of mTagBFP. To create the double reporter transgenic line, we injected Tg(her7:her7-Venus)ci303 heterozygous embryos at the one-cell stage with 150 pg of Tol2 transpose RNA and 70 pg of pDestTol2-ubi:ERK-KTR(NLS3)-mTagBFP. Injected embryos were screened under microscope for blue fluorescence and only the BFP positive ones were raised to obtain founders. The founders (F0) were identified by crossing with Tg(her7:her7-Venus)ci303 homozygous fish and BFP positive embryos were raised for F1 generation. The F2 generation was obtained by crossing F1 fish with Tg(her7:her7-Venus)ci303 homozygous fish. All the experiments were performed on F2 and F3 generations.
Antibodies
The following primary antibodies were used for immunohistochemistry experiments with indicated final concentrations: mouse monoclonal anti-ppERK1/2 (M9692, 1:1000/1.5-2 μg/mL, Sigma), rabbit monoclonal anti-β-Catenin (#9562,1:200, CST), chicken monoclonal IgY anti-GFP (A10262, 5 μg/mL, Invitrogen), rat anti-HA (#3K10, 1:400, Roche), mouse anti-F59 Myosin Heavy Chain (AB528373, 1:10/ 0.2-0.5 μg/mL, DSHB), and rabbit anti-pFAK (44-624G, 1:400, Invitrogen). Primary antibodies were targeted with 1:200 dilutions of Alexa Fluor 488 goat anti-chicken IgG H+L (A11039, Invitrogen), Alexa Fluor 594 goat anti-mouse IgG H+L (A11005, Invitrogen), Alexa Fluor 647 goat anti-rabbit IgG (A21245, Invitrogen) or Alexa Fluor 647 goat anti-rat IgG H+L (A21247, Invitrogen) for corresponding primary species. Alexa Fluor 488 Phalloidin (A12379, 1:200, Thermo Fisher) was used against F-actin of muscle fibers.
Pulsatile Drug Treatments
Clock-deficient mutants and their wild-type/heterozygous siblings were dechorionated using needle tips and phenotype-identified according to their broken/intact somite boundaries. A 10 mM stock solution of SU5402 drug was prepared in DMSO and diluted in fish system water to 30 μM for treatment. Homozygous and sibling embryos were treated together at room temperature in the SU5402 solution to inhibit Fgf receptor activity, or in corresponding DMSO dilution (1:333) as controls. 10 min pulse treatments were followed with a quick rinse in fresh system water and 30 min washout durations in system water at 28°C incubator. 5 treatment pulses were performed beginning from 14 somite stage. SU5402 treated clock-intact sibling controls formed their 17th – 22nd somites bigger than DMSO treated counterparts (Extended Data Fig. 6b). For MEK inhibitor, PD184352, we similarly prepared a 10 mM stock solution in DMSO and diluted it to tested concentrations. To test various drug treatment concentrations and durations (Extended Data Figs. 6e,g, and 8b), we performed 5 treatment pulses beginning from 14 somite stage. For five long vs. eight short pulse experiments with the MEK inhibitor, we used homozygous her1ci301her7hu2526 mutants.
Heatshock Experiments
Transgenic heterozygous hsp70l:HA-her1;ef1α:EGFP male fish were outcrossed with wild-type females, and embryos were raised at 23°C following 50% epiboly stage until the next day. Transgenic fish were identified using the GFP+ transgenic indicator signal under a dissection microscope. Then, embryos were heatshock treated in 60 mL of prewarmed (to 37.5°C in a water bath) fish system water in glass bottles after dechorionation using needle tips. 14-16 somite stages embryos were treated, according to their heatshock durations (10-60 min), so that the end of heatshock stage for all embryos matched to 16 somites before immediate fixation with 4%PFA (4% PFA in PBS) at room temperature (RT). Three control conditions were also fixed as follows: Not heatshocked transgenic siblings (to test possible leaky promoter expression), not heatshocked wild-type siblings (negative control), and longest duration (60 min) heatshocked wild-type siblings (to test possible heatshock artifacts).
smFISH and Imaging
RNA detection by the RNAscope Fluorescent Multiplex Detection kit (Advanced Cell Diagnostics, 320851) and confocal imaging were performed as previously described30. Briefly, Tg(her7:her7-Venus)ci303 embryos were fixed at the 12-14 somite stage. Her1-C3 probe (433201-C3) was diluted with EGFP-C1 probe (400281) solution in 1:50 ratio. Amp4B was used to amplify her1 and Venus transcripts. Flat-mounted PSM tissues were imaged on a Nikon A1R HD confocal microscope with 100× Plan Apo 1.45 NA objective and resonant scanner. Tiled images were acquired to cover the whole PSM tissue with 0.27 μm z-stacks. Images were stitched with Nikon NIS-Elements software.
in Situ Hybridization and Imaging
Transgenic her7:her7-Venus embryos were stained for Venus expression. DIG labeled RNA probes were prepared by in vitro transcription, and anti-digoxygenin (DIG)-AP Fab fragments (Roche, 1093274) were used. Embryos raised at 23°C were fixed at 10-12 somite stages with 4%PFA at RT for 2 hours. Fixed embryos were washed in 0.1%PBS-Tw (0.1% Tween20 in PBS), dehydrated in methanol and rehydrated following previously reported standard in situ hybridization protocols49. In pulsatile drug treatments, rostrocaudal (RC) polarity establishment was characterized by ISH probes for uncx4.1, myoD and mespaa. Mespaa probe was labeled with Fluorescein and anti-Fluorescein-AP Fab fragments (Roche, 1426338) were used and the signal was observed using Perkin Elmer TSA Plus Fluorescein Amplification System in flat-mounted slide samples. Other in situ hybridization samples stained with NBT/BCIP were imaged as whole embryos in petri dishes filled with 1.5% agarose in PBS (wedged-shaped troughs made with a plastic mold plate) on a dissection microscope. Clock-deficient mutants and their wild-type/heterozygous siblings were stained for xirp2a expression. After NBT/BCIP coloration, embryos were briefly fixed and incubated in methanol for clearing the yolk staining. Samples were then equilibrated in 83% glycerol before imaging in glycerol on a Leica LS2 inverted microscope with 10× NA 0.30 dry objective.
Immunohistochemistry and Imaging
Immunostaining of whole embryos was performed as previously described5. For all experiments, embryos were fixed at RT for 2 hours and permeabilized at RT for 1 hour with 2%PBS-Tx before 2 hours serum blocking step at RT. Triple staining was performed for ppERK, β-catenin and Her7-Venus proteins with corresponding antibodies, using MAB-D-Tx (150 mM NaCl in 0.1 M maleic acid buffer, pH 7.5, 1% DMSO and 0.1% Triton X-100 detergent) buffer for washes and 2% fetal bovine serum (FBS) and 0.5% GS in MAB-D-Tx for serum blocking and antibody solutions. For immunostaining of HA-her1 proteins, 0.1%PBS-Tx was used for washes and a serum cocktail (2% normal sheep serum (NSS), 2%w/v BSA and 0.5% GS) in 0.1%PBS-Tx was used for serum blocking and antibody solutions. In Phalloidin and F59 double staining experiments, embryos were stained in Phalloidin diluted in 0.1%PBS-Tw solution after the permeabilization step. 2% BSA and 5%NSS in 0.1%PBS-Tw was used for serum blocking and antibody solutions for F59 staining50. In pFAK experiments, 0.1%PBS-Tx with 0.1%DMSO and 0.5% GS was used for serum blocking and antibody solutions51. Fixed samples in immunostaining protocols were mounted on glass slides (laterally for later than 15 somite stage, flat-mounted for earlier). Nikon A1R GaAsP inverted confocal microscope with a 40× apochromatic λS DIC-water immersion 1.15 NA objective lens (2 μm sectioning, 11 slices around the mid-PSM tissue for somitogenesis stages; 3 μm sectioning, 7 slices covering hindbrain to tail body axis for later stages) was used for imaging.
Live Embryo Imaging
For simultaneous live imaging of segmentation clock and ERK activity, double reporter fish Tg(ubi:ERK-KTR(NLS3)-mTagBFP+/−;her7:her7-Venus+/+) were injected at single cell stage with cocktail mRNA, containing 300 ng/μl of mCherry-CAAX (membrane marker) and H2B-irFP (nuclear marker, we cloned irFP from Addgene plasmid # 111510 kindly gifted by Jared Toettcher Lab into pMTB2-H2B-tagRFPt plasmid kindly gifted by Saulius Sumanas Lab, replacing tagRFP) for cell segmentation. Embryos were incubated at 28°C for 6 hours and then transferred to 23°C for next day imaging. Prior to imaging, embryos were screened for BFP signal. For near-objective imaging, the yolk of 10-11 somite stage whole embryos were punctured in tissue dissection medium and imaged inside tissue growth medium52, with careful consideration not to damage the embryonic body. Embryos were laterally mounted on a coverslip within a PDMS based 150 μm depth chamber with air access for live imaging. During image acquisition, temperature was maintained at 25.0±0.7°C with TOKAI HIT on-stage incubator system. To prevent twitching, embryos were anesthetized with Tricaine in medium.
Time-lapse imaging in 4 fluorescent channels and brightfield channel was performed on a Nikon A1R GaAsP inverted confocal microscope with a Nikon Plan FLUOR 40× 1.3 NA Oil OFN25 DIC N2 objective lens. A 16 μm thick section of mediolaterally centered PSM tissue was imaged at 0.27 μm pixel size in x-y direction and 2 μm z-sectioning for 5-7 hours. Axial elongation and health of the punctured embryos were observed throughout image acquisition. For kymograph analysis of SFC of ERK activity in clock-intact and clock mutant embryos, we performed deep imaging with 21 z-layers in three fluorescent channels, although only 17 z layers (covering one mediolateral side of the PSM) were used for analysis.
For ERK activity reporter response experiments (Extended Data Fig. 2c), we used 20 somite stage whole embryos. The upper body was embedded in 1% agarose in system water and the lower body including posterior somites, PSM and tailbud were uncovered. During imaging, after T=0 of x-axis, we replaced 1:200 DMSO dilution in system water with 50μM SU5402.
For live imaging of clock reporter line, her7:her7-Venus embryos carrying a nuclear marker (tagRFP) were imaged in glass bottom dishes covered with agarose (1% agarose in E3 medium). Cylindrical holes were made in agarose using glass injection needles, and embryos were placed in the wells with lateral orientation, directly against the bottom coverslip. The microscope room was temperature controlled at 22°C throughout the experiments. Transmitted light, YFP channel (mVenus) and RFP channel (nuclear marker) images were taken every 5 min over 14 to 26 somite stages. Nikon A1R GaAsP inverted confocal microscope with a 20× apochromatic λS DIC-water immersion 0.95 NA objective lens (4 μm sectioning).
For pulsatile SU5402 treatment experiments, live embryos near the end of somitogenesis were anesthetized with Tricaine and mounted on glass bottom culture dishes with agarose molds designed to hold embryos laterally by supporting them from their yolks and tails. Imaging is performed under DIC-Nomarski light passing through a polarizer and 10× objective lens on an inverted Nikon Ti-2 microscope, with Andor Xyla 4.2 megapixel, 16-bit sCMOS monochromatic camera (5 μm sectioning).
Statistics and Reproducibility
We used parametric student t-test (two-tailed, without equal standard error assumptions with Welch’s method) for all statistical significance results in between quantifications and consecutive calculations. We used sample-size relevant corrections indicated in figure legends for multiple comparisons. If distributions failed Shapiro-Wilk normality test, we used Mann-Whitney non-parametric rank-comparison test for two data sets, and Kruskal-Wallis non-parametric test with relevant multiple comparison corrections for three or more data sets. For instance, we used Brown-Forsythe ANOVA, unpaired two-tailed test with Welch correction in Fig.1e; Two-tailed Mann-Whitney tests in Fig. 1g and Fig.1n. All numbers of independent repeats of experiments are indicated alongside n numbers indicating total number of independent samples. Fish embryos harvested from at least 5 separate natural spawning were mixed for each experiment. All the statistical tests, curve fitting, and distribution calculations (mean±s.e.m., median and quartiles, confidence intervals) were performed in GraphPad Prism software.
Mathematical Modelling
We expanded our previously published signaling network model5 to 2-D and incorporated the inhibitory effect of clock on ppERK (active ERK) levels. The model consists of the following seven network elements: mRNA of Fgf (mFgf), Fgf protein (Fgf), Fgf receptor-ligand complex (Comp), Clock proteins (Clock), inactive ERK (Erk), active ERK (pErk), and negative feedback inhibitor protein (Inh). The model incorporates time delays for three cellular processes: translation and secretion of Fgf (τL), downstream cascade from receptor complex to ERK phosphorylation (τC ), and transcription and translation of Inh (τI).
The model consists of five ordinary differential equations, one partial differential equation for Fgf protein, and one algebraic equation for the clock protein. Set of equations used in modeling are provided in Supplementary Methods. Reaction rate and time delay values are estimated from physiologically relevant ranges and provided in Supplementary Data Table 1. The clock was modelled as a sinusoidal input, with period nonlinearly increasing from 30 min at the posterior to 86 min at the anterior (from experimental data in Extended Data Fig. 2f).
The simulation space was set as a hexagonal lattice of two-dimensional tissue of 44 × 4 cells, which translates into a physical length of 308 × 28 μm, defining constant cell spacing in the PSM as 7 μm. Only tail bud cells, defined as the most posterior 8 rows of PSM cells, actively transcribed the fgf RNA. We assumed receptor levels are high enough preventing depletion by ligand binding. We maintained a fixed tissue length throughout our simulation; however, to account for tail growth in a real zebrafish PSM, we added a cell at the posterior end while simultaneously removing one from the anterior end of the PSM every 7.7 min (0.911 μm/min tail elongation speed). We employed the forward Euler method to solve the differential equations by implementing a central-difference scheme for the Laplacian diffusion term in Eq. (3) (Supplementary Methods).
For the Fgf protein, we applied a no-flux boundary condition at the posterior end, and an absorbing boundary condition at the anterior end of the tissue. However, the model does not rely on a non-local effect in Fgf signaling due to ligand diffusion. We assumed the clock decreases ppERK levels independently of phosphatases. Clock mutants are simulated by setting the oscillation amplitude of clock as zero. For pulsatile drug treatment simulations of mutants, we repeated treatment with a cycle matching to the experimentally optimized conditions. SU5402/ PD184352 inhibitory drug treatments are defined with a unitless fold-change parameter drug > 1 dropping ERK activation rate as:, for a fractional (pulse) duration of every cycle as pulse = Tdrug/T. The temporal and spatial resolutions are 0.004 min and 8 μm, respectively. Simulations were performed in MATLAB with an Intel Core i7, 2.90 GHz processor and 16 GB RAM.
Extended Data
Extended Data Figure 1: The segmentation clock drives oscillatory gradient dynamics in wild-type embryos by lowering ppERK levels.
a, Wild-type/heterozygous siblings (with proper segmentation, right) are collected alongside Df(Chr05:her1,her7)b567/b567 clock-deficient embryos (in which somite segmentation fails, left). b-e, Grouping of a single somite stage into three phases according to PSM sizes of clock mutants (b) and their siblings (d). Average PSM sizes (mean±s.d.) of each group of clock mutants (c, n=19, 20, and 19 embryos over 3 independent experiments respectively) and their clock-intact siblings (e, n=19, 21, and 20 embryos over 3 independent experiments respectively) for data presented in Fig. 1c. f, her1 expression was ubiquitously driven for various durations from 10 to 60 min. All embryos were simultaneously fixed right after heatshock at 16 somite stage. Three controls were also fixed: Not heatshocked transgenic siblings, not heatshocked wild-type siblings, and 60 min heatshocked wild-type siblings. g, ppERK gradient quantified along the PSM throughout heatshock experiments (mean±s.e.m.) for data presented in Fig. 1g. h, Grouping of each somite stage into two phases according to PSM sizes (tail grows from dark to light colors) for wild-type embryos of three consecutive somite stages (3 somites, blue, 4 somites, purple, 5 somites, orange). i, Average PSM sizes (mean±s.d., n=12, 9, and 7 embryos over 2 independent experiments for three consecutive stages respectively) of embryos for each phase. j, ppERK levels, aligned from anterior (lab frame), throughout the PSM for these groupings (n=24, 17, and 14 embryos over 2 independent experiments for 3, 4, and 5 somite stage respectively, mean±s.e.m). k-m, Gradient amplitudes (red, k) and ppERK levels in cells located at pPSM (x=175 μm, green, l) and mid-PSM (x=350 μm, black, m) from data in (j). The amplitude of ppERK gradient (k) oscillates within each somite stage (28% average change, p=0.0037, 0.0076, and 0.035 respectively for the 3, 4 and 5 somite stages). ppERK levels similarly oscillate in the pPSM cells (l, p=0.035, 0.034, 0.029 for consecutive stages), and decays with a two-speed trend in the mid-PSM cells (m). mean±s.e.m. Posterior is left.
Extended Data Figure 2: ERK-KTR and Her7-Venus reporters faithfully recapitulate dynamics of ERK activity and segmentation clock.
a, Design of the ERK activity reporter line. Orange domains are peptide sequences from Elk1 protein for ERK binding. Teal domains are phospho-acceptor sites at the end of docking site and in NLS sequence. Amino acid sites taking part in NLS and NES functions are colored according to their chemistry. b, ERK activity gradient along the PSM calculated from live ERK-KTR reporter (black, N=4, n=6 embryos, mean±s.e.m.) or IHC of ppERK (green, n=10 embryos, mean±s.e.m.) from 14 somites stage embryos. c, Time course response of ERK activity reporter imaged every 250 sec before and after 50 μM SU5402 treatment (n=11 embryos over 4 independent experiments, mean±s.e.m.). ERK activity is measured within a 61 μm diameter circular ROI in pPSM tissue next to notochord tip. Data is normalized (red dashed line) to average of the 6 frames (~25 min) taken in DMSO before addition of the drug after 0 min. Red solid line is exponential decay fit with 90% C.I. p=0.0135 between before treatment and 3rd time point into the treatment, Brown-Forsythe and Welch ANOVA tests with Dunnett’s T3 correction for multiple comparisons. d, Design of the Tg(her7:her7-Venus) reporter line. All introns (red) and UTR regions (empty boxes) of her7 locus are retained with exons (orange). mVenus (cyan) is inserted upstream of the stop codon and 3’UTR. e, In-situ hybridization (ISH) against Venus RNA in the her7:her7-Venus reporter line. Scale bar is 200 μm. f, Tail bud aligned (left) kymograph of cell nuclei masked Venus signal observed in live intact embryos from 14 to 24 somite stages (N=3, n=3 embryos). g-l, 3-D projection (14 μm, 60 z-slices) smFISH images for exemplary heterozygous (g-i) and homozygous (j-l) transgenic fish showing co-expression of endogenous her1 (red) and her7-Venus (cyan) transcripts in the flat mounted 12 somite stage embryo PSM tissues, overlaid with nuclei marker (gray). Posterior is left. Scale bar is 100 μm.
Extended Data Figure 3: Single cell tracking of segmentation clock and ERK activity.
a, Single cell tracks of ERK activity in a clock-intact embryo shown together with their average (magenta, mean±s.e.m.) (n=42 cells). b, c, Average (mean±s.e.m.) clock (b) and ERK activity (c) signal for cell tracks within each clock-intact embryo presented in Fig. 1j,m (n=47, 58, 35, 36, 22, 22, 42, and 9 cells for embryos #1-8 resp.). d, Single cell tracks of ERK activity in a clock mutant shown together with their average (black, mean±s.e.m.) (n=48 cells). e, Average (mean±s.e.m.) dynamics of the ERK activity for cell tracks within each clock mutant presented in Fig. 1l (n=32, 36, 23, 48, 32, 29, and 42 cells for embryos #1-7 resp.).
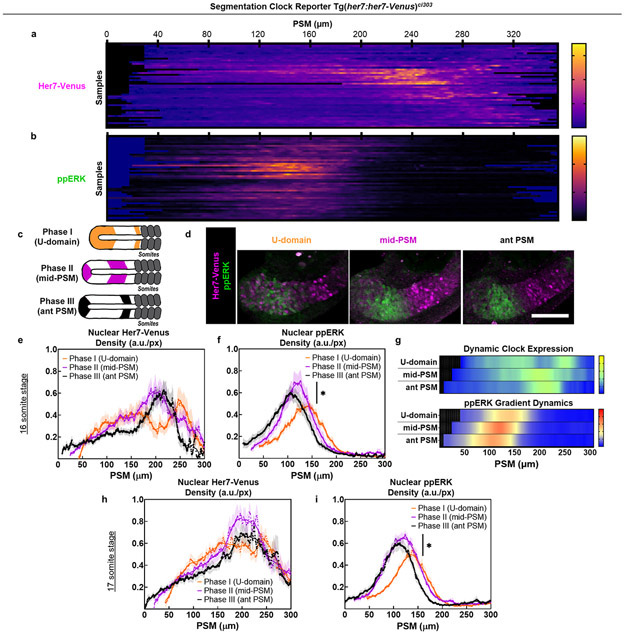
Extended Data Figure 4: ppERK gradient oscillates in the PSM correlated with clock expression.
a-b, Kymographs of IHC data of Her7-Venus (a) and ppERK (b) from 16 somite stage embryos (n=47) ordered according to their clock phases. c, Same stage embryos can be grouped into three phases according to their clock expression along the PSM: U-domain (Phase I, orange), mid-PSM stripe (Phase II, purple), and aPSM stripe (Phase III, black). d, Representative pictures of Her7-Venus (magenta) and ppERK (green) for three phases of clock expression (N=2). Scale bar is 100 μm e-f, Nuclear density profiles of Her7-Venus (e) and ppERK (f) along the PSM for each group at 16 somite stage embryos (U-domain, Phase I, n=14; mid-PSM, Phase II, n=15, and aPSM, Phase III, n=19). p=0.0326 (Welch’s two-tailed t-test) between U-domain and mid-PSM ppERK peaks. g, Kymographs of Her7-Venus (top) and ppERK (bottom) for three phases of 16 somite stage IHC data (n=17, 16, and 17 embryos over 2 independent experiments). h-i, Nuclear density profiles of Her7-Venus (h) and ppERK (i) along the PSM for each group at 17 somite stage embryos (U-domain, Phase I, n=13; mid-PSM, Phase II, n=14, and aPSM, Phase III, n=13). p=0.0148 (Welch’s two-tailed t-test) between U-domain and mid-PSM ppERK peaks. Lines and shaded error bars indicate mean±s.e.m. in (e,f,h,i). Posterior is left. Note that ppERK level is higher when the PSM size is the smallest in Fig. 1c while it is lower in the corresponding phase in this figure. This difference is due to the change of clock phase profiles over different somite stages as shown in 46.
Extended Data Figure 5: Simulations suggest pulsatile inhibition of ppERK signaling can imitate the endogenous clock.
a, Simulation predictions for ppERK dynamics (plotted as kymographs in lab frame) for global inhibition experiments: Various drug concentrations (outer y-axis) and treatment/washout durations (outer x-axis) are simulated. Clock mutant (absent, b) and clock-intact (kinematic waves, c) simulations are also presented for comparison. Posterior is left.
Extended Data Figure 6: Pulsatile inhibition of ppERK activity simulates the effect of the clock.
a, Sizes of 18th to 28th somites measured from DIC images of 12-pulse experiments (box (median and interquartile range) and whisker (10th – 90th percentile) plot): induced somites in clock mutants treated with SU5402 (red, n=23 embryos over 3 independent experiments) and wild-type embryos treated with DMSO (black, n=17 embryos over 2 independent experiments). p=0.0544 – 0.9929 (n.s.) for all induced somites except the first one (p<0.0001 for the 18th somite, 2-way ANOVA with Tukey’s test for multiple comparison). b, SU5402 (5 pulses) increased sizes of 17th – 22nd somites in clock-intact embryos (n=19 for DMSO, n=26 for SU5402, p=0.0034 for 18th somite and p<0.0001 for 19th, 20th, and 21st somites, 2-way ANOVA with Tukey’s test for multiple comparison; box (median and interquartile range) and whisker (10th – 90th percentile) plot). c, Time-lapse images taken every 45 min beginning from the appearance of first induced boundary at T=140 min with first drug pulse (n=36 embryos over 2 independent experiments). Induced boundaries are highlighted with green arrows (right). DMSO treated clock mutants (n=25 embryos over 2 independent experiments) could not induce any boundaries (left). Lateral view. Note that there is a 3-somite delay from first pulse to first affected boundary in (b) and (c). d, Representative xirp2a boundary staining of clock-deficient mutant (top) or clock-intact sibling (bottom) embryos treated with same concentration (30 μM) SU5402 beginning at 12 somite stage for 225 min at 28°C. Scale bar is 200 μm. e, At the end of 225 min 30 μM SU5402 treatment, clock intact embryos displayed bi-modal distribution of ERK activity (n=19 embryos in Group I, magenta, and n=17 embryos in Group II, red over 2 independent experiments). Approximately half of SU5402 treated sibling embryos could not survive to later stages for xirp2 staining, while the other half formed some segments before onset of axis truncation, indicating necessity of ERK activity gradient for survival and segmentation. f, Induced somite sizes for changing concentrations and durations of drug treatments performed at room temperature, for five pulses; measured from xirp2a boundary staining (box (median and interquartile range) and whisker (10th – 90th percentile) plot and outliers as individual dots, n=59, 88, 96 and 84 induced somites from left to right respectively). p>0.1998 for n.s. comparisons, p=0.0007 between 30 μM, 10 min treatment and 40 μM, 6 min treatment and p<0.0001 for other comparisons (Kruskal-Wallis ANOVA test with Benjamini-Krieger-Yekutieli false discovery rate multiple comparison correction). g, MEK inhibitor drug PD184352 directly targets ERK activity downstream of Fgf receptor. h, Various durations of 5 pulses of PD184352 (600 nM) can induce somite boundaries (scored by xirp2a staining from left to right, n=58, 36, 44, 52, 54, 44 embryos over 3 independent experiments, in comparison to SU5402 treatment in Fig. 2j; n=170 embryos). Truncated violin plots with solid median and dashed quartile lines. p=0.0002 for DMSO vs. 10’-20’ treatment, p<0.0001 for DMSO vs. other comparisons, and p>0.3312 for SU5402 vs. PD184352 comparisons (Kruskal-Wallis ANOVA test with Benjamini-Krieger-Yekutieli false discovery rate multiple comparison correction). i, ppERK gradient along the PSM with 10’-40’ PD184352 pulses (n=24, 24, and 24 embryos over 2 independent experiments, for before pulse, after pulse, and after recovery from the treatment (before next pulse), mean±s.e.m.). Amplitude comparison is shown on the right (10-90th percentile box-whisker plot together with outlier dots, p=0.0001 for before vs. after pulse, p=0.8528 for before pulse vs. after washout; Brown-Forsythe ANOVA, unpaired two-tailed test with Welch correction).
Extended Data Figure 7: Characterization of somite boundaries following pulsatile drug treatments.
a, xirp2a ISH staining marks somite boundaries of a clock-deficient mutant treated 5× pulses of 30 μM SU5402. A short working distance objective is used to minimize out of plane staining from the other side of embryos. Drug targeted somites are numbered 1 – 5 from anterior to posterior. b-d, Boundary intactness and deficiency are calculated after light background subtraction and contrast enhancement (b) and local thresholding of the image for binarization (c). Trace LOIs (magenta) running in between the ventral and dorsal ends of somitic tissue are drawn by automated simple neurite tracer algorithm following xirp2a boundary staining (d). Percentage occupancy along the trace LOIs (average signal) identifies intact boundaries and measures deficiency level of non-intact boundaries. e-g, Phosphorylated focal adhesion kinase (pFAK, gem LUT from dark purple to burnt orange) and cell nuclei (cyan) staining of embryos fixed at 23 hpf (4 h after the 5th pulse). Clock-intact siblings treated with 600 nM PD184352 (n=37 embryos over 2 independent experiments, e), and clock-deficient mutants treated with DMSO (N=2, n=13, f) or 600 nM PD184352 (n=33 embryos over 2 independent experiments, g). Red stars show induced somite boundary epithelization driven by pulsatile treatments. Bottom images are pFAK staining alone shown in grayscale. Scale bars are 100 μm.
Extended Data Figure 8: Somite segmentation in mutants can be induced within a range of conditions.
a, Simulation of the COG model predicts only a medium dose of inhibitory treatment would result in discretization of positional information, i.e., successfully induce somite boundaries. SFC detection (middle) could extract reliable positional information (right, critical SFC threshold) from an oscillatory ppERK gradient (left) for a certain range of drug concentrations (middle rows). b, Percentage of successfully induced boundaries (# of intact boundaries over # of pulses) is assessed from xirp2a staining by two independent experimenters for various doses of five 10’+30’ PD184352 pulses (DMSO control left, n=58 embryos; PD184352 from 50 nM up to 20 μM, n=44, 70, 18, 54, 54, 50, 90, 48, 22, 64 embryos over 3 independent experiments, respectively, truncated violin plot with solid lines indicating quartiles). p=0.9824, 0.0932, 0.4365, 0.8045, 0.9824, 0.0633, 0.7284, 0.6164, 0.9824, 0.9824 and 0.1502 between experimenters from left to right resp., 2-way ANOVA with Holm-Šidák test for multiple comparisons. c, Number of induced boundaries (data in (b)) for various doses (black, mean±95% C.I.), fitted with a bell-shaped dose response curve (red solid line with 95% C.I.) in logarithmic scale. Vertical dashed line indicates optimal dose for boundary recovery. d, Induced somite sizes for either short (blue, 6’+24’) or long (10’+40’) pulses of 600 nM PD184352 (5×). Somite sizes are measured from xirp2a boundary staining (n=136 induced somites for long and n=58 induced somites for short pulses over 2 independent experiments). p<0.0001, Welch’s two-tailed t-test. Truncated violin plot, median as solid thick line, and scatter plot of all data points. e, IHC quantification of ppERK gradient along the PSM for short PD184352 pulses (n=25, 23, and 18 embryos over 2 independent experiments, for before pulse, after pulse, and before the next pulse). p=0.0391 between before pulse and after pulse (Brown-Forsythe ANOVA, unpaired two-tailed test with Welch correction). mean±s.e.m. f, Determination front position (scatter dots with median (red) and interquartile range error bars) in short (left) and long (right) pulse PD184352 treatments, quantified from data in panel (e) and Extended Data Fig. 6i. p=0.9987 and 0.9939 for before vs. after pulse in short and long pulse treatments respectively. p<0.0001 for other comparisons (Brown-Forsythe and Welch ANOVA tests with Dunnett’s T3 correction for multiple comparisons). Determination front stalls during drug treatment and shifts during recovery, similar to that in clock-intact embryos in Fig. 4b. g, Design of the experiment for splitting comparable sizes of trunk axes into varying numbers of induced somites with either 8× short or 5× long pulses of MEK inhibition in her1ci301her7hu2526 clock mutants. h, xirp2a staining for successfully induced somites with either small (top, short pulse, n=50 embryos over 2 independent experiments) or large (bottom, long pulse, n=59 embryos over 2 independent experiments) sizes in clock mutants. Red stars indicate induced somite boundaries covering same region of the trunk. Posterior is left.
Extended Data Figure 9: Kinematic stripes of clock are required for establishment of R-C polarity in somites and nuclear β-Catenin gradient does not oscillate.
a, Fluorescent in situ hybridization of mespaa with nuclei staining (blue, dorsal view). Clock-intact sibling embryos treated with DMSO (top, n=14) or SU5402 (second row, n=9) and clock mutants (bottom rows; n=14, and n=13 respectively). Embryos were fixed at the end of 4th drug treatment pulse. b, in situ hybridization of myoD for DMSO (top, n=15) or SU5402 (middle, n=22) treated clock mutants as well as DMSO treated clock-intact siblings (bottom, n=12). Embryos were fixed 2 h after 4th drug pulse. Induced boundary area is shown with red line. c, in situ hybridization of uncx4.1 for DMSO (top, n=22) or SU5402 (middle, n=29) treated clock mutants as well as DMSO treated clock-intact siblings (bottom, n=11). Embryos were fixed 2 h after 5th drug pulse. Induced boundary area is shown with red line. d, Cell nuclei (Hoescht 33682, blue) and immunofluorescence signals from antibodies against β-Catenin (cyan), Her7-Venus (magenta), and ppERK (green) proteins at 16 somite stage (N=2). e-f, Nuclear density profiles of β-Catenin proteins along the PSM at 16 (e) and 17 (f) somite stage embryos grouped into U-domain (Phase I, n=13, 16 somite stage; n=13, 17 somite stage), mid- PSM (Phase II, n=15, 16 somite stage; n=14, 17 somite stage), and aPSM (Phase III, n=19, 16 somite stage; n=13, 17 somite stage) phases of clock expression. g, Amplitude quantification of nuclear β-Catenin (blue) gradient for three clock phases of 16-17 somite stages (N=2, n=26, 29, and 32). p>0.6594 for all phases (Welch’s two-tailed tests). Lines and shaded error bars indicate mean±s.e.m. All microscopy images except panels (c) and (d) are dorsal views. Images in (c) and (d) are lateral views. Posterior is bottom / left. Black scale bars are 200 μm. White scale bars are 100 μm.
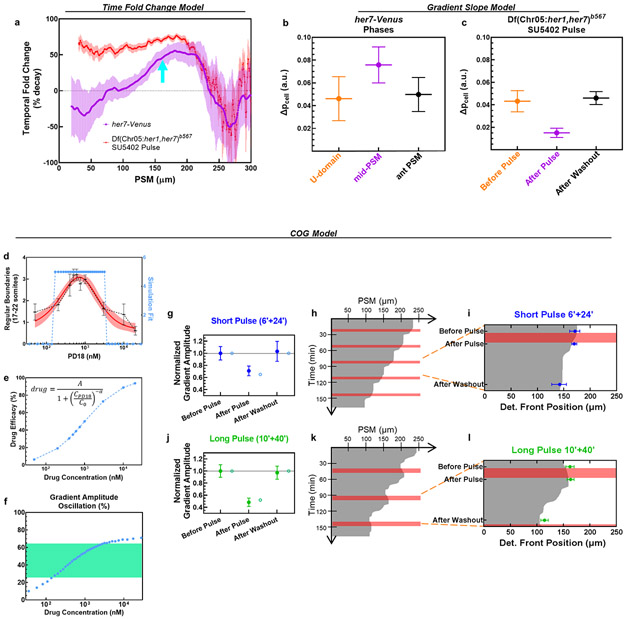
Extended Data Figure 10: Alternative signal readout models fail to explain segmental commitment whereas COG model fits observed results.
a, Temporal fold change of ppERK signal throughout the PSM, calculated for clock-intact her7-Venus reporter fish (magenta; from Extended Data Fig. 4f, Phase II–III transition) or SU5402 pulse treated clock-deficient mutants (red; from Fig. 2f, Before Pulse – After Pulse transition) at same stage. Determination front position in clock-intact embryos is indicated with cyan arrow. b-c, Slope of ppERK gradient (reported as ppERK signal difference over a cell distance) for three clock phases in her7-Venus reporter embryos (b; from Extended Data Fig. 4f) or SU5402 pulse treated clock-deficient mutants (c; from Fig. 2f). Data is shown as mean±s.e.m. (d) Simulations of COG model with varying drug parameter (light blue, right axis) fit to experimental data for PD184352 dose optimization in Extended Data Fig. 8c (mean±95% C.I.). (e) Experimental doses used in Extended Data Fig. 8c are converted into drug efficacy from the simulation fit in (d). Fit parameters are provided in Supplementary Table 1. (f) ppERK gradient amplitude oscillations driven by varying drug concentrations. Green zone highlights (26%-65%) amplitude oscillations for the doses succeeding to drive somite segmentation in (d). (g) ppERK Amplitude changes from the simulation of short pulse (6’+24’, blue) 600 nM PD184352 treatment (hollow circles, 35% drop) matching with experimental data in Ext. Data Fig. 8e (mean±s.e.m., normalized to before pulse). (h) Positional information (critical SFC of ppERK, 22%) kymograph (gray below, white above threshold) for short pulse simulations. Pink stripes highlight 6 min drug treatment pulses. Determination front makes 31.4 μm shifts every 30 min. (i) Determination front dynamics from the simulations overlaid with the experimental data in Extended Data Fig. 8f (blue, median, error bars are interquartile range). (j) ppERK Amplitude changes from the simulation of long pulse (10’+40’, blue) 600 nM PD184352 treatment (hollow circles, 48% drop) matching with experimental data in Extended Data Fig. 6i (mean±s.e.m., normalized to before pulse). (k) Positional information kymograph for long pulse simulations. Pink stripes highlight 10 min drug treatment pulses. Determination front makes 49.8 μm shifts every 50 min. (l) Determination front dynamics from the simulations overlaid with the experimental data in Extended Data Fig. 8f (green, median, error bars are interquartile range).
Supplementary Material
Acknowledgments:
We thank Ifunanya Ejikeme, Hannah Seawall, Matthew Batie, Matthew Kofron, Cincinnati Children’s Imaging Core, and Cincinnati Children’s Veterinary Services for technical assistance, Stephan Knierer for help in generating transgenic clock reporter line, Kemal Keseroglu, Bibek Dulal, Soling Zimik, Cassandra McDaniel, Susan Brown, Linda Holland, Nicholas Holland, Diethard Tautz and Andres Sarrazin for discussions, and Hannah Seawall, Raphael Kopan, Aaron Zorn, Brian Gebelein, Hedda Meijer and Kim Dale for providing feedback on the manuscript. This work was funded by a US N.I.H. (Eunice Kennedy Shriver National Institute of Child Health and Human Development) grant (R01HD103623) to E.M.Ö.
Footnotes
Competing Interests: The authors declare no competing interests.
Additional Information: Supplementary Information is available for this paper.
Data availability:
Original microscopy image files are provided at the BioStudies with accession number: S-BSST895 (https://www.ebi.ac.uk/biostudies/studies/S-BSST895). Source data are provided with this paper.
Code availability:
MATLAB codes and FIJI macros are provided at https://github.com/mfsimsek/erkactivitysegmentation (DOI: https://doi.org/10.5281/zenodo.7098199).
Main References:
- 1.Holland ND, Holland LZ & Holland PW Scenarios for the making of vertebrates. Nature 520, 450–455 (2015). [DOI] [PubMed] [Google Scholar]
- 2.Tautz D Segmentation. Dev Cell 7, 301–312 (2004). [DOI] [PubMed] [Google Scholar]
- 3.Clark E, Peel AD & Akam M Arthropod segmentation. Development 146(2019). [DOI] [PubMed] [Google Scholar]
- 4.Hubaud A & Pourquie O Signalling dynamics in vertebrate segmentation. Nat Rev Mol Cell Biol 15, 709–721 (2014). [DOI] [PubMed] [Google Scholar]
- 5.Simsek MF & Ozbudak EM Spatial Fold Change of FGF Signaling Encodes Positional Information for Segmental Determination in Zebrafish. Cell reports 24, 66–78 e68 (2018). [DOI] [PMC free article] [PubMed] [Google Scholar]
- 6.Pueyo JI, Lanfear R & Couso JP Ancestral Notch-mediated segmentation revealed in the cockroach Periplaneta americana. Proc Natl Acad Sci U S A 105, 16614–16619 (2008). [DOI] [PMC free article] [PubMed] [Google Scholar]
- 7.Sarrazin AF, Peel AD & Averof M A segmentation clock with two-segment periodicity in insects. Science 336, 338–341 (2012). [DOI] [PubMed] [Google Scholar]
- 8.El-Sherif E, Averof M & Brown SJ A segmentation clock operating in blastoderm and germband stages of Tribolium development. Development 139, 4341–4346 (2012). [DOI] [PMC free article] [PubMed] [Google Scholar]
- 9.Cooke J & Zeeman EC A clock and wavefront model for control of the number of repeated structures during animal morphogenesis. J.Theor.Biol. 58, 455–476 (1976). [DOI] [PubMed] [Google Scholar]
- 10.Palmeirim I, Henrique D, Ish-Horowicz D & Pourquié O Avian hairy gene expression identifies a molecular clock linked to vertebrate segmentation and somitogenesiss. Cell 91, 639–648 (1997). [DOI] [PubMed] [Google Scholar]
- 11.Holley SA, Geisler R & Nusslein-Volhard C Control of her1 expression during zebrafish somitogenesis by a delta-dependent oscillator and an independent wave-front activity. Genes Dev 14, 1678–1690 (2000). [PMC free article] [PubMed] [Google Scholar]
- 12.Jiang YJ, et al. Notch signalling and the synchronization of the somite segmentation clock. Nature 408, 475–479 (2000). [DOI] [PubMed] [Google Scholar]
- 13.Sawada A, et al. Zebrafish Mesp family genes, mesp-a and mesp-b are segmentally expressed in the presomitic mesoderm, and Mesp-b confers the anterior identity to the developing somites. Development 127, 1691–1702 (2000). [DOI] [PubMed] [Google Scholar]
- 14.Giudicelli F, Ozbudak EM, Wright GJ & Lewis J Setting the Tempo in Development: An Investigation of the Zebrafish Somite Clock Mechanism. PLoS Biol 5, e150 (2007). [DOI] [PMC free article] [PubMed] [Google Scholar]
- 15.Sonnen KF, et al. Modulation of Phase Shift between Wnt and Notch Signaling Oscillations Controls Mesoderm Segmentation. Cell 172, 1079–1090 e1012 (2018). [DOI] [PMC free article] [PubMed] [Google Scholar]
- 16.Cotterell J, Robert-Moreno A & Sharpe J A Local, Self-Organizing Reaction-Diffusion Model Can Explain Somite Patterning in Embryos. Cell Syst 1, 257–269 (2015). [DOI] [PubMed] [Google Scholar]
- 17.Dubrulle J, McGrew MJ & Pourquie O FGF signaling controls somite boundary position and regulates segmentation clock control of spatiotemporal Hox gene activation. Cell 106, 219–232 (2001). [DOI] [PubMed] [Google Scholar]
- 18.Sawada A, et al. Fgf/MAPK signalling is a crucial positional cue in somite boundary formation. Development 128, 4873–4880 (2001). [DOI] [PubMed] [Google Scholar]
- 19.Aulehla A, et al. Wnt3a plays a major role in the segmentation clock controlling somitogenesis. Dev Cell 4, 395–406 (2003). [DOI] [PubMed] [Google Scholar]
- 20.Bajard L, et al. Wnt-regulated dynamics of positional information in zebrafish somitogenesis. Development 141, 1381–1391 (2014). [DOI] [PMC free article] [PubMed] [Google Scholar]
- 21.Niwa Y, et al. Different types of oscillations in Notch and Fgf signaling regulate the spatiotemporal periodicity of somitogenesis. Genes Dev 25, 1115–1120 (2011). [DOI] [PMC free article] [PubMed] [Google Scholar]
- 22.Krol AJ, et al. Evolutionary plasticity of segmentation clock networks. Development 138, 2783–2792 (2011). [DOI] [PMC free article] [PubMed] [Google Scholar]
- 23.Dale JK, et al. Oscillations of the snail genes in the presomitic mesoderm coordinate segmental patterning and morphogenesis in vertebrate somitogenesis. Dev Cell 10, 355–366 (2006). [DOI] [PubMed] [Google Scholar]
- 24.Akiyama R, Masuda M, Tsuge S, Bessho Y & Matsui T An anterior limit of FGF/Erk signal activity marks the earliest future somite boundary in zebrafish. Development 141, 1104–1109 (2014). [DOI] [PubMed] [Google Scholar]
- 25.Henry CA, et al. Two linked hairy/Enhancer of split-related zebrafish genes, her1 and her7, function together to refine alternating somite boundaries. Development 129, 3693–3704 (2002). [DOI] [PubMed] [Google Scholar]
- 26.Sari DWK, et al. Time-lapse observation of stepwise regression of Erk activity in zebrafish presomitic mesoderm. Sci Rep 8, 4335 (2018). [DOI] [PMC free article] [PubMed] [Google Scholar]
- 27.Ay A, Knierer S, Sperlea A, Holland J & Özbudak EM Short-lived Her Proteins Drive Robust Synchronized Oscillations in the Zebrafish Segmentation Clock. Development 140, 3244–3253 (2013). [DOI] [PubMed] [Google Scholar]
- 28.Keskin S, et al. Regulatory Network of the Scoliosis-Associated Genes Establishes Rostrocaudal Patterning of Somites in Zebrafish. iScience 12, 247–259 (2019). [DOI] [PMC free article] [PubMed] [Google Scholar]
- 29.Regot S, Hughey JJ, Bajar BT, Carrasco S & Covert MW High-sensitivity measurements of multiple kinase activities in live single cells. Cell 157, 1724–1734 (2014). [DOI] [PMC free article] [PubMed] [Google Scholar]
- 30.Zinani OQH, Keseroglu K, Ay A & Ozbudak EM Pairing of segmentation clock genes drives robust pattern formation. Nature 589, 431–436 (2021). [DOI] [PMC free article] [PubMed] [Google Scholar]
- 31.Dias AS, de Almeida I, Belmonte JM, Glazier JA & Stern CD Somites without a clock. Science 343, 791–795 (2014). [DOI] [PMC free article] [PubMed] [Google Scholar]
- 32.Wahl MB, Deng C, Lewandoski M & Pourquie O FGF signaling acts upstream of the NOTCH and WNT signaling pathways to control segmentation clock oscillations in mouse somitogenesis. Development 134, 4033–4041 (2007). [DOI] [PubMed] [Google Scholar]
- 33.Toda S, Blauch LR, Tang SKY, Morsut L & Lim WA Programming self-organizing multicellular structures with synthetic cell-cell signaling. Science 361, 156–162 (2018). [DOI] [PMC free article] [PubMed] [Google Scholar]
- 34.Toda S, et al. Engineering synthetic morphogen systems that can program multicellular patterning. Science 370, 327–331 (2020). [DOI] [PMC free article] [PubMed] [Google Scholar]
- 35.Li P, et al. Morphogen gradient reconstitution reveals Hedgehog pathway design principles. Science 360, 543–548 (2018). [DOI] [PMC free article] [PubMed] [Google Scholar]
- 36.Stapornwongkul KS, de Gennes M, Cocconi L, Salbreux G & Vincent JP Patterning and growth control in vivo by an engineered GFP gradient. Science 370, 321–327 (2020). [DOI] [PMC free article] [PubMed] [Google Scholar]
- 37.Veenvliet JV, et al. Mouse embryonic stem cells self-organize into trunk-like structures with neural tube and somites. Science 370(2020). [DOI] [PubMed] [Google Scholar]
- 38.van den Brink SC, et al. Single-cell and spatial transcriptomics reveal somitogenesis in gastruloids. Nature 582, 405–409 (2020). [DOI] [PubMed] [Google Scholar]
Methods References:
- 39.Liu P, Jenkins NA & Copeland NG A highly efficient recombineering-based method for generating conditional knockout mutations. Genome Res 13, 476–484 (2003). [DOI] [PMC free article] [PubMed] [Google Scholar]
- 40.Hanisch A, et al. The elongation rate of RNA Polymerase II in the zebrafish and its significance in the somite segmentation clock. Development 140, 444–453 (2013). [DOI] [PubMed] [Google Scholar]
- 41.Ozbudak EM & Lewis J Notch signalling synchronizes the zebrafish segmentation clock but is not needed to create somite boundaries. PLoS genetics 4, e15 (2008). [DOI] [PMC free article] [PubMed] [Google Scholar]
- 42.Choorapoikayil S, Willems B, Strohle P & Gajewski M Analysis of her1 and her7 mutants reveals a spatio temporal separation of the somite clock module. PLoS ONE 7, e39073 (2012). [DOI] [PMC free article] [PubMed] [Google Scholar]
- 43.Schroter C, et al. Topology and dynamics of the zebrafish segmentation clock core circuit. PLoS Biol 10, e1001364 (2012). [DOI] [PMC free article] [PubMed] [Google Scholar]
- 44.Delaune EA, Francois P, Shih NP & Amacher SL Single-cell-resolution imaging of the impact of notch signaling and mitosis on segmentation clock dynamics. Dev Cell 23, 995–1005 (2012). [DOI] [PMC free article] [PubMed] [Google Scholar]
- 45.Kwan KM, et al. The Tol2kit: a multisite gateway-based construction kit for Tol2 transposon transgenesis constructs. Dev Dyn 236, 3088–3099 (2007). [DOI] [PubMed] [Google Scholar]
- 46.Soroldoni D, et al. Genetic oscillations. A Doppler effect in embryonic pattern formation. Science 345, 222–225 (2014). [DOI] [PMC free article] [PubMed] [Google Scholar]
- 47.de la Cova C, Townley R, Regot S & Greenwald I A Real-Time Biosensor for ERK Activity Reveals Signaling Dynamics during C. elegans Cell Fate Specification. Dev Cell 42, 542–553 e544 (2017). [DOI] [PMC free article] [PubMed] [Google Scholar]
- 48.Subach OM, et al. Conversion of red fluorescent protein into a bright blue probe. Chem Biol 15, 1116–1124 (2008). [DOI] [PMC free article] [PubMed] [Google Scholar]
- 49.Thisse C & Thisse B High-resolution in situ hybridization to whole-mount zebrafish embryos. Nature protocols 3, 59–69 (2008). [DOI] [PubMed] [Google Scholar]
- 50.Devoto SH, Melancon E, Eisen JS & Westerfield M Identification of separate slow and fast muscle precursor cells in vivo, prior to somite formation. Development. 122, 3371–3380 (1996). [DOI] [PubMed] [Google Scholar]
- 51.Henry CA, et al. Roles for zebrafish focal adhesion kinase in notochord and somite morphogenesis. Dev Biol 240, 474–487 (2001). [DOI] [PubMed] [Google Scholar]
- 52.Simsek MF & Ozbudak EM A 3-D Tail Explant Culture to Study Vertebrate Segmentation in Zebrafish. J Vis Exp (2021). [DOI] [PMC free article] [PubMed] [Google Scholar]
Associated Data
This section collects any data citations, data availability statements, or supplementary materials included in this article.
Supplementary Materials
Data Availability Statement
Original microscopy image files are provided at the BioStudies with accession number: S-BSST895 (https://www.ebi.ac.uk/biostudies/studies/S-BSST895). Source data are provided with this paper.
MATLAB codes and FIJI macros are provided at https://github.com/mfsimsek/erkactivitysegmentation (DOI: https://doi.org/10.5281/zenodo.7098199).


