Abstract
Isolation and analysis of circulating tumor cells (CTCs) from the blood of patients at risk of metastatic cancers is a promising approach to improving cancer treatment. However, CTC isolation is difficult due to low CTC abundance and heterogeneity. Previously, we reported an ensemble-decision aliquot ranking (eDAR) platform for the rare cell and CTC isolation with high throughput, greater than 90% recovery, and high sensitivity, allowing detection of low surface antigen-expressing cells linked to metastasis. Here we demonstrate a sequential eDAR platform capable of isolating rare cells from whole blood with high purity. This improvement in purity is achieved by using a sequential sorting and flow stretching design in which whole blood is sorted and fluid elements are stretched using herringbone features and the parabolic flow profile being sorted a second time. This platform can be used to collect single CTCs in a multiwell plate for downstream analysis.
Graphical Abstract
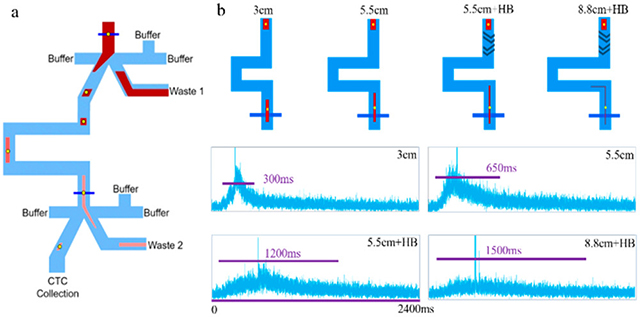
Most cancer deaths are due to tumor metastasis. Circulating tumor cells (CTCs) are precursors to metastasis, shed from the primary tumor and present in the blood in extremely low numbers. Because of the role CTCs play in metastasis, isolating these cells from blood is an important area of research. CTCs can be isolated from blood cells based on physical and molecular differences; however, owing to their low abundance (tens to hundreds per mL of whole blood) (1–3) and heterogeneity, (4) detection and isolation is difficult.
A variety of approaches to isolate CTCs have been used, falling into two main categories: physical isolation and biomarker/antibody-based methods. Physical isolation methods are based on differences in the cell size or other physical characteristics. For example, CTCs are typically larger than blood cells and can be isolated by filtration (5–9) or flow fractionation. (10) Filtration is fast and simple, but there is overlap in CTC and white blood cell (WBC) sizes, (11) causing low purity; in addition, the deformability of CTCs makes them difficult to be removed from the filter. Differential flow patterns of cells in microfluidic channels have been used to isolate CTCs from blood cells, (12) but this approach also often results in low purity and can be complicated to implement. Dielectrophoretic detection methods (13) based on structural differences between CTCs and WBCs (including size) require further development to achieve high purity.
Antibody-based methods have the potential to isolate CTCs with high purity due to the specificity of antibodies. As examples, the following three antibody-based approaches have been used: (1) Immunomagnetic isolation: a blood sample is labeled with anti-CTC/epithelial-cell antibodies immobilized to magnetic beads and a magnetic field is applied to separate antibody-bound CTCs/epithelial cells. (14–16) CellSearch, the main FDA-approved CTC detection platform, employs immunomagnetic isolation, (17) but it is unclear whether this method has sufficient sensitivity to detect CTCs expressing low levels of surface antigen. (2) Surface capture: CTCs are captured by antibodies immobilized on the surface of a microfluidic chip. (18–21) The sensitivity of this approach was low initially due to insufficient contact of CTCs with chip features in laminar flow, but advances using engineered microfluidic flow patterns, such as with herringbone (HB) structures to increase mixing, have greatly improved outcome. (22,23) (3) Fluorescence-based methods: blood is labeled with fluorescent anti-CTC antibodies and CTCs are detected using laser-induced fluorescence. Fluorescence methods are promising due to their high sensitivity (24) and will continue to improve with advances in fluorescent probe brightness.
We have previously developed an ensemble decision aliquot ranking (eDAR) platform for isolating rare cells and CTCs from whole blood. The rare-cell isolation platform consists of an optical detection system, a microfluidic active sorting scheme, and an on-chip filter for cell enumeration. The optical detection system uses laser-induced fluorescence detection across the width of a microfluidic channel. (25) Labeled cells in whole blood samples can be detected in multiple colors and enumerated from detection traces. (26) The sorting scheme consists of a junction where, upon detection, CTCs are diverted to a channel leading to on-chip filters. Trapped cells can be fixed, permeabilized, and labeled with antibodies prior to enumeration. Recent improvements in this platform include a dual-capture scheme in which two subsets of rare cells can be sent to two separate filters on the microchip; (27) a sequential bleaching and relabeling scheme for highly multiplexed analysis of biomarkers on CTCs; (28) a method to calibrate and determine the limit of detection and quantitation of eDAR in terms of the number of required surface antigens; and improved detection of cells expressing low levels of the CTC marker, EpCAM. (24)
High-sensitivity recovery and purity are essential for successful CTC isolation and analysis. Collecting functionally viable cells for downstream analysis is also important for assessing CTC heterogeneity. High-sensitivity detection is important because cells expressing low levels of surface antigen have been linked to metastasis. (29) Our eDAR platform has previously demonstrated high recovery rates of viable CTCs, including those expressing low levels of cell-surface biomarkers, such as EpCAM. To keep CTCs amenable to biological characterization, like genomic or transcriptomic analyses after isolation, high purity is needed, since neighboring hematologic cells may complicate readout and analysis.
Here we describe the ability to isolate CTCs with high purity using a sequential two-stage eDAR sorting in which a blood aliquot is first sorted, then stretched, and then sorted a second time to isolate the single CTC of interest. The flow-stretching element, together with the second sorting step can improve the purity by 70-fold. Because these additional steps occur on the same chip, minimal additional time is needed; 1 mL of blood can be run through a chip in 20 min, and single CTCs can be collected in wells of a multiwell plate for imaging and analysis.
Experimental Section
Cell Culture
MCF-7 human breast cancer cells were obtained from American Type Culture Collection (ATCC, Manassas, VA). Cells were cultured at 37 °C and 5% CO2 in EMEM media (ATCC) supplemented with 5% fetal bovine serum and 1% penicillin/streptomycin (Sigma, St. Louis, MO).
Reagents and Materials
Healthy whole blood samples were obtained from PlasmaLab International (Everett, WA). DAPI solution (1 mg/mL) was purchased from Thermo Fisher Scientific (Waltham, MA). Antibodies were purchased from BioLegend, Inc. (San Diego, CA) and included phycoerythrin (PE)-antihuman EpCAM, Alexa Fluor 647 antihuman cytokeratin (pan reactive), Alexa Fluor 488 antihuman CD45, PE antihuman CD45, and PE goat antimouse IgG. Isoton II buffer (Beckman Coulter, Brea, CA) was used as a sheath flow for eDAR chips. A solution of 1% bovine serum albumin (BSA; Sigma)/0.05% Tween 20 (Sigma) in Isoton II buffer was used to pretreat multiwell plates (Cellvis, Mountain View, CA) and PTFE tubing (SAI Infusion Technologies, Lake Villa, IL). Isoton II buffer with 0.1% BSA was used for labeling cells. A solution of 25% glycerol (EMD, Billerica, MA) in Isoton II buffer was used to simulate the fluidic characteristics of blood for testing sorting and aliquot stretching and was mixed 30:70 with green food dye (COV Extract Company, Rockford, OH) for bright-field imaging. Yellow fluorescent beads were purchased from Duke Scientific (Palo Alto, CA).
Microfluidic Chips
Silicon masters were created using standard photolithographic techniques described previously. (2) SU-8 2050 photoresist (MicroChem, Westborough, MA) was used for spin coating. Chips were made using PDMS with a 1:10 ratio of precursor to polymer base. PDMS was cured and sealed to a glass substrate immediately following exposure to O2 plasma for 30 s. If not used immediately, chips were covered and stored for up to one month until use.
Cell Recovery Measurements
MCF-7 cells (1 × 10⁶/mL) were labeled with PE-anti-EpCAM (0.5 μg/mL) for 1 h. After washing, cells were counted using a hemocytometer and serial diluted, and ~50 cells were spiked into 0.5 mL of blood. The sample was loaded onto a sequential sorting chip at 30 μL/min and sorting was established by adjusting the sheath flow pressure. Fresh tubing treated with 1% BSA/0.05% Tween 20 was attached to the collection outlet and run into a pretreated well of the 96-well plate. The tubing was moved into a new well once the volume of collected solution in the previous well reached ~250 μL. The total output for sorting 0.5 mL of blood was ~1 mL. To enumerate collected cells, the plate was spun down at 450 rcf for 10 min and PE anti-EpCAM positive cells were counted using an inverted fluorescent microscope with a 20× 0.75 NA objective (Nikon, Tokyo, Japan). MCF-7 cells stained with PE-anti-EpCAM can be clearly identified since all other blood cells were not fluorescent. The cell recovery rate was calculated as the number of MCF-7 cells counted divided by the number of MCF-7 cells spiked into the sample.
Cell Identification and Purity Measurements
MCF-7 cells were labeled with PE-anti-EpCAM, spiked into a blood sample, and run on a chip as described above for cell recovery measurements. Sorted PE-labeled MCF-7 cells and unlabeled WBCs and red blood cells (RBCs) were collected in a pretreated Eppendorf tube instead of a 96-well plate. The tube was centrifuged at 450 rcf for 10 min and the supernatant aspirated. RBCs were removed by adding RBC lysis buffer and incubating for 15 min, leaving MCF-7 cells and WBCs intact, and the tube was centrifuged again to pellet cells. The cells were fixed using 2% paraformaldehyde for 15 min. After centrifuging and washing twice, cells were permeabilized using 0.2% saponin and stained with Alexa Fluor 488 anti-CD45 (10 μg/mL; for identification of WBCs) and Alexa Fluor 647 anti-panCK (5 μg/mL; for identification of MCF-7 cells). DAPI (1 μg/mL) was added to stain cell nuclei. The cells were washed and resuspended in Isoton II buffer and transferred to a glass-bottom multiwell plate for imaging. A fluorescence microscope with a 20× objective was used for confirmation of cell identities and imaging. For the chip with the 3 cm straight channel, the purity was calculated after confirming cells’ identities. The labeled cells in a 384-well plate well were imaged with a 4× objective for both DAPI and PE channels, and six images were captured and stitched together to represent the whole well. Cell purity was calculated as the number of PE-labeled MCF-7 cells divided by the total number of DAPI-stained cells.
In addition to the use of imaging to determine cell purity, as described above, we also used our eDAR chip as a flow cytometer to quantify cell purity. Here, the recovered cells were flown through the eDAR chip and the number of MCF-7 cells and WBCs were counted. Specifically, MCF-7 cells were first labeled using PE tagged anti-EpCAM, spiked into a blood sample, and the sample was run on a chip as described above. The number of sorted MCF-7 cells was counted based on fluorescent signals triggering sorting events at the second detection line. The outlet solution was connected to a pretreated 15-ml tube, centrifuged, supernatant aspirated, leaving ~300 μL, and pelleted cells were resuspended. PE tagged anti-CD45 was added to label WBCs for 1 h, so that both MCF-7 cells and WBCs were labeled with PE. After washing, the sample was run through a new eDAR chip punched only at the inlet and at one outlet, with solenoids turned off so that no sorting occurred. APD traces were collected to count the number of cells at the second detection line; the number of peaks indicated the total number of labeled cells in the outlet solution. MCF-7 cell purity was calculated as the number of MCF-7 cells counted in the first step, divided by the total number of counted cells in the second step.
Visualizing Aliquot Stretching Profiles
To simulate the fluid characteristics of blood, a mixture of 25% glycerol solution and Isoton II buffer was used. To test the ability of different chip designs to stretch an aliquot, filtered PE goat-antimouse IgG was added to the mixture to visualize aliquots sorted at the first sorting junction in APD traces. Yellow fluorescent beads (~1500 10 μm beads) were added to the sample to trigger sorting using solenoids, and the sample was loaded onto the chip. Buffer pressures were adjusted until stable sorting at the two junctions was established. APD traces were collected, and the time required for a sorted aliquot coming from the first sorting junction to travel completely through the second detection line was measured.
Results and Discussion
Improving Purity by Two-Stage Sequential Sorting
We designed a sequential eDAR chip with a second sorting junction to improve CTC purity with respect to WBCs (Figure 1). The flow at each of the two sorting junctions (Figure S1) was similar to that previously reported for the single-stage eDAR sorting. (24,25) Laser illumination lines were positioned just before each sorting junction (Figure 1a, dark blue lines). After the first junction, the aliquot is stretched as it passes down a channel between two sorting junctions, and the second sorting step is triggered when labeled cells reach the second laser detection line.
Figure 1.
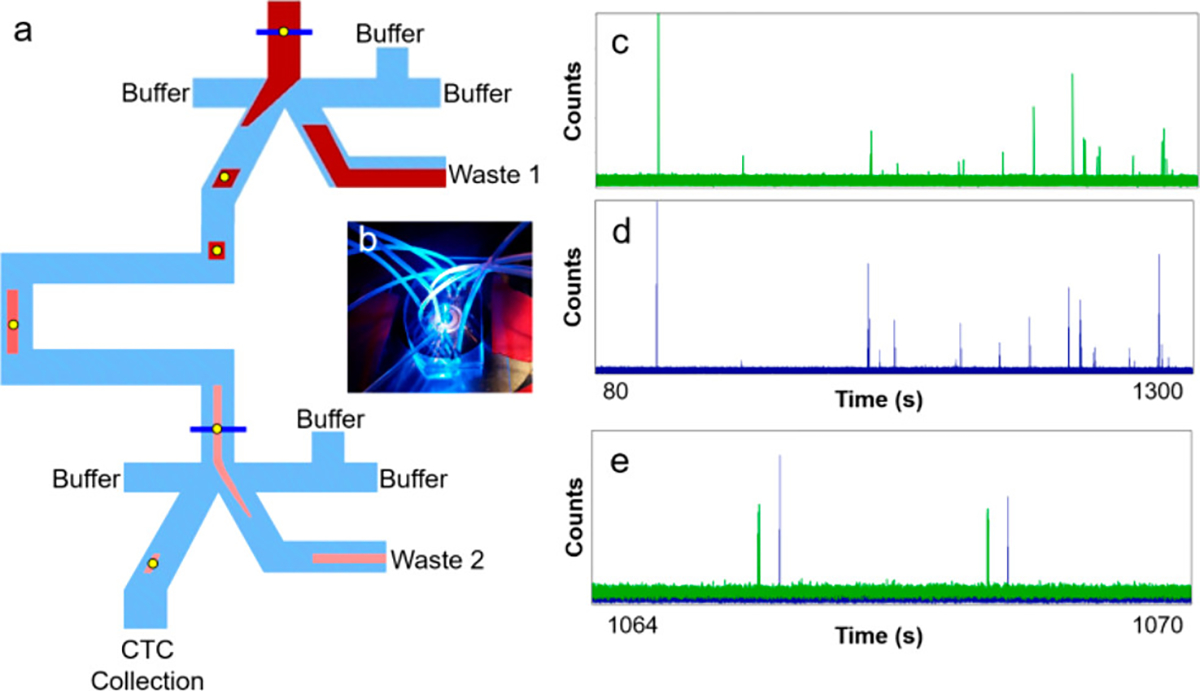
(a) Schematic of sequential eDAR chip. Blood is loaded at the inlet (top) and CTCs are detected at two detection lines (blue) using laser-induced fluorescence. CTC-detection signals trigger sorting at two junctions by activating a solenoid and increasing the pressure of flow from the right side of the junction, causing the aliquot to flow to the left. After the first junction, the aliquot passes down a channel to the second detection line, after which it is sorted for a second time. The aliquot is stretched in the channel between two junctions, resulting in fewer contaminating blood cells. Most blood cells are sent to waste (Wastes 1 and 2). (b) Image of a sequential eDAR chip while running a sample, mounted on a microscope and using 488 nm laser excitation. (c, d) APD traces from the first (c) and second (d) sorting junctions in a single run. (e) Overlay of enlarged section from 1064 to 1070 s from (c) and (d), showing sorting events at the first junction (green) followed by sorting events at the second junction (blue).
APD traces from the two laser detection lines are shown in Figure 1c,d, and an overlay of an enlarged section of the two traces is displayed in Figure 1e, showing sequential cell sorting events at the two junctions. During the delay between the signals from the two detection lines, the aliquot containing labeled cells is stretched and diluted. This step reduces the concentration of blood cells and improves the purity of target cells in the final sorted aliquot.
The cell recovery rate of the platform was measured previously using various cancer cell lines and clinical samples. (24,27,30) In the modified platform, there are two new elements where cell loss might occur: the second sorting junction and the 96-well plate collection step. Recovery measurements using PE antihuman EpCAM-labeled MCF-7 cells spiked into whole blood were performed to verify that these elements do not cause cell loss. For two-stage (two-junction) sequential sorting, the recovery rate was >90%, as high as one-stage sorting. (25) No observable cell loss was caused by adding a second sorting junction or by using multiwell plates. In some cases, MCF-7 cell clusters were observed (Figure S3), illustrating the capability of the system to enrich cell clusters, potentially useful for studying CTC clusters. (31)
To confirm the identities of sorted cells and to quantify target cell purity when using a chip with a 3 cm channel (with no herringbone mixing features) and two sorting junctions, cells were collected in Eppendorf tubes, RBCs were lysed using RBC lysis buffer, and non-RBCs were fixed, permeabilized, and stained with markers, including DAPI, Alexa Fluor 488 antihuman CD45, and Alexa Fluor 647 antihuman Cytokeratin (panCK). MCF-7 cells were DAPI+, CD45−, EpCAM+, and panCK+; WBCs were DAPI+, CD45+, EpCAM−, and panCK− (Figure 2b,c). Purity was calculated by counting the number of PE-labeled MCF-7 cells and dividing by the total number of DAPI-labeled cells. To image an entire well of the 384-well plate, six images captured with a 4× objective under both DAPI and PE channels were stitched together (Figure S2). With this chip and the particular operating protocol, the CTC purity achieved using a 3 cm channel, two-stage chip was ~15%.
Figure 2.
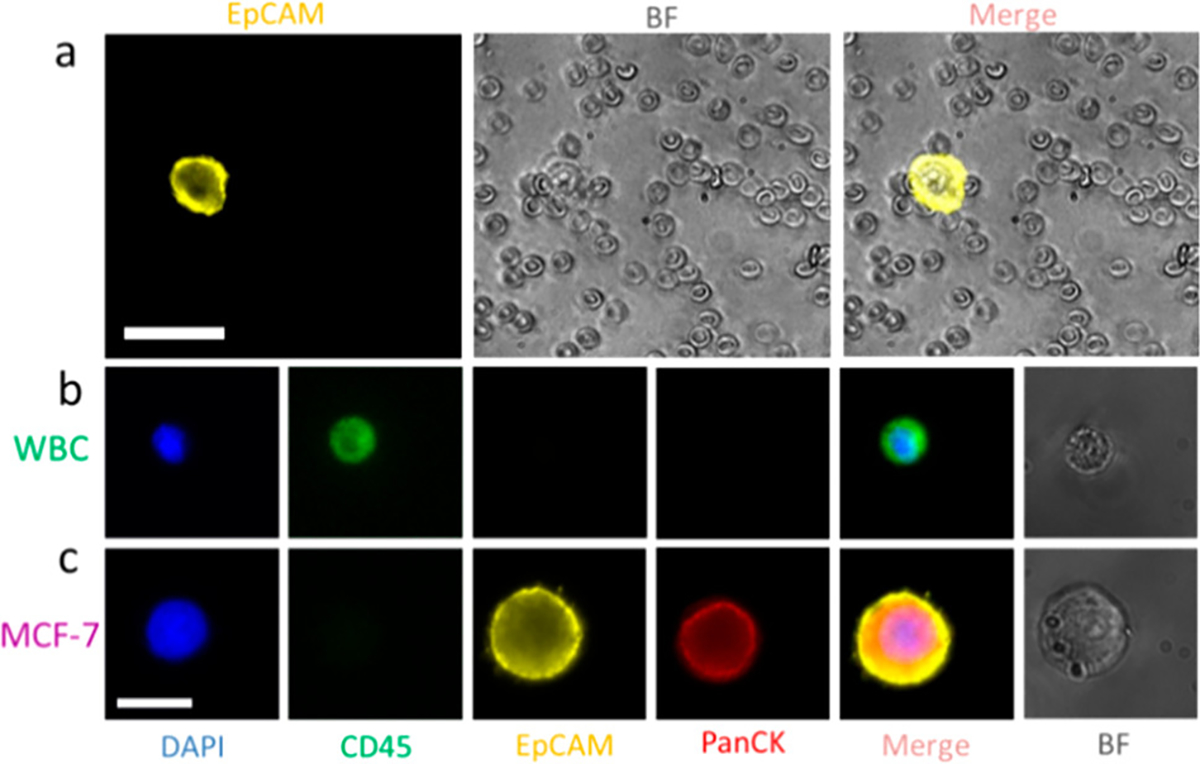
(a) Images of collected MCF-7 cells and blood cells after sorting using sequential eDAR. Cells were imaged using a 20× 0.75 NA objective. Scale bar is 40 μm. (b, c) Confirmation of a MCF-7 cell and a WBC identity. MCF-7 cells are DAPI+, CD45−, EpCAM+, and panCK+; WBCs are DAPI+, CD45+, EpCAM−, and panCK−. Scale bar is 20 μm.
Using the alternate method to measure cell purity, based on the number of cell sorting events detected (see Experimental Section), the MCF-7 cell purity using a 3 cm channel, two-stage sorting chip was 17%, similar to the 15% purity calculated by counting cells using fluorescence microscopy. In Figure S4, panels on the left show the complete trace records for MCF-7 cells (labeled with PE-tagged anti-EpCAM). Panels on the right show the complete trace records for MCF-7 cells plus WBCs (labeled with PE-tagged anti-EpCAM and anti-CD45). Using the same method, the previous chip with only one sorting junction achieved only ~1% cell purity for this particular chip and operating condition (e.g., we did not use the fastest possible sorting speed in the first junction). Thus, a large (17-fold) improvement in MCF-7 cell purity was achieved for two-stage versus one-stage eDAR sorting.
Lengthening the Channel between Two Sorting Junctions Further Improves Cell Purity
Dispersion of the cell aliquot by diffusion in microchannel is extremely low. The main mechanism that stretches out the cells in flow is axial dispersion caused by the parabolic flow profile. As a result, a longer channel should enhance separation of the cells within the aliquot, thereby improving the target cell purity. To test this hypothesis, two chips with longer channels (5.5 and 8.8 cm) between the two sorting junctions were designed, and MCF-7 cell purity was measured as described above. The 5.5 and 8.8 cm channels yielded purities of 21% and 32%, respectively (Tables 1 and S1).
Table 1.
MCF-7 Cell Purity Achieved Using a One-Stage Chip versus Two-Stage Chips with Various Channel Lengths and Herringbone (HB) Features
| design | purity (CTCs/total nucleated cells) |
|---|---|
| one-stage eDAR | 1% |
| 3 cm channel | 17% |
| 5.5 cm channel | 21% |
| 8.8 cm channel | 32% |
| 5.5 cm channel + HB | 30% |
| 8.8 cm channel + HB | 70% |
Mixing Features Further Improves Cell Purity
Lengthening the sorting channel between junctions from 3 to 8.8 cm yielded a modest improvement in purity, from 17% to 32%. To achieve further improvement, we tested two additional approaches to stretch an aliquot: (1) “flow sharers”, in which the main channel is connected to a series of smaller channels such that part of the aliquot would travel down the first small channel and part would continue down the main channel, to separate the aliquot into many smaller fluid elements, and (2) herringbone features (23) (Figure 3a,b).
Figure 3.
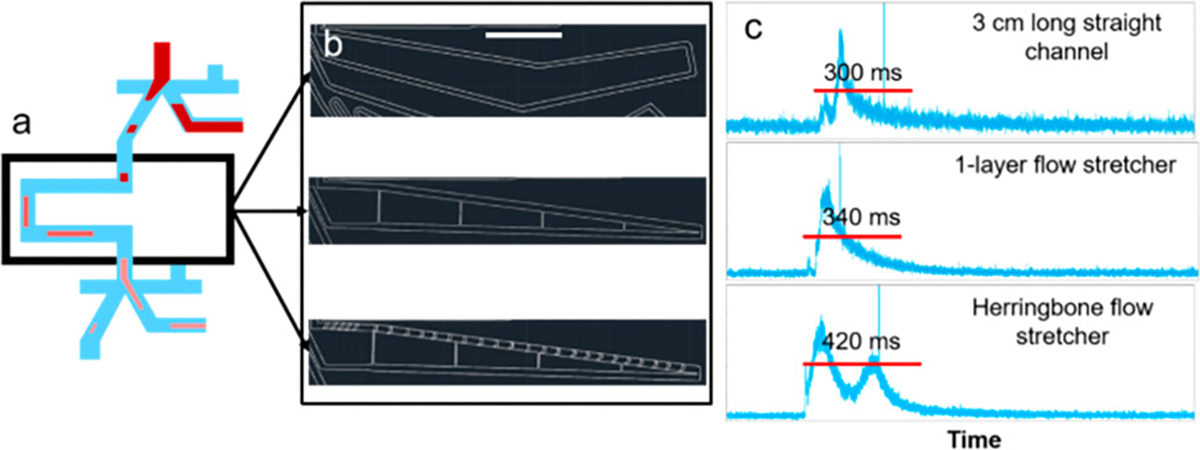
Aliquot stretching using different channel designs. (a) Three chip designs are the same except for the channel separating two sorting junctions. (b) Three designs of the channel separating two sorting junctions by AutoCAD. From top to bottom: basic straight channel, adding “flow sharers”, adding “flow sharers” and herringbone structures. Except for the small narrow channels in the “flow sharer” designs, the width of the straight channels was around 200 μm and the height was kept the same for each design (i.e., 50 μm). The scale bar is 3 mm. (c) APD traces of aliquots containing PE dye and yellow fluorescent beads triggering sorting events at the first sorting junction, were recorded at the second detection line. The duration of the PE signal of one aliquot at the second detection line was used as an indicator of the degree of aliquot stretching.
Aliquot stretching profiles of three channel designs were assessed by measuring the duration of the PE signal at the second detection line (Figure 3c). Greater aliquot stretching was expected to result in fewer contaminating blood cells accompanying MCF-7 cells during sorting events. The first flow stretching design, using small side channels, resulted in an increase in stretching, but when tested with whole blood, clogging occurred, indicating potential cell loss. Clogging was prone to occur due to the presence of the narrow channels that were meant to spread out the plug of cells because an occasional cluster of cells could block the narrow channels and then the device would function less efficiently. The second flow stretching design, using herringbone features, resulted in greater stretching and no clogging. Thus, in subsequent experiments we tested different lengths of straight channels with herringbones structures in cell purity measurements.
Herringbones were first described by Whitesides and co-workers in 2002 (23) and are attractive as a mixing strategy because they are simple to fabricate, tunable to a wide variety of applications, (32) and do not trap cells. Here, lateral mixing enhanced axial dispersion of the cells because it caused the cells to sample actively different portions of the parabolic flow profile. We used herringbone features located at the beginning (first 0.7 cm) of the 5.5 and 8.8 cm channels connecting the junctions to mix, which spread the aliquot laterally before it reached the second junction.
The herringbone design consisted of three sections (Figure 4a): (1) three straight ridges angled from the inner wall to the outer wall, since we had observed the aliquot traveling primarily down the inner wall; (2) 12 staggered HB angled slightly toward the inner wall, and (3) 12 staggered HB angled slightly toward the outer wall. The herringbone dimensions are described in Figure 4b. The mixing section was 0.7 cm long, followed by a 4.8 or 8.1 cm straight channel. Without herringbones, the aliquot traveled as a plug along the inner wall; with herringbones, the aliquot was spread laterally across the channel. The long section of the straight channel without herringbones would be expected to allow further longitudinal separation of cells by axial dispersion due to the parabolic flow profile, as cells near the center of the channel travel faster than those near the outer edges.
Figure 4.
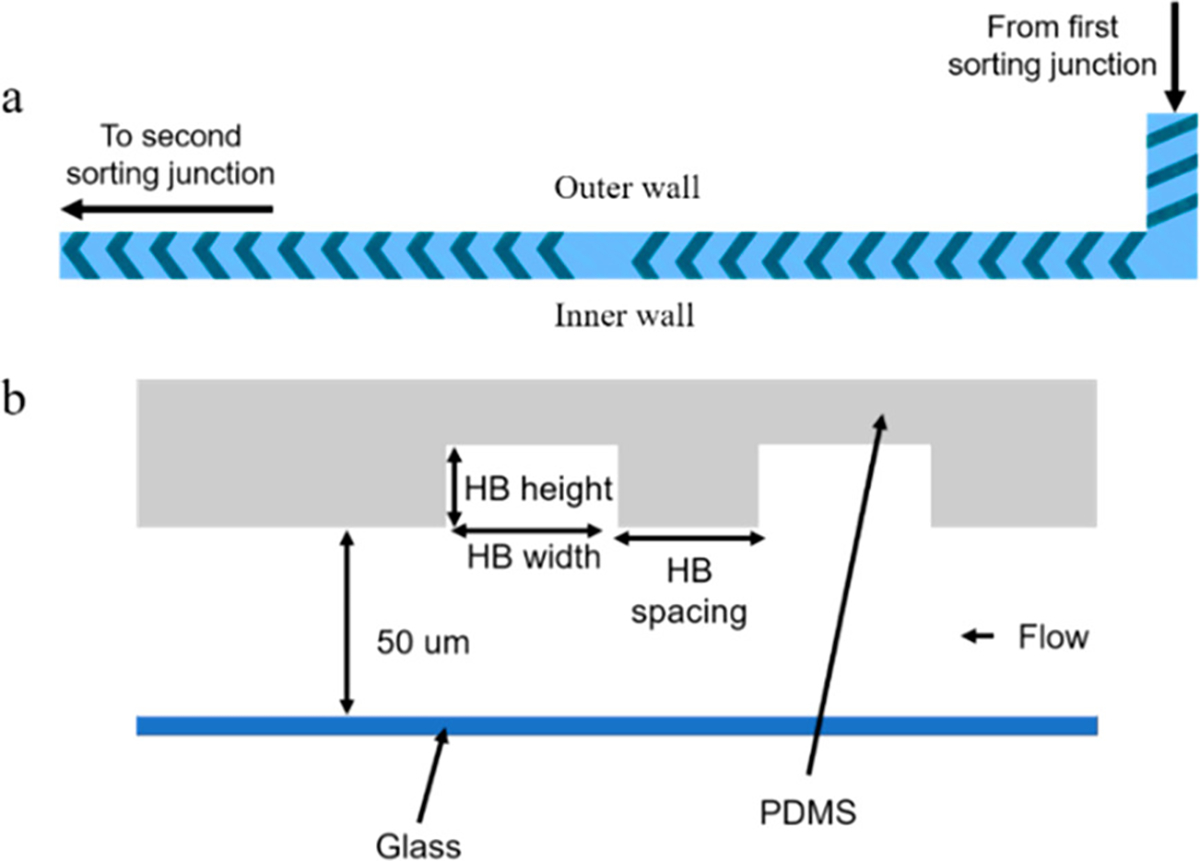
(a) Schematic of herringbone structures. (b) Cross-section of the channel with herringbones. For staggered herringbones, the height was 30 μm and the width was 70 μm. For straight ridges at the beginning of this channel, the height was 30 μm and the width was 80 μm; spacing was 180 μm for staggered herringbones and 95 μm for straight ridges.
The 5.5 cm herringbone chip yielded 30% cell purity, similar to the 8.8 cm channel chip without herringbones. Furthermore, the 8.8 cm chip with herringbones yielded 70% purity, which corresponds to an average of <1 WBC per CTC sorted (Figure S4). Cell purity results for different chip designs are summarized in both Tables 1 and S1.
The aliquot stretching profiles of four designs with various length of channels and mixing features (3 cm, 5.5 cm, 5.5 cm + HB, and 8.8 cm + HB) are shown in Figure 5. Longer channels and addition of herringbone features resulted in longer durations of PE signals, indicating greater aliquot stretching.
Figure 5.
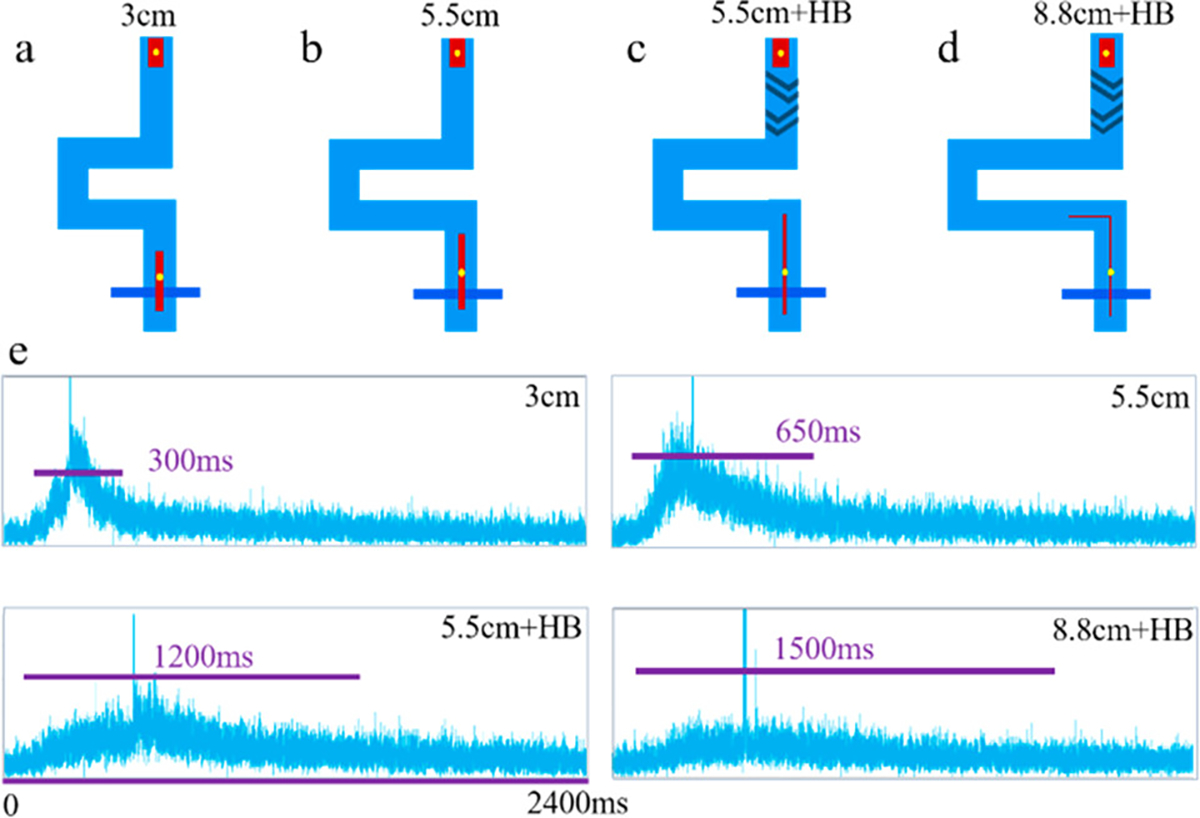
Aliquot stretching using different chip designs: (a) 3 cm channel, (b) 5.5 cm channel, (c) 5.5 cm channel with HB, (d) 8.8 cm channel with HB. (e) APD traces for the aliquots containing PE dye and fluorescent beads at the second detection line. The spikes in four images indicated that fluorescent beads triggered sorting at the first sorting junction and passed through the second detection line, along with the aliquot.
Conclusions
In this study, we described a platform for isolating CTCs with high purity with respect to WBCs by using sequential sorting and fluidic features for aliquot stretching. We achieved a roughly 70-fold improvement in target cell purity compared to our previous eDAR platform, by using two sorting junctions, a longer channel between junctions, and herringbone features to enhance lateral mixing and spreading of the cells. We also moved cell collection off-chip while maintaining a high cell recovery rate. Single CTCs now can be collected in wells of a multiwell plate with less than one contaminating WBC, on average, making eDAR amenable to downstream analyses such as PCR or DNA sequencing. Future development of this platform will couple it with automated dispensing to allow single CTC detection, enumeration, and analysis with high sensitivity, cell recovery, and purity, and for isolating and characterizing low surface antigen-expressing metastatic cells that may be missed by other methods. Further optimization of the fluidic stretcher should result in additional purity improvements.
Supplementary Material
Acknowledgments
We gratefully acknowledge support of this work by the NIH (R01HD089679), MiCareo Inc., and the University of Washington.
Footnotes
The authors declare the following competing financial interest(s): DTC has financial interest in MiCareo, which has licensed the described technology from the University of Washington.
References
- 1.Paterlini-Brechot P; Benali NL Circulating tumor cells (CTC) detection: clinical impact and future directions. Cancer Lett. 2007, 253, 180– 204, DOI: 10.1016/j.canlet.2006.12.014 [DOI] [PubMed] [Google Scholar]
- 2.Dharmasiri U; Witek MA; Adams AA; Soper SA Microsystems for the capture of low-abundance cells. Annu. Rev. Anal. Chem 2010, 3, 409– 431, DOI: 10.1146/annurev.anchem.111808.073610 [DOI] [PubMed] [Google Scholar]
- 3.Alunni-Fabbroni M; Sandri MT Circulating tumour cells in clinical practice: Methods of detection and possible characterization. Methods 2010, 50, 289– 297, DOI: 10.1016/j.ymeth.2010.01.027 [DOI] [PubMed] [Google Scholar]
- 4.Powell AA; Talasaz AH; Zhang H; Coram MA; Reddy A; Deng G; Telli ML; Advani RH; Carlson RW; Mollick JA Single cell profiling of circulating tumor cells: transcriptional heterogeneity and diversity from breast cancer cell lines. PLoS One 2012, 7, e33788, DOI: 10.1371/journal.pone.0033788 [DOI] [PMC free article] [PubMed] [Google Scholar]
- 5.Zheng S; Lin H; Liu J-Q; Balic M; Datar R; Cote RJ; Tai Y-C Membrane microfilter device for selective capture, electrolysis and genomic analysis of human circulating tumor cells. J. Chromatogr. A 2007, 1162, 154– 161, DOI: 10.1016/j.chroma.2007.05.064 [DOI] [PubMed] [Google Scholar]
- 6.Kahn HJ; Presta A; Yang L-Y; Blondal J; Trudeau M; Lickley L; Holloway C; McCready DR; Maclean D; Marks A Enumeration of circulating tumor cells in the blood of breast cancer patients after filtration enrichment: correlation with disease stage. Breast Cancer Res. Treat. 2004, 86, 237– 247, DOI: 10.1023/B:BREA.0000036897.92513.72 [DOI] [PubMed] [Google Scholar]
- 7.Kuo JS; Zhao Y; Schiro PG; Ng L; Lim DS; Shelby JP; Chiu DT Deformability considerations in filtration of biological cells. Lab Chip 2010, 10, 837– 842, DOI: 10.1039/b922301k [DOI] [PubMed] [Google Scholar]
- 8.Pinzani P; Salvadori B; Simi L; Bianchi S; Distante V; Cataliotti L; Pazzagli M; Orlando C Isolation by size of epithelial tumor cells in peripheral blood of patients with breast cancer: correlation with real-time reverse transcriptase–polymerase chain reaction results and feasibility of molecular analysis by laser microdissection. Hum. Pathol. 2006, 37, 711– 718, DOI: 10.1016/j.humpath.2006.01.026 [DOI] [PubMed] [Google Scholar]
- 9.Lin HK; Zheng S; Williams AJ; Balic M; Groshen S; Scher HI; Fleisher M; Stadler W; Datar RH; Tai Y-C; Cote RJ Portable filter-based microdevice for detection and characterization of circulating tumor cells. Clin. Cancer Res. 2010, 16 (20), 5011– 5018, DOI: 10.1158/1078-0432.CCR-10-1105 [DOI] [PMC free article] [PubMed] [Google Scholar]
- 10.Hou HW; Warkiani ME; Khoo BL; Li ZR; Soo RA; Tan DS-W; Lim W-T; Han J; Bhagat AAS; Lim CT Isolation and retrieval of circulating tumor cells using centrifugal forces. Sci. Rep. 2013, 3, 1259, DOI: 10.1038/srep01259 [DOI] [PMC free article] [PubMed] [Google Scholar]
- 11.Coumans FA; van Dalum G; Beck M; Terstappen LW Filter characteristics influencing circulating tumor cell enrichment from whole blood. PLoS One 2013, 8, e61770 DOI: 10.1371/journal.pone.0061770 [DOI] [PMC free article] [PubMed] [Google Scholar]
- 12.Warkiani ME; Khoo BL; Wu L; Tay AKP; Bhagat AAS; Han J; Lim CT Ultra-fast, label-free isolation of circulating tumor cells from blood using spiral microfluidics. Nat. Protoc. 2016, 11, 134, DOI: 10.1038/nprot.2016.003 [DOI] [PubMed] [Google Scholar]
- 13.Li M; Anand RK High-throughput selective capture of single circulating tumor cells by dielectrophoresis at a wireless electrode array. J. Am. Chem. Soc. 2017, 139, 8950– 8959, DOI: 10.1021/jacs.7b03288 [DOI] [PubMed] [Google Scholar]
- 14.Allard WJ; Matera J; Miller MC; Repollet M; Connelly MC; Rao C; Tibbe AG; Uhr JW; Terstappen LW Tumor cells circulate in the peripheral blood of all major carcinomas but not in healthy subjects or patients with nonmalignant diseases. Clin. Cancer Res. 2004, 10, 6897– 6904, DOI: 10.1158/1078-0432.CCR-04-0378 [DOI] [PubMed] [Google Scholar]
- 15.Riethdorf S; Müller V; Zhang L; Rau T; Loibl S; Komor M; Roller M; Huober J; Fehm T; Schrader I Detection and HER2 expression of circulating tumor cells: prospective monitoring in breast cancer patients treated in the neoadjuvant GeparQuattro trial. Clin. Cancer Res. 2010, 16 (9), 2634– 2645, DOI: 10.1158/1078-0432.CCR-09-2042 [DOI] [PubMed] [Google Scholar]
- 16.Xu H; Dong B; Xu S; Xu S; Sun X; Sun J; Yang Y; Xu L; Bai X; Zhang S High purity microfluidic sorting and in situ inactivation of circulating tumor cells based on multifunctional magnetic composites. Biomaterials 2017, 138, 69– 79, DOI: 10.1016/j.biomaterials.2017.05.035 [DOI] [PubMed] [Google Scholar]
- 17.Balic M; Dandachi N; Hofmann G; Samonigg H; Loibner H; Obwaller A; van der Kooi A; Tibbe AGJ; Doyle GV; Terstappen LWMM; Bauernhofer T Cytometry, Part B 2005, 68, 25– 30, DOI: 10.1002/cyto.b.20065 [DOI] [PubMed] [Google Scholar]
- 18.Nagrath S; Sequist LV; Maheswaran S; Bell DW; Irimia D; Ulkus L; Smith MR; Kwak EL; Digumarthy S; Muzikansky A Isolation of rare circulating tumour cells in cancer patients by microchip technology. Nature 2007, 450, 1235– 1239, DOI: 10.1038/nature06385 [DOI] [PMC free article] [PubMed] [Google Scholar]
- 19.Dharmasiri U; Njoroge SK; Witek MA; Adebiyi MG; Kamande JW; Hupert ML; Barany F; Soper SA High-throughput selection, enumeration, electrokinetic manipulation, and molecular profiling of low-abundance circulating tumor cells using a microfluidic system. Anal. Chem. 2011, 83, 2301– 2309, DOI: 10.1021/ac103172y [DOI] [PMC free article] [PubMed] [Google Scholar]
- 20.Wang S; Liu K; Liu J; Yu ZTF; Xu X; Zhao L; Lee T; Lee EK; Reiss J; Lee YK Highly efficient capture of circulating tumor cells by using nanostructured silicon substrates with integrated chaotic micromixers. Angew. Chem. 2011, 123, 3140– 3144, DOI: 10.1002/ange.201005853 [DOI] [PMC free article] [PubMed] [Google Scholar]
- 21.Yu L; Ng SR; Xu Y; Dong H; Wang YJ; Li CM Advances of lab-on-a-chip in isolation, detection and post-processing of circulating tumour cells. Lab Chip 2013, 13, 3163– 3182, DOI: 10.1039/c3lc00052d [DOI] [PubMed] [Google Scholar]
- 22.Park M-H; Reategui E; Li W; Tessier SN; Wong KHK; Jensen AE; Thapar V; Ting D; Toner M; Stott SL; Hammond PT Enhanced isolation and release of circulating tumor cells using nanoparticle binding and ligand exchange in a microfluidic chip. J. Am. Chem. Soc. 2017, 139, 2741– 2749, DOI: 10.1021/jacs.6b12236 [DOI] [PMC free article] [PubMed] [Google Scholar]
- 23.Stroock AD; Dertinger SK; Ajdari A; Mezić I; Stone HA; Whitesides GM Chaotic mixer for microchannels. Science 2002, 295, 647– 651, DOI: 10.1126/science.1066238 [DOI] [PubMed] [Google Scholar]
- 24.Johnson ES; Anand RK; Chiu DT Improved detection by ensemble-decision aliquot ranking of circulating tumor cells with low numbers of a targeted surface antigen. Anal. Chem. 2015, 87, 9389– 9395, DOI: 10.1021/acs.analchem.5b02241 [DOI] [PubMed] [Google Scholar]
- 25.Schiro PG; Zhao MX; Kuo JS; Koehler KM; Sabath DE; Chiu DT Sensitive and high-throughput isolation of rare cells from peripheral blood with ensemble-decision aliquot ranking. Angew. Chem., Int. Ed. 2012, 51, 4618– 4622, DOI: 10.1002/anie.201108695 [DOI] [PMC free article] [PubMed] [Google Scholar]
- 26.Zhao M; Nelson WC; Wei B; Schiro PG; Hakimi BM; Johnson ES; Anand RK; Gyurkey GS; White LM; Whiting SH New generation of ensemble-decision aliquot ranking based on simplified microfluidic components for large-capacity trapping of circulating tumor cells. Anal. Chem. 2013, 85, 9671– 9677, DOI: 10.1021/ac401985r [DOI] [PMC free article] [PubMed] [Google Scholar]
- 27.Zhao M; Wei B; Nelson WC; Schiro PG; Chiu DT Simultaneous and selective isolation of multiple subpopulations of rare cells from peripheral blood using ensemble-decision aliquot ranking (eDAR). Lab Chip 2015, 15, 3391– 3396, DOI: 10.1039/C5LC00384A [DOI] [PubMed] [Google Scholar]
- 28.Zhao M; Wei B; Chiu DT Imaging multiple biomarkers in captured rare cells by sequential immunostaining and photobleaching. Methods 2013, 64, 108– 113, DOI: 10.1016/j.ymeth.2013.08.006 [DOI] [PubMed] [Google Scholar]
- 29.Driemel C; Kremling H; Schumacher S; Will D; Wolters J; Lindenlauf N; Mack B; Baldus S; Hoya V; Pietsch J Context-dependent adaption of EpCAM expression in early systemic esophageal cancer. Oncogene 2014, 33, 4904– 4915, DOI: 10.1038/onc.2013.441 [DOI] [PubMed] [Google Scholar]
- 30.Hou S; Chen JF; Song M; Zhu Y; Jan YJ; Chen SH; Weng TH; Ling DA; Chen SF; Ro T; Liang AJ; Lee T; Jin H; Li M; Liu L; Hsiao YS; Chen P; Yu HH; Tsai MS; Pisarska MD Imprinted NanoVelcro microchips for isolation and characterization of circulating fetal trophoblasts: toward noninvasive prenatal diagnostics. ACS Nano 2017, 11, 8167– 8177, DOI: 10.1021/acsnano.7b03073 [DOI] [PMC free article] [PubMed] [Google Scholar]
- 31.Au SH; Edd J; Stoddard AE; Wong KH; Fachin F; Maheswaran S; Haber DA; Stott SL; Kapur R; Toner M Microfluidic isolation of circulating tumor cell clusters by size and asymmetry. Sci. Rep. 2017, 7, 2433, DOI: 10.1038/s41598-017-01150-3 [DOI] [PMC free article] [PubMed] [Google Scholar]
- 32.Williams MS; Longmuir KJ; Yager P A practical guide to the staggered herringbone mixer. Lab Chip 2008, 8, 1121– 1129, DOI: 10.1039/b802562b [DOI] [PMC free article] [PubMed] [Google Scholar]
Associated Data
This section collects any data citations, data availability statements, or supplementary materials included in this article.


