Abstract
This report describes the results of the Asia-Pacific Blood and Marrow Transplantation Group (APBMT) Activity Survey 2016, focusing on the trends of haploidentical and cord blood (CB) transplants in the Asia-Pacific region. Mongolia and Nepal submitted their first activity data in this survey, and the number of countries/regions participating in the activity survey grew to 20. The annual number of transplants exceeded 20,000 for the first time in 2016, and the total number of centers increased to 686. About 87.9% of all hematopoietic stem cell transplantations (HSCTs) were performed in China, Japan, Korea, India, and Australia with China performing the highest number. Beginning with the 2016 survey, APBMT modified the survey forms and initiated the collection of the exact number of haploidentical transplants. The total number of such transplants was 3,871, and 66.0% of those were performed in China. Meanwhile, cord blood transplants in this region remained high (1,612), and 81.8% of them (1,319) were performed in Japan. The number of facilities and transplants, the ratio of haploidentical transplants to related transplants, the ratio of CB transplants to unrelated transplants, and proportions of haploidentical and CB transplants per capita significantly differed among countries/regions in the Asia-Pacific region. Data collection and analysis revealed the transition and diversity of transplants in this region. This report also shows a dramatic increase in haploidentical transplants as seen in other parts of the world, while revealing uniquely that the activity of cord blood transplant remains high in this region.
Keywords: Asia-Pacific region, HSCT, haploidentical, cord blood
Introduction
Hematopoietic stem cell transplantation (HSCT) has actively performed worldwide as a curative treatment for many malignant and nonmalignant hematological diseases, as well as several non-hematological diseases, and its use continue to increase every year1. The Asia-Pacific Blood and Marrow Transplantation Group (APBMT) commenced a survey of HSCT activities in 2007 tracing back through the activity data in 1986, and has continued with these surveys for 14 years thereafter. The survey was performed using a simple Excel sheet collecting the data of HSCTs performed in the previous year regarding diseases for which HSCT was indicated (or performed), stem cell sources, and donor type. Over the years, some of the disease classifications have been changed, and some collection items were added by the data center to adapt the survey sheets to global standards. Despite such changes, the APBMT Activity Survey continued to be conducted every year with the cooperation of data submission managers in each country/region. The data center regularly analyzed the collected data in detail, and the results were shared with APBMT participating countries/regions. The data was also reported to the Worldwide Network for Blood and Marrow Transplantation (WBMT). APBMT has published the results of the HSCT performed in two different time periods (1986-20062 and 2005-20153). We herein report the results of HSCT in the Asia-Pacific region in 2016, focusing on the activity regarding haploidentical and cord blood (CB) transplants.
Materials and Methods
Data collection and definitions
This report is based on the data of HSCTs performed in 2016 and collected from 20 out of 22 participating APBMT countries/regions. As previously reported3, depending on the available tools for submitting the data in each country/region, data were sent to the APBMT Data Center 1) through the following national registries: the Australasian Bone Marrow Transplant Recipient Registry (ABMTRR), Chinese Blood and Marrow Transplantation Registry (CBMTR), Indian Society for Blood and Marrow Transplantation Registry (ISBMT), Korean Society of Blood and Marrow Transplantation (KSBMT), Japan Society for Hematopoietic Cell Transplantation (JSHCT)/Japanese Data Center for Hematopoietic Cell Transplantation (JDCHCT), Malaysian Society of Transplantation (MST), and Taiwan Society of Blood and Marrow Transplantation (TBMT) from 8 countries/regions (Australia, New Zealand, China, India, Republic of Korea [referred to as Korea in this paper], Japan, Malaysia, and Taiwan, respectively); 2) by individuals responsible for data collection in the major transplant centers in each country/region: Bangladesh, Iran, Myanmar, the Philippines, Sri Lanka, and Thailand; and 3) directly from each center in each country/region: Hong Kong, Mongolia, Nepal, Pakistan, Singapore, and Vietnam. At the end of 2018, when the Data Center completed the collection of 2016 Activity Survey data, Indonesia had commenced its HSCT program, and Cambodia had not yet started; hence, their activity was excluded from this report.
The activity survey data were collected for disease for which transplant were indicated, stem cell source, and donor type. The number of transplants was defined as follows: the number of HSCTs was counted as 2 in patients who had received transplants twice separately in the past year. If a patient received one HSCT using more than one donor sources, the case was counted as a mixture transplant which contains cases of bone marrow (BM) plus peripheral blood stem cells (PBSC), BM plus cord blood cells (CB), PBSC plus CB, or BM plus PBSC plus CB transplants. The APBMT Data Center had not previously collected the data under the category “haploidentical” in the activity survey and considered them as “HLA nonidentical family”. However, in order to assess the trend of haploidentical transplants more precisely, Data Center modified the 2016 survey forms, and we divided the “HLA non-identical family” donor into two categories: 1) “haploidentical” donor, who is a first-degree relative (sibling, parent or child) with 2 or more loci mismatched within the loci HLA-A, -B, -C, -DRB1, and-DQB1 in the GvH and/or HvG direction and 2) “other related” donor, who is any other family member not included in the category of HLA-identical and “haploidentical” siblings. The number of CB transplants in this paper has excluded the ones from related donors.
Transplantation rate
The transplant rates in each country/region were calculated as the number of each type of HSCT per 10 million residents in 2016. The total population for each country was extracted from a United States Census Bureau report4.
Statistical analyses and ethical approval
All analyses in this report were conducted at the APBMT Data Center using the basic function of Excel. The present survey was approved by the Institutional Review Board of the Aichi Medical University School of Medicine and the Registry Committee in APBMT.
Results
Number of centers and transplants
In 2016, 20,170 HSCTs were performed at 686 centers in 20 countries/regions in the Asia-Pacific (AP) region (Table 1). China (5,904) had the highest number of transplants in Asia for the first time, followed by Japan (5,488), Korea (2,531), India (1,968), and Australia (1,846). The total number of transplants per year increased by 2,599 (14.8%) over the previous year. The percent increase in total transplants was highest in China (45.8%), followed by India (20.3%). As opposed to this, the number of annual transplants in Japan decreased by 121 (2.2%). The total number of transplant centers in our region was 686 in 2016, which is 62 more than that in 2015. The number of newly opened centers in 2016 increased significantly in India (N = 26) and China (N = 24). Japan remained as the country with the highest number of centers (373), followed by China (88), India (67), Korea (44), and Australia (42). Comparing the number of centers per 10 million population in each country, 9 countries (Pakistan, Bangladesh, Philippines, Vietnam, Nepal, Myanmar, Sri Lanka, India, China) were less than 1, while New Zealand and Australia exceeded 10 and Japan was 29.2. Transplants in Bangladesh, Sri Lanka, and Myanmar Mongolia, and Nepal in 2016 were approximately 10 and the number of their centers ranged from 1 to 3. The average number of transplants per center in these five countries/regions ranged from 1-10. This figure remained less than the average number of transplants in other countries/regions, such as 10-40 in 6 countries/regions (30%) (India, Japan, Malaysia, the Philippines, Taiwan, and Thailand), 41-60 in 7 (35%) (Australia, Iran, Korea, New Zealand, Pakistan, Singapore, and Vietnam), and more than 60 in China and Hong Kong.
Table 1.
The total number of centers and transplants, the average number of transplants per one center, and the number of centers per 10 million population in each country/region in 2016
| Centers | Transplants | Transplant/
Center |
Centers/10 million
population |
|
|---|---|---|---|---|
| Australia | 42 | 1,846 | 44 | 17.4 |
| Bangladesh | 3 | 11 | 4 | 0.2 |
| China | 88 | 5,904 | 67 | 0.6 |
| Hong Kong | 2 | 142 | 71 | 2.7 |
| India | 67 | 1,968 | 29 | 0.5 |
| Iran | 9 | 410 | 46 | 1.1 |
| Japan | 373 | 5,488 | 15 | 29.2 |
| Korea | 44 | 2,531 | 58 | 8.7 |
| Malaysia | 11 | 360 | 33 | 3.5 |
| Mongolia | 1 | 2 | 2 | 3.3 |
| Myanmar | 2 | 5 | 3 | 0.4 |
| Nepal | 1 | 5 | 5 | 0.3 |
| New Zealand | 6 | 305 | 51 | 13.0 |
| Pakistan | 3 | 146 | 49 | 0.2 |
| Philippines | 2 | 25 | 13 | 0.2 |
| Singapore | 5 | 210 | 42 | 8.9 |
| Sri Lanka | 1 | 5 | 5 | 0.5 |
| Taiwan | 18 | 543 | 26 | 7.7 |
| Thailand | 7 | 183 | 30 | 1.0 |
| Vietnam | 2 | 81 | 41 | 0.2 |
| Total | 687 | 20,170 | 29 | 1.8 |
Stem cell source and donor type
Of the allogeneic transplants, the number of related transplants was consistently higher than that of unrelated ones. The number of unrelated transplants was getting close to those of related transplants from 2004 to 2011, but the number of related transplants has been rapidly increasing compared with unrelated transplants since 2011 (Figure 1A). Among the 20,170 HSCTs, 12,806 (63.5%) were allogeneic and 7,364 (36.5%) autologous, and among the allogeneic transplants, 8,033 (62.7%) were related and 4,773 (37.3%) unrelated. Donors for the allogeneic transplants were HLA identical sibling (3,801, 29.7%), haploidentical (3,871, 30.2%), other related (350, 2.7%), and twin (11, 0.1%) (Table 2). All allogeneic transplants in Pakistan, the Philippines, and Sri Lanka were performed using related donors. The rate of unrelated transplants exceeded 50% of all allogeneic transplants in Australia and Japan. There were no allogeneic transplants has been performed so far in Bangladesh, Mongolia, Myanmar, or Nepal (Figure 1B). Looking at the serial changes in the numbers of haploidentical and CB transplants over the past 30 years, the number of haploidentical transplants has increased rapidly since 2011 and it was more than twice as much as the number of CB transplants in 2016. As opposed to this, the number of CB transplants has also continued to increase constantly during the same period (Figure 1C).
Figure 1A. Trend in the total numbers of related and unrelated HSCTs in Asia-Pacific regions from 1986 to 2016.
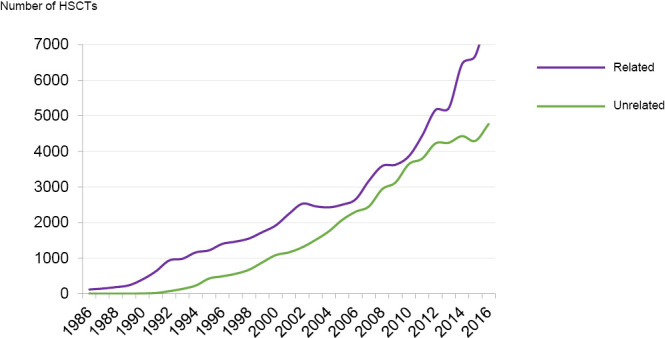
The number of related HSCTs was consistently higher than unrelated ones. The numbers of unrelated donor transplants got close to those of related donor transplants from 2004 to 2011. However, the difference became larger for the last few years.
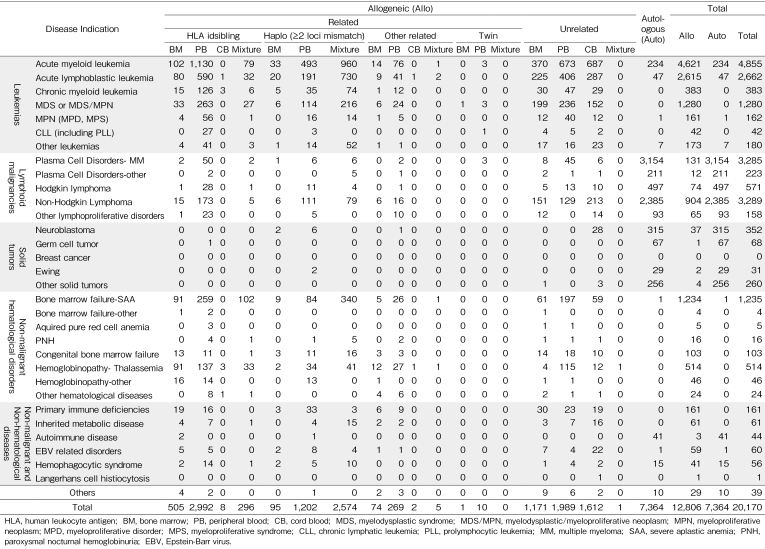
Table 2. The number of transplants by disease indications and stem cell sources in 2016.
Figure 1B. The distribution of haploidentical and cord blood transplants among allogeneic transplants.
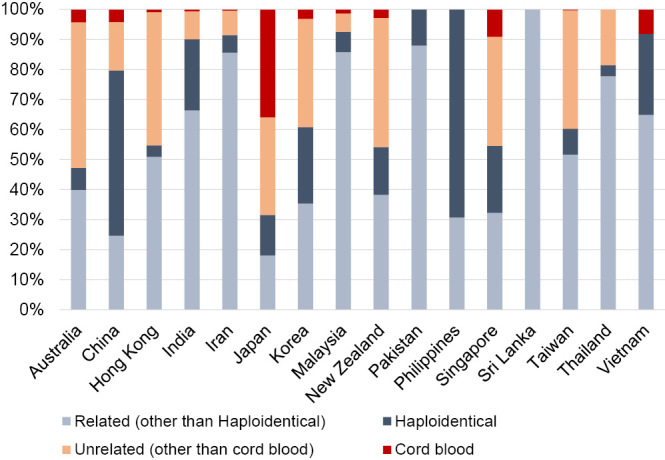
Blue portions (dark and pale) indicate related transplants. Red (dark and pink) portions indicate unrelated transplants. All allogeneic transplants in Pakistan, the Philippines, and Sri Lanka were related ones. The rate of unrelated transplants exceeded 50% of all allogeneic transplants in Australia and Japan. The percentage of haploidentical transplants exceeded 50% of related ones in China and the Philippines. The percentage of cord blood transplants exceeded 50% of unrelated ones in Vietnam and Japan. There were no allogeneic transplants in Bangladesh, Mongolia, Myanmar, and Nepal.
Figure 1C. Trend in the total numbers of haploidentical and cord blood HSCTs in Asia-Pacific regions from 1986 to 2016.
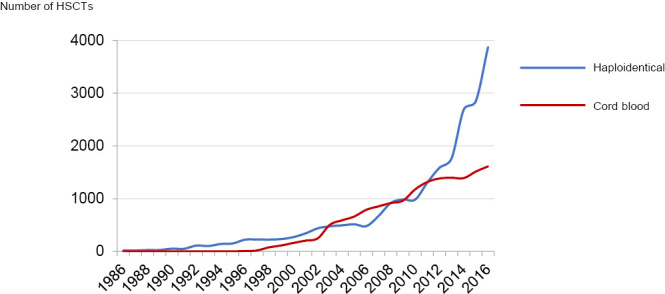
The number of haploidentical transplants has increased rapidly since 2011, and it more than doubled the number of CB transplants in 2016. As opposed to haploidentical transplants, CB transplants have been steadily increasing in number.
The number of haploidentical transplants in 2016 was 2,554 (66.0%) in China, followed by Japan 496 (12.8%), Korea 365 (9.4%), and India 281 (7.3%) (Table 3). The stem cell sources used for haploidentical transplants were 100% mixture in China; however, PB was used more than 85% haploidentical transplants in Japan, Korea, and India. Of the 3,871 haploidentical transplants, 2,574 (66.5%) were derived from a mixture of BM and PB, and 99.2% of the mixture haploidentical transplants were performed in China. The majority of CB transplants were performed in Japan (N=1,319 accounting for 81.8% of all CB transplants) and China (N=194, accounting for 12.0% of all CB transplants). They were only these two countries that increased in the number of CB transplants in 2016 compared to 2015. In the rest of the countries/regions, the number of CB transplants has ranged less than 50 (Table 3), and all of them decreased the number of CB transplants in 2016 compared to 2015.
Table 3.
The number of haploidentical transplants by stem cell sources and cord blood transplants in each country/region
| Country/Region | Haploidentical | Cord Blood | ||
|---|---|---|---|---|
| Bone Marrow | Peripheral Blood | Mixture | ||
| Australia | 4 | 42 | 0 | 27 |
| Bangladesh | 0 | 0 | 0 | 0 |
| China | 0 | 0 | 2,554 | 194 |
| Hong Kong | 0 | 4 | 0 | 1 |
| India | 10 | 269 | 2 | 7 |
| Iran | 0 | 15 | 0 | 1 |
| Japan | 64 | 428 | 4 | 1,319 |
| Korea | 8 | 357 | 0 | 45 |
| Malaysia | 1 | 8 | 1 | 2 |
| Mongolia | 0 | 0 | 0 | 0 |
| Myanmar | 0 | 0 | 0 | 0 |
| Nepal | 0 | 0 | 0 | 0 |
| New Zealand | 1 | 16 | 0 | 3 |
| Pakistan | 4 | 8 | 3 | 0 |
| Philippines | 0 | 9 | 0 | 0 |
| Singapore | 1 | 21 | 0 | 9 |
| Sri Lanka | 0 | 0 | 0 | 0 |
| Taiwan | 2 | 13 | 10 | 1 |
| Thailand | 0 | 2 | 0 | 0 |
| Vietnam | 0 | 10 | 0 | 3 |
| Sub total | 95 | 1,202 | 2,574 | 1,612 |
| Total | 3,871 | 1,612 | ||
The proportion of haploidentical transplants to related transplants and that of CB transplants to unrelated transplants in each country/region were considerably different, as shown in Figure 1B. In China and the Philippines, approximately 70% of related transplants (69.1% and 69.2%, respectively) were haploidentical. In addition, haploidentical transplants in Japan, Korea, and Singapore accounted for a relatively high proportion of related transplants (42.7%, 41.9%, and 40.7%, respectively). On the other hand, the number of CB transplants in Japan was 1,319 accounting for 81.8% of all CB transplants in APBMT, and for 52.5% of all unrelated transplants. In Vietnam, 100% of unrelated transplants were performed using CB.
Disease indication
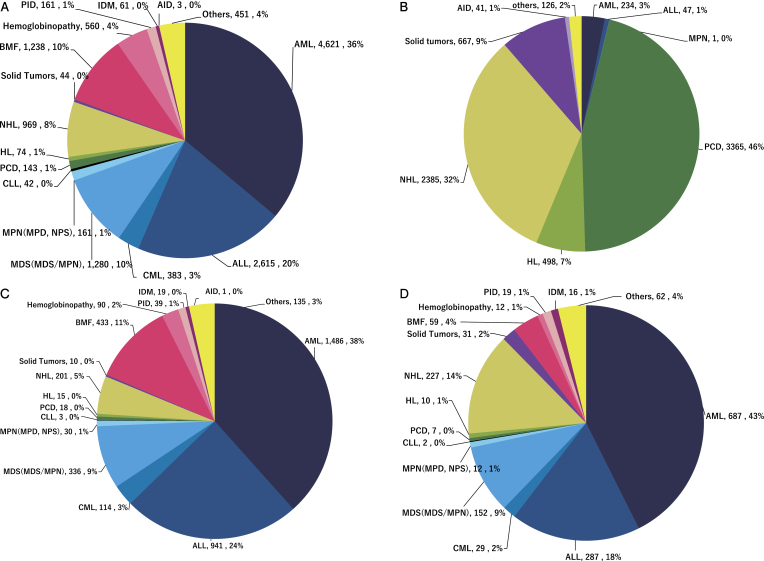
The main diseases for which transplants were indicated are listed in Table 2. The main indications for all HSCTs were as follows: acute myelogenous leukemia (AML) (4,855, 24.1%), plasma cell disorders (PCD) (3,508, 17.4%), non-Hodgkin lymphoma (NHL) (3,289, 16.3%), acute lymphoblastic leukemia (ALL) (2,662, 13.2%), myelodysplastic syndrome (MDS, MDS/MPN) (1,280, 6.3%), and bone marrow failure (BMF) (1,239, 6.1%). Among those, 95.2% of AML, 98.2% of ALL, and 100% of MDS (MDS/MPN) and BMF cases were treated with allogeneic transplants, whereas autologous transplants were preferred for the majority of PCD (95.9%) and NHL (72.5%) (Figure 2A, B). Hemoglobinopathy accounted for 2.8% (560 cases) of all HSCTs, and all of them were allogeneic. AML and ALL were major disease indications for haploidentical and CB transplants; however, haploidentical transplants tended to be preferred for BMF, while CB transplants were preferred for hematological malignancies such as AML, ALL and, NHL (Figure 2C, D).
Figure 2. Absolute numbers and percentage of diseases for which transplants were performed in 2016.
(A) Allogeneic transplants, (B) Autologous transplants, (C) Haploidentical transplants, and (D) Cord blood transplants.
AML, acute myelogenous leukemia; ALL, acute lymphoblastic leukemia; MDS, myelodysplastic syndrome; CML, chronic myeloid leukemia; MDS/MPN, myelodysplastic/myeloproliferative neoplasm; MPN, myeloproliferative neoplasm; MPD, myeloproliferative disorder; MPS, myeloproliferative syndrome; CLL, chronic lymphatic leukemia; PCD, plasma cell disorders; HL, Hodgkin lymphoma; NHL, non-Hodgkin lymphoma; BMF, bone marrow failure; PID, primary immune deficiencies; IDM, inherited disorders of metabolism; AID, autoimmune diseases.
Transplant rates
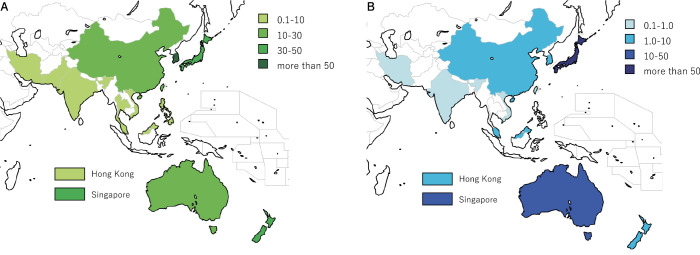
The transplant rates of haploidentical and CB transplants differed significantly among the countries/regions. The number of haploidentical transplants per 10 million people was highest in Korea (71.9), followed by Singapore ( 39.3), Japan (38.8), and New Zealand (37.0). It was 18.1 in China, where the absolute number of haploidentical transplants was the highest. The rate of CB transplants also differed more widely among countries/regions, from 0.1 in India to 103.3 in Japan (Figure 3A, B).
Figure 3. Transplant rates of (A) haploidentical and (B) cord blood in each country/region in 2016.
(A) Global map showing distribution of haploidentical transplant cases using varying shades of green.
(B) Global map showing distribution of cord blood transplant cases using varying shades of blue.
Discussion
This report describes the transition and diversity of transplants in the AP region through the continuous transplant activity data collection and analysis. According to the first APBMT Activity Survey report by Yoshimi et al.2, the number of countries/regions reported in 2006 was 9 (China, Hong Kong, Iran, Japan, Korea, Malaysia, Singapore, Taiwan, and Vietnam), and the number of transplants was 6,418. The numbers of participating countries/regions and transplants have increased 2.2 and 3.1 times over the last 10 years, respectively, indicating HSCT activity has continued to increase in the AP region. In this report we focused on the activity of haploidentical transplants in our region in comparison of transplant activity using other stem cell sources.
Bone marrow failure was the most frequent disease indication after AML and ALL in haploidentical transplants, reflecting a rapid increase in the number of severe aplastic anemia (SAA) cases in China5. Xu et al. reported favorable results on performing haploidentical transplants on SAA patients who had no identical sibling or unrelated donors, or those who failed the previous immunosuppressant therapy6, and this trend is expected to remain unchanged. In Japan, the proportion of CB transplants to unrelated transplants has also increased and the number of unrelated BM transplants and CB transplants are almost the same7. There are many reports of CB transplants for hematological malignancies from Japan and all of which suggest that CB is a favorable alternative stem cell source for patients without a human leukocyte antigen (HLA)-matched related or unrelated donors8-10.
With an increased number of participating countries/regions as well as the transplant centers in each country/region, the diversity in transplants among them has been revealed. Not only the annual number of HSCTs and the total number of centers but also the average number of transplants per center, the number of centers, haploidentical and CB transplants per 10 million population showed a great difference among each country/region in this analysis. While there were countries/regions such as China, Japan, Korea, India, and Australia which had very large annual numbers of transplants and centers, those numbers in Bangladesh, Myanmar, and Sri Lanka, Nepal and Mongolia were very small. However, existing centers in these countries/regions are expected to play a central role in promoting transplant activity in each country/region.
A trend of increasing number of haploidentical transplants has recently been reported in Europe11, the United States12, and the East-Mediterranean/African region13. In the Asia-Pacific region, the majority of haploidentical transplants were performed in China using the method reported by Wang et al.14, and their number is still increasing5. In addition, based on recent reports on the efficacy and safety of haploidentical PBSC transplants with cyclophosphamide after HSCT15,16, the number of haploidentical transplants is rapidly increasing in Japan, Korea, and India. Compared to CB, the haploidentical transplant has several advantages as an alternative HSCT method: 1) no need for the bank system for hematopoietic stem cells, 2) easy access to sufficient stem cells when a recipient has excess weight, and 3) can expect high engraftment rate Since emerging countries/regions do not have their own adequate marrow donor bank or CB preservation system, haploidentical transplants in these areas are expected to continue to increase.
A trend of decreasing number of CB transplants has also been reported worldwide11-13,17. On the contrary, there are still many CB transplants in the Asia-Pacific region, especially in Japan. This could be explained by three important factors 1) since the average body weight of Japanese is relatively lighter than that of European and American, it is easier to find a suitable CB donor in Japan18, 2) the establishment of public CB banks early during the introduction of CB transplants and the cost of CB unit remains much cheaper than those in Western countries. 3) With the development of legislation for the proper implementation of HSCT medicine, the quality of CB units and the system to their supply are well maintained. CB transplants have the advantage of enabling the rapid identification of available donors but at the same time it requires more experience in managing graft failure and relapse is needed by transplant teams. In addition, for the safe preservation and stable supply of CB as well as smooth and proper operation of the marrow donor bank, it is essential for each country/region to create HSCT infrastructure in cooperation with policymakers. Passeweg11 and Baldomero13 et al. pointed out that economics and cost-effectiveness are important in selecting donors in less wealthy countries. The fact that the lack of unrelateddonor registries and public CB banks reflects an increase in haploidentical transplants and stagnation of CB transplants also applies to the Asia-Pacific region. There are 8 countries/regions with national registries and 13 that have CB banks in the Asia-Pacific region3. For HSCT activities to progress in this region, it will be imperative for all countries/regions in APBMT to establish their own HSCT registries and promote not only CB transplants but all HSCT activities on a country-by-country basis in future.
This is limited by the lack of patient outcome data. The APBMT Registry Committee established an outcome data collection system several years ago and the data is accumulating. We will then be able to report more detailed information on HSCT in this region.
We conclude that this report clarified the status of HSCT using alternative donors in this region. We could show a dramatic increase in haploidentical transplants like in other parts of the world while revealing the unique feature in this region that the activity of cord blood transplant remains high. Continuous data collection and analysis by the activity survey will help each country/region clarify the position of HSCT medicine in the Asia-Pacific region as well as in the world and reveal the direction of HSCT medicine in the very near future.
Author Contributions
MI, AD, MA, JHM, HVM, MRB, AAG, AH, SO, and YA designed the research and wrote the manuscripts. AD, MA, AS, JHM, HVM, MRB, AAG, DJ, KL, BSK, AH, KWH, AH, AU, TF, JS, BP, KB, and YA submitted data and reviewed the results. MI analyzed data.
Conflicts of Interest
The authors declare no conflicts of interest associated with this article. Disclosure forms provided by the authors are available here.
Supplements
Acknowledgments
We are grateful to all APBMT members, especially to all Scientific Committee members and their data managers who gathered data in each registry, country, center, or hospital every year. We also appreciate the cooperation of all participating teams, countries/regions, and organizations, and their staffs, especially for the ABMTRR, CBMTR, ISBMT, KSBMT, JSHCT/JDCHCT, MST, and TBMT. This report was conducted by the APBMT Registry Committee and Data Center. We also thank Yukari Nakao and Hiroe Namizaki of the APBMT Data Center for their excellent assistance.
References
- 1.Gratwohl A, Pasquini MC, Aljurf M, Atsuta Y, Baldomero H, Foeken L, et al. One million haemopoietic stem-cell transplants: a retrospective observational study. The Lancet Haematology. 2015; 2: e91-e100. [DOI] [PubMed] [Google Scholar]
- 2.Yoshimi A, Suzuki R, Atsuta Y, Iida M, Lu DP, Tong W, et al. Hematopoietic SCT activity in Asia: a report from the Asia-Pacific Blood and Marrow Transplantation Group. Bone Marrow Transplant. 2010; 45: 1682-91. [DOI] [PubMed] [Google Scholar]
- 3.Iida M, Kodera Y, Dodds A, Ho AYL, Nivison-Smith I, Akter MR, et al. Advances in hematopoietic stem cell transplantation in the Asia-Pacific region: the second report from APBMT 2005-2015. Bone Marrow Transplant. 2019; 54: 1973-86. [DOI] [PMC free article] [PubMed] [Google Scholar]
- 4.Office USC. U. S. and World Population Clock. 2018. https://www.census.gov/popclock/ [Accessed March 31, 2020]
- 5.Xu LP, Wu DP, Han MZ, Huang H, Liu QF, Liu DH, et al. A review of hematopoietic cell transplantation in China: data and trends during 2008-2016. Bone Marrow Transplant. 2017; 52: 1512-18. [DOI] [PubMed] [Google Scholar]
- 6.Xu LP, Wang SQ, Wu DP, Wang JM, Gao SJ, Jiang M, et al. Haplo-identical transplantation for acquired severe aplastic anaemia in a multicentre prospective study. Br J Haematol. 2016; 175: 265-74. [DOI] [PubMed] [Google Scholar]
- 7.JDCHCT. The Japanese Data Center for Hematopoietic Cell Transplantation; Activities and Outcomes of Hematopoietic Cell Transplantation in Japan 2016 Summary Slide. 2017. http://www.jdchct.or.jp/en/data/slide/2016/ [Accessed January 28, 2020]
- 8.Atsuta Y, Suzuki R, Nagamura-Inoue T, Taniguchi S, Takahashi S, Kai S, et al. Disease-specific analyses of unrelated cord blood transplantation compared with unrelated bone marrow transplantation in adult patients with acute leukemia. Blood. 2009; 113: 1631-8. [DOI] [PubMed] [Google Scholar]
- 9.Terakura S, Atsuta Y, Tsukada N, Kobayashi T, Tanaka M, Kanda J, et al. Comparison of Outcomes of 8/8 and 7/8 Allele-Matched Unrelated Bone Marrow Transplantation and Single-Unit Cord Blood Transplantation in Adults with Acute Leukemia. Biol Blood Marrow Transplant. 2016; 22: 330-8. [DOI] [PubMed] [Google Scholar]
- 10.Kanda J, Ichinohe T, Kato S, Uchida N, Terakura S, Fukuda T, et al. Unrelated cord blood transplantation vs related transplantation with HLA 1-antigen mismatch in the graft-versus-host direction. Leukemia. 2013; 27: 286-94. [DOI] [PubMed] [Google Scholar]
- 11.Passweg JR, Baldomero H, Bader P, Basak GW, Bonini C, Duarte R, et al. Is the use of unrelated donor transplantation leveling off in Europe? The 2016 European Society for Blood and Marrow Transplant activity survey report. Bone Marrow Transplant. 2018; 53: 1139-48. [DOI] [PMC free article] [PubMed] [Google Scholar]
- 12.Research CIBMT. Summary Slides- HCT Trends and Survival Data. 2018. https://www.cibmtr.org/ReferenceCenter/SlidesReports/SummarySlides/pages/index.aspx [Accessed March 31, 2020]
- 13.Baldomero H, Aljurf M, Zaidi SZA, Hashmi SK, Ghavamzadeh A, Elhaddad A, et al. Narrowing the gap for hematopoietic stem cell transplantation in the East-Mediterranean/African region: comparison with global HSCT indications and trends. Bone Marrow Transplant. 2019; 54: 402-17. [DOI] [PMC free article] [PubMed] [Google Scholar]
- 14.Wang Y, Liu DH, Liu KY, Xu LP, Zhang XH, Han W, et al. Long-term follow-up of haploidentical hematopoietic stem cell transplantation without in vitro T cell depletion for the treatment of leukemia: nine years of experience at a single center. Cancer. 2013; 119: 978-85. [DOI] [PubMed] [Google Scholar]
- 15.Raj K, Pagliuca A, Bradstock K, Noriega V, Potter V, Streetly M, et al. Peripheral blood hematopoietic stem cells for transplantation of hematological diseases from related, haploidentical donors after reduced-intensity conditioning. Biol Blood Marrow Transplant. 2014; 20: 890-5. [DOI] [PMC free article] [PubMed] [Google Scholar]
- 16.Sugita J, Kawashima N, Fujisaki T, Kakihana K, Ota S, Matsuo K, et al. HLA-Haploidentical Peripheral Blood Stem Cell Transplantation with Post-Transplant Cyclophosphamide after Busulfan-Containing Reduced-Intensity Conditioning. Biol Blood Marrow Transplant. 2015; 21: 1646-52. [DOI] [PubMed] [Google Scholar]
- 17.Niederwieser D, Baldomero H, Szer J, Gratwohl M, Aljurf M, Atsuta Y, et al. Hematopoietic stem cell transplantation activity worldwide in 2012 and a SWOT analysis of the Worldwide Network for Blood and Marrow Transplantation Group including the global survey. Bone Marrow Transplant. 2016; 51: 778-85. [DOI] [PMC free article] [PubMed] [Google Scholar]
- 18.Yamamoto H. Single cord blood transplantation in Japan; expanding the possibilities of CBT. Int J Hematol. 2019; 110: 39-49. [DOI] [PubMed] [Google Scholar]
Associated Data
This section collects any data citations, data availability statements, or supplementary materials included in this article.


