

Abstract
Introduction:
Inherited mitochondrial DNA (mtDNA) variants may influence Alzheimer’s disease (AD) risk.
Methods:
We sequenced mtDNA from 146 AD and 265 cognitively normal (CN) subjects from the University of Kansas AD Center (KUADC) and assigned haplogroups. We further considered 244 AD and 242 CN AD Neuroimaging Initiative (ADNI) subjects with equivalent data.
Results:
Without applying multiple comparisons corrections, KUADC haplogroup J AD and CN frequencies were 16.4% versus 7.6% (P = .007), and haplogroup K AD and CN frequencies were 4.8% versus 10.2% (P = .063). ADNI haplogroup J AD and CN frequencies were 10.7% versus 7.0% (P = .20), and haplogroup K frequencies were 4.9% versus 8.7% (P = .11). For the combined 390 AD and 507 CN cases haplogroup J frequencies were 12.8% versus 7.3% (P = .006), odds ratio (OR) = 1.87, and haplogroup K frequencies were 4.9% versus 9.5% (P = .010), OR = 0.49. Associations remained significant after adjusting for apolipoprotein E, age, and sex.
Conclusion:
This exploratory analysis suggests inherited mtDNA variants influence AD risk.
Keywords: Alzheimer’s disease, apolipoprotein E, haplogroup, mitochondria, mitochondrial DNA
1 |. BACKGROUND
Alzheimer’s disease (AD) very rarely arises through Mendelian mutation.1 Most have a late-onset AD (LOAD) form that is considered sporadic but genetically influenced. Linkage, genome-wide association studies (GWAS), and whole exome sequencing (WES) studies reveal associations between LOAD and single nucleotide variants (SNVs) in more than 30 genes.2–7 These include nuclear genes that encode mitochondrial proteins, or proteins that may directly or indirectly affect mitochondrial function.8–10
Mitochondria are altered in AD and this may arise at least in part from somatic or inherited mitochondrial DNA (mtDNA) variants.11,12 A role for inherited mtDNA variation in AD is supported by studies showing AD subjects are more likely to have AD-affected mothers than fathers,13 AD endophenotypes are more apparent in adult children of AD mothers than fathers,14–18 and deficiencies in AD subject mitochondrial function are not brain-limited and track with platelet mtDNA.15,19–21
AD-mtDNA association studies report particular mtDNA polymorphisms occur more frequently in AD subjects,11,22–24 but such findings are not consistently observed.25–28 A similar situation exists for association studies of mtDNA haplogroups, sets of specific, linked mtDNA polymorphisms that arose in certain populations during prehistoric human migrations.29 While some studies report disproportionate mtDNA haplogroup frequencies between AD and non-AD individuals,30,31 mtDNA haplogroup data vary across studies.32–35
Here, we analyzed mtDNA haplogroup frequencies in AD and cognitively normal (CN) control subjects from the University of Kansas Alzheimer’s Disease Center’s (KUADC) clinical cohort. As part of a replication cohort we further analyzed mtDNA haplogroup frequencies from mtDNA-sequenced members of the Alzheimer’s Disease Neuroimaging Initiative (ADNI) cohort. Finally, we combined the cases from both cohorts and joint-analyzed the resulting haplogroup frequencies.
2 |. METHODS
2.1 |. The KUADC cohort and disease diagnosis
Recruitment, enrollment, all characterizations, and analysis of participants in this study were approved by the Institutional Review Board of the University of Kansas Medical Center. Informed consent was obtained from all participants at the time of enrollment in the KUADC clinical cohort. All procedures were designed and conducted in accordance with the tenets of the Declaration of Helsinki.
The KUADC cohort is a longitudinal cohort and participants are annually evaluated. The annual evaluation includes ascertainment of demographic information, medical diagnoses, and medications; a general neurological exam; a clinical dementia rating (CDR) scale evaluation; and a neuropsychological test battery defined by the National Institute on Aging (NIA)’s P30-P50 Alzheimer’s Disease Centers (ADC) network. Data from each participant visit are reviewed during a consensus conference that includes subspecialty-trained cognitive neurologists, a neuropsychologist, nurse practitioners, psychometricians, and cohort coordinators. The conference assigns each participant to one of the following diagnostic groups: CN, mild cognitive impairment (MCI), impaired but not MCI, dementia due to AD per clinical diagnostic criteria,36 or dementia from a non-AD etiology. A participant’s group assignment can change over time.
At death, some participants undergo brain autopsy, which returns a description of pathological brain findings, as well as an estimate of how likely AD or another neurologic disease is present. For this study, we considered only subjects who were AD or CN at the initial visit, AD or CN at the last available visit, or AD or CN after brain autopsy. We did not include participants classified as MCI or impaired/not MCI because underlying pathologic substrates are more heterogeneous in those with these syndromic designations. We similarly excluded demented participants diagnosed with or with a proven non-AD primary etiology.
2.2 |. ADNI demographics and haplogroups
We used the ADNI cohort as a replication cohort. The ADNI was launched in 2003 as a public-private partnership, led by Michael W. Weiner, MD. The primary goal of ADNI has been to test whether serial magnetic resonance imaging (MRI), positron emission tomography (PET), other biological markers, and clinical and neuropsychological assessment can be combined to measure the progression of MCI and early AD. Descriptive and demographic characteristics of ADNI participants are recorded and accessible. Like the KUADC cohort, the ADNI cohort is longitudinal by design and group assignment can change over time. Only ADNI participants with an available complete mtDNA sequence were used in the present study. This subset of ADNI participants have undergone complete mtDNA sequencing and those sequences were used to assign mtDNA haplogroups.37 There was no overlap between KUADC and ADNI subjects in this study.
ADNI participants are classified as AD, MCI, or CN. For this study, we considered only ADNI subjects who were AD or CN at the time of their initial visit, or AD or CN at the time of the last available diagnosis indicated in the publicly accessible database.
2.3 |. KUADC mtDNA sequencing, haplogrouping, and genotyping
All KUADC clinical cohort participants undergo mtDNA sequencing. KUADC mtDNA sequencing, haplogrouping, and apolipoprotein E (APOE) genotyping methods are described in the supporting information.
2.3.1 |. Statistical analyses
Descriptive statistics (means and standard deviations for continuous measures, frequencies, and relative frequencies for categorical measures) were generated. For continuous measures, we used the two-sample Student’s t-test to compare the means between AD versus CN groups. For the CDR scale we considered sum of the boxes (SOB) scores.
Haplogroup frequencies between the AD and CN groups from the KUADC, ADNI, and combined cohorts were compared using Fisher’s exact test. Due to small cohort sizes, for this basic analysis we did not adjust for other covariates or apply multiple comparisons corrections. We subsequently used Fisher’s exact tests to compare AD and CN frequencies for each haplogroup by APOE4 carrier status. Odds ratios (ORs) with corresponding 95% confidence intervals were used to create forest plots. To test whether association of haplogroups with AD risk differed with respect to APOE4 status (ie, interaction), we performed logistic regression analyses using AD/CN as an outcome and haplogroups and APOE4 as predictor variables including the interaction term. We performed additional analyses using logistic regression models in which the association of haplogroups with AD risk were assessed adjusting for the covariates APOE4, sex, and age. For the combined KUADC and ADNI data sets, we also adjusted for the cohort in the model. Tests were considered statistically significant for P-values <.05.
3 |. RESULTS
We considered participants from the KUADC clinical cohort with an mtDNA haplogroup assignment and most current or terminal diagnosis of AD or CN. These subjects predominantly resided in the Kansas City metropolitan area. We used the most recent or terminal diagnosis because with longitudinal cohorts, group assignment can change over time. We identified 411 individuals, 146 AD and 265 CN. Table S1 in supporting information includes KUADC cohort clinical and APOE genotype characteristics. Ninety-two percent were non-Latino whites. The proportion of men in the AD group (57.5%) exceeded that of the CN group (32.1%). A significantly higher number of AD subjects than CN had at least one APOE4 allele. Ninety of the 146 (61.6%) AD participants carried at least one APOE4 allele, while 73 of the 265 (27.5%) CN participants carried at least one APOE4 allele.
Eight haplogroups, H, I, J, K, L, T, U, and V were observed in seven or more subjects, accounting for 388 (94%) of the 411 cohort subjects (Table 1). Haplogroups B, C, D, F, M, N, R, W, and X each had between one and six subjects. Haplogroup H was the single most common haplogroup, present in 45%. Without correcting for covariates or multiple comparisons, haplogroup J frequency in the AD subjects (16.4%) exceeded its CN subject frequency (7.6%; P = .007). Haplogroup K frequency trended lower in the AD group (4.8%) compared to the CN group (10.2%; P = .063). Haplogroup V frequency also trended lower in AD (P = .054), but the number of haplogroup V carriers was quite low.
TABLE 1.
Haplogroup distributions in the KUADC AD and CN groups
| Parameter | AD (n = 146) | CN (n = 265) | Odds ratio | P |
|---|---|---|---|---|
| Haplogroup H | 63 (43.2%) | 119 (44.9%) | 0.93 | .756 |
| Haplogroup I | 4 (2.7%) | 5 (1.9%) | 1.46 | .727 |
| Haplogroup J | 24 (16.4%) | 20 (7.6%) | 2.40 | .007 |
| Haplogroup K | 7 (4.8%) | 27 (10.2%) | 0.44 | .063 |
| Haplogroup L | 11 (7.5%) | 19 (7.2%) | 1.06 | 1.000 |
| Haplogroup T | 11 (7.5%) | 25 (9.4%) | 0.78 | .587 |
| Haplogroup U | 19 (13.0%) | 27 (10.2%) | 1.32 | .415 |
| Haplogroup V | 0 (0%) | 7 (2.6%) | 0 | .056 |
| Others | 7 (4.8%) | 16 (6.0%) |
Notes: Haplogroups with fewer than seven subjects are not listed. The “others” designation includes lumped subjects with haplogroups B, C, D, F, M, N, R, W, and X.
Abbreviations: AD, Alzheimer’s disease; CN, cognitively normal; KUADC, University of Kansas AD Center.
For replication we evaluated a comparable cohort from the longitudinal ADNI study. Its participants undergo annual clinical evaluations, which inform diagnostic group assignments that include AD and CN. Haplogroup status, verifiable through complete mtDNA sequences, are available for a subset. We identified 486 participants whose most recent available diagnostic category was AD or CN, and who also had a complete mtDNA sequence-verified haplogroup. This included 244 AD and 242 CN subjects. Table S2 in supporting information provides subject demographics. One hundred fifty-seven of the 244 (64.3%) AD participants carried at least one APOE4 allele, while 61 of the 242 (25.2%) CN participants carried at least one APOE4 allele. Even without correcting for covariates or multiple comparisons, no statistically significant associations emerged (Table 2). There was a small trend toward a higher haplogroup J frequency in AD (10.7% in AD vs 7.0% in CN, P = .201), and a trend toward lower haplogroup K frequency in AD (4.9% in AD vs 8.7% in CN, P =.108). The ADNI cohort did not trend toward a lower AD haplogroup V frequency.
TABLE 2.
Haplogroup distributions in the ADNI AD and CN groups
| Parameter | AD (n = 244) | CN (n = 242) | Odds ratio | P |
|---|---|---|---|---|
| Haplogroup H | 110 (45.1%) | 104 (43.0%) | 1.09 | .649 |
| Haplogroup I | 6 (2.5%) | 9 (3.7%) | 0.65 | .446 |
| Haplogroup J | 26 (10.7%) | 17 (7.0%) | 1.58 | .201 |
| Haplogroup K | 12 (4.9%) | 21 (8.7%) | 0.55 | .108 |
| Haplogroup L | 5 (2.1%) | 13 (5.4%) | 0.37 | .058 |
| Haplogroup T | 23 (9.4%) | 22 (9.1%) | 1.04 | 1.000 |
| Haplogroup U | 31 (12.7%) | 33 (13.6%) | 0.92 | .790 |
| Haplogroup V | 8 (3.3%) | 9 (3.7%) | 0.88 | .811 |
| Others | 23 (9.5%) | 14 (5.8%) |
Note: The “others” designation includes lumped subjects with haplogroups A, B, C, F, M, N, R, W, and X.
Abbreviations: AD, Alzheimer’s disease; ADNI, Alzheimer’s Disease Neuroimaging Initiative; CN, cognitively normal.
We resolved haplogroup haplotype frequencies and present these data in Tables S3 (for the KUADC cohort) and S4 (for the ADNI cohort) in supporting information. Due to power considerations we did not analyze the haplogroup haplotypes for statistical association.
Combined, the KUADC and ADNI cohorts included 897 subjects, 390 AD and 507 CN. Two hundred forty-seven of the 390 (63.3%) AD participants carried at least one APOE4 allele, while 134 of the 507 (26.4%) CN participants carried at least one APOE4 allele. For the combined cohort, without correcting for covariates or multiple comparisons, AD haplogroup J frequency (12.8%) exceeded CN haplogroup J frequency (7.3%; P = .006; Table 3). CN haplogroup K frequency (9.5%) exceeded AD haplogroup K frequency (4.9%; P = .010).
TABLE 3.
Haplogroup distributions in the combined (KUADC plus ADNI cases) cohort
| Parameter | AD (n = 390) | CN (n = 507) | Odds ratio | P |
|---|---|---|---|---|
| Haplogroup H | 173 (44.4%) | 223 (44.0%) | 1.02 | .946 |
| Haplogroup I | 10 (2.6%) | 14 (2.8%) | 0.93 | 1.000 |
| Haplogroup J | 50 (12.8%) | 37 (7.3%) | 1.87 | .006 |
| Haplogroup K | 19 (4.9%) | 48 (9.5%) | 0.49 | .010 |
| Haplogroup L | 16 (4.1%) | 32 (6.3%) | 0.64 | .178 |
| Haplogroup T | 34(8.7%) | 47 (9.3%) | 0.93 | .815 |
| Haplogroup U | 50 (12.8%) | 60 (11.8%) | 1.10 | .682 |
| Haplogroup V | 8 (2.1%) | 16 (3.2%) | 0.64 | .405 |
| Others | 30 (7.7%) | 30 (5.9%) |
Note: The “others” designation includes lumped subjects with haplogroups A, B, C, D, F, M, N, R, W, and X.
Abbreviations: AD, Alzheimer’s disease; ADNI, Alzheimer’s Disease Neuroimaging Initiative; CN, cognitively normal; KUADC, University of Kansas AD Center.
We adjusted KUADC, ADNI, and combined cohort data for APOE, sex, and age. In addition, we adjusted the combined data for the cohort (KUADC or ADNI). The three significant associations observed in the unadjusted analyses persisted in the adjusted analyses. The increased KUADC cohort AD haplogroup J frequency remained statistically significant after adjusting for APOE, age, and sex (P = .023). The increased combined KUADC/ADNI cohort AD haplogroup J frequency remained statistically significant after adjusting for APOE, age, sex, and cohort (P = .015). The decreased combined KUADC/ADNI cohort AD haplogroup K frequency was statistically significant after adjusting for APOE, age, sex, and cohort (P = .026). The cohort was not statistically significant.
We did not observe statistically significant haplogroup-APOE interactions, but forest plots of the haplogroup data, stratified by APOE genotype, revealed potentially notable qualitative relationships (Figure 1). In the KUADC cohort, the haplogroup J association appeared stronger in APOE4 carriers (Figure 1a). For the combined KUADC/ADNI cohort, the haplogroup J and haplogroup K associations also appeared stronger in APOE4 carriers (Figure 1c). To alternatively illustrate these haplogroup-APOE qualitative relationships and show them in relation to the most common haplogroup, haplogroup H, Figure 2 shows the fitted probability of AD versus APOE4 for these haplogroups, with Figure 2a showing the KUADC data, Figure 2b showing the ADNI data, and Figure 2c showing the combined data.
FIGURE 1.
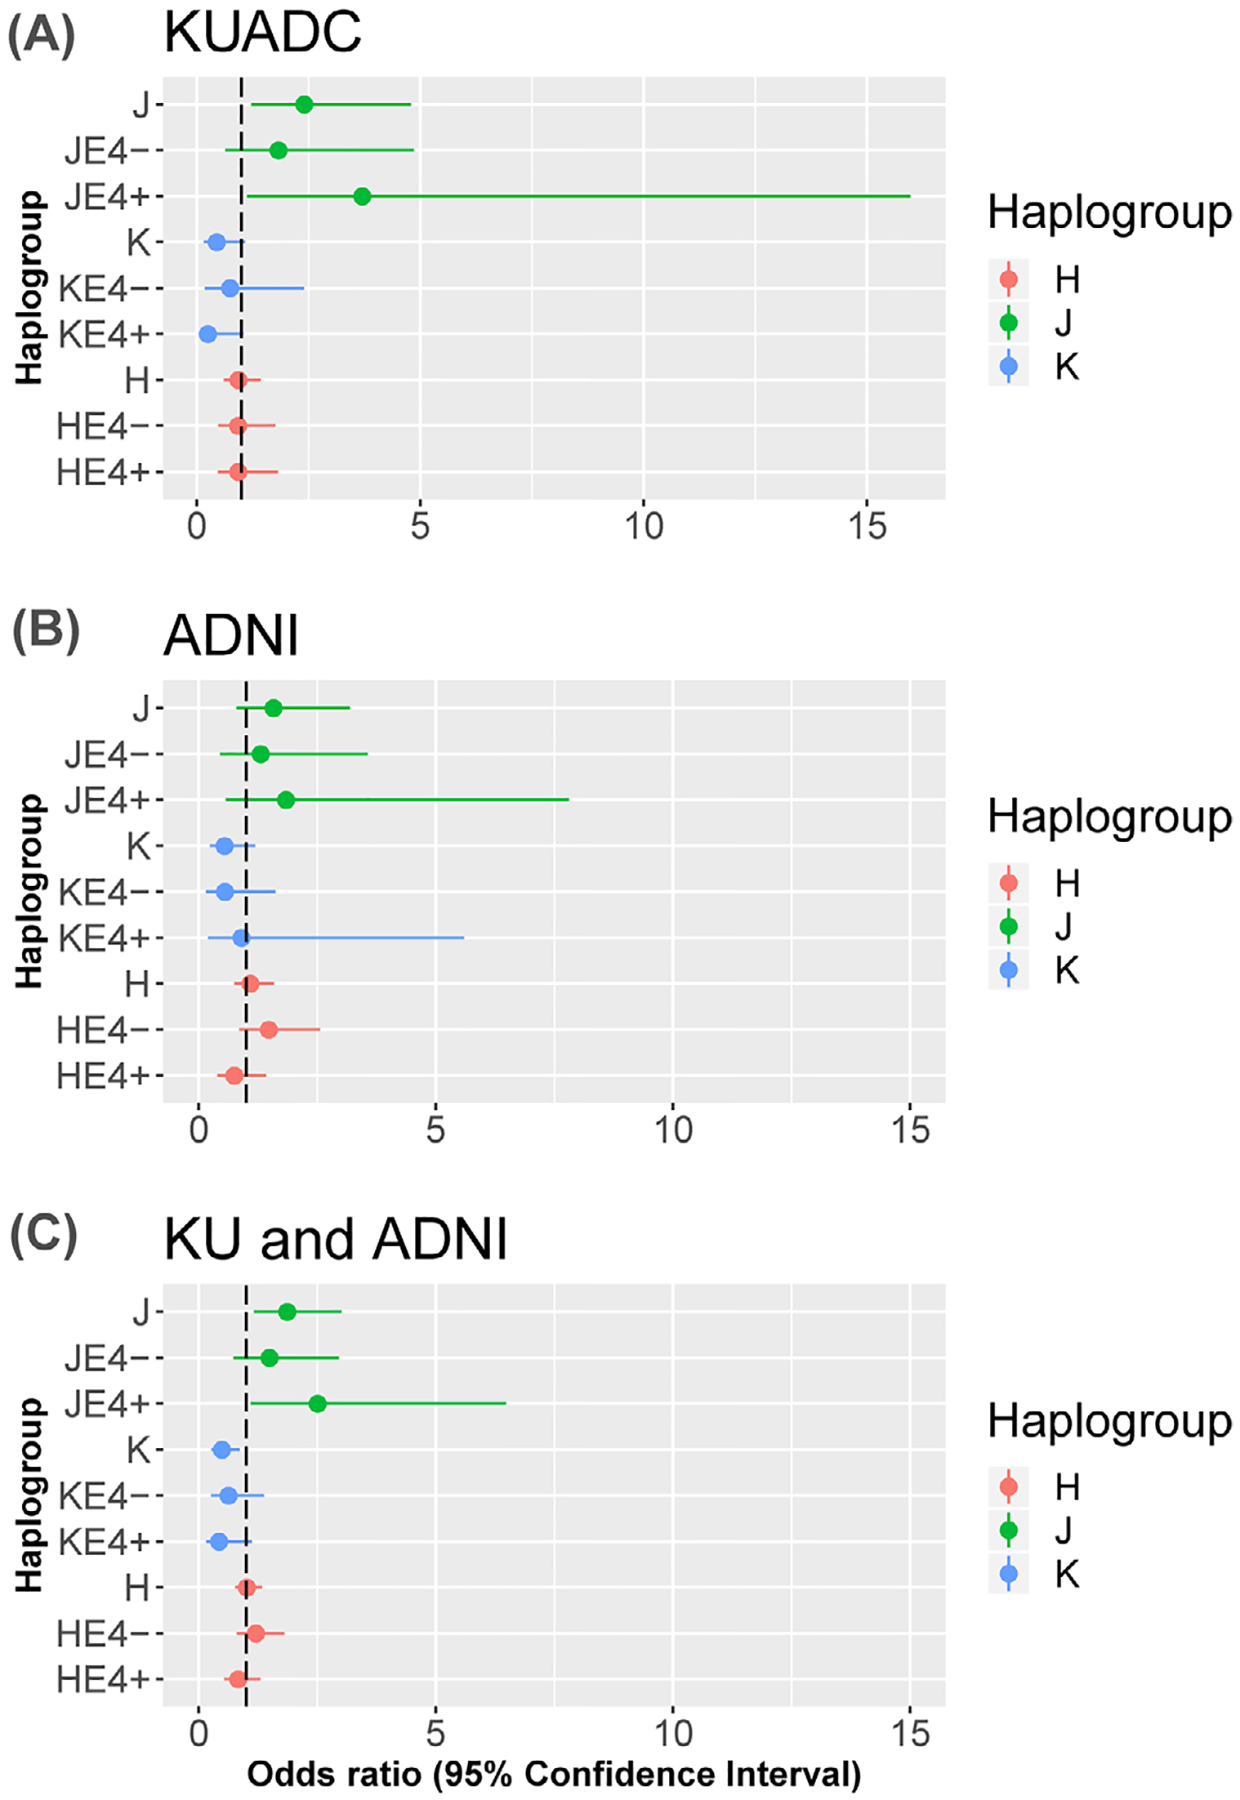
Forest plots showing odds ratios and 95th percent confidence intervals for haplogroups J, K, and H. Values for each entire haplogroup and after sorting by apolipoprotein E (APOE)4 status are provided. A, University of Kansas AD Center (KUADC) cohort. B, Alzheimer’s Disease Neuroimaging Initiative (ADNI) cohort. C, Combined cohort
FIGURE 2.
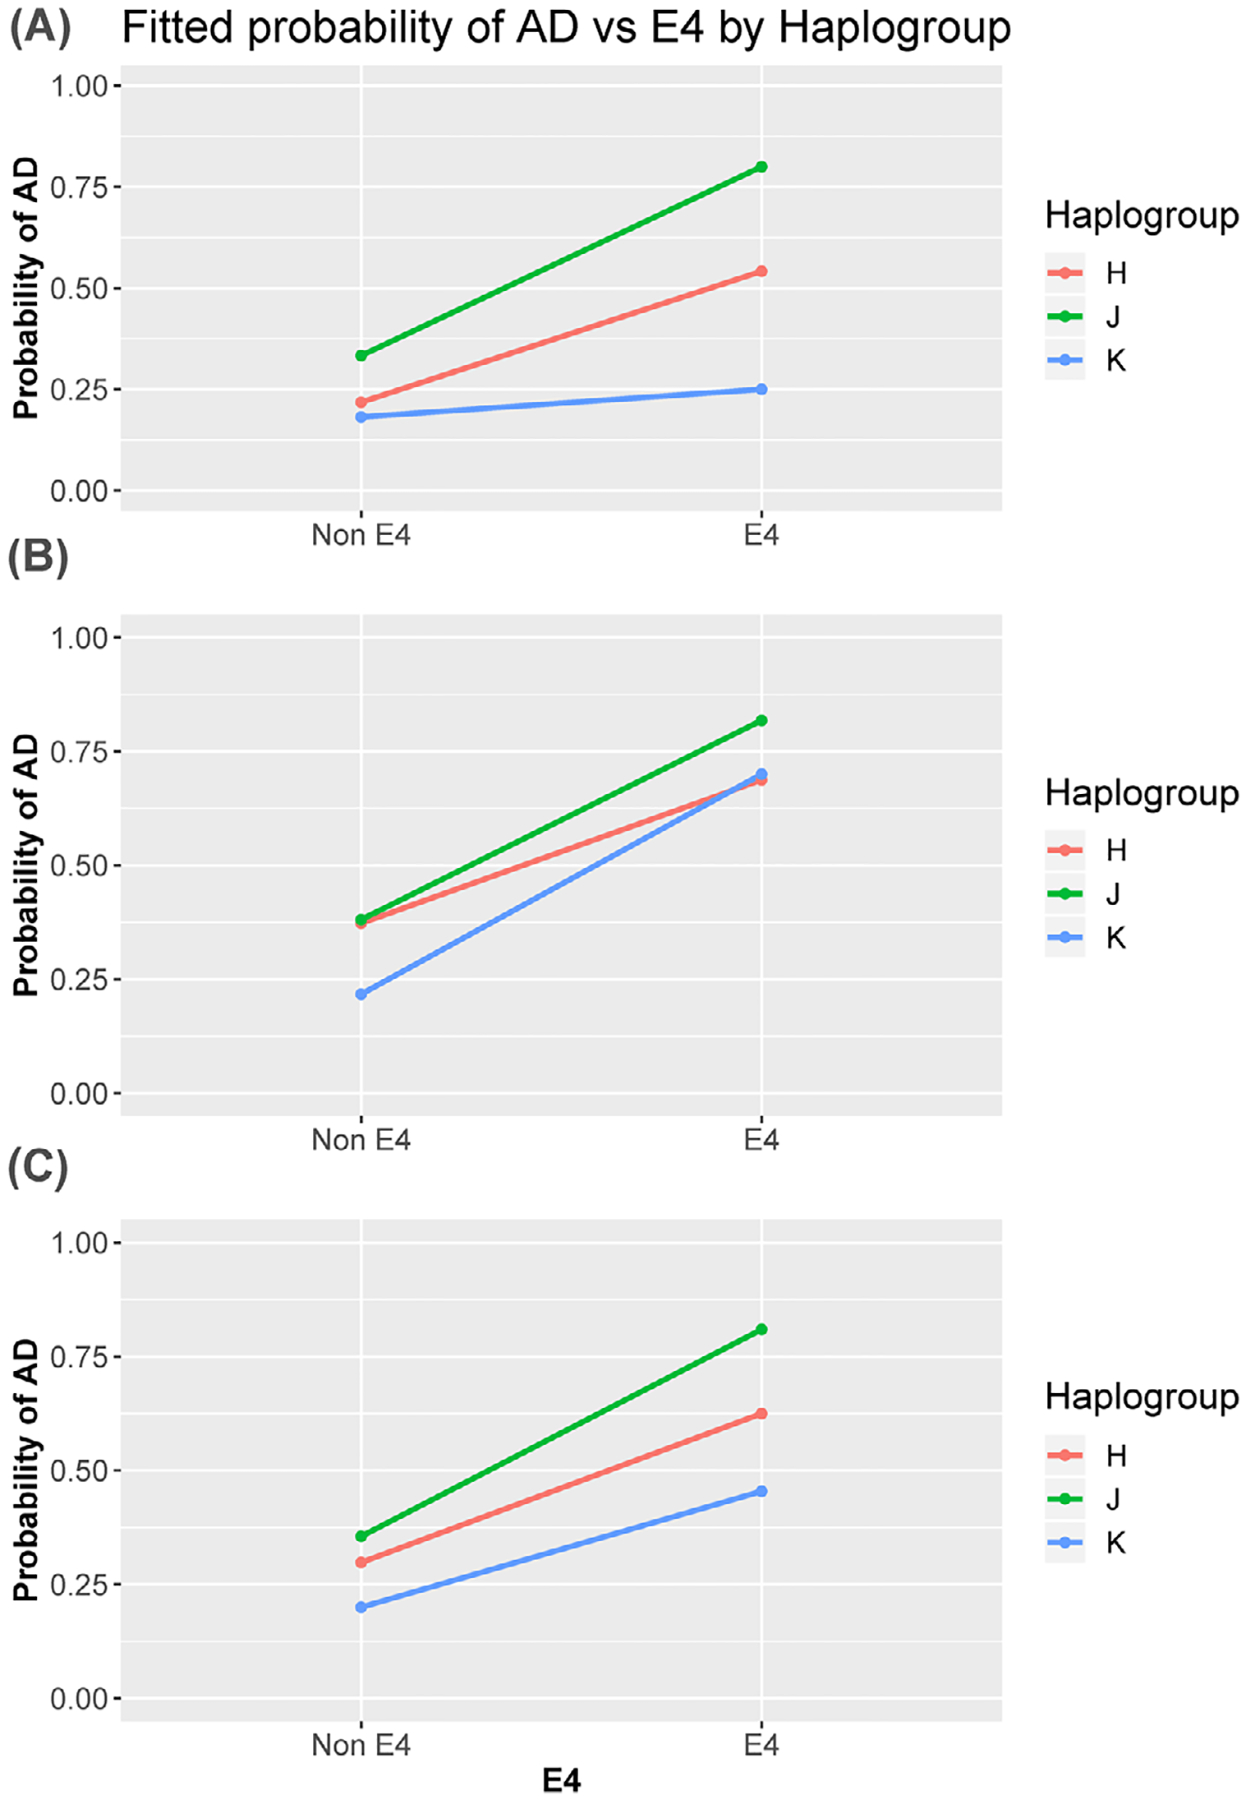
Fitted probability of Alzheimer’s disease versus APOE4 for haplogroups J, K, and H. A, University of Kansas AD Center (KUADC) cohort. B, Alzheimer’s Disease Neuroimaging Initiative (ADNI) cohort. C, Combined cohort
We calculated ORs for different APOE4-haplogroup combinations. In the overall KUADC cohort, the OR associated with having at least one APOE4 allele was 4.21. For those with an APOE4-haplogroup J combination, the OR increased to 7.57. For those with an APOE4 allele and haplogroup K combination the OR decreased to 1.48. In the combination KUADC/ADNI cohort, the OR associated with having at least one APOE4 was 4.79. For those with an APOE4-haplogroup J combination, the OR increased to 7.70, and for those with an APOE4-haplogroup K combination the OR decreased to 3.27.
To mimic a cross-sectional study, we analyzed the KUADC, ADNI, and combined datasets according to initial diagnosis (Table 4). This reduced the number of AD subjects, especially in the ADNI cohort. In the KUADC cohort haplogroup J did not significantly increase AD risk, although a trend was present (P = .066), and haplogroup K did not decrease risk (P = .318). In ADNI, haplogroup J was significantly over-represented in the AD subjects (P = .020). Once again, haplogroup K was not differentially represented (P = .999). In the combined KUADC/ADNI cohort at initial diagnosis, we observed a significant increase in the AD haplogroup J frequency (P = .003), but not a significant decrease in the AD haplogroup K frequency (P = .424).
TABLE 4.
Initial diagnosis-determined haplogroup distributions in the KUADC, ADNI, and combined cohorts
| KUADC | ADNI | Combined | ||||
|---|---|---|---|---|---|---|
| AD (n = 118) | CN (n = 259) | AD (n = 47) | CN (n = 280) | AD (n = 165) | CN (n = 539) | |
| Haplogroup H | 47 (39.8%) | 120 (46.3%) | 19 (40.4%) | 130 (46.4%) | 66 (40.0%) | 250 (46.4%) |
| Haplogroup I | 4 (3.4%) | 5 (1.9%) | 0 (0.0%) | 12 (4.3%) | 4 (2.4%) | 17 (3.2%) |
| Haplogroup J | 17 (14.4%) | 21 (8.1%) | 8 (17.0%) | 18 (6.4%)* | 25 (15.2%) | 39 (7.2%)* |
| Haplogroup K | 7 (5.9%) | 24 (9.3%) | 4 (8.5%) | 24 (8.6%) | 11 (6.7%) | 48 (8.9%) |
| Haplogroup L | 10 (8.5%) | 18 (6.9%) | 0 (0.0%) | 16 (5.8%) | 10 (6.1%) | 34 (6.3%) |
| Haplogroup T | 11 (9.3%) | 23 (8.9%) | 4 (8.5%) | 25 (8.9%) | 15 (9.1%) | 48 (8.9%) |
| Haplogroup U | 17 (14.4%) | 26 (10.0%) | 7 (14.9%) | 31 (11.1%) | 24 (14.6%) | 57 (10.6%) |
| Haplogroup V | 0 (0.0%) | 7 (2.7%) | 1 (2.1%) | 9 (3.2%) | 1 (0.6%) | 16 (2.9%) |
| Others | 5 (4.2%) | 15 (5.8%) | 4 (8.5%) | 15 (5.4%) | 9 (5.5%) | 30 (5.6%) |
Abbreviations: AD, Alzheimer’s disease; ADNI, Alzheimer’s Disease Neuroimaging Initiative; CN, cognitively normal; KUADC, University of Kansas AD Center.
P < .05 between AD and CN frequencies.
4 |. DISCUSSION
An exploratory analysis of current data from the KUADC clinical cohort, performed using the most recent or final diagnosis to categorize group status, found the AD haplogroup J frequency exceeded the CN haplogroup J frequency. A similar exploratory analysis of the ADNI clinical cohort, performed using the most recent publicly available diagnosis, revealed a trend in that direction and when baseline diagnostic assignments were used haplogroup J frequency was also higher in AD participants. Combined analysis of both cohorts finds haplogroup J frequency is significantly higher in those with AD. While haplogroup K frequencies are comparable between AD and CN participants in the KUADC and ADNI cohorts, in both cohorts the haplogroup K frequency trends lower in AD and combined analysis finds the AD haplogroup K frequency is significantly lower in AD participants. These findings suggest inherited mtDNA variants influence AD risk.
A common genetic association strategy is to screen a population or group, detect associations, and test for replication in another population or group. Replicated findings more likely represent true positives and non-replicated findings false positives. It was important for us to use this approach because the KUADC clinical cohort is adequately powered to detect only very strong effects. Unfortunately, the most appropriate available replication cohort, the ADNI subset that has full mtDNA sequence-derived haplogroup assignments, is also limited in size. This puts us in the position of using one arguably underpowered cohort to replicate results from another arguably underpowered cohort.
Using final diagnosis data both cohorts trended toward reduced AD participant haplogroup K frequencies. Combining cohorts allowed these trends to reach significance, at least at an exploratory or discovery level. Due to the structural and procedural similarities within the KUADC and ADNI mtDNA-sequenced cohorts, we feel it is justified to perform a combined analysis.
The KUADC and ADNI cohorts are convenience-based samples, not community-based samples, and do not reflect the population epidemiology of AD. Recruitment approaches and participant motivations influence convenience sample demographics, and in this case such factors likely contributed to the preponderance of men in the AD group and women in the CN group. As we used all available subjects that met our general inclusion criteria, and neither sorted nor selected subjects beyond those criteria, it is interesting and fortunate that KUADC and ADNI cohort sex distributions matched.
We used the most current diagnosis available within two longitudinal cohorts and based our haplogroups on complete mtDNA sequences, which makes our study unique. This is not, however, the first mtDNA haplogroup association study to report ADNI data. Lakatos et al. used initial diagnosis to identify 170 AD and 188 CN ADNI participants.34 Haplogroup assignments were based on 138 mtDNA positions genotyped through Illumina Human610-Quad BeadChips. The authors combined phylogenetically related haplogroups to create HV, JT, and UK super-haplogroup clusters, which complicates comparisons to our study. Despite this, there was no suggestion of either increased AD haplogroup J or decreased haplogroup K frequency. Andrews et al. recently reported an analysis of 187 AD and 301 CN ADNI participants, using the initial diagnosis and haplogroups determined through a combination of Human610-Quad BeadChips and full next-generation sequencing mtDNA sequences, and saw only a very weak trend toward increased AD haplogroup J frequency and a statistically significant over-representation of haplogroup K in the AD group.38 Ridge et al. recently published haplogroup assignments for 809 ADNI participants with complete mtDNA sequences.37 Participants were clinically characterized by initial diagnosis, which included 191 AD and 279 CN individuals. Although the authors did not test for associations, analyzing the Ridge et al. data using our approach reveals an over-representation of haplogroup J within the AD participants.
Ridge and Kauwe recently reviewed the mtDNA haplogroup-AD association literature and point out the preliminary state of the field.39 Most studies that compare AD to CN at the whole haplogroup level are cross-sectional or consider just an initial diagnosis, include haplogroup assignments based on limited SNVs, and assess cohorts similar in size to our KUADC or combined KUADC/ADNI cohorts. For some studies, the number of participants with haplogroup J or K is too low to meaningfully confirm or refute our findings.33,40 Some individual studies do report a potential protective effect for haplogroup K, at least within the context of an APOE4 allele or in the setting of an elevated nuclear mitochondrial gene polygenic risk score.38,41,42 Others do not, yet still suggest a trend toward haplogroup K protection.30,43 For haplogroup J, one longitudinal study found non-demented, elderly participants with that haplogroup showed a relatively accelerated rate of cognitive decline.44 Two overlapping autopsy-based haplogroup association studies, though, report haplogroup J trends that run counter to our haplogroup J observations.32,45
Wang and Brinton specifically considered the possibility of APOE-mtDNA haplogroup interactions.46 The cohorts we studied were probably only large enough to detect robust additive or epistatic interactions, and data shown in Figures 1 and 2 suggest it is perhaps premature to rule out this possibility. The OR for APOE4-haplogroup J carriers rises higher than that of the general APOE4 OR and approaches the very high OR for this combination seen by Carrieri et al.41 The OR for APOE4-haplogroup K carriers is less than the general APOE4 OR, which reflects the reduced OR for this combination seen by Carrieri et al. and Maruszak et al.41,42
The issue of additive or epistatic interactions between mtDNA haplogroups and APOE is critical because APOE frequencies differ between AD and CN groups. If an mtDNA haplogroup increases AD risk only in the presence of APOE4, in a study with just APOE4 participants as the mtDNA haplogroup pushes individuals into the AD group it pushes them out of the CN group. This sorting causes the haplogroup frequency to simultaneously rise in the AD and fall in the CN group, which accentuates the effect. In a study with no APOE4 participants, no sorting occurs. The haplogroup does not push participants into or out of a group, and the haplogroup frequency neither increases in the AD nor falls in the CN group. Comparing frequencies between an AD group with many APOE4 carriers and a CN group with few APOE4 carriers could obscure a true positive association, because comparing a sorted group to an unsorted group blunts the sorting effect. This similarly applies to situations in which an mtDNA haplogroup counters APOE4 risk. Figure S1 in supporting information graphically demonstrates this concept.
The high frequency of APOE4 carriers in the KUADC and ADNI CN groups may have contributed to our positive findings. In general, the proportion of APOE4 carriers in longitudinal AD-CN cohort studies typically exceeds that of population studies. In the Mancuso et al. haplogroup association study, for instance, only 23% of the AD participants and 8% of the control participants had an APOE4 allele.43 If interactions between APOE and mtDNA haplogroups exist, different APOE frequencies between studies could potentially account for different outcomes.
Gene interactions can implicate molecular pathways or mechanisms. A growing body of work shows APOE influences mitochondrial function and general energy metabolism.47 Several mechanisms could contribute. Cleaved APOE peptides directly interact with mitochondria to affect respiration.9 APOE and mitochondria are integral to lipid homeostasis, which transitively links APOE with mitochondrial function.8 Genetic interaction also implies a common underlying biology. A genuine interaction between APOE and mtDNA genotypes in this case would suggest mitochondria play an important role in AD and support the relevance of an AD mitochondrial hypothesis.48
APOE genotypes may influence the impact of other biological analyses. TOMM40 presents a relevant example. Some studies find the TOMM40 very long allele is advantageous in CN individuals who lack an APOE4 allele, while the TOMM40 short allele is advantageous in individuals with an APOE4 allele.49 As the TOMM40 gene encodes a critical mitochondrial protein, and APOE or its degradation products directly or indirectly influence mitochondrial function,9 adding another gene-determined mitochondrial variable would further complicate this picture.
Using longitudinal cohorts is an arguable strength because this may reduce diagnostic error. With recurring evaluations, longitudinal study CN participants cross over to the AD group, and less frequently AD participants exit that group. Over time a haplogroup that accelerates CN cognitive decline, as Tranah et al. reported happens for haplogroup J,44 can simultaneously enrich within the AD and dilute in the CN group. Another strength of our study is our use of complete mtDNA sequences to assign haplogroups.
Age is a major AD risk and as CN individuals age and manifest cognitive decline they switch to MCI or AD groups. Beyond this, AD is a progressive disorder, and over time investigators may remove non-declining participants from an AD group or objectively declining CN participants from that group. Some participants with cognitive deficits may not initially receive an AD assignment due to the presence of concomitant confounding medical diagnoses. As potentially confounding diagnoses resolve over time, those with persistent cognitive deficits may enter the AD group while those whose cognitive deficits remit may enter the CN group. Conversely, confounding signs or symptoms not present at first can appear and alter group assignment. Biomarker assessments made during a participant’s time in a longitudinal study may influence group assignment, and post-mortem neuropathological evaluations may reveal diagnostic errors.
Our main weakness is small cohort sizes. As previously stated, for the replication part of our study we attempted to verify a positive finding from one putatively underpowered cohort through analysis of another putatively underpowered cohort. We were further unable to independently verify positive findings from the combined cohort. Even though the KUADC and ADNI CN groups both contained a high percentage of APOE4 carriers, the AD group APOE4 frequency still greatly exceeded CN group frequency. Men were over-represented in the AD groups, while women were over-represented in the CN groups. Although our positive findings essentially remained after adjusting for APOE, age, and sex they would not remain significant after correcting for multiple comparisons. For these reasons our study, while useful from a discovery or exploratory perspective, is not definitive.
While bigger studies will ideally clarify the status of mtDNA haplogroup-AD risk associations, preliminary reports from two large consortiums are perhaps contradictory. In 2018, investigators representing the Alzheimer’s Disease Genetics Consortium (ADGC) presented an analysis of 8706 AD and 7002 CN European descendants from five cohorts.50 Haplogroups were assigned using 227 mtDNA SNVs captured by Illumina HumanExome BeadChip v1.0. The frequency of the ND3 A10398G SNV was over-represented in the AD group at P = .0002, and the ND5 G13708A SNV was over-represented in the AD group at P = .0219. While not exclusive to haplogroup J, both are defining haplogroup J SNVs and consistent with KUADC haplogroup J data. On the other hand, in 2019 investigators representing the Alzheimer’s Disease Sequencing Project (ADSP) presented an analysis of 5519 AD and 4917 CN European descendants whose mtDNA sequences were captured through WES, and stated there were no haplogroup associations.51
Screening for individual mtDNA SNVs with real but limited impact requires, after correcting for multiple comparisons, very large datasets. Screening for rare mtDNA variants that robustly influence AD risk also requires large datasets,51 as small datasets will contain insufficient carriers. While haplogroups may help facilitate small group analyses by grouping common variants into limited combinations, it could also combine SNVs that increase AD risk with SNVs that decrease AD risk. Haplogroups also break down into sub-haplogroups that add or remove additional SNVs that, when analyzed together, may cancel out a genuine effect. An innovative approach called Treescanning can reduce the negative impact of intra-haplogroup averaging and help identify truly relevant SNVs but reduces power.39,52 Because it is possible many mtDNA SNVs may independently increase or decrease AD risk, and both common and rare mtDNA SNVs present in highly variable combinations, we suspect an mtDNA polygenic risk score that considers the sum-total of an individual’s mtDNA variants will most accurately capture and reflect mtDNA’s impact on AD risk.
This study informs the AD mitochondrial cascade hypothesis, which proposes that in addition to contributing to or mediating AD neuro-dysfunction, mitochondria to some extent also initiate that dysfunction.48 A major premise is that individuals inherit a baseline level of mitochondrial performance, which can change with advancing age beyond thresholds that trigger AD histopathology, neurodegeneration, and clinical features. The mitochondrial cascade hypothesis predicts genes that affect mitochondrial function, durability, or homeostasis should associate with AD risk. It is particularly open to the possibility that inherited mtDNA variants may influence AD risk. Findings from this exploratory study are consistent with the hypothesis and should encourage further consideration of mtDNA-AD association, while pointing out unique contingencies that could affect study outcomes.
Supplementary Material
HIGHLIGHTS.
For 390 Alzheimer’s disease (AD) and 507 cognitively normal (CN) cases haplogroup J frequencies were 12.8% versus 7.3% (P = .006).
For 390 AD and 507 CN cases haplogroup K frequencies were 4.9% versus 9.5% (P = .010).
These exploratory findings suggest inherited mitochondrial DNA variants influence AD risk.
RESEARCH IN CONTEXT.
Systematic review: This study considers whether inherited mitochondrial (mtDNA) variants influence Alzheimer’s disease (AD) risk. A review of relevant prior mtDNA-AD association studies reveals limited inter-study agreement. The reasons for these inconsistencies are unclear, and the question of whether mtDNA influences AD risk remains unresolved.
Interpretation: The main findings, from two combined longitudinal cohorts with high apolipoprotein E (APOE)4 carrier rates, were the mtDNA haplogroup J frequency was higher in AD than controls while the haplogroup K frequency was lower. This suggests inherited mtDNA variants influence AD risk.
Future directions: The authors point out potential reasons for mtDNA-AD association study inconsistencies. APOE-mtDNA interactions may exist, and if so differences in AD and control APOE distributions would confound comparisons. An individual’s mtDNA combines variants that may increase or decrease risk, so variant pooling may obscure associations. Confirmation of mtDNA’s role in AD may, therefore, require development of an mtDNA polygenic risk score.
ACKNOWLEDGMENTS
This work was supported by National Institute on Aging funding to the University of Kansas Alzheimer’s Disease Center (P30AG035982). This work was also partially supported through UL1 TR002366. Data collection and sharing for this project was funded by the Alzheimer’s Disease Neuroimaging Initiative (ADNI; National Institutes of Health Grant U01 AG024904) and DOD ADNI (Department of Defense award number W81XWH-12-2-0012). ADNI is funded by the National Institute on Aging, the National Institute of Biomedical Imaging and Bioengineering, and through generous contributions from the following: AbbVie, Alzheimer’s Association; Alzheimer’s Drug Discovery Foundation; Araclon Biotech; BioClinica, Inc.; Biogen; Bristol-Myers Squibb Company; CereSpir, Inc.; Cogstate; Eisai Inc.; Elan Pharmaceuticals, Inc.; Eli Lilly and Company; EuroImmun; F. Hoffmann-La Roche Ltd and its affiliated company Genentech, Inc.; Fujirebio; GE Healthcare; IXICO Ltd.; Janssen Alzheimer Immunotherapy Research & Development, LLC; Johnson & Johnson Pharmaceutical Research & Development LLC; Lumosity; Lundbeck; Merck & Co., Inc.; Meso Scale Diagnostics, LLC.; NeuroRx Research; Neurotrack Technologies; Novartis Pharmaceuticals Corporation; Pfizer Inc.; Piramal Imaging; Servier; Takeda Pharmaceutical Company; and Transition Therapeutics. The Canadian Institutes of Health Research is providing funds to support ADNI clinical sites in Canada. Private sector contributions are facilitated by the Foundation for the National Institutes of Health (www.fnih.org). The grantee organization is the Northern California Institute for Research and Education, and the study is coordinated by the Alzheimer’s Therapeutic Research Institute at the University of Southern California. ADNI data are disseminated by the Laboratory for Neuro Imaging at the University of Southern California.
Footnotes
CONFLICTS OF INTEREST
The authors report no conflicts of interest.
SUPPORTING INFORMATION
Additional supporting information may be found online in the Supporting Information section at the end of the article.
REFERENCES
- 1.Swerdlow RH. Is aging part of Alzheimer’s disease, or is Alzheimer’s disease part of aging? Neurobiol Aging. 2007;28:1465–180. [DOI] [PubMed] [Google Scholar]
- 2.Del-Aguila JL, Koboldt DC, Black K, et al. Alzheimer’s disease: rare variants with large effect sizes. Curr Opin Genet Dev. 2015;33:49–55. [DOI] [PubMed] [Google Scholar]
- 3.Karch CM, Goate AM. Alzheimer’s disease risk genes and mechanisms of disease pathogenesis. Biol Psychiatry. 2015;77:43–51. [DOI] [PMC free article] [PubMed] [Google Scholar]
- 4.Jonsson T, Stefansson H, Steinberg S, et al. Variant of TREM2 associated with the risk of Alzheimer’s disease. N Engl J Med. 2013;368:107–116. [DOI] [PMC free article] [PubMed] [Google Scholar]
- 5.Guerreiro R, Wojtas A, Bras J, et al. TREM2 variants in Alzheimer’s disease. N Engl J Med. 2013;368:117–127. [DOI] [PMC free article] [PubMed] [Google Scholar]
- 6.Cruchaga C, Karch CM, Jin SC, et al. Rare coding variants in the phospholipase D3 gene confer risk for Alzheimer’s disease. Nature. 2014;505:550–554. [DOI] [PMC free article] [PubMed] [Google Scholar]
- 7.Kunkle BW, Grenier-Boley B, Sims R, et al. Genetic meta-analysis of diagnosed Alzheimer’s disease identifies new risk loci and implicates Abeta, tau, immunity and lipid processing. Nat Genet. 2019;51:414–430. [DOI] [PMC free article] [PubMed] [Google Scholar]
- 8.Pa J, Andrews SJ, Swerdlow RH. Mitochondria and Alzheimer’s: is PTCD1 the smoking gun?. Trends Neurosci. 2019;42:759–762. [DOI] [PMC free article] [PubMed] [Google Scholar]
- 9.Chang S, ran Ma T, Miranda RD, Balestra ME, Mahley RW, Huang Y. Lipid- and receptor-binding regions of apolipoprotein E4 fragments act in concert to cause mitochondrial dysfunction and neurotoxicity. Proc Natl Assoc Sci. 2005;102:18694–18699. [DOI] [PMC free article] [PubMed] [Google Scholar]
- 10.Fleck D, Phu L, Verschueren E, et al. PTCD1 is required for mitochondrial oxidative-phosphorylation: possible genetic association with Alzheimer’s DISEASE. J Neurosci. 2019;39:4636–4656. [DOI] [PMC free article] [PubMed] [Google Scholar]
- 11.Shoffner JM, Brown MD, Torroni A, et al. Mitochondrial DNA variants observed in Alzheimer disease and Parkinson disease patients. Genomics. 1993;17:171–184. [DOI] [PubMed] [Google Scholar]
- 12.Wallace DC. Mitochondrial genetics: a paradigm for aging and degenerative diseases? Science. 1992;256:628–632. [DOI] [PubMed] [Google Scholar]
- 13.Edland SD, Silverman JM, Peskind ER, Tsuang D, Wijsman E, Morris JC. Increased risk of dementia in mothers of Alzheimer’s disease cases: evidence for maternal inheritance. Neurology. 1996;47:254–256. [DOI] [PubMed] [Google Scholar]
- 14.Mosconi L, Brys M, Switalski R, et al. Maternal family history of Alzheimer’s disease predisposes to reduced brain glucose metabolism. Proc Natl Assoc Sci. 2007;104:19067–10672. [DOI] [PMC free article] [PubMed] [Google Scholar]
- 15.Mosconi L, de Leon M, Murray J, et al. Reduced mitochondria cytochrome oxidase activity in adult children of mothers with Alzheimer’s disease. J Alzheimers Dis. 2011;27:483–490. [DOI] [PMC free article] [PubMed] [Google Scholar]
- 16.Mosconi L, Rinne JO, Tsui WH, et al. Increased fibrillar amyloid-{beta} burden in normal individuals with a family history of late-onset Alzheimer’s. Proc Natl Assoc Sci. 2010;107:5949–5954. [DOI] [PMC free article] [PubMed] [Google Scholar]
- 17.Honea RA, Swerdlow RH, Vidoni ED, Goodwin J, Burns JM. Reduced gray matter volume in normal adults with a maternal family history of Alzheimer disease. Neurology. 2010;74:113–120. [DOI] [PMC free article] [PubMed] [Google Scholar]
- 18.Debette S, Wolf PA, Beiser A, et al. Association of parental dementia with cognitive and brain MRI measures in middle-aged adults. Neurology. 2009;73:2071–2078. [DOI] [PMC free article] [PubMed] [Google Scholar]
- 19.Parker WD Jr., Filley CM, Parks JK. Cytochrome oxidase deficiency in Alzheimer’s disease. Neurology. 1990;40:1302–1303. [DOI] [PubMed] [Google Scholar]
- 20.Curti D, Rognoni F, Gasparini L, et al. Oxidative metabolism in cultured fibroblasts derived from sporadic Alzheimer’s disease (AD) patients. Neurosci Lett. 1997;236:13–6. [DOI] [PubMed] [Google Scholar]
- 21.Swerdlow RH, Parks JK, Cassarino DS, et al. Cybrids in Alzheimer’s disease: a cellular model of the disease? Neurology. 1997;49:918–925. [DOI] [PubMed] [Google Scholar]
- 22.Brown MD, Shoffner JM, Kim YL, et al. Mitochondrial DNA sequence analysis of four Alzheimer’s and Parkinson’s disease patients. Am J Med Genet. 1996;61:283–289. [DOI] [PubMed] [Google Scholar]
- 23.Lin FH, Lin R, Wisniewski HM, et al. Detection of point mutations in codon 331 of mitochondrial NADH dehydrogenase subunit 2 in Alzheimer’s brains. Biochem Biophys Res Commun. 1992;182:238–246. [DOI] [PubMed] [Google Scholar]
- 24.Hutchin T, Cortopassi G. A mitochondrial DNA clone is associated with increased risk for Alzheimer disease. Proc Natl Assoc Sci. 1995;92:6892–6895. [DOI] [PMC free article] [PubMed] [Google Scholar]
- 25.Petruzzella V, Chen X, Schon EA. Is a point mutation in the mitochondrial ND2 gene associated with Alzheimer’s disease. Biochem Biophys Res Commun. 1992;186:491–497. [DOI] [PubMed] [Google Scholar]
- 26.Tanaka N, Goto Y, Akanuma J, et al. Mitochondrial DNA variants in a Japanese population of patients with Alzheimer’s disease. Mitochondrion. 2010;10:32–37. [DOI] [PubMed] [Google Scholar]
- 27.Coskun PE, Beal MF, Wallace DC. Alzheimer’s brains harbor somatic mtDNA control-region mutations that suppress mitochondrial transcription and replication. Proc Natl Assoc Sci. 2004;101:10726–10731. [DOI] [PMC free article] [PubMed] [Google Scholar]
- 28.Hoekstra JG, Hipp MJ, Montine TJ, Kennedy SR. Mitochondrial DNA mutations increase in early stage Alzheimer disease and are inconsistent with oxidative damage. Ann Neurol. 2016;80:301–306. [DOI] [PMC free article] [PubMed] [Google Scholar]
- 29.Torroni A, Huoponen K, Francalacci P, et al. Classification of European mtDNAs from an analysis of three European populations. Genetics. 1996;144:1835–1850. [DOI] [PMC free article] [PubMed] [Google Scholar]
- 30.van der Walt JM, Dementieva YA, Martin ER, et al. Analysis of European mitochondrial haplogroups with Alzheimer disease risk. Neurosci Lett. 2004;365:28–32. [DOI] [PubMed] [Google Scholar]
- 31.Maruszak A, Canter JA, Styczynska M, Zekanowski C, Barcikowska M. Mitochondrial haplogroup H and Alzheimer’s disease—is there a connection? Neurobiol Aging. 2009;30:1749–1755. [DOI] [PubMed] [Google Scholar]
- 32.Chinnery PF, Taylor GA, Howell N, et al. Mitochondrial DNA haplogroups and susceptibility to AD and dementia with Lewy bodies. Neurology. 2000;55:302–304. [DOI] [PubMed] [Google Scholar]
- 33.Fesahat F, Houshmand M, Panahi MS, Gharagozli K, Mirzajani F. Do haplogroups H and U act to increase the penetrance of Alzheimer’s disease? Cell Mol Neurobiol. 2007;27:329–334. [DOI] [PubMed] [Google Scholar]
- 34.Lakatos A, Derbeneva O, Younes D, et al. Association between mitochondrial DNA variations and Alzheimer’s disease in the ADNI cohort. Neurobiol Aging. 2010;31:1355–1363. [DOI] [PMC free article] [PubMed] [Google Scholar]
- 35.Santoro A, Balbi V, Balducci E, et al. Evidence for sub-haplogroup h5 of mitochondrial DNA as a risk factor for late onset Alzheimer’s disease. PLoS One. 2010;5:e12037. [DOI] [PMC free article] [PubMed] [Google Scholar]
- 36.McKhann GM, Knopman DS, Chertkow H, et al. The diagnosis of dementia due to Alzheimer’s disease: Recommendations from the National Institute on Aging-Alzheimer’s Association workgroups on diagnostic guidelines for Alzheimer’s disease. Alzheimers Dement. 2011;7:263–269. [DOI] [PMC free article] [PubMed] [Google Scholar]
- 37.Ridge PG, Wadsworth ME, Miller JB, Saykin AJ, Green RC, Kauwe JSK. Assembly of 809 whole mitochondrial genomes with clinical, imaging, and fluid biomarker phenotyping. Alzheimers Dement. 2018;14:514–519. [DOI] [PMC free article] [PubMed] [Google Scholar]
- 38.Andrews SJ, Fulton-Howard B, Patterson C, et al. Mitonuclear interactions influence Alzheimer’s disease risk. Neurobiol Aging. 2020;87:138.e7–138.e14. [DOI] [PMC free article] [PubMed] [Google Scholar]
- 39.Ridge PG, Kauwe JSK. Mitochondria and Alzheimer’s disease: the role of mitochondrial genetic variation. Curr Genet Med Rep. 2018;6:1–10. [DOI] [PMC free article] [PubMed] [Google Scholar]
- 40.Kruger J, Hinttala R, Majamaa K, Remes AM. Mitochondrial DNA haplogroups in early-onset Alzheimer’s disease and frontotemporal lobar degeneration. Mol Neurodegener. 2010;5:8. [DOI] [PMC free article] [PubMed] [Google Scholar]
- 41.Carrieri G, Bonafe M, De Luca M, et al. Mitochondrial DNA haplogroups and APOE4 allele are non-independent variables in sporadic Alzheimer’s disease. Hum Genet. 2001;108:194–198. [DOI] [PubMed] [Google Scholar]
- 42.Maruszak A, Safranow K, Branicki W, et al. The impact of mitochondrial and nuclear DNA variants on late-onset Alzheimer’s disease risk. J Alzheimers Dis. 2011;27:197–210. [DOI] [PubMed] [Google Scholar]
- 43.Mancuso M, Nardini M, Micheli D, et al. Lack of association between mtDNA haplogroups and Alzheimer’s disease in Tuscany. Neurol Sci. 2007;28:142–147. [DOI] [PubMed] [Google Scholar]
- 44.Tranah GJ, Nalls MA, Katzman SM, et al. Mitochondrial DNA sequence variation associated with dementia and cognitive function in the elderly. J Alzheimers Dis. 2012;32:357–372. [DOI] [PMC free article] [PubMed] [Google Scholar]
- 45.Elson JL, Herrnstadt C, Preston G, et al. Does the mitochondrial genome play a role in the etiology of Alzheimer’s disease? Hum Genet. 2006;119:241–254. [DOI] [PubMed] [Google Scholar]
- 46.Wang Y, Brinton RD. Triad of risk for late onset Alzheimer’s: mitochondrial haplotype, APOE genotype and chromosomal sex. Front Aging Neurosci. 2016;8:232. [DOI] [PMC free article] [PubMed] [Google Scholar]
- 47.Zhao N, Liu CC, Qiao W, Bu G. Apolipoprotein E, receptors, and modulation of Alzheimer’s disease. Biol Psychiatry. 2018;83:347–357. [DOI] [PMC free article] [PubMed] [Google Scholar]
- 48.Swerdlow RH, Burns JM, Khan SM. The Alzheimer’s disease mitochondrial cascade hypothesis: progress and perspectives. Biochim Biophys Acta. 2014;1842:1219–1231. [DOI] [PMC free article] [PubMed] [Google Scholar]
- 49.Chiba-Falek O, Gottschalk WK, Lutz MW. The effects of the TOMM40 poly-T alleles on Alzheimer’s disease phenotypes. Alzheimers Dement. 2018;14:692–698. [DOI] [PMC free article] [PubMed] [Google Scholar]
- 50.Zhang X, Zhou TJ, Farrell JJ, et al. Identification of mitochondrial variants associated with late-onset Alzheimer’s disease. Alzheimers Dement 2018;14(7):P1108–P1109. AAIC. [Google Scholar]
- 51.Zhang X, Farrell J, Zhu C, et al. Mitochondrial variants and haplogroups associated with late-onset Alzheimer’s disease identified by whole exome sequencing. Alzheimers Dement. 2019;15(7):P565. AAIC. [DOI] [PMC free article] [PubMed] [Google Scholar]
- 52.Ridge PG, Koop A, Maxwell TJ, Bet al. Mitochondrial haplotypes associated with biomarkers for Alzheimer’s disease. PLoS One. 2013;8:e74158. [DOI] [PMC free article] [PubMed] [Google Scholar]
Associated Data
This section collects any data citations, data availability statements, or supplementary materials included in this article.