

Abstract
Background
In recent years, longitudinal studies of Alzheimer's disease (AD) have been successively concluded. Our aim is to determine the efficacy of amyloid‐β (Aβ) PET in diagnosing AD and early prediction of mild cognitive impairment (MCI) converting to AD. By pooling studies from different centers to explore in‐depth whether diagnostic performance varies by population type, radiotracer type, and diagnostic approach, thus providing a more comprehensive theoretical basis for the subsequent widespread application of Aβ PET in the clinical setting.
Methods
Relevant studies were searched through PubMed. The pooled sensitivities, specificities, DOR, and the summary ROC curve were obtained based on a Bayesian random‐effects model.
Results
Forty‐eight studies, including 5967 patients, were included. Overall, the pooled sensitivity, specificity, DOR, and AUC of Aβ PET for diagnosing AD were 0.90, 0.80, 35.68, and 0.91, respectively. Subgroup analysis showed that Aβ PET had high sensitivity (0.91) and specificity (0.81) for differentiating AD from normal controls but very poor specificity (0.49) for determining AD from MCI. The pooled sensitivity and specificity were 0.84 and 0.62, respectively, for predicting the conversion of MCI to AD. The differences in diagnostic efficacy between visual assessment and quantitative analysis and between 11C‐PIB PET and 18F‐florbetapir PET were insignificant.
Conclusions
The overall performance of Aβ PET in diagnosing AD is favorable, but the differentiation between MCI and AD patients should consider that some MCI may be at risk of conversion to AD and may be misdiagnosed. A multimodal diagnostic approach and machine learning analysis may be effective in improving diagnostic accuracy.
Keywords: 11C‐PIB, 18F‐florbetapir, Alzheimer's disease, amyloid‐β PET, MCI converting to AD

1. INTRODUCTION
Alzheimer's disease (AD) is the most common type of dementia. The prevailing AD pathogenesis hypothesis suggests that AD is mainly due to the accumulation of insoluble amyloid‐β (Aβ) deposits and neurofibrillary tangles induced by highly phosphorylated tau (p‐τ) proteins in the neocortex, hippocampus, and amygdala, accompanied by massive loss of neurons and synapses leading to brain atrophy (Duyckaerts et al., 2009; Markesbery, 1997; Mirra et al., 1991). Recent epidemiological surveys of AD patients in the United States show that about 6.2 million people over the age of 65 will suffer from AD in 2021. Frighteningly, the number of people with AD is expected to increase significantly to 13.8 million by 2060 as the population ages and if there are no effective prevention and treatment methods (Alzheimer's Association, 2021). AD is now regarded as a chronic disease, which brings great emotional and economic burdens to individuals, families, and society, and is receiving increasing attention from the medical community. Early and accurate diagnosis, effective prevention, and treatment of AD are the most sought‐after challenges to overcome.
Cognitive decline and the deposition of Aβ plaques in AD are progressive and evolving, whereas Aβ deposition mostly occurs before symptoms; therefore, early AD may present as a preclinical stage of normal cognition or mild cognitive impairment (MCI). MCI is a state between normal cognition and dementia. Not all MCI progresses to AD or dementia, and even after 10 years, a significant proportion of these patients remain stable or even return to normal cognition during follow‐up. It has been shown that approximately 6%–16.5% of MCI patients convert to AD each year (Bruscoli & Lovestone, 2004; Ward et al., 2013). Identifying patients with MCI who will develop AD is key to preventing its onset and progression and treating it early.
The gold standard for diagnosing AD is brain tissue pathology, usually an autopsy of the brain performed after the patient's death. However, performing brain biopsies on living patients to determine if they have AD is not ethically supported and can lead to brain tissue damage and more severe cognitive impairment. Brain biopsy is often replaced by mental status examinations and neuropsychological testing batteries in clinical practice. NINCDS‐ADRDA and DSM‐IV are commonly used clinical diagnostic criteria, with an approximate accuracy range of 65%–96% (Dubois et al., 2007; Mckhann et al.,1984; Alzheimer's Association, 2021). Results from some AD autopsies have shown that the clinical diagnosis of AD has a positive predictive value of 0.91 for eventual pathologically definitive AD (Chui & Lee, 2003). More than 30 years ago, it was proposed that cognitive decline in AD is associated with histopathological changes in the hippocampus, of which hippocampal atrophy is often considered an early feature of the degeneration of consciousness in AD patients (Ball et al., 1985). Visual assessment of hippocampal atrophy has approximately 80%–85% sensitivity and specificity for AD diagnosis. In addition, several studies have predicted the progression of MCI to AD by measuring hippocampal volume on MRI images or by assessing the degree of brain atrophy, but all have shown poor results (Frisoni et al., 2010; Yuan et al., 2009). 18F‐FDG PET has been used for more than two decades as an aid in diagnosing AD, characterized by hypo‐glucose metabolism in the temporoparietal and posterior cingulate regions (Herholz et al., 2002). Decreased glucose metabolism in the brain occurs before macroscopic brain atrophy is observed; thus, 18F‐FDG PET is thought to have the potential to detect early neurodegenerative changes earlier and more sensitively than MRI (Kljajevic et al., 2014). Multicenter studies have shown that 18F‐FDG PET can correctly classify 95% of AD patients but has average efficacy in predicting the conversion of MCI to AD (Shaffer et al., 2013). Regardless, the brain metabolic rate revealed by 18F‐FDG PET emphasizes the degree of neuronal activity and does not elucidate the underlying pathogenic neuropathological changes.
In contrast, the radiotracers indicating Aβ loading, p‐τ protein aggregation, and neuroinflammation are more likely to directly respond to the pathological status of patients with AD and MCI converting to AD (cMCI) (Chandra et al., 2019). Aβ‐specific PET has been used clinically, whereas radionuclides specific to p‐τ protein and neuroinflammation have not been recommended for clinical application. A strong correlation between 11C‐PIB retention in the brain and pathology (neuroinflammatory plaques and vascular amyloid) at autopsy has been reported early on (Ikonomovic et al., 2008). In recent years, the most commonly used Aβ tracer is 11C‐PIB, which can differentiate between mild AD and healthy controls (Chandra et al., 2019). By determining the retention of 11C‐PIB in the frontal, temporal, and cingulate cortices, predicting the conversion of MCI to AD can also be easily done (Brück et al., 2013). On the other hand, the degree of gray matter atrophy, regional brain glucose metabolic rate, and Aβ deposition differed between MCI converting to AD (cMCI) and stable MCI (sMCI). During the gradual progression of MCI to AD, Aβ deposition precedes gray matter atrophy and decreased brain glucose metabolism (Jack et al., 2013; Ly et al., 2010). The utilization of 11C‐PIB in cyclotron‐free clinical centers is limited by its short half‐life, including the difficulty of transport, storage, and substantial waste of resources. Therefore, novel 18F‐labeled amyloid tracers 18F‐florbetapir, 18F‐florbetaben, and 18F‐flutemetamol (18F‐FMM) could overcome the abovementioned nontechnical limitations. 18F‐FMM is a derivative of 11C‐PIB, which has similar biological properties to 11C‐PIB and has essentially the same uptake in the cerebral cortex (Nelissen et al., 2009; Vandenberghe et al., 2010). 18F‐florbetapir (18F‐AV45) was approved by the FDA in 2011 as a radiotracer to aid in diagnosing AD (Yang et al., 2012). Based on a preliminary literature search, most research on brain Aβ PET is concentrated in developed countries, whereas clinical centers in developing countries have applied Aβ PET less frequently or are still in experimental research phase. Our study comprehensively assesses the diagnostic performance of Aβ PET by pooling a considerable number of reliable studies and explores the overall trends in the performance of Aβ PET in AD over the past decade.
2. MATERIALS AND METHODS
We conducted this systematic review and meta‐analysis in strict compliance with the Preferred Reporting Items for Systematic Reviews and Meta‐analysis (PRISMA) 2020 statement (Page et al., 2021). The steps for an inclusion of the literature were performed according to the 2020 PRISMA flow diagram. The methodological quality evaluation of our included literature was performed by referring to the Cochrane Handbook for Systematic Reviews of Diagnostic Test Accuracy and the entries of Quality Assessment of Diagnostic Accuracy Studies‐2 (QUADAS‐2) (Deeks et al., 2021; Whiting, 2011).
2.1. Search strategy and study selection
We searched all the literature on Aβ PET for AD diagnosis in the PubMed database with a deadline of January 1, 2022. The main terms we used for the search were as follows: Amyloid PET or 11C‐PIB or 18F‐AV45 PET and AD. Our inclusion criteria for the study were as follows: Aβ PET for diagnosing AD or MCI progression to AD, PET as a tool for diagnosis. Exclusion criteria were as follows: reviews, case reports, commentaries, and editorials; the number of cases less than 5; inability to extract diagnostic data; inaccurate diagnostic data extracted from the study; and presence of other systemic or brain diseases. We excluded a portion of the literature by gradually adding conditional filters based on the exclusion criteria. Then, we further excluded a portion of the literature by reading the title, abstract, and full text.
2.2. Data selection and quality assessment
The information we extracted for the literature was finally included in our meta‐analysis, including general information about the studies, patient characteristics, main study objectives, type of radiotracer, diagnostic approach, and reference standard. In addition, we extracted information about patient selection, diagnostic approach, and reference standard in each study according to the evaluation entries of QUADAS‐2. For the assessment of patient selection, if case control, we considered that these studies introduced a high risk of bias. For unblinded studies or studies that did not mention whether they were blinded to clinical information, we combined the diagnostic approach and the way the threshold was set to determine whether there was a risk of bias in the index test. In assessing the reference standard, we classified all unblinded studies as unclear risks. For some articles, the primary study objective of which was not to diagnose AD with PET, we evaluated them as unclear risk in the patient selection and study flow.
The two authors worked together to extract diagnostic data and study‐related characteristic information and independently assess the methodological quality of the studies, and any disagreements were resolved through discussion.
2.3. Statistical analysis
There may be substantial heterogeneity between studies as we included studies with different diagnostic methods and diagnostic thresholds. We performed a meta‐analysis using the Bayesian bivariate analysis based on the integrated nested Laplace approximation method, which fully considered the heterogeneity among studies and the interrelatedness and interplay of sensitivity and specificity. The analysis software we used was R (R for Windows, version 4.1.0). We calculated the pooled sensitivity, specificity, DOR, and 95% confidence interval, respectively, and fitted the summary ROC curve based on the binomial–normal model. Finally, a funnel plot was plotted to assess publication bias and heterogeneity.
3. RESULTS
3.1. Literature search and study characteristics
First, 1806 publications were retrieved without adding any conditional filters. Two hundred eighty‐seven articles were excluded through the filter at the official PubMed website, and 1420 articles were further excluded by reading the titles and abstracts. After carefully reading the full text and supplementary materials and judging the accuracy and reliability of the extracted data, the final number of articles included in our study was 48 (Beach et al., 2014; Brück et al., 2013; Camus et al., 2012; Clark et al., 2012; Fleisher, 2011; Hatashita & Yamasaki, 2013; Hatashita et al., 2014; Hosokawa et al., 2015; Jack et al., 2012; Kaneko et al., 2014; Kerbage et al., 2015; Li et al., 2015; Mattsson et al., 2014; Mikhno et al., 2012; Newberg et al., 2012; Ng et al., 2007; Rabinovici et al., 2011; Saint‐Aubert et al., 2014; Tolboom et al., 2010; Trzepacz et al., 2014; Tzen et al., 2014; Vandenberghe et al., 2010; Villemagne et al., 2011, 2019; Alvarez et al., 2018; Ben Bouallegue et al., 2017; Chen et al., 2016; Dukart et al., 2016; Iaccarino et al., 2017; La Joie et al., 2019; Mielke et al., 2018; Oliveira et al., 2018; Ottoy et al., 2019; Park et al., 2019; Schreiber et al., 2015; Seo et al., 2017; Takahashi et al., 2017; Villeneuve et al., 2015; Wang, Chen, et al., 2016; Wang, Yi, et al., 2016; Xu et al., 2016; Zhang et al., 2017; Zwan et al., 2016, 2021; Chanisa et al., 2021; Kitajima et al., 2021; Lesman‐Segev et al., 2021; Peretti et al., 2019). The specific process of literature screening is detailed in Figure 1.
FIGURE 1.
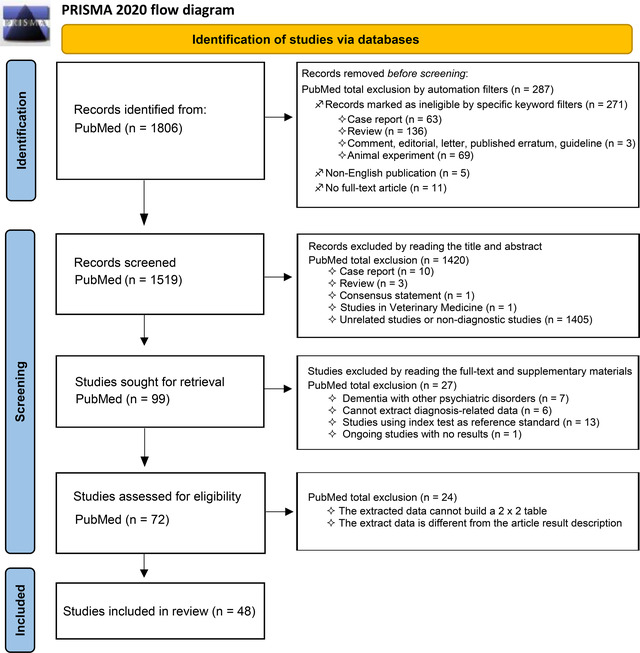
Flowchart of the study screening process following the Preferred Reporting Items for Systematic Reviews and Meta‐analysis (PRISMA) 2020 statement
A total of 8285 patients were included in the 48 studies; the number of patients included in the analysis in our meta‐analysis was 5967. The types of populations included in the studies had AD, MCI, non‐AD dementia (non‐ADD), and normal controls (NC), and their median age range was 60.1–79.4 years. The radiotracers were 11C‐PIB or 18F‐AV45, except for one study that used 18F‐florbetaben and three studies that used 18F‐FMM. The typical comparison of the uptake of 18F‐FMM, 11C‐PIB, 18F‐AV45, and 18F‐florbetaben in AD patients and NC is shown in Figure 2. Six studies had a reference standard of brain autopsy or brain tissue biopsy, and the remaining 42 studies had a reference standard of comprehensive clinical diagnostic criteria. One study included only patients with AD; the remaining studies compared different population groups, including AD versus NC, AD versus MCI, cMCI (MCI converting to AD) versus sMCI (stable MCI), AD versus FLTD, and AD versus non‐ADD. Detailed information on these included studies is shown in Table 1.
FIGURE 2.
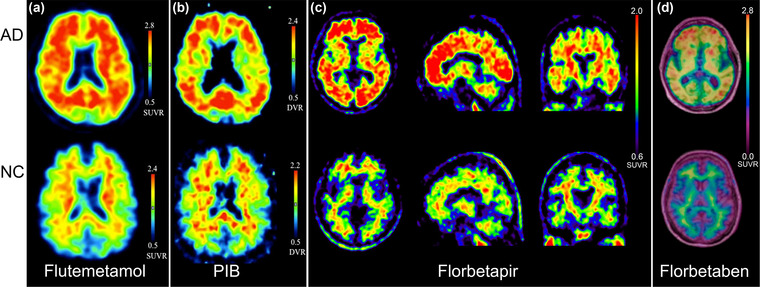
The typical brain images of Alzheimer's disease (AD) and normal controls are shown by amyloid‐β (Aβ) PET imaging. Part (a) shows axial 18F‐flutemetamol (18F‐FMM) PET images (upper row for AD patients, lower row for normal controls). Part (b) shows axial 11C‐PIB PET images (upper row for AD patients, lower row for normal controls). Part (c) shows 18F‐AV45 PET images in transaxial, sagittal, and coronal positions (upper row for AD patients, lower row for normal controls). Part (d) shows axial 18F‐florbetaben PET images with aligned fused MRI images (upper row for AD patients, lower row for normal controls). Source: From Camus et al. (2012, Hatashita et al. (2014)), and Villemagne et al. (2011) with modifications
TABLE 1.
Basic characteristic information for the included studies
| Year | Author | Ref | Patients’ origin | Study design | Major research objectives | N of pts | Types of patients | Age (median/range) in years | Male/female | Test index | Qualitative/visual analysis | Threshold | Reference standard | Interval time (PET to autopsy/follow‐up) mean/range | Extracted diagnostic objects |
|---|---|---|---|---|---|---|---|---|---|---|---|---|---|---|---|
| 2007 | Ng S | Ng et al. (2007) | Australia | Prosp | Diagnostic value of PIB and FDG for AD | 40 | 15 AD, 25 NC | 71.6 | 21/19 | PIB | V&Q | SUVR = 1.54 | NINCDS‐ADRDA, MMSE, CDR | NA | AD vs. NC |
| 2010 | Tolboom N | Tolboom et al. (2010) | Netherlands | Prosp | Diagnostic value of PIB for AD | 41 | 21 AD, 20 NC | 65 | NR | PIB | V&Q | b BPnd = 0.54 | NR | NA | AD vs. NC |
| 2010 | Vandenberghe R | Vandenberghe et al. (2010) | Belgium | Prosp | Diagnostic value of FMM for AD | 72 | 27 AD, 20 MCI, 25 NC | 65.9 | 36/36 | FMM | V&Q | SUVR = 1.56 | NINCDS‐ADRDA, ADAS‐cog, MMSE, CDR, DSM‐IV, FCSRT, RAVLT | 1 month to 6 years | AD vs. NC; AD vs. MCI |
| 2011 | Fleisher AS | Fleisher (2011) | USA | Prosp | Diagnostic value of AV45 for AD | 210 | 68 AD, 60 MC, 82 NC | 72.7 | 99/111 | AV45 | Q | SUVR = 1.17 | NINCDS‐ADRDA, ADAS‐cog, MMSE, CDR, WMS‐imd | NA | AD vs. NC; AD vs. MCI |
| 2011 | Rabinovici GD | Rabinovici et al. (2011) | USA | Prosp | Comparing the diagnostic efficacy of PIB and FDG for AD and FTLD | 107 | 62 AD, 45 FTLD | 64.9 | 59/48 | PIB | V&Q | SUVR = 1.2 | MMSE, CDR | NA | AD vs. FTLD |
| 2011 | Villemagne VL | Villemagne et al. (2011) | Australia | Prosp | Diagnostic value of florbetaben for AD, MCI, and OD | 109 | 30 AD, 20 MCI, 32 NC, 11 FTLD, 7 DLB, 5 PD, 4 VD | 71.1 | 64/45 | Florbetaben | V&Q | SUVR = 1.4 | NINCDS‐ADRDA, NINDS‐AIREN, MMSE, CDR, NBT | NA | AD vs. NC; AD vs. MCI |
| 2012 | Camus V | Camus et al. (2012) | France | Prosp | Diagnostic value of AV45 for AD and MCI | 46 | 13 AD, 12 MCI, 21 NC | 69 | 20/26 | AV45 | V&Q | SUVR = 1.122 | NINCDS‐ADRDA, MMSE, DSM‐IV, FCSRT, NBT | NA | AD vs. NC |
| 2012 | Clark CM | Clark et al. (2012) | USA | Prosp | Diagnostic value of AV45 for AD | 59 | 29 AD, 5 MCI, 12 NC, 13 non‐ADD | 79.4 | 30/29 | AV45 | V&Q | SUVR = 1.10 | Brain autopsy | 6.6 months | AD vs. non‐ADD |
| 2012 | Jack CR Jr | Jack et al. (2012) | USA | Retro | Diagnostic value of MRI, FDG PET, and PIB PET for AD | 492 | 42 AD, 450 NC | 78.2 | 271/221 | PIB | Q | SUVR = 1.5 | NIA‐AA, MMSE, NBT, WAIS‐R, WMS‐R, AVLT, TMT, CFT, BNT | NA | AD vs. NC |
| 2012 | Mikhno A | Mikhno et al. (2012) | USA | Retro | Diagnostic value of MRI, FDG PET, and AV45 PET for AD and MCI | 56 | 17 AD, 22 MCI, 17 NC | NR | NR | PIB | Q | b SVM classifier | NINCDS‐ADRDA, MMSE | NA | AD vs. NC; AD vs. MCI |
| 2012 | Newberg AB | Newberg et al. (2012) | USA | Retro | Comparing the diagnostic efficacy of AV45 and FGD for AD | 40 | 19 AD, 21 NC | 69.9 | 21/19 | AV45 | V | / | NINCDS‐ADRDA, MMSE | NA | AD vs. NC |
| 2013 | Brück A | Brück et al. (2013) | Finland | Prosp | Comparing the predictive efficacy of MRI, FDG PET, and PIB PET for MCI‐to‐AD conversion | 29 | 17 cMCI, 12 sMCI | 71.7 | 18/11 | PIB | Q | SUVR = 1.57 | MMSE, WLLT, WLRT | 2 years | cMCI vs. sMCI |
| 2013 | Hatashita S and Yamasaki H | Hatashita and Yamasaki (2013) | Japan | Prosp | Comparing the predictive efficacy of FDG and PIB for MCI‐to‐AD conversion | 68 | 30 cMCI, 38 sMCI | 50–90 | NR | PIB | V | / | NINCDS‐ADRDA, NIA‐AA, MMSE, CDR, WMS‐R, LM2 | 19.2 ± 7.1 years | cMCI vs. sMCI |
| 2014 | Beach TG | Beach et al. (2014) | USA | Prosp | Diagnostic value of AV45 for AD | 919 | 618 AD, 301 non‐ADD | 79 | 551/368 | AV45 | V | / | Brain autopsy | 10.8 months | AD vs. non‐ADD |
| 2014 | Hatashita S | Hatashita et al. (2014) | Japan | Prosp | Comparing the diagnostic efficacy of FMM and PIB for AD | 166 | 36 AD, 68 MCI, 62 NC | 68.3 | 71/95 | PIB; FMM | V | / | MMSE, CDR, WMS‐R, LM2 | NA | AD vs. NC |
| 2014 | Kaneko N | Kaneko et al. (2014) | Japan | Retro | Diagnostic value of plasma amyloid‐related markers for AD | 62 | 17 AD, 12 MCI, 33 NC | 74.1 | 27/35 | PIB | V | / | NIA‐AA, ADAS‐Jcog, MMSE, LM2, GDS | NA | AD vs. NC |
| 2014 | Mattsson N | Mattsson et al. (2014) | a USA, Canada | Prosp | Diagnostic value of CSF markers and AV45 PET for AD | 511 | 118 AD, 59 cMCI, 165 sMCI, 169 NC | 73.6 | 278/233 | AV45 | Q | SUVR = 1.11 | NINCDS‐ADRDA, MMSE, CDR | 2 years | AD vs. NC; cMCI vs. sMCI |
| 2014 | Saint‐Aubert L | Saint‐Aubert et al. (2014) | France | Prosp | Diagnostic value of AV45 for AD | 39 | 22 AD, 17 NC | 71.3 | 19/20 | AV45 | V&Q | SUVR = 1.28 | MMSE, CDR, FCSRT | NA | AD vs. NC |
| 2014 | Trzepacz PT | Trzepacz et al. (2014) | a USA, Canada | Prosp | Comparing the predictive efficacy of MRI, FDG PET, and PIB PET for MCI‐to‐AD conversion | 50 | 20 cMCI, 30 sMCI | 74.7 | 33/17 | PIB | V | / | NINCDS‐ADRDA, ADAS‐cog, MMSE, CDR, LM2 | 2 years | cMCI vs. sMCI |
| 2014 | Tzen KY | Tzen et al. (2014) | Taiwan | Retro | Diagnostic value of plasma Aβ and tau proteins for AD and its correlation with PIB PET | 45 | 25 AD, 20 NC | 65.4 | 20/25 | PIB | Q | SUVR = 1.5 | NIA‐AA, MMSE, CDR, NBT | NA | AD vs. NC |
| 2015 | Hosokawa C | Hosokawa et al. (2015) | Japan | Retro | Analyzing PIB's equivocal diagnostic findings for brain amyloid deposition | 101 | 30 AD, 25 MCI, 19 NC, 8 LBD, 7 FTLD, 12 OD | 69.5 | 44/57 | PIB | V | / | NINCDS‐ADRDA, MMSE | NA | AD vs. non‐ADD |
| 2015 | Kerbage C | Kerbage et al. (2015) | USA | Retro | Correlation of Aβ deposition in the ocular lens with brain Aβ deposition revealed by AV45 PET | 40 | 20 AD, 20 NC | 74 | 22/18 | AV45 | V | / | NINCDS‐ADRDA, DSM‐IV, LM2 | NA | AD vs. NC |
| 2015 | Li QX | Li et al. (2015) | Australia | Retro | Diagnostic value of Aβ PET for AD and correlation between CSF and SUVR | 157 | 16 AD, 21 MCI, 120 NC | 72.5 | 72/85 | PIB; AV45; FMM | Q | SUVR = 1.50 | MMSE, CDR | AD vs. NC; AD vs. MCI | |
| 2015 | Schreiber S | Schreiber et al. (2015) | a USA, Canada | Prosp | Comparison of the diagnostic efficacy of AV45 with visual analysis and quantitative analysis for MCI‐to‐AD conversion | 401 | 61 cMCI, 240 sMCI | 71.6 | 219/182 | AV45 | V&Q | SUVR = 1.1 | NINCDS‐ADRDA, MMSE, LM2 | 1.6 years | cMCI vs. sMCI |
| 2015 | Villeneuve S | Villeneuve et al. (2015) | USA | Prosp | Comparison of the diagnostic efficacy of quantitative analysis of different thresholds of PIB for AD | 50 | 50 AD | 69.8 | 33/17 | PIB | Q | SUVR = 1.21 | Brain autopsy | 3.1 years | AD |
| 2016 | Chen X | Chen et al. (2016) | a USA, Canada | Prosp | Predictive value of FDG, PIB PET, and CSF biomarkers for MCI‐to‐AD conversion | 82 | 34 AD, 48 MCI | 74.4 | 60/22 | PIB; AV45 | Q | SUVR = 1.362 | NINCDS‐ADRDA, ADAS‐cog, MMSE, CDR; follow‐up | 96 months | cMCI vs. sMCI |
| 2016 | Dukart J | Dukart et al. (2016) | a USA, Canada | Prosp | Diagnostic value of MRI, FDG PET, AV45 PET for AD and predictive value for MCI‐to‐AD conversion | 698 | 144 AD, 177 cMCI, 265 sMCI, 112 NC | 74.8 | 416/282 | AV45 | Q | SUVR = 1.1 | NINCDS‐ADRDA, ADAS, MMSE, RAVLT, GDS, FAQ | 2 years | AD vs. NC; cMCI vs. sMCI |
| 2016 | Seo SW | Seo et al. (2017) | USA | Prosp | Diagnostic value of regional or global SUVR of PIB for AD | 54 | 12 AD, 6 MCI, 2 NC, 33 FTLD, 1 VD | 68.1 | 33/21 | PIB | Q | SUVRglobal = 1.21 | Brain autopsy | 3.1 ± 1.9 years | AD vs. non‐ADD |
| 2016 | Wang MJ | Wang, Yi et al. (2016) | Korea | Retro | Diagnostic value of PIB PET combined with CSF for AD and the correlation between CSF and PIB PET | 57 | 27 AD, 30 NC | 65.3 | 30/27 | PIB | Q | SUVR = 1.259 | NIA‐AA, MMSE, CDR, NPI, GDS | NA | AD vs. NC |
| 2016 | Wang P | Wang, Chen et al. (2016) | a USA, Canada | Prosp | Predictive value of MRI, FDG PET, and AV45 PET for MCI‐to‐AD conversion | 129 | 64 cMCI, 65 sMCI | 72.3 | 74/55 | AV45 | Q | bVoxels‐analysis | ADAS‐cog, MMSE, CDR; Follow‐up | 3 years | cMCI vs. sMCI |
| 2016 | Xu L | Xu et al. (2016) | a USA, Canada | Prosp | Predictive value of MRI, FDG PET, and AV45 PET for MCI‐to‐AD conversion | 227 | 27 cMCI, 83 sMCI, 117 NC | 75.3 | 141/86 | AV45 | Q | b α in wmSRC = 0.6 | MMSE, CDR | 3 years | cMCI vs. sMCI |
| 2016 | Zwan MD | Zwan et al. (2016) | Several Countries | Retro | Diagnostic threshold for CSF based on brain Aβ deposits shown by PIB PET | 433 | 195 AD, 98 MCI, 57 NC, 83 non‐ADD | 64.6 | 256/177 | PIB | V | / | MMSE, NPI | NA | AD vs. non‐ADD |
| 2017 | Ben Bouallegue F | Ben Bouallegue et al. (2017) | a USA, Canada | Prosp | Efficacy of Aβ PET and CSF in diagnosing AD and predicting MCI‐to‐AD conversion | 677 | 124 AD, 301 MCI, 157 NC, 95 SMC | 71.9 | 83/104 | AV45 | Q | SUVRcomp = 0.89 | NINCDS‐ADRDA, ADAS‐cog, MMSE, CDR | 22 ± 13 months | AD vs. NC |
| 2017 | Iaccarino L | Iaccarino et al. (2017) | Sweden | Retro | Efficacy of FDG and PIB in predicting MCI‐to‐AD conversion | 30 | 14 cMCI, 16 sMCI | 63.6 | 10/20 | PIB | Q | SUVR = 1.41 | MMSE, SWAIS, NBT | 26.5 months | cMCI vs. sMCI |
| 2017 | Takahashi R | Takahashi et al. (2017) | a USA, Canada | Retro | Diagnostic value of FDG combined with AV45 for AD | 324 | 143 AD, 181 NC | 73.4 | 171/153 | AV45 | Q | b Voxels‐analysis | NINCDS‐ADRDA | AD vs. NC | |
| 2017 | Zhang N | Zhang et al. (2017) | China | Retro | Correlation between relevant indicators in urine and brain Aβ deposition | 30 | 20 AD, 10 MCI | 66.3 | 9/21 | PIB | Q | SUVR = 1.5 | NINCDS‐ADRDA, MMSE, CDR, Petersen criteria, NPI | NA | AD vs. MCI |
| 2018 | Alvarez I | Alvarez et al. (2018) | Spain | Retro | Correlation of CSF biomarkers with Aβ PET | 68 | 46 AD, 6 FTLD, 2 non‐ADD, 1 VD, 13 UD | 62.9 | 27/41 | AV45 | V | / | IWG‐2 criteria, MMSE, Petersen criteria | NA | AD vs. non‐ADD |
| 2018 | Mielke MM | Mielke et al. (2018) | USA | Prosp | Diagnostic value of plasma phospho‐tau181 in AD and correlation of plasma phospho‐tau181 with tau‐ and Aβ PET | 269 | 40 AD, 57 MCI, 172 NC | 71.2 | 187/82 | PIB | Q | SUVR = 1.42 | NIA‐AA, MMSE, CDR, DSM‐IV | NA | AD vs. NC; AD vs. MCI |
| 2018 | Oliveira F | Oliveira et al. (2018) | Several Countries | Retro | Diagnostic value of PIB PET combined with CSF for AD and the relationship between CSF and PIB retention | 243 | 122 AD, 81 MCI, 13 NC, 20 FTLD, 7 VD | 64.6 | 105/138 | PIB | V | / | NINCDS‐ADRDA, NINDS‐AIREN, Petersen criteria, Neary criteria | NA | AD vs. NC; AD vs. MCI |
| 2019 | La Joie R | La Joie et al. (2019) | USA | Retro | Diagnosis of AD by PIB PET and using the b Centiloid method | 179 | 63 AD, 27 MCI, 22 NC, 67 non‐ADD | 73 | 116/63 | PIB | Q | b CL = 24.4 | Brain autopsy | 3.3 years | AD vs. NC |
| 2019 | Li WW | Hajiramezanali et al. (2019) | China | Retro | Correlation of brain Aβ deposition in AD with blood Aβ levels as shown by PIB PET | 84 | 53 AD, 22 MCI, 9 NC | 66.7 | 41/43 | PIB | V | / | NINCDS‐ADRDA, MMSE, CDR, Petersen criteria, DSM‐IV, MoCA | NA | AD vs. NC; AD vs. MCI |
| 2019 | Ottoy J | Ottoy et al. (2019) | Belgium | Retro | Correlation between CSF, MRI, Aβ PET and MCI‐to‐AD conversion at baseline | 78 | 16 AD, 49 MCI, 13 NC | 72 | 41/37 | AV45 | V&Q | SUVR = 1.203 | NIA‐AA, MMSE, RBANS | 415 ± 18 days | AD vs. NC; AD vs. MCI |
| 2019 | Park JC | Park et al. (2019) | Korea | Prosp | Predictive value of blood biomarkers for brain Aβ deposition | 254 | 40 AD, 107 MCI, 107 NC | 71.5 | 89/165 | PIB | Q | SUVR = 1.4 | MMSE, CDR | NA | AD vs. NC; AD vs. MCI |
| 2019 | Peretti DE | Peretti et al. (2019) | Belgium | Prosp | Diagnostic value of dynamic PIB of rCBF images for AD | 52 | 15 AD, 21 MCI, 16 NC | 66.6 | 35/17 | PIB | Q | b PET‐score = 2.08 | NIA‐AA, MMSE | NA | AD vs. NC; AD vs. MCI |
| 2020 | Chanisa C | Chanisa et al. (2021) | Thailand | Prosp | Diagnostic value of PIB for AD | 40 | 16 AD, 24 NC | 60.1 | 18/22 | PIB | Q | SUVR = 1.5 | NIA‐AA, MMSE, CDR, MoCA | NA | AD vs. NC |
| 2021 | Kitajima K | Kitajima et al. (2021) | Japan | Retro | Diagnostic value of PIB for AD and MCI | 26 | 7 AD, 15 MCI, 1 NC, 1 VD, 2 FTLD | 78.5 | 5/21 | PIB | V&Q | SUVR = 1.5 | NINCDS‐ADRDA, MMSE, MoCA, FAB | NA | AD vs. MCI; AD vs. non‐ADD |
| 2021 | Lesman‐Segev OH | Lesman‐Segev et al. (2021) | USA | Prosp | Comparing the diagnostic efficacy of PIB and FDG for AD | 101 | 32 AD, 56 FTLD, 13 mixed AD/FTLD | 67.2 | 60/41 | PIB | V | / | Brain autopsy | 4.4 years | AD vs. FTLD |
| 2021 | Park JC | Park et al. (2021) | Korea | Prosp | Predictive value of plasma samples for brain Aβ deposition | 300 | 64 AD, 87 MCI, 149 NC | 71.1 | 113/187 | PIB | Q | SUVR = 1.4 | NIA‐AA, MMSE, CDR, DSM‐IV | NA | AD vs. NC; AD vs. MCI |
NINCDS‐ADRDA/NINDS‐AIREN the criteria for probable AD. NIA‐AA the criteria for diagnosing AD. Neary criteria the criteria for FLTD. Petersen criteria the criteria for MCI.
Abbreviations: :AD, Alzheimer's disease; ADAS‐cog, AD assessment scale‐cognitive subscale; ADAS‐Jcog, ADAS‐Jcog (Japanese version); AVLT, auditory verbal learning test; Aβ, amyloid‐β; BNT, Boston Naming Test; CDR, clinical dementia rating scale; CFT, category fluency test; cMCI, MCI converting to AD; DLB, dementia with Lewy bodies; DSM‐IV, Diagnostic and Statistical Manual of Mental Disorders (fourth edition); FAB, Frontal Assessment Battery; FAQ, Functional Activities Questionnaire; FCSRT, Free and Cued Selective Reminding Test; FTLD, frontotemporal dementia; GDS, Geriatric Depression Scale; IWG‐2, criteria the International Working Group for new research criteria for the diagnosis of Alzheimer's disease; LM2, logical memory II from the WMS‐R; MCI, mild cognitive impairment; MMSE, mini‐mental state examination; MoCA, Montreal Cognitive Assessment; NBT, neuropsychological battery test; NC, normal controls; Non‐ADD, other non‐AD dementia; NPI, neuropsychiatric inventory; OD, other mental disorders; PD, Parkinson disease; RAVLT, Rey Auditory Verbal Learning Test; RBANS, the Repeatable Battery for the Assessment of Neuropsychological Status; SMC, significant memory complaint; sMCI, stable MCI; SUVR, standardized uptake value ratio; SWAIS, Swedish versions of the Wechsler Adult Intelligence Scale; TMT, Trail Making Test; UD, uncertain diagnosis; VD, vascular dementia; WAIS‐R, Wechsler Adult Intelligence Scale‐Revised; WLLT, word list learning test score; WLRT, word list recall test score; WMS‐imd, Wechsler Logical Memory Scale immediate recall test; WMS‐R, Wechsler Memory Scale‐Revised.
Using the ADNI database.
Using specific quantitative analysis methods; Ref reference; N of pts number of patients; NR not report; NA not available; Retro retrospective; Prosp prospective; CSF cerebrospinal fluid; rCBF regional cerebral blood flow; V visual analysis; Q qualitative analysis; PIB 11C‐PIB; AV45 18F‐AV45; FMM 18F‐FMM; Florbetaben 18F‐florbetaben.
3.2. Methodological qualitative analysis
The risk bias and clinical applicability assessment results for each study are shown in Table 2. Thirty‐four studies in patient selection were assessed as high risk because they were case‐control studies. Ten studies were assessed as high risk for the index test because they were unblinded, and the threshold was set after the examination. Overall, studies with high‐risk bias in patient selection were upward of 50%; studies with high‐risk bias in index tests were approximately 20%, and uncertain risk bias was approximately 10%; studies with uncertain risk bias in reference standards were approximately 40%, and studies with uncertain risk bias in flow and timing were approximately 20%. For clinical applicability concerns, no study was evaluated as highly inapplicable, but more than 20% of the studies were evaluated as having uncertain concerns (Figure 3).
TABLE 2.
Quality assessment of the included studies based on Quality Assessment of Diagnostic Accuracy Studies‐2 (QUADAS‐2)
| Risk of bias | Applicability concerns | ||||||
|---|---|---|---|---|---|---|---|
| Study | Patient selection | Index test | Reference standard | Flow and timing | Patient selection | Index test | Reference standard |
| 2007 Ng S | High | Low | Low | Low | Low | Low | Low |
| 2010 Tolboom N | High | Low | Low | Low | Low | Low | Low |
| 2010 Vandenberghe R | High | Low | Low | Low | Low | Low | Low |
| 2011 Fleisher AS | High | Low | Low | Low | Low | Low | Low |
| 2011 Rabinovici GD | Low | Low | Low | Low | Low | Low | Low |
| 2011 Villemagne VL | High | Low | Low | Low | Low | Low | Low |
| 2012 Camus V | High | Low | Low | Low | Low | Low | Low |
| 2012 Clark CM | Low | Low | Low | Low | Low | Low | Low |
| 2012 Jack CR Jr | High | High | Unclear | Low | Low | Low | Low |
| 2012 Mikhno A | High | High | Unclear | Low | Low | Low | Low |
| 2012 Newberg AB | High | Low | Low | Low | Low | Low | Low |
| 2013 Brück A | Low | High | Unclear | Low | Low | Low | Low |
| 2013 Hatashita S | Low | Unclear | Unclear | Low | Low | Low | Low |
| 2014 Beach TG | Low | Low | Low | Low | Low | Low | Low |
| 2014 Hatashita S | Unclear | Unclear | Unclear | Low | Low | Low | Low |
| 2014 Kaneko N | High | Low | Low | Unclear | Unclear | Unclear | Unclear |
| 2014 Mattsson N | High | Low | Unclear | Low | Low | Low | Low |
| 2014 Saint‐Aubert L | High | Low | Low | Low | Low | Low | Low |
| 2014 Trzepacz PT | Low | Unclear | Unclear | Low | Low | Low | Low |
| 2014 Tzen KY | High | Low | Low | Unclear | Unclear | Unclear | Unclear |
| 2015 Hosokawa C | Low | Low | Low | Unclear | Unclear | Unclear | Unclear |
| 2015 Kerbage C | High | Low | Low | Unclear | Unclear | Unclear | Unclear |
| 2015 Li QX | High | Low | Low | Low | Low | Low | Low |
| 2015 Schreiber S | Low | Low | Low | Low | Low | Low | Low |
| 2015 Villeneuve S | Low | Low | Low | Low | Low | Low | Low |
| 2016 Chen X | High | High | Unclear | Low | Low | Low | Low |
| 2016 Dukart J | High | Low | Unclear | Low | Low | Low | Low |
| 2016 Seo SW | Low | Low | Low | Low | Low | Low | Low |
| 2016 Wang MJ | High | High | Unclear | Low | Low | Low | Low |
| 2016 Wang P | Low | Low | Low | Low | Low | Low | Low |
| 2016 Xu L | High | High | Unclear | Low | Low | Low | Low |
| 2016 Zwan MD | High | Low | Unclear | Unclear | Unclear | Unclear | Unclear |
| 2017 Ben Bouallegue F | High | High | Unclear | Low | Low | Low | Low |
| 2017 Iaccarino L | High | Low | Low | Low | Low | Low | Low |
| 2017 Takahashi R | High | High | Unclear | Low | Low | Low | Low |
| 2017 Zhang N | High | Low | Low | Unclear | Unclear | Unclear | Unclear |
| 2018 Alvarez I | Low | Unclear | Unclear | Unclear | Unclear | Unclear | Unclear |
| 2018 Mielke MM | High | Low | Unclear | Unclear | Unclear | Unclear | Unclear |
| 2018 Oliveira F | High | Unclear | Unclear | Low | Low | Low | Low |
| 2019 La Joie R | High | Low | Low | Low | Low | Low | Low |
| 2019 Li WW | High | Low | Low | Unclear | Unclear | Unclear | Unclear |
| 2019 Ottoy J | High | Low | Unclear | Low | Low | Low | Low |
| 2019 Park JC | High | Low | Unclear | Unclear | Unclear | Unclear | Unclear |
| 2019 Peretti DE | High | High | Unclear | Low | Low | Low | Low |
| 2020 Chanisa C | High | High | Unclear | Low | Low | Low | Low |
| 2021 Kitajima K | High | Low | Low | Low | Low | Low | Low |
| 2021 Lesman‐Segev OH | Low | Low | Low | Low | Low | Low | Low |
| 2021 Park JC | High | Low | Low | Low | Unclear | Unclear | Unclear |
FIGURE 3.
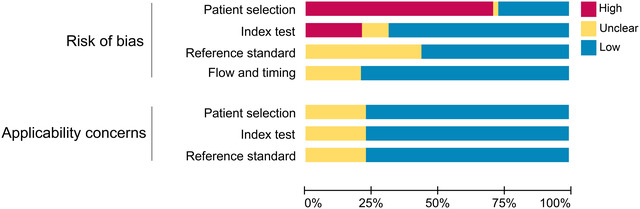
Overall assessment of the methodological quality of the 48 studies, including evaluation of risk bias and evaluation of applicability concerns
3.3. Pooled diagnostic performance of Aβ PET
The results of our meta‐analysis of 48 studies are shown in Figure 4. The studies that performed the overall pooled assessment included 29 AD versus NC, 2 AD versus MCI, 2 AD versus FTLD, 6 AD versus non‐ADD, 8 cMCI versus sMCI, and 1 AD only. The pooled sensitivity, specificity, DOR, and AUC of Aβ PET for AD diagnosis were 0.90 (95% CI 0.87–0.92), 0.80 (95% CI 0.76–0.84), 35.68 (95% CI 24.36–51.78), and 0.91 (95% CI 0.86–0.94), respectively. The trend of the SROC curve was close to the upper left corner, and the distribution of individual studies was primarily concentrated in the upper left corner, all of which suggested that the overall diagnostic performance of Aβ PET was favorable. The dispersion of individual studies shown in the SROC curve was not significant and was mostly concentrated within the confidence interval, thus potentially suggesting that the heterogeneity between studies was within an acceptable range (Figure 5).
FIGURE 4.
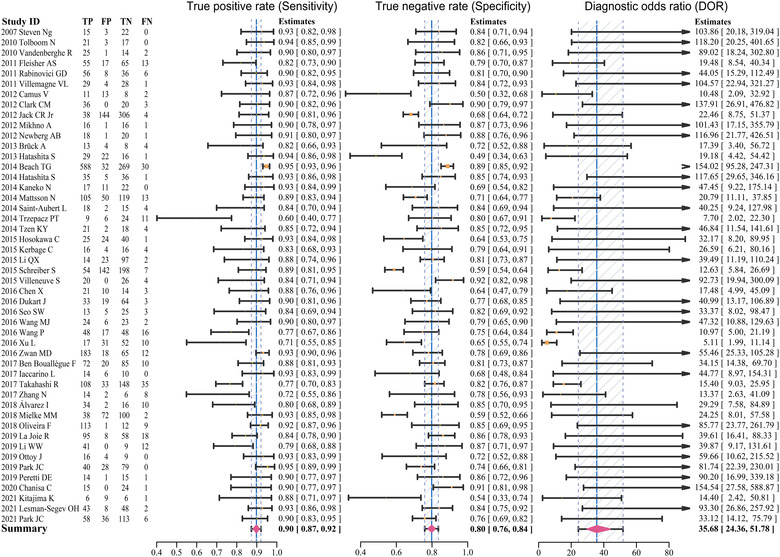
Forest plots of pooled sensitivity, specificity, and DOR for the included studies
FIGURE 5.
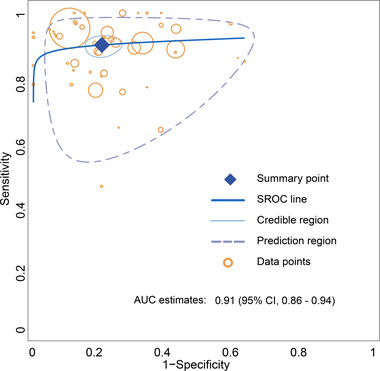
Summary ROC curve for the overall performance assessment of amyloid‐β (Aβ) PET for the diagnosis of Alzheimer's disease (AD)
We compared the pooled diagnostic performance of the AD versus NC (Figure S1), AD versus MCI (Figure S2), and cMCI versus sMCI (Figure S3) groups, respectively. The pooled sensitivity of Aβ PET for diagnosing AD (sensitivity: 0.91, 95% CI 0.88–0.93) was higher than that of cMCI (sensitivity: 0.84, 95% CI 0.74–0.92). Aβ PET had the highest pooled specificity for differentiating NC (specificity: 0.81, 95% CI 0.77–0.86) and performed poorly in differentiating MCI (specificity: 0.49, 95% CI 0.41–0.58). The area under the diagnostic SROC curve for the three population groups of AD versus NC, AD versus MCI, and cMCI versus sMCI was 0.93 (95% CI 0.89–0.95), 0.83 (95% CI 0.80–0.95), and 0.78 (95% CI 0.73–0.92), respectively. The diagnostic pooled sensitivity (0.91 vs. 0.86), specificity (0.80 vs. 0.78), DOR (45.66 vs. 22.12), and AUC (0.93 vs. 0.86) of 11C‐PIB PET (Figure S4) were higher than 18F‐AV45 PET (Figure S5). In addition, the pooled sensitivity (0.92 vs. 0.90), specificity (0.85 vs. 0.83), DOR (78.74 vs. 49.56), and AUC (0.94 vs. 0.92) of visual assessment (Figure S6) were higher than those of quantitative analysis (Figure S7). The pooled estimates of these detailed comparisons are shown in Table 3.
TABLE 3.
Comparison of diagnostic performance between subgroups
| Data‐type | Pooled sensitivity (95% CI) | Pooled specificity (95% CI) | Pooled diagnostic OR (95% CI) | Pooled AUC estimates (95% CI) |
|---|---|---|---|---|
| Population groups | ||||
| AD vs. NC | 0.91 (0.88–0.93) | 0.81 (0.77–0.86) | 45.32 (29.12–71.29) | 0.93 (0.89–0.95) |
| AD vs. MCI | 0.90 (0.85–0.95) | 0.49 (0.41–0.58) | 9.88 (5.30–18.42) | 0.83 (0.80–0.95) |
| cMCI vs. sMCI | 0.84 (0.74–0.92) | 0.62 (0.56–0.68) | 9.26 (4.44–17.66) | 0.78 (0.73–0.92) |
| Different radiotracers | ||||
| 11C‐PIB | 0.91 (0.88–0.94) | 0.80 (0.75–0.85) | 45.66 (25.98–74.25) | 0.93 (0.90–0.96) |
| 18F‐AV45 | 0.86 (0.81–0.90) | 0.78 (0.70–0.84) | 22.12 (12.34–39.26) | 0.86 (0.64–0.92) |
| Diagnostic methods | ||||
| Visual analysis | 0.92 (0.88–0.96) | 0.85 (0.77–0.91) | 78.74 (31.97–176.49) | 0.94 (0.89–0.97) |
| Quantitative analysis | 0.90 (0.87–0.93) | 0.83 (0.79–0.88) | 49.56 (30.35–80.68) | 0.92 (0.89–0.95) |
Abbreviations: AD, Alzheimer's disease; MCI, mild cognitive impairment; NC, normal controls.
3.4. Publication bias
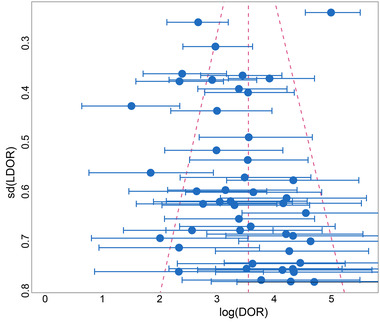
We made an overall assessment of publication bias and heterogeneity of the studies after visual analysis of the funnel plot (Figure 6). Overall, the studies were roughly evenly distributed on both sides of the log diagnostic OR estimates, indicating no significant publication bias. In addition, a large proportion of studies were clustered at the bottom of the funnel plot, reflecting that we included many small samples of studies, which may have led to less stability in the pooled estimates. A small portion of studies at the top and upper middle of the funnel plot is scattered outside the 95% confidence interval, whereas the majority of studies are within the 95% confidence interval; therefore, the heterogeneity among studies is moderate and within an acceptable range.
FIGURE 6.
Funnel plot for assessing publication bias and heterogeneity
4. DISCUSSIONS
Over the past 30 years, the most widely used diagnostic guideline for AD is the NINCDS‐ADRDA diagnostic criteria, the main diagnostic criteria of which are (1) dementia identified by clinical examination and cognitive scales, (2) two or more cognitive deficits with progressive deterioration, (3) no impairment of consciousness, (4) onset at age 40–90 years, and (5) exclusion of other systemic and brain diseases that cause progressive memory and cognitive impairment (Mckhann et al., 1984). As research on AD has become more advanced, new insights into the sequence of onset and progression of AD have emerged. The guidelines for the management of AD published in 2011 (NIA‐AA criteria) focus on illustrating AD as a continuum involving pathophysiological changes to the progressive appearance of clinical symptoms (Albert et al., 2011; Jack et al., 2011; Sperling et al., 2011). The NIA‐AA guidelines consider Aβ deposition as the first step in the progression of AD, followed by downstream changes in a range of indicators of neurodegeneration and then by a slight decline in cognitive function. The biomarkers used to diagnose AD are therefore divided into two categories: (1) reflecting Aβ deposition, such as Aβ42 in cerebrospinal fluid (CSF) or Aβ PET; and (2) reflecting neuronal damage, such as CSF tau/p‐Tau, hippocampal or medial temporal lobe atrophy on MRI, and glucose hypometabolism on PET or SPECT. We pooled studies from 2007 to 2021 on Aβ PET for AD diagnosis and prediction of MCI conversion to AD. Based on the results of our meta‐analysis, we evaluate the diagnostic and predictive performance of Aβ PET and comprehensively discuss how to correctly and effectively maximize the diagnostic accuracy in clinical applications and the problems and challenges currently faced in clinical work. Our pooled estimates suggest that Aβ PET is highly sensitive in determining AD and possesses favorable diagnostic efficacy overall but performs with average specificity, which is similar to the meta‐analysis by Morris et al. (2016).
First, the slightly lower specificity in distinguishing AD from NC is due to the false positives in cognitively NC. Aβ deposition was present in 20%–30% of cognitively normal elderly subjects (Dahmer et al., 1991). As mentioned above, pathological Aβ deposition occurs prior to cognitive impairment, and it remains to be confirmed in longitudinal studies whether healthy controls with 11C‐PIB retention are false positives or preclinical stages of AD. The accuracy of 11C‐PIB in diagnosing AD is generally less affected by age, but the older the population, the more likely it is to have false positives. The most likely reason is that non‐demented older adults over 75‐year‐old have multiple diffuse Aβ plaques in the neocortical areas, making the 11C‐PIB PET less specific (Ng et al., 2007; Price & Morris, 1999). In Steven's study, the diagnostic accuracy of either 18F‐FDG or 11C‐PIB significantly decreased with age in differentiating between AD and healthy controls (Ng et al., 2007). Similarly, the results of the 18F‐AV45 PET study showed that the retention of tracers in healthy controls increased with age (Fleisher, 2011).
Aβ PET had the lowest specificity (below 60%) when comparing AD and MCI. It is similar to the pooled results of Morris et al. (2016), who concluded that the specificity was significantly lower when MCI patients were included in the healthy control group. MCI is generally divided into two categories, amnestic MCI, which is dominated by memory decline, and non‐amnestic MCI, which is dominated by the decline in attention, executive ability, visual discrimination, and language skills. Amnestic MCI has been reported to have a higher probability of conversion to dementia, especially AD dementia, than non‐amnestic MCI (Busse et al., 2006). Kitajima's study showed that 60% of MCI patients were positive for 11C‐PIB. Seventy‐five percent of 11C‐PIB‐positive MCI were amnestic MCI, whereas none of the non‐amnestic MCI patients had 11C‐PIB uptake, that is, no evidence of Aβ deposition (Kitajima et al., 2021). Eighty‐two percent of MCI patients with Aβ deposits were diagnosed with AD at the 3‐year follow‐up period, whereas 7% of MCI patients without Aβ deposits converted to AD (Okello et al., 2009). Therefore, when AD and MCI are mixed for differential diagnosis, the high uptake of Aβ tracer in patients with potentially progressive MCI could explain the high false positive and the low specificity.
On the other hand, Aβ PET was slightly more sensitive and less specific in predicting the conversion of MCI to AD. The predictive performance of Aβ PET in the study by Zhang et al. (2012) was essentially similar to ours, with their sensitivity (93.5%) slightly higher and specificity (56.2%) slightly lower than our results. His study addressed the hypothesis that neurofibrillary tangles may occur prior to Aβ plaques during the period of MCI converting to AD, whereas Aβ plaques are relatively rare in the early stages, which may explain 11C‐PIB's low specificity and sensitivity for predicting cMCI. The study comparing 18F‐FDG and 11C‐PIB found that the conversion rate of MCI was 100% in 18F‐FDG‐positive (characteristically hypo‐metabolic) subjects compared to 70% in 11C‐PIB‐positive subjects. However, an additional 3/14 cMCI patients showed positive 11C‐PIB and negative 18F‐FDG, suggesting that patients with MCI progressing to AD may be detected earlier with 11C‐PIB PET than with 18F‐FDG PET (Iaccarino et al., 2017). As mentioned above, Aβ deposition in the brain is progressive with age, but such Aβ positivity does not progress to dementia or cognitive decline. Therefore, the increased Aβ load in MCI patients does not provide sufficient confidence to diagnose MCI progression to AD. Several studies combining three imaging data modalities, that is, morphology, glucose metabolism, and Aβ load, on predicting whether patients with MCI will progress to AD have shown that most MCI can be accurately classified (Chen et al., 2016; Wang, Chen et al., 2016; Xu et al., 2016). It suggests that the diagnostic information provided by multimodal imaging of Aβ PET combined with 18F‐FDG PET or MRI may maximize diagnostic accuracy, especially in patients with an equivocal diagnosis of MCI.
Regarding comparing the radiotracer of 11C‐PIB and 18F‐AV45, our results suggest that 11C‐PIB has better sensitivity and specificity than 18F‐AV45. Previous meta‐analysis results showed no difference in diagnostic sensitivity and specificity between the different radiotracers. However, the authors considered the possibility of including too few studies to show a difference (Morris et al., 2016). 11C‐PIB has a higher rate of cortical retention than 18F‐AV45, suggesting that 11C‐PIB PET imaging may be more sensitive in showing lesions (Landau et al., 2014). There is a low rate of clinical use of 18F‐florbetaben and even fewer studies comparing it with other radiotracers. Although the cortical distribution of 18F‐florbetaben is almost identical to that of 11C‐PIB, the degree of binding to Aβ is lower. Compared to the controls, patients in the AD group utilizing 18F‐florbetaben PET imaging had a 53% higher standardized uptake value ratio (SUVR) in the neocortical area. However, when 11C‐PIB was utilized, patients in the AD group had 60%–70% higher SUVR in the neocortical area than controls (Villemagne et al., 2011). There are also studies comparing the retention of different radiotracers in the white matter area. It was shown that 18F‐FMM had the highest white matter retention. However, the rate of 18F‐FMM and 11C‐PIB uptake was similar in all neocortical areas, rendering 18F‐FMM comparable to 11C‐PIB for diagnosing AD (Vandenberghe et al., 2010). A slightly higher degree of white matter retention was observed with 11C‐PIB than with 18F‐AV45, whereas the difference was practically negligible (Landau et al., 2014). Only when using white matter as the reference area, can the presence of higher retention of radiotracers in white matter areas affect visual judgments and quantitative measures of cortical retention. Notably, the newly emerged radiotracer 18F‐NAV4694 has a high affinity for brain Aβ plaques. In vitro experiments revealed that 18F‐NAV4694 has the same high affinity for Aβ deposits and showed selective labeling of Aβ in the cortex of the postmortem human brain (Jureus et al., 2010). Moreover, in a comparative study between 18F‐NAV4694 and 11C‐PiB, 18F‐NAV4694 binds Aβ with slightly higher affinity than 11C‐PIB. Meanwhile, 18F‐NAV4694 was found to have better stability and less variability in Aβ binding in young controls. The researchers speculate that this may be because 18F (109 min) has a longer half‐life than 11C (20 min) resulting in 18F‐NAV4694 producing a higher counts rate and better images during scanning (Rowe et al., 2016). In conclusion, 18F‐NAV4694 is probably the most accurate and convenient radiotracer available for assessing Aβ deposition in the brain.
Furthermore, we found that visual analysis could yield better diagnostic outcomes than quantitative analysis, although the difference was very small. The meta‐analysis by Elizabeth Morris suggests no difference between visual and quantitative assessment (Morris et al., 2016). Because of the low levels of cerebellar Aβ plaques found in autopsy pathology in AD patients, most studies use cerebellar cortical areas as a reference to determine the retention of 11C‐PIB in the region of interest, both in visual and quantitative assessments (Svedberg et al., 2009). The results of visual interpretation often depend on the clinical experience of the observer. In contrast, the diagnostic accuracy of quantitative analysis often depends on the appropriate threshold or the diagnostic model formula. Our pooled results do not reflect the true picture. Nine studies simultaneously made direct comparisons between quantitative and visual analyses (Camus et al., 2012; Clark et al., 2012; Ng et al., 2007; Rabinovici et al., 2011; Saint‐Aubert et al., 2014; Schreiber et al., 2015; Tolboom et al., 2010; Vandenberghe et al., 2010; Villemagne et al., 2011). Five studies showed that quantitative assessment was superior to visual assessment, three showed that visual assessment was superior to quantitative assessment, and one showed that both assessments were equally effective. Of particular interest is the study by Camus V, which showed a low specificity of 38.1% for the visual assessment and high specificity of 90.5% for the quantitative assessment. He attributed the possible reasons for this to the low spatial resolution of the reconstructed images and the presence of Aβ deposits in the group of NC (Camus et al., 2012). Early on, researchers referred to visual assessment as a diagnostic approach that does not require extensive training to make accurate diagnoses and has a very high consistency of results between interpreters (Ng et al., 2007). However, the truth is that visual assessment is subject to more influences, and the reliability of judgments between interpreters may require a great deal of learning and experience. First, focal and asymmetric 18F‐AV45 or 11C‐PIB retention may produce a positive visual assessment and a negative quantitative analysis of Aβ deposition. Further, when increased white matter retention is present, it is more likely to affect the results of visual analysis. In quantitative analysis, the average global cortical SUVR threshold ranged from 1.2 to 1.5, but setting the global SUVR threshold higher than 1.4 was thought to miss many AD patients (Villeneuve et al., 2015). Chanisa et al. (2021) mentioned that Aβ plaques tend to spread from the cerebral cortex to the cingulate and precuneus regions, whereas they also found the highest 11C‐PIB deposition in the anterior and posterior cingulate gyri. His study showed that making a diagnosis based on local SUVR achieved higher sensitivity and specificity than global SUVR, and that the cutoff values of regional SUVR (1.46–1.81) were higher than global. Previously, Seo et al. (2017) demonstrated by autopsy that there was no difference in the accuracy of peak regional and global SUVR of 11C‐PIB in predicting pathological Aβ load. Anyway, more studies are needed to reveal the answer to the question of whether global or regional SUVR measurements are suitable as diagnostic criteria. Moreover, by utilizing more advanced analysis methods, including voxel analysis, Gaussian mixture models, and cluster analysis, some studies obtained lower optimal SUVR thresholds. The researchers extracted considerable PET image features (90–1000 features) or combined them with clinical features for analysis, all of which resulted in accurate classification results (Oliveira et al., 2018; Xu et al., 2016). As nice as machine learning is, the number of redundant features tends to cause overfitting; therefore, proper dimensionality reduction to extract more sensitive features is the key to building a more stable and effective prediction model. The most important point that should not be overlooked is the variation in the results provided by each research center due to the unique affinity and kinetic properties of each tracer, the inconsistency of the interpreters’ approach to image analysis (different cortical regions of interest, different reference areas, different cutoff values, etc.), and the different technical factors of image acquisition (duration after tracer injection, acquisition duration, image reconstruction algorithms, etc.). The lack of standardized quantitative results, resulting in multiple cutoff values for diagnostic and prognostic determinations per study center, may hinder comparisons of studies across centers and limit comparisons of the relative effectiveness of current therapies directed at reducing Aβ burden. The Centiloid method standardizes Aβ PET imaging measurements by scaling the 11C‐PIB PET imaging measurements (SUVR) of NC and AD patients into Centiloid (CL) units by ratio (Klunk et al., 2015). Further, numerous studies provide new conversion equations for converting SUVR values for various 18F‐amylose tracers to CL units (Bourgeat et al., 2018; Rowe et al., 2016). The Centiloid method provides cutoff values for all Aβ PET and provides clinicians with valuable diagnostic and prognostic data.
According to our analysis, Aβ PET can accurately diagnose normal and AD patients but cannot distinguish well between AD and MCI patients. The overall performance of Aβ PET in determining the conversion of MCI to AD was very average. In addition to the analysis of the diagnostic results we pooled, several other findings help us understand the significance of these differences. ApoE ε4 is one of the most prominent genotypes in AD development and impacts the levels of other biomarkers, such as Aβ42 in CSF. The probability of carrying the gene of ApoE ε4 is significantly higher in MCI and AD patients than in normal subjects (Lautner et al., 2014). The average cortical SUVR was higher in normal subjects who were ApoE ε4 gene carriers than in noncarriers; similarly, the SUVR was higher in APOE ε4‐carrying AD patients than in noncarriers (Fleisher, 2011). Therefore, it is highly likely that Aβ PET is more sensitive in diagnosing AD patients carrying the ApoE ε4 allele. In our clinical work, we should pay more attention to those APOE ε4 carriers who present with positive Aβ PET images but have atypical clinical manifestations and be cautious in making the diagnosis of exclusion of AD. Several distinctive findings may also offer the potential to improve diagnostic efficacy. Kerbage et al. (2015) found a significant correlation between the concentration of Aβ in the lens of the eye and SUVR values of Aβ PET images in the brain, suggesting the possibility of evaluating brain Aβ load or even diagnosing AD by eye Aβ content. Zhang et al. (2017) mentioned a high correlation between AD7c‐NTP levels in urine and Aβ load in the brain on 11C‐PIB PET imaging. The positive predictive value of AD7c‐NTP in urine for predicting Aβ deposition in AD and MCI was 91.7%, and the negative predictive value was 72.2%. In addition, we paid slight attention to the time parameters of PET image acquisition. Duration after 11C‐PIB injection to PET image acquisition may vary, but most studies range from 40 to 90 min. Ng et al. (2007) demonstrated by dynamic scanning that the result of the visual analysis of PET images acquired at 30 min postinjection of 11C‐PIB was practically the same as the quantitative analysis of PET images acquired at 90 min postinjection of 11C‐PIB. It may be suggested that brain PET images acquired after 30 min postinjection of 11C‐PIB meet the demands of visual diagnosis.
In recent years, several completely different mechanisms of AD pathogenesis have been proposed from the mainstream Aβ cascade theory. Lee et al. (2022) proposed that neuronal cell death occurs first, followed by extracellular Aβ plaque formation. Aβ plaques are the remains of dead neuronal cells mixed with β amyloid. In addition, by using SUVR values of Aβ PET to reflect the load of insoluble β amyloid in the brain compared to the content of soluble Aβ42 in CSF, researchers found that higher levels of soluble Aβ42 were associated with better neuropsychological function and larger hippocampal volumes (Sturchio et al., 2021). Therefore, soluble Aβ42 levels may be a more effective response to cognitive impairment than Aβ deposition. To date, many anti‐Aβ drugs have been developed that effectively reduce Aβ deposits but most have failed to stop cognitive degeneration or slow the progression (Avgerinos et al., 2021). These aforementioned findings may be evidence that does not support the mainstream hypothesis of Aβ toxicity. It is worth highlighting that aducanumab, which targets anti‐Aβ, has been approved by the FDA for marketing as a drug for treating AD. Some studies have shown that aducanumab benefits patients with AD, but its efficacy and safety still need further validation (Alexander et al., 2021; Tolar et al., 2020). The significant role of Aβ PET is to monitor the dynamics of Aβ load in the brain continuously and to establish a correlation with the patient's condition, thus providing a comprehensive assessment of drug efficacy.
Finally, the limitations of our study need to be mentioned. First, there is no doubt that the AD diagnosis by brain autopsy or brain biopsy is more reliable than any mental status examination and neuropsychological testing battery. Nevertheless, the reference standard for most of our included studies was the clinical diagnosis of mental status examinations. The clinical diagnosis of AD may be influenced to some extent by the subjectivity of the patient or physician and may have a certain probability of deviation from the true picture. More than 10% of clinically diagnosed AD lack pathological features; overall, 19.1% of clinically diagnosed AD have lower levels of 18F‐AV45 uptake than pathologically diagnosed AD, and 14.7% of clinically diagnosed AD patients do not have a retention of 18F‐AV45 (Fleisher, 2011; Ranginwala et al., 2008). As a result, those studies that used the clinical mental status examination as a reference standard had a significant impact on the assessment of the diagnostic efficacy of Aβ PET, greatly likely increasing the false positive and false negative rates. An additional pitfall is that, as shown in Figure 6, we included many studies with small samples, which may portend low stability of our results.
5. CONCLUSIONS
Overall, 11C‐PIB and 18F‐AV45 PET have high sensitivity and specificity for diagnosing AD, especially in distinguishing AD from healthy individuals. Aβ PET has slightly lower diagnostic efficacy in predicting the progression of MCI to AD but can provide highly valuable prognostic information for clinical purposes. The specificity of Aβ PET to distinguish AD from MCI is low, and the impact of progressive MCI should be considered in clinical applications. The diagnostic specificity of Aβ PET will be effectively improved when combined with the glucose metabolic features of brain 18F‐FDG PET images or the morphological manifestations of MRI.
AUTHOR CONTRIBUTIONS
Long Sun provided the ideas for this review, and Dan Ruan completed the analysis of the data and the writing of the manuscript. The search and inclusion of the literature were done by both authors.
CONFLICTS OF INTEREST
The authors have no conflicts of interest to declare relevant to this article's content.
FUNDING INFORMATION
This work was founded by the key medical and health projects in Xiamen (Grant Number: 3502Z20191104).
PEER REVIEW
The peer review history for this article is available at https://publons.com/publon/10.1002/brb3.2850.
Supporting information
Figure S1 Forest plots and SROC curves for AD versus NC subgroup
Figure S2 Forest plots and SROC curves for AD versus MCI subgroup
Figure S3 Forest plots and SROC curves for cMCI versus sMCI subgroup
Figure S4 Forest plots and SROC curves for 11C‐PIB PET subgroup
Figure S5 Forest plots and SROC curves for 18F‐AV45 PET subgroup
Figure S6 Forest plots and SROC curves for visual analysis subgroup
Figure S7 Forest plots and SROC curves for quantitative analysis subgroup
Ruan, D. , & Sun, L. (2023). Amyloid‐β PET in Alzheimer's disease: A systematic review and Bayesian meta‐analysis. Brain and Behavior, 13, e2850. 10.1002/brb3.2850
DATA AVAILABILITY STATEMENT
All data are presented in this article. All data analysis and figures plotting were performed using R language, and the detailed code and data for analysis can be provided by contacting the corresponding author.
REFERENCES
- Alzheimer's Association (2021). 2021 Alzheimer's disease facts and figures. Alzheimer's & Dementia, 17(3), 327–406. 10.1002/alz.12328 [DOI] [PubMed] [Google Scholar]
- Albert, M. S. , Dekosky, S. T. , Dickson, D. , Dubois, B. , Feldman, H. H. , Fox, N. C. , Gamst, A. , Holtzman, D. M. , Jagust, W. J. , Petersen, R. C. , Snyder, P. J. , Carrillo, M. C. , Thies, B. , & Phelps, C. H. (2011). The diagnosis of mild cognitive impairment due to Alzheimer's disease: Recommendations from the National Institute on Aging‐Alzheimer's Association workgroups on diagnostic guidelines for Alzheimer's disease. Alzheimer's & Dementia, 7(3), 270–279. 10.1016/j.jalz.2011.03.008 [DOI] [PMC free article] [PubMed] [Google Scholar]
- Alexander, G. C. , Emerson, S. , & Kesselheim, A. S. (2021). Evaluation of aducanumab for Alzheimer disease: Scientific evidence and regulatory review involving efficacy, safety, and futility. JAMA, 325(17), 1717–1718. 10.1001/jama.2021.3854 [DOI] [PubMed] [Google Scholar]
- Alvarez, I. , Aguilar, M. , Gonzalez, J. M. , Ysamat, M. , Lorenzo‐Bosquet, C. , Alonso, A. , Tartari, J. P. , Romero, S. , Diez‐Fairen, M. , Carcel, M. , Pujalte, F. , & Pastor, P. (2018). Clinic‐based validation of cerebrospinal fluid biomarkers with florbetapir PET for diagnosis of dementia. Journal of Alzheimer's Disease, 61(1), 135–143. 10.3233/JAD-170753 [DOI] [PubMed] [Google Scholar]
- Avgerinos, K. I. , Ferrucci, L. , & Kapogiannis, D. (2021). Effects of monoclonal antibodies against amyloid‐beta on clinical and biomarker outcomes and adverse event risks: A systematic review and meta‐analysis of phase III RCTs in Alzheimer's disease. Ageing Research Reviews, 68, 101339. 10.1016/j.arr.2021.101339 [DOI] [PMC free article] [PubMed] [Google Scholar]
- Ball, M. J. , Hachinski, V. , Fox, A. , Kirshen, A. J. , Fisman, M. , Blume, W. , Kral, V. A. , Fox, H. , & Merskey, H. (1985). A new definition of Alzheimer's disease: A hippocampal dementia. Lancet, 325(8419), 14–16. 10.1016/S0140-6736(85)90965-1 [DOI] [PubMed] [Google Scholar]
- Beach, T. G. , Schneider, J. A. , Sue, L. I. , Serrano, G. , Dugger, B. N. , Monsell, S. E. , & Kukull, W. (2014). Theoretical impact of florbetapir (18F) amyloid imaging on diagnosis of Alzheimer dementia and detection of preclinical cortical amyloid. Journal of Neuropathology and Experimental Neurology, 73(10), 948–953. 10.1097/NEN.0000000000000114 [DOI] [PMC free article] [PubMed] [Google Scholar]
- Ben Bouallegue, F. , Mariano‐Goulart, D. , Payoux, P. , & Alzheimer's Disease Neuroimaging I . (2017). Comparison of CSF markers and semi‐quantitative amyloid PET in Alzheimer's disease diagnosis and in cognitive impairment prognosis using the ADNI‐2 database. Alzheimer's Research & Therapy, 9(1), 32. 10.1186/s13195-017-0260-z [DOI] [PMC free article] [PubMed] [Google Scholar]
- Bossuyt, P. M. , Davenport, C. F. , Deeks, J. J. , Hyde, C. , Leeflang, M. M. , & Scholten, R. J. (2013). Cochrane handbook for systematic reviews of diagnostic test accuracy. [DOI] [PMC free article] [PubMed] [Google Scholar]
- Bourgeat, P. , Doré, V. , Fripp, J. , Ames, D. , Masters, C. L. , Salvado, O. , Villemagne, V. L. , & Rowe, C. C. (2018). Implementing the centiloid transformation for (11)C‐PiB and beta‐amyloid (18)F‐PET tracers using CapAIBL. NeuroImage, 183, 387–393. 10.1016/j.neuroimage.2018.08.044 [DOI] [PubMed] [Google Scholar]
- Brück, A. , Virta, J. R. , Koivunen, J. , Koikkalainen, J. , Scheinin, N. M. , Helenius, H. , Någren, K. , Helin, S. , Parkkola, R. , Viitanen, M. , & Rinne, J. O. (2013). [11C]PIB, [18F]FDG and MR imaging in patients with mild cognitive impairment. European Journal of Nuclear Medicine and Molecular Imaging, 40(10), 1567–1572. 10.1007/s00259-013-2478-8 [DOI] [PubMed] [Google Scholar]
- Bruscoli, M. , & Lovestone, S. (2004). Is MCI really just early dementia? A systematic review of conversion studies. International Psychogeriatrics, 16(2), 129–140. 10.1017/S1041610204000092 [DOI] [PubMed] [Google Scholar]
- Busse, A. , Hensel, A. , Guhne, U. , Angermeyer, M. C. , & Riedel‐Heller, S. G. (2006). Mild cognitive impairment: Long‐term course of four clinical subtypes. Neurology, 67(12), 2176–2185. 10.1212/01.wnl.0000249117.23318.e1 [DOI] [PubMed] [Google Scholar]
- Camus, V. , Payoux, P. , Barré, L. , Desgranges, B. , Voisin, T. , Tauber, C. , La Joie, R. , Tafani, M. , Hommet, C. , Chételat, G. , Mondon, K. , De La Sayette, V. , Cottier, J. P. , Beaufils, E. , Ribeiro, M. J. , Gissot, V. , Vierron, E. , Vercouillie, J. , Vellas, B. , … Guilloteau, D. (2012). Using PET with 18F‐AV‐45 (florbetapir) to quantify brain amyloid load in a clinical environment. European Journal of Nuclear Medicine and Molecular Imaging, 39(4), 621–631. 10.1007/s00259-011-2021-8 [DOI] [PMC free article] [PubMed] [Google Scholar]
- Chandra, A. , Valkimadi, P. E. , Pagano, G. , Cousins, O. , Dervenoulas, G. , & Politis, M. , Alzheimer's Disease Neuroimaging Initiative . (2019). Applications of amyloid, tau, and neuroinflammation PET imaging to Alzheimer's disease and mild cognitive impairment. Human Brain Mapping, 40(18), 5424–5442. 10.1002/hbm.24782 [DOI] [PMC free article] [PubMed] [Google Scholar]
- Chanisa, C. , Monchaya, N. , Anchisa, K. , Chetsadaporn, P. , & Attapon, J. (2021). Analysis of amyloid and tau deposition in Alzheimer's disease using (11)C‐Pittsburgh compound B and (18)F‐THK 5351 positron emission tomography imaging. World Journal of Nuclear Medicine, 20(1), 61–72. [DOI] [PMC free article] [PubMed] [Google Scholar]
- Chen, X. , Zhou, Y. , Wang, R. , Cao, H. , Reid, S. , Gao, R. , & Han, D. (2016). Potential clinical value of multiparametric PET in the prediction of Alzheimer's disease progression. PLoS One, 11(5), e0154406. 10.1371/journal.pone.0154406 [DOI] [PMC free article] [PubMed] [Google Scholar]
- Chui, H. , & Lee, A. (2003). Clinical criteria for dementia subtypes. In Qizilbash N., Schneider L., Chui H., Tariot P., Brodaty H., Kaye J. (Eds.), Evidence‐based dementia practice (pp. 106–119). Blackwell. [Google Scholar]
- Clark, C. M. , Pontecorvo, M. J. , Beach, T. G. , Bedell, B. J. , Coleman, R. E. , Doraiswamy, P. M. , Fleisher, A. S. , Reiman, E. M. , Sabbagh, M. N. , Sadowsky, C. H. , Schneider, J. A. , Arora, A. , Carpenter, A. P. , Flitter, M. L. , Joshi, A. D. , Krautkramer, M. J. , Lu, M. , Mintun, M. A. , & Skovronsky, D. M. (2012). Cerebral PET with florbetapir compared with neuropathology at autopsy for detection of neuritic amyloid‐beta plaques: A prospective cohort study. Lancet Neurology, 11(8), 669–678. 10.1016/S1474-4422(12)70142-4 [DOI] [PubMed] [Google Scholar]
- Dahmer, M. K. , Hart, P. M. , & Perlman, R. L. (1991). Insulin‐like growth factor‐I enhances tyrosine hydroxylase activation in bovine chromaffin cells. Journal of Neurochemistry, 57(4), 1347–1353. 10.1111/j.1471-4159.1991.tb08300.x [DOI] [PubMed] [Google Scholar]
- Dubois, B. , Feldman, H. H. , Jacova, C. , Dekosky, S. T. , Barberger‐Gateau, P. , Cummings, J. , Delacourte, A. , Galasko, D. , Gauthier, S. , Jicha, G. , Meguro, K. , O'brien, J. , Pasquier, F. , Robert, P. , Rossor, M. , Salloway, S. , Stern, Y. , Visser, P. J. , & Scheltens, P. (2007). Research criteria for the diagnosis of Alzheimer's disease: Revising the NINCDS‐ADRDA criteria. Lancet Neurology, 6(8), 734–746. 10.1016/S1474-4422(07)70178-3 [DOI] [PubMed] [Google Scholar]
- Dukart, J. , Sambataro, F. , & Bertolino, A. (2016). Accurate prediction of conversion to Alzheimer's disease using imaging, genetic, and neuropsychological biomarkers. Journal of Alzheimer's Disease, 49(4), 1143–1159. 10.3233/JAD-150570 [DOI] [PubMed] [Google Scholar]
- Duyckaerts, C. , Delatour, B. , & Potier, M. ‐C. (2009). Classification and basic pathology of Alzheimer disease. Acta Neuropathologica, 118(1), 5–36. 10.1007/s00401-009-0532-1 [DOI] [PubMed] [Google Scholar]
- Fleisher, A. S. (2011). Using positron emission tomography and florbetapir F18 to image cortical amyloid in patients with mild cognitive impairment or dementia due to Alzheimer disease. Archives of Neurology, 68(11), 1404–1411. 10.1001/archneurol.2011.150 [DOI] [PubMed] [Google Scholar]
- Frances, A. J. , First, M. B. , & Pincus, H. A. (1995). DSM-IV Guidebook. Washington, DC: American Psychiatric Press.
- Frisoni, G. B. , Fox, N. C. , Jack, C. R. , Scheltens, P. , & Thompson, P. M. (2010). The clinical use of structural MRI in Alzheimer disease. Nature reviews Neurology, 6(2), 67–77. 10.1038/nrneurol.2009.215 [DOI] [PMC free article] [PubMed] [Google Scholar]
- Hajiramezanali, M. , Atyabi, F. , Mosayebnia, M. , Akhlaghi, M. , Geramifar, P. , Jalilian, A. R. , Mazidi, S. M. , Yousefnia, H. , Shahhosseini, S. , & Beiki, D. (2019). (68)Ga‐radiolabeled bombesin‐conjugated to trimethyl chitosan‐coated superparamagnetic nanoparticles for molecular imaging: Preparation, characterization and biological evaluation. International Journal of Nanomedicine, 14, 2591–2605. 10.2147/IJN.S195223 [DOI] [PMC free article] [PubMed] [Google Scholar]
- Hatashita, S. , & Yamasaki, H. (2013). Diagnosed mild cognitive impairment due to Alzheimer's disease with PET biomarkers of beta amyloid and neuronal dysfunction. PLoS One, 8(6), e66877. 10.1371/journal.pone.0066877 [DOI] [PMC free article] [PubMed] [Google Scholar]
- Hatashita, S. , Yamasaki, H. , Suzuki, Y. , Tanaka, K. , Wakebe, D. , & Hayakawa, H. (2014). [18F]Flutemetamol amyloid‐beta PET imaging compared with [11C]PIB across the spectrum of Alzheimer's disease. European Journal of Nuclear Medicine and Molecular Imaging, 41(2), 290–300. 10.1007/s00259-013-2564-y [DOI] [PubMed] [Google Scholar]
- Herholz, K. , Salmon, E. , Perani, D. , Baron, J. C. , Holthoff, V. , Frolich, L. , Schönknecht, P. , Ito, K. , Mielke, R. , Kalbe, E. , Zündorf, G. , Delbeuck, X. , Pelati, O. , Anchisi, D. , Fazio, F. , Kerrouche, N. , Desgranges, B. , Eustache, F. , Beuthien‐Baumann, B. , … Heiss, W. D. (2002). Discrimination between Alzheimer dementia and controls by automated analysis of multicenter FDG PET. NeuroImage, 17(1), 302–316. 10.1006/nimg.2002.1208 [DOI] [PubMed] [Google Scholar]
- Hosokawa, C. , Ishii, K. , Hyodo, T. , Sakaguchi, K. , Usami, K. , Shimamoto, K. , Yamazoe, Y. , Hosono, M. , Hanada, K. , Ueda, M. , Saigo, K. , & Murakami, T. (2015). Investigation of (11)C‐PiB equivocal PET findings. Annals of Nuclear Medicine, 29(2), 164–169. 10.1007/s12149-014-0924-8 [DOI] [PubMed] [Google Scholar]
- Iaccarino, L. , Chiotis, K. , Alongi, P. , Almkvist, O. , Wall, A. , Cerami, C. , Bettinardi, V. , Gianolli, L. , Nordberg, A. , & Perani, D. (2017). A cross‐validation of FDG‐ and Amyloid‐PET biomarkers in mild cognitive impairment for the risk prediction to dementia due to Alzheimer's disease in a clinical setting. Journal of Alzheimer's Disease, 59(2), 603–614. 10.3233/JAD-170158 [DOI] [PubMed] [Google Scholar]
- Ikonomovic, M. D. , Klunk, W. E. , Abrahamson, E. E. , Mathis, C. A. , Price, J. C. , Tsopelas, N. D. , Lopresti, B. J. , Ziolko, S. , Bi, W. , Paljug, W. R. , Debnath, M. L. , Hope, C. E. , Isanski, B. A. , Hamilton, R. L. , & Dekosky, S. T. (2008). Post‐mortem correlates of in vivo PIB‐PET amyloid imaging in a typical case of Alzheimer's disease. Brain, 131(Pt 6), 1630–1645. 10.1093/brain/awn016 [DOI] [PMC free article] [PubMed] [Google Scholar]
- Jack, C. R. , Albert, M. S. , Knopman, D. S. , Mckhann, G. M. , Sperling, R. A. , Carrillo, M. C. , Thies, B. , & Phelps, C. H. (2011). Introduction to the recommendations from the National Institute on Aging‐Alzheimer's Association workgroups on diagnostic guidelines for Alzheimer's disease. Alzheimer's & Dementia, 7(3), 257–262. 10.1016/j.jalz.2011.03.004 [DOI] [PMC free article] [PubMed] [Google Scholar]
- Jack, C. R. , Knopman, D. S. , Jagust, W. J. , Petersen, R. C. , Weiner, M. W. , Aisen, P. S. , Shaw, L. M. , Vemuri, P. , Wiste, H. J. , Weigand, S. D. , Lesnick, T. G. , Pankratz, V. S. , Donohue, M. C. , & Trojanowski, J. Q. (2013). Tracking pathophysiological processes in Alzheimer's disease: An updated hypothetical model of dynamic biomarkers. Lancet Neurology, 12(2), 207–216. 10.1016/S1474-4422(12)70291-0 [DOI] [PMC free article] [PubMed] [Google Scholar]
- Jack, C. R. , Knopman, D. S. , Weigand, S. D. , Wiste, H. J. , Vemuri, P. , Lowe, V. , Kantarci, K. , Gunter, J. L. , Senjem, M. L. , Ivnik, R. J. , Roberts, R. O. , Rocca, W. A. , Boeve, B. F. , & Petersen, R. C. (2012). An operational approach to National Institute on Aging‐Alzheimer's Association criteria for preclinical Alzheimer disease. Annals of Neurology, 71(6), 765–775. 10.1002/ana.22628 [DOI] [PMC free article] [PubMed] [Google Scholar]
- Jureus, A. , Swahn, B.‐M. , Sandell, J. , Jeppsson, F. , Johnson, A. E. , Johnstrom, P. , Neelissen, J. A. M. , Sunnemark, D. , Farde, L. , & Svensson, S. P. S. (2010). Characterization of AZD4694, a novel fluorinated Abeta plaque neuroimaging PET radioligand. Journal of Neurochemistry, 114(3), 784–794. 10.1111/j.1471-4159.2010.06812.x [DOI] [PubMed] [Google Scholar]
- Kaneko, N. , Nakamura, A. , Washimi, Y. , Kato, T. , Sakurai, T. , Arahata, Y. , Bundo, M. , Takeda, A. , Niida, S. , Ito, K. , Toba, K. , Tanaka, K. , & Yanagisawa, K. (2014). Novel plasma biomarker surrogating cerebral amyloid deposition. Proceedings of the Japan Academy Series B: Physical and Biological Sciences, 90(9), 353–364. 10.2183/pjab.90.353 [DOI] [PMC free article] [PubMed] [Google Scholar]
- Kerbage, C. , Sadowsky, C. H. , Tariot, P. N. , Agronin, M. , Alva, G. , Turner, F. D. , Nilan, D. , Cameron, A. , Cagle, G. D. , & Hartung, P. D. (2015). Detection of amyloid beta signature in the lens and its correlation in the brain to aid in the diagnosis of Alzheimer's disease. American Journal of Alzheimer's Disease and Other Dementias, 30(8), 738–745. 10.1177/1533317513520214 [DOI] [PMC free article] [PubMed] [Google Scholar]
- Kitajima, K. , Abe, K. , Takeda, M. , Yoshikawa, H. , Ohigashi, M. , Osugi, K. , Koyama, H. , & Yamakado, K. (2021). Clinical impact of 11C‐Pittsburgh compound‐B positron emission tomography in addition to magnetic resonance imaging and single‐photon emission computed tomography on diagnosis of mild cognitive impairment to Alzheimer's disease. Medicine, 100(3), e23969. 10.1097/MD.0000000000023969 [DOI] [PMC free article] [PubMed] [Google Scholar]
- Kljajevic, V. , Grothe, M. J. , Ewers, M. , & Teipel, S. (2014). Alzheimer's disease neuroimaging I. Distinct pattern of hypometabolism and atrophy in preclinical and predementia Alzheimer's disease. Neurobiology of Aging, 35(9), 1973–1981. 10.1016/j.neurobiolaging.2014.04.006 [DOI] [PubMed] [Google Scholar]
- Klunk, W. E. , Koeppe, R. A. , Price, J. C. , Benzinger, T. L. , Devous, M. D. , Jagust, W. J. , Johnson, K. A. , Mathis, C. A. , Minhas, D. , Pontecorvo, M. J. , Rowe, C. C. , Skovronsky, D. M. , & Mintun, M. A. (2015). The centiloid project: Standardizing quantitative amyloid plaque estimation by PET. Alzheimer's & Dementia, 11(1), 1–15. e11–14. 10.1016/j.jalz.2014.07.003 [DOI] [PMC free article] [PubMed] [Google Scholar]
- La Joie, R. , Ayakta, N. , Seeley, W. W. , Borys, E. , Boxer, A. L. , Decarli, C. , Doré, V. , Grinberg, L. T. , Huang, E. , Hwang, J. H. , Ikonomovic, M. D. , Jack, C. , Jagust, W. J. , Jin, L. W. , Klunk, W. E. , Kofler, J. , Lesman‐Segev, O. H. , Lockhart, S. N. , Lowe, V. J. , … Rabinovici, G. D. (2019). Multisite study of the relationships between antemortem [(11)C]PIB‐PET centiloid values and postmortem measures of Alzheimer's disease neuropathology. Alzheimer's & Dementia, 15(2), 205–216. 10.1016/j.jalz.2018.09.001 [DOI] [PMC free article] [PubMed] [Google Scholar]
- Landau, S. M. , Thomas, B. A. , Thurfjell, L. , Schmidt, M. , Margolin, R. , Mintun, M. , Pontecorvo, M. , Baker, S. L. , & Jagust, W. J. (2014). Amyloid PET imaging in Alzheimer's disease: A comparison of three radiotracers. European Journal of Nuclear Medicine and Molecular Imaging, 41(7), 1398–1407. 10.1007/s00259-014-2753-3 [DOI] [PMC free article] [PubMed] [Google Scholar]
- Lautner, R. , Palmqvist, S. , Mattsson, N. , Andreasson, U. , Wallin, A. , Pålsson, E. , Jakobsson, J. , Herukka, S.‐K. , Owenius, R. , Olsson, B. , Hampel, H. , Rujescu, D. , Ewers, M. , Landén, M. , Minthon, L. , Blennow, K. , Zetterberg, H. , & Hansson, O. (2014). Apolipoprotein E genotype and the diagnostic accuracy of cerebrospinal fluid biomarkers for Alzheimer disease. JAMA Psychiatry, 71(10), 1183–1191. 10.1001/jamapsychiatry.2014.1060 [DOI] [PubMed] [Google Scholar]
- Lee, J ‐H. , Yang, D.‐S. , Goulbourne, C. N. , Im, E. , Stavrides, P. , Pensalfini, A. , Chan, H. , Bouchet‐Marquis, C. , Bleiwas, C. , Berg, M. J. , Huo, C. , Peddy, J. , Pawlik, M. , Levy, E. , Rao, M. , Staufenbiel, M. , & Nixon, R. A. (2022). Faulty autolysosome acidification in Alzheimer's disease mouse models induces autophagic build‐up of Abeta in neurons, yielding senile plaques. Nature Neuroscience, 25(6), 688–701. 10.1038/s41593-022-01084-8 [DOI] [PMC free article] [PubMed] [Google Scholar]
- Lesman‐Segev, O. H. , La Joie, R. , Iaccarino, L. , Lobach, I. , Rosen, H. J. , Seo, S. W. , Janabi, M. , Baker, S. L. , Edwards, L. , Pham, J. , Olichney, J. , Boxer, A. , Huang, E. , Gorno‐Tempini, M. , Decarli, C. , Hepker, M. , Hwang, J. H. L. , Miller, B. L. , Spina, S. , … Rabinovici, G. D. (2021). Diagnostic accuracy of amyloid versus (18) F‐fluorodeoxyglucose positron emission tomography in autopsy‐confirmed dementia. Annals of Neurology, 89(2), 389–401. 10.1002/ana.25968 [DOI] [PMC free article] [PubMed] [Google Scholar]
- Li, Q. ‐X. , Villemagne, V. L. , Doecke, J. D. , Rembach, A. , Sarros, S. , Varghese, S. , Mcglade, A. , Laughton, K. M. , Pertile, K. K. , Fowler, C. J. , Rumble, R. L. , Trounson, B. O. , Taddei, K. , Rainey‐Smith, S. R. , Laws, S. M. , Robertson, J. S. , Evered, L. A. , Silbert, B. , Ellis, K. A. , … Collins, S. (2015). Alzheimer's disease normative cerebrospinal fluid biomarkers validated in PET amyloid‐beta characterized subjects from the Australian imaging, biomarkers and lifestyle (AIBL) study. Journal of Alzheimer's Disease, 48(1), 175–187. 10.3233/JAD-150247 [DOI] [PubMed] [Google Scholar]
- Li, W. ‐W. , Shen, Y. ‐Y. , Tian, D. ‐Y. , Bu, X. ‐L , Zeng, F. , Liu, Y. ‐H. , Chen, Y. , Yao, X. ‐Q. , Li, H. ‐Y. , Chen, D. ‐W. , Zhou, F. ‐Y. , Yang, H. , Li, Q. ‐M. , Bao, W. ‐Q. , Guan, Y. ‐H. , Zhou, H. ‐D. , Jin, R. ‐B. , & Wang, Y. ‐J. (2019). Brain amyloid‐beta deposition and blood biomarkers in patients with clinically diagnosed Alzheimer's disease. Journal of Alzheimer's Disease, 69(1), 169–178. 10.3233/JAD-190056 [DOI] [PubMed] [Google Scholar]
- Ly, J. V. , Donnan, G. A. , Villemagne, V. L. , Zavala, J. A. , Ma, H. , O'keefe, G. , Gong, S. J. , Gunawan, R. M. , Saunder, T. , Ackerman, U. , Tochon‐Danguy, H. , Churilov, L. , Phan, T. G. , & Rowe, C. C. (2010). 11C‐PIB binding is increased in patients with cerebral amyloid angiopathy‐related hemorrhage. Neurology, 74(6), 487–493. 10.1212/WNL.0b013e3181cef7e3 [DOI] [PubMed] [Google Scholar]
- Markesbery, W. R. (1997). Neuropathological criteria for the diagnosis of Alzheimer's disease. Neurobiology of Aging, 18(4), S13–S19. 10.1016/S0197-4580(97)00064-X [DOI] [PubMed] [Google Scholar]
- Mattsson, N. , Insel, P. S. , Landau, S. , Jagust, W. , Donohue, M. , Shaw, L. M. , Trojanowski, J. Q. , Zetterberg, H. , Blennow, K. , & Weiner, M. (2014). Diagnostic accuracy of CSF Ab42 and florbetapir PET for Alzheimer's disease. Annals of Clinical and Translational Neurology, 1(8), 534–543. 10.1002/acn3.81 [DOI] [PMC free article] [PubMed] [Google Scholar]
- Mckhann, G. , Drachman, D. , Folstein, M. , Katzman, R. , Price, D. , & Stadlan, E. M. (1984). Clinical diagnosis of Alzheimer's disease: Report of the NINCDS‐ADRDA Work Group under the auspices of department of health and human services task force on Alzheimer's disease. Neurology, 34(7), 939–944. 10.1212/WNL.34.7.939 [DOI] [PubMed] [Google Scholar]
- Mielke, M. M. , Hagen, C. E. , Xu, J. , Chai, X. , Vemuri, P. , Lowe, V. J. , Airey, D. C. , Knopman, D. S. , Roberts, R. O. , Machulda, M. M. , Jack, C. R. , Petersen, R. C. , & Dage, J. L. (2018). Plasma phospho‐tau181 increases with Alzheimer's disease clinical severity and is associated with tau‐ and amyloid‐positron emission tomography. Alzheimer's & Dementia, 14(8), 989–997. 10.1016/j.jalz.2018.02.013 [DOI] [PMC free article] [PubMed] [Google Scholar]
- Mikhno, A. , Nuevo, P. M. , Devanand, D. P. , Parsey, R. V. , & Laine, A. F. (2012). Multimodal classification of dementia using functional data, anatomical features and 3d invariant shape descriptors. Proceedings IEEE International Symposium on Biomedical Imaging, 606–609. 10.1109/ISBI.2012.6235621 [DOI] [PMC free article] [PubMed] [Google Scholar]
- Mirra, S. S. , Heyman, A. , Mckeel, D. , Sumi, S. M. , Crain, B. J. , Brownlee, L. M. , Vogel, F. S. , Hughes, J. P. , Belle, G. V. , & Berg, L. (1991). The Consortium to Establish a Registry for Alzheimer's Disease (CERAD). Part II. Standardization of the neuropathologic assessment of Alzheimer's disease. Neurology, 41(4), 479–486. 10.1212/WNL.41.4.479 [DOI] [PubMed] [Google Scholar]
- Morris, E. , Chalkidou, A. , Hammers, A. , Peacock, J. , Summers, J. , & Keevil, S. (2016). Diagnostic accuracy of (18)F amyloid PET tracers for the diagnosis of Alzheimer's disease: A systematic review and meta‐analysis. European Journal of Nuclear Medicine and Molecular Imaging, 43(2), 374–385. 10.1007/s00259-015-3228-x [DOI] [PMC free article] [PubMed] [Google Scholar]
- Nelissen, N. , Van Laere, K. , Thurfjell, L. , Owenius, R. , Vandenbulcke, M. , Koole, M. , Bormans, G. , Brooks, D. J. , & Vandenberghe, R. (2009). Phase 1 study of the Pittsburgh compound B derivative 18F‐flutemetamol in healthy volunteers and patients with probable Alzheimer disease. Journal of Nuclear Medicine, 50(8), 1251–1259. 10.2967/jnumed.109.063305 [DOI] [PubMed] [Google Scholar]
- Newberg, A. B. , Arnold, S. E. , Wintering, N. , Rovner, B. W. , & Alavi, A. (2012). Initial clinical comparison of 18F‐florbetapir and 18F‐FDG PET in patients with Alzheimer disease and controls. Journal of Nuclear Medicine, 53(6), 902–907. 10.2967/jnumed.111.099606 [DOI] [PubMed] [Google Scholar]
- Ng, S. , Villemagne, V. L. , Berlangieri, S. , Lee, S.‐T. , Cherk, M. , Gong, S. J. , Ackermann, U. , Saunder, T. , Tochon‐Danguy, H. , Jones, G. , Smith, C. , O'keefe, G. , Masters, C. L. , & Rowe, C. C. (2007). Visual assessment versus quantitative assessment of 11C‐PIB PET and 18F‐FDG PET for detection of Alzheimer's disease. Journal of Nuclear Medicine, 48(4), 547–552. 10.2967/jnumed.106.037762 [DOI] [PubMed] [Google Scholar]
- Okello, A. , Koivunen, J. , Edison, P. , Archer, H. A. , Turkheimer, F. E. , Någren, K. , Bullock, R. , Walker, Z. , Kennedy, A. , Fox, N. C. , Rossor, M. N. , Rinne, J. O. , & Brooks, D. J. (2009). Conversion of amyloid positive and negative MCI to AD over 3 years: An 11C‐PIB PET study. Neurology, 73(10), 754–760. 10.1212/WNL.0b013e3181b23564 [DOI] [PMC free article] [PubMed] [Google Scholar]
- Oliveira, F. , Leuzy, A. , Castelhano, J. , Chiotis, K. , Hasselbalch, S. G. , Rinne, J. , Mendonã§A, A. , Otto, M. , Lleó, A. , Santana, I. , Johansson, J. , Anderl‐Straub, S. , Arnim, C. , Beer, A. , Blesa, R. , Fortea, J. , Sanna‐Kaisa, H. , Portelius, E. , Pannee, J. , … Castelo‐Branco, M. (2018). Data driven diagnostic classification in Alzheimer's disease based on different reference regions for normalization of PIB‐PET images and correlation with CSF concentrations of Abeta species. NeuroImage: Clinical, 20, 603–610. 10.1016/j.nicl.2018.08.023 [DOI] [PMC free article] [PubMed] [Google Scholar]
- Ottoy, J. , Niemantsverdriet, E. , Verhaeghe, J. , De Roeck, E. , Struyfs, H. , Somers, C. , Wyffels, L. , Ceyssens, S. , Van Mossevelde, S. , Van Den Bossche, T. , Van Broeckhoven, C. , Ribbens, A. , Bjerke, M. , Stroobants, S. , Engelborghs, S. , & Staelens, S. (2019). Association of short‐term cognitive decline and MCI‐to‐AD dementia conversion with CSF, MRI, amyloid‐ and (18)F‐FDG‐PET imaging. NeuroImage: Clinical, 22, 101771. 10.1016/j.nicl.2019.101771 [DOI] [PMC free article] [PubMed] [Google Scholar]
- Page, M. J. , Mckenzie, J. E. , Bossuyt, P. M. , Boutron, I. , Hoffmann, T. C. , Mulrow, C. D. , Shamseer, L. , Tetzlaff, J. M. , Akl, E. A. , Brennan, S. E. , Chou, R. , Glanville, J. , Grimshaw, J. M. , Hrã3Bjartsson, A. R. , Lalu, M. M. , Li, T. , Loder, E. W. , Mayo‐Wilson, E. , Mcdonald, S. , … Moher, D. (2021). The PRISMA 2020 statement: An updated guideline for reporting systematic reviews. BMJ, 372, n71. 10.1136/bmj.n71 [DOI] [PMC free article] [PubMed] [Google Scholar]
- Park, J. ‐C. , Han, S. ‐H. , Lee, H. , Jeong, H. , Byun, M. S. , Bae, J. , Kim, H. , Lee, D. Y. , Yi, D. , Shin, S. A. , Kim, Y. K. , Hwang, D. , Lee, S. ‐W. , & Mook‐Jung, I. (2019). Prognostic plasma protein panel for Abeta deposition in the brain in Alzheimer's disease. Progress in Neurobiology, 183, 101690. 10.1016/j.pneurobio.2019.101690 [DOI] [PubMed] [Google Scholar]
- Park, J. ‐C. , Jung, K. S. , Kim, J. , Jang, J. S. , Kwon, S. , Byun, M. S. , Yi, D. , Byeon, G. , Jung, G. , Kim, Y. K. , Lee, D. Y. , Han, S. ‐H. , & Mook‐Jung, I. (2021). Performance of the QPLEX Alz plus assay, a novel multiplex kit for screening cerebral amyloid deposition. Alzheimer's Research & Therapy, 13(1), 12. 10.1186/s13195-020-00751-x [DOI] [PMC free article] [PubMed] [Google Scholar]
- Peretti, D. E. , Vallez Garcia, D. , Reesink, F. E. , Doorduin, J. , De Jong, B. M. , De Deyn, P. P. , Dierckx, R. A. J. O. , & Boellaard, R. (2019). Diagnostic performance of regional cerebral blood flow images derived from dynamic PIB scans in Alzheimer's disease. EJNMMI Research, 9(1), 59. 10.1186/s13550-019-0528-3 [DOI] [PMC free article] [PubMed] [Google Scholar]
- Price, J. L. , & Morris, J. C. (1999). Tangles and plaques in nondemented aging and “preclinical” Alzheimer's disease. Annals of Neurology, 45(3), 358–368. [DOI] [PubMed] [Google Scholar]
- Rabinovici, G. D. , Rosen, H. J. , Alkalay, A. , Kornak, J. , Furst, A. J. , Agarwal, N. , Mormino, E. C. , O'neil, J. P. , Janabi, M. , Karydas, A. , Growdon, M. E. , Jang, J. Y. , Huang, E. J. , Dearmond, S. J. , Trojanowski, J. Q. , Grinberg, L. T. , Gorno‐Tempini, M. L. , Seeley, W. W. , Miller, B. L. , & Jagust, W. J. (2011). Amyloid vs FDG‐PET in the differential diagnosis of AD and FTLD. Neurology, 77(23), 2034–2042. 10.1212/WNL.0b013e31823b9c5e [DOI] [PMC free article] [PubMed] [Google Scholar]
- Ranginwala, N. A. , Hynan, L. S. , Weiner, M. F. , & White, C. L. (2008). Clinical criteria for the diagnosis of Alzheimer disease: Still good after all these years. American Journal of Geriatric Psychiatry, 16(5), 384–388. 10.1097/JGP.0b013e3181629971 [DOI] [PubMed] [Google Scholar]
- Rowe, C. C. , Jones, G. , Doré, V. , Pejoska, S. , Margison, L. , Mulligan, R. S. , Chan, J. G. , Young, K. , & Villemagne, V. L. (2016). Standardized expression of 18F‐NAV4694 and 11C‐PiB beta‐Amyloid PET results with the Centiloid scale. Journal of Nuclear Medicine, 57(8), 1233–1237. 10.2967/jnumed.115.171595 [DOI] [PubMed] [Google Scholar]
- Saint‐Aubert, L. , Nemmi, F. , Péran, P. , Barbeau, E. J. , Payoux, P. , Chollet, F. , & Pariente, J. (2014). Comparison between PET template‐based method and MRI‐based method for cortical quantification of florbetapir (AV‐45) uptake in vivo. European Journal of Nuclear Medicine and Molecular Imaging, 41(5), 836–843. 10.1007/s00259-013-2656-8 [DOI] [PMC free article] [PubMed] [Google Scholar]
- Schreiber, S. , Landau, S. M. , Fero, A. , Schreiber, F. , & Jagust, W. J. (2015). Alzheimer's disease neuroimaging I. Comparison of visual and quantitative florbetapir f 18 positron emission tomography analysis in predicting mild cognitive impairment outcomes. JAMA Neurology, 72(10), 1183–1190. 10.1001/jamaneurol.2015.1633 [DOI] [PubMed] [Google Scholar]
- Seo, S. W. , Ayakta, N. , Grinberg, L. T. , Villeneuve, S. , Lehmann, M. , Reed, B. , Decarli, C. , Miller, B. L. , Rosen, H. J. , Boxer, A. L. , O'Neil, J. P. , Jin, L.‐W. , Seeley, W. W. , Jagust, W. J. , & Rabinovici, G. D. (2017). Regional correlations between [(11)C]PIB PET and post‐mortem burden of amyloid‐beta pathology in a diverse neuropathological cohort. NeuroImage: Clinical, 13, 130–137. 10.1016/j.nicl.2016.11.008 [DOI] [PMC free article] [PubMed] [Google Scholar]
- Shaffer, J. L. , Petrella, J. R. , Sheldon, F. C. , Choudhury, K. R. , Calhoun, V. D. , Coleman, R. E. , & Doraiswamy, P. M. , Alzheimer's Disease Neuroimaging Initiative . (2013). Predicting cognitive decline in subjects at risk for Alzheimer disease by using combined cerebrospinal fluid, MR imaging, and PET biomarkers. Radiology, 266(2), 583–591. 10.1148/radiol.12120010 [DOI] [PMC free article] [PubMed] [Google Scholar]
- Sperling, R. A. , Aisen, P. S. , Beckett, L. A. , Bennett, D. A. , Craft, S. , Fagan, A. M. , Iwatsubo, T. , Jack, C. R. , Kaye, J. , Montine, T. J. , Park, D. C. , Reiman, E. M. , Rowe, C. C. , Siemers, E. , Stern, Y. , Yaffe, K. , Carrillo, M. C. , Thies, B. , Morrison‐Bogorad, M. , … Phelps, C. H. (2011). Toward defining the preclinical stages of Alzheimer's disease: Recommendations from the National Institute on Aging‐Alzheimer's Association workgroups on diagnostic guidelines for Alzheimer's disease. Alzheimer's & Dementia, 7(3), 280–292. 10.1016/j.jalz.2011.03.003 [DOI] [PMC free article] [PubMed] [Google Scholar]
- Sturchio, A. , Dwivedi, A. K. , Young, C. B. , Malm, T. , Marsili, L. , Sharma, J. S. , Mahajan, A. , Hill, E. J. , Andaloussi, S. E. , Poston, K. L. , Manfredsson, F. P. , Schneider, L. S. , Ezzat, K. , & Espay, A. J. (2021). High cerebrospinal amyloid‐beta 42 is associated with normal cognition in individuals with brain amyloidosis. eClinicalMedicine, 38, 100988. 10.1016/j.eclinm.2021.100988 [DOI] [PMC free article] [PubMed] [Google Scholar]
- Svedberg, M. M. , Hall, H. , Hellstrom‐Lindahl, E. , Estrada, S. , Guan, Z. , Nordberg, A. , & Långström, B. (2009). [(11)C]PIB‐amyloid binding and levels of Abeta40 and Abeta42 in postmortem brain tissue from Alzheimer patients. Neurochemistry International, 54(5–6), 347–357. 10.1016/j.neuint.2008.12.016 [DOI] [PubMed] [Google Scholar]
- Takahashi, R. , Ishii, K. , & Yokoyama, K. , For The Alzheimer SDNIEY . (2017). Validation of a new imaging technique using the glucose metabolism to amyloid deposition ratio in the diagnosis of Alzheimer's disease. Current Alzheimer Research, 14(2), 161–168. 10.2174/1567205013666160620122346 [DOI] [PubMed] [Google Scholar]
- Tolar, M. , Abushakra, S. , Hey, J. A. , Porsteinsson, A. , & Sabbagh, M. (2020). Aducanumab, gantenerumab, BAN2401, and ALZ‐801‐the first wave of amyloid‐targeting drugs for Alzheimer's disease with potential for near term approval. Alzheimer's Research & Therapy, 12(1), 95. 10.1186/s13195-020-00663-w [DOI] [PMC free article] [PubMed] [Google Scholar]
- Tolboom, N. , Van Der Flier, W. M. , Boverhoff, J. , Yaqub, M. , Wattjes, M. P. , Raijmakers, P. G. , Barkhof, F. , Scheltens, P. , Herholz, K. , Lammertsma, A. A. , & Van Berckel, B. N. M. (2010). Molecular imaging in the diagnosis of Alzheimer's disease: Visual assessment of [11C]PIB and [18F]FDDNP PET images. Journal of Neurology, Neurosurgery, and Psychiatry, 81(8), 882–884. 10.1136/jnnp.2009.194779 [DOI] [PubMed] [Google Scholar]
- Trzepacz, P. T. , Yu, P. , Sun, J. , Schuh, K. , Case, M. , Witte, M. M. , Hochstetler, H. , & Hake, A. (2014). Comparison of neuroimaging modalities for the prediction of conversion from mild cognitive impairment to Alzheimer's dementia. Neurobiology of Aging, 35(1), 143–151. 10.1016/j.neurobiolaging.2013.06.018 [DOI] [PubMed] [Google Scholar]
- Tzen, K. ‐Y. , Yang, S. ‐Y. , Chen, T. ‐F. , Cheng, T. ‐W. , Horng, H. ‐E. , Wen, H. ‐P. , Huang, Y. ‐Y. , Shiue, C. ‐Y. , & Chiu, M. ‐J. (2014). Plasma Abeta but not tau is related to brain PIB retention in early Alzheimer's disease. ACS Chemical Neuroscience, 5(9), 830–836. 10.1021/cn500101j [DOI] [PubMed] [Google Scholar]
- Vandenberghe, R. , Van Laere, K. , Ivanoiu, A. , Salmon, E. , Bastin, C. , Triau, E. , Hasselbalch, S. , Law, I. , Andersen, A. , Korner, A. , Minthon, L. , Garraux, G. , Nelissen, N. , Bormans, G. , Buckley, C. , Owenius, R. , Thurfjell, L. , Farrar, G. , & Brooks, D. J. (2010). 18F‐flutemetamol amyloid imaging in Alzheimer disease and mild cognitive impairment: A phase 2 trial. Annals of Neurology, 68(3), 319–329. 10.1002/ana.22068 [DOI] [PubMed] [Google Scholar]
- Villemagne, V. L. , Ong, K. , Mulligan, R. S. , Holl, G. , Pejoska, S. , Jones, G. , O'keefe, G. , Ackerman, U. , Tochon‐Danguy, H. , Chan, J. G. , Reininger, C. B. , Fels, L. , Putz, B. , Rohde, B. , Masters, C. L. , & Rowe, C. C. (2011). Amyloid imaging with (18)F‐florbetaben in Alzheimer disease and other dementias. Journal of Nuclear Medicine, 52(8), 1210–1217. 10.2967/jnumed.111.089730 [DOI] [PubMed] [Google Scholar]
- Villeneuve, S. , Rabinovici, G. D. , Cohn‐Sheehy, B. I. , Madison, C. , Ayakta, N. , Ghosh, P. M. , La Joie, R. , Arthur‐Bentil, S. K. , Vogel, J. W. , Marks, S. M. , Lehmann, M. , Rosen, H. J. , Reed, B. , Olichney, J. , Boxer, A. L. , Miller, B. L. , Borys, E. , Jin, L. ‐W. , Huang, E. J. , … Jagust, W. (2015). Existing Pittsburgh Compound‐B positron emission tomography thresholds are too high: Statistical and pathological evaluation. Brain, 138(Pt 7), 2020–2033. 10.1093/brain/awv112 [DOI] [PMC free article] [PubMed] [Google Scholar]
- Wang, M. J. , Yi, S. , Han, J. ‐Y. , Park, S. Y. , Jang, J. ‐W. , Chun, I. K. , Giau, V. V. , Bagyinszky, E. , Lim, K. T. , Kang, S. M. , An, S. S. A. , Park, Y. H. , Youn, Y. C. , & Kim, S. (2016). Analysis of cerebrospinal fluid and [11C]PIB PET biomarkers for Alzheimer's disease with updated protocols. Journal of Alzheimer's Disease, 52(4), 1403–1413. 10.3233/JAD-160143 [DOI] [PubMed] [Google Scholar]
- Wang, P. , Chen, K. , Yao, L. , Hu, B. , Wu, X. , Zhang, J. , Ye, Q. , & Guo, X. (2016). Multimodal classification of mild cognitive impairment based on partial least squares. Journal of Alzheimer's Disease, 54(1), 359–371. 10.3233/JAD-160102 [DOI] [PubMed] [Google Scholar]
- Ward, A. , Tardiff, S. , Dye, C. , & Arrighi, H. M. (2013). Rate of conversion from prodromal Alzheimer's disease to Alzheimer's dementia: A systematic review of the literature. Dementia and Geriatric Cognitive Disorders Extra, 3(1), 320–332. 10.1159/000354370 [DOI] [PMC free article] [PubMed] [Google Scholar]
- Whiting, P. F. , & QUADAS‐2 Group . (2011). QUADAS‐2: A revised tool for the quality assessment of diagnostic accuracy studies. Annals of Internal Medicine, 155(8), 529–536. 10.7326/0003-4819-155-8-201110180-00009 [DOI] [PubMed] [Google Scholar]
- Xu, L. , Wu, X. , Li, R. , Chen, K. , Long, Z. , Zhang, J. , Guo, X. , & Yao, L. (2016). Prediction of progressive mild cognitive impairment by multi‐modal neuroimaging biomarkers. Journal of Alzheimer's Disease, 51(4), 1045–1056. 10.3233/JAD-151010 [DOI] [PubMed] [Google Scholar]
- Yang, L. , Rieves, D. , & Ganley, C. (2012). Brain amyloid imaging—FDA approval of florbetapir F18 injection. New England Journal of Medicine, 367(10), 885–887. 10.1056/NEJMp1208061 [DOI] [PubMed] [Google Scholar]
- Yuan, Y. , Gu, Z. ‐X. , & Wei, W. ‐S. (2009). Fluorodeoxyglucose‐positron‐emission tomography, single‐photon emission tomography, and structural MR imaging for prediction of rapid conversion to Alzheimer disease in patients with mild cognitive impairment: A meta‐analysis. AJNR American Journal of Neuroradiology, 30(2), 404–410. 10.3174/ajnr.A1357 [DOI] [PMC free article] [PubMed] [Google Scholar]
- Zhang, N. , Zhang, L. , Li, Y. , Gordon, M. L. , Cai, L. , Wang, Y. , Xing, M. , & Cheng, Y. (2017). Urine AD7c‐NTP predicts amyloid deposition and symptom of agitation in patients with Alzheimer's disease and mild cognitive impairment. Journal of Alzheimer's Disease, 60(1), 87–95. 10.3233/JAD-170383 [DOI] [PMC free article] [PubMed] [Google Scholar]
- Zhang, S. , Han, D. , Tan, X. , Feng, J. , Guo, Y. , & Ding, Y. (2012). Diagnostic accuracy of 18 F‐FDG and 11 C‐PIB‐PET for prediction of short‐term conversion to Alzheimer's disease in subjects with mild cognitive impairment. International Journal of Clinical Practice, 66(2), 185–198. 10.1111/j.1742-1241.2011.02845.x [DOI] [PubMed] [Google Scholar]
- Zwan, M. D. , Rinne, J. O. , Hasselbalch, S. G. , Nordberg, A. , Lleó, A. , Herukka, S.‐K. , Soininen, H. , Law, I. , Bahl, J. M. C. , Carter, S. F. , Fortea, J. , Blesa, R. , Teunissen, C. E. , Bouwman, F. H. , Van Berckel, B. N. M. , & Visser, P. J. (2016). Use of amyloid‐PET to determine cutpoints for CSF markers: A multicenter study. Neurology, 86(1), 50–58. 10.1212/WNL.0000000000002081 [DOI] [PMC free article] [PubMed] [Google Scholar]
Associated Data
This section collects any data citations, data availability statements, or supplementary materials included in this article.
Supplementary Materials
Figure S1 Forest plots and SROC curves for AD versus NC subgroup
Figure S2 Forest plots and SROC curves for AD versus MCI subgroup
Figure S3 Forest plots and SROC curves for cMCI versus sMCI subgroup
Figure S4 Forest plots and SROC curves for 11C‐PIB PET subgroup
Figure S5 Forest plots and SROC curves for 18F‐AV45 PET subgroup
Figure S6 Forest plots and SROC curves for visual analysis subgroup
Figure S7 Forest plots and SROC curves for quantitative analysis subgroup
Data Availability Statement
All data are presented in this article. All data analysis and figures plotting were performed using R language, and the detailed code and data for analysis can be provided by contacting the corresponding author.