

PURPOSE
To evaluate whether a custom programmatic workflow manager reduces reporting turnaround times (TATs) from a body oncologic imaging workflow at a tertiary cancer center.
METHODS
A custom software program was developed and implemented in the programming language R. Other aspects of the workflow were left unchanged. TATs were measured over a 12-month period (June-May). The same prior 12-month period served as a historical control. Median TATs of magnetic resonance imaging (MRI) and computed tomography (CT) examinations were compared with a Wilcoxon test. A chi-square test was used to compare the numbers of examinations reported within 24 hours and after 72 hours as well as the proportions of examinations assigned according to individual radiologist preferences.
RESULTS
For all MRI and CT examinations (124,507 in 2019/2020 and 138,601 in 2020/2021), the median TAT decreased from 4 (interquartile range: 1-22 hours) to 3 hours (1-17 hours). Reports completed within 24 hours increased from 78% (124,127) to 89% (138,601). For MRI, TAT decreased from 22 (5-49 hours) to 8 hours (2-21 hours), and reports completed within 24 hours increased from 55% (14,211) to 80% (23,744). For CT, TAT decreased from 3 (1-19 hours) to 2 hours (1-13 hours), and reports completed within 24 hours increased from 84% (82,342) to 92% (99,922). Delayed reports (with a TAT > 72 hours) decreased from 17.0% (4,176) to 2.2% (649) for MRI and from 2.5% (2,500) to 0.7% (745) for CT. All differences were statistically significant (P < .001).
CONCLUSION
The custom workflow management software program significantly decreased MRI and CT report TATs.
INTRODUCTION
Radiology departments play a vital role in cancer care, providing imaging services that enable early detection, diagnosis, and treatment of the disease. At their core, diagnostic radiology services receive requests from referring physicians, schedule appointments, and perform and interpret diagnostic examinations. Approximately two decades ago, radiology underwent a digital transformation, in which workflows centered on printed films were migrated to computer-based systems. In the traditional workflow, printed film packets had been physically delivered to radiologists, who then reviewed them on a lightbox and dictated or wrote reports (Fig 1A); this was subsequently mirrored electronically in a workflow using radiology information systems (RISs) and picture archiving and communication systems (PACS), where radiologists would fetch the examinations from digital folders (worklists), thereby eliminating the need for printing and transport of imaging examinations across an institution (Fig 1B). The digitization of the radiologic workflow initially improved report turnaround times1 (TATs) and efficiency. However, as radiology departments have grown and become more complex, and as radiology as a field has become increasingly subspecialized, these systems have not been able to scale, and initial efficiency gains have eroded over time.2 Increasing subspecialization throughout medicine has had implications for oncologic imaging, in that it has required increasingly specialized radiologist knowledge and diagnostic skills tailored to the needs of referrers.3
FIG 1.

(A) Legacy workflow (pre-PACS) with physical films; (B) PACS worklist-driven digital workflow; and (C) proposed simplified workflow replacing worklists by targeted examination assignment. PACS, picture archiving and communication systems.
CONTEXT
Key Objective
To implement a custom radiologic examination distribution software program to decrease turnaround times.
Knowledge Generated
The software program was successfully implemented and is freely available online. Turnaround time for radiologic reports decreased significantly.
Relevance
As oncology and medicine become more subspecialized, this complexity is mirrored in increasing subspecialization in radiology. A custom distribution software program allows for timely report turnaround in such a dedicated environment.
The digital radiology workflow on the basis of RIS and PACS and modeled after the legacy of the analog film workflow4 became problematic with increases in examination volumes, examination complexity, and subspecialization in radiology.5 Such increases have inevitably led to either large, cluttered worklists or multiple fragmented worklists, adding friction to radiologists' workflow, ie, wasted time to click through worklists to find examinations that match individual radiologic expertise or preference (eg, cherry-picking). This may contribute to radiologist burnout6 and results in delayed reporting of examinations. Notwithstanding, high-quality radiology reports are expected to be available within a limited time frame to referring physicians7 and patients.8,9 It is clear that a software program simply mirroring the legacy workflow is insufficient and ill-equipped to solve the challenges of modern radiology.
One potential way to address these challenges is by leveraging advanced computational tools. Because of its inherently modular nature and the requirement to communicate with other hospital systems, a radiology software program usually has rich application programming interfaces (APIs), which can be leveraged to outsource workflow management to a dedicated program that can direct examinations to individual radiologists rather than worklists (Fig 1C). This approach can eliminate the need for multiple worklists, simplify the radiologists' workflow, and facilitate subspecialized reporting. The task of matching radiologists' availability, expertise, and interests to imaging examinations in worklists so as to maximize subspecialized reporting and minimize report TATs is essentially an optimization problem, which can be successfully addressed with any high-level programming language such as Python, Julia, or R. We chose the statistical programming language R10 because of available institutional expertise and infrastructure. Moreover, R has grown rapidly in popularity in the scientific community11 and offers versatile API capabilities via dedicated packages, allowing for interaction with clinical systems and databases.
The aim of this study was to evaluate whether a custom programmatic workflow manager could reduce TAT without increasing the individual workload as part of a subspecialized oncologic imaging workflow at a tertiary cancer center.
METHODS
Implementation Details
Overview. The full source code and documentation are available at http://www.github.com/ignyt. The workflow manager is implemented as a custom R package named ignyt. The package contains various R-Markdown documents (modules) that are scheduled to run throughout the day on an internal Posit Connect server (Posit Inc, Boston, MA).
Packaging R code comes with various advantages, most importantly structured documentation, reproducibility, and portability. Functions in this package can be divided into three groups:
Core functions, which optimize the assignment of the examinations to the radiologists (explained in more detail below)
Interface functions, which communicate with various APIs
Auxiliary functions, for example, for logging or caching data, or small internal helper functions.
Furthermore, internal lookup tables are included (eg, listing subspecialist skills and interests for each individual radiologist) as well as functionality to dynamically update those tables from shared data sources. Although most functions in the public repository could be used out of the box by any radiology department, others, such as the interface functions and lookup tables, need to be adapted for use in different institutions.
The dictation software used at our hospital is PowerScribe 360 (Nuance Communications Inc, Burlington, MA). QGenda (QGenda LLC, Atlanta, GA) serves as a clinical roster planning software program, and Centricity RIS-IC (GE Healthcare, Chicago, IL) serves as the RIS. The latter two are mirrored in a dedicated relational database (Microsoft SQL Server; Microsoft, Redmond, WA) used for interaction with the workflow manager.
Assignment of a given examination is schematically represented in Figure 2. Typically, each step is performed by a dedicated function. For example, the function “fetch_completed()” runs a SQL query to get all unread radiology examinations, and “prep_worklist()” subsequently assigns both the most likely disease management team (DMT) category and priority status for patients with upcoming appointments. The returned dataframe is passed to, eg, the function “divide_ct()” together with a dataframe of available radiologists (obtained from “shift_rads()”), which ascertains optimal examination distribution among readers (described in more detail below). Finally, a dedicated function assigns the examinations in the clinical dictation system.
FIG 2.

Schematic representation of the steps performed by the workflow manager. API, application programming interface; HTTP, hypertext transfer protocol; LUT, lookup table; SQL, structured query language.
Examination assignment optimization. The main purpose of the workflow manager is to achieve a smooth clinical workflow for routine computed tomography (CT) and magnetic resonance imaging (MRI) examinations. Procedure completion to report available12 TAT was chosen as our primary end point. Decreasing TAT alone can be achieved simply by assigning older examinations first. However, some constraints need to be implemented: Most importantly, the number of examinations assigned to a single radiologist per shift needs to be constrained to a feasible and acceptable number. Additionally, the algorithm has been designed to distribute the examinations in a fair manner, ie, as evenly as possible across all available radiologists. The subspecialization at our department mirrors that of the institutional DMTs, which are either organ system–based (eg, hepatobiliary, genitourinary) or disease-based (eg, melanoma, multiple myeloma). Any single radiologist may be affiliated with one or more DMTs. An optimal assignment is achieved by using a bootstrapping procedure, creating i different examination distribution tables, and then selecting the optimal distribution, whereby as many examinations are assigned to corresponding subspecialized radiologists as possible while maintaining an even distribution of volume across all radiologists available for that shift. Since our institution has sites in two US states, and not all radiologists are licensed in both states, the medical license status of radiologists is an additional constraint. Finally, examinations requiring expedited (STAT) reports (for example, because of coordinated visits, ie, a same-day clinic appointment) are prioritized. Two toy examples with three radiologists and six examinations can be found in the Data Supplement.
Evaluation
Programmatic complexity was measured by lines of code, number of functions, and cyclomatic complexity (CC) of functions. CC measures the number of independent linear paths that can be taken through a given function.13 According to the recommendations of McCabe,13 if a function exceeds a CC of 10, it ought to be broken up into multiple smaller functions. However, it needs to be noted that these recommendations are based on the old FORTRAN 66 programming language and may not necessarily apply to modern R programs.
An initial 4-week test and adjustment period was launched in May 2020, and the evaluation period was June 1, 2020-May 31, 2021. The number of examinations divided by the number of available radiologists was computed to investigate for possible confounding of TAT by higher radiologist availability. Timestamps exam completed and report finalized of all CT and MRI examinations were retrieved from RIS using the same 12-month-period (June 1, 2019-May 31, 2020) as a reference period. Among all radiologists who indicated reading preferences, the numbers of examinations read that matched their preferences versus other examinations read were collected and compared. Data from the same periods in 2017-2019 were used for graphical visualization to exclude the possibility that the data from 2020 simply followed a longer ongoing trend, but no statistical testing was performed on that more remote historical data.
Continuous variables are represented by the median and interquartile range unless otherwise indicated. Median TATs were compared using a Wilcoxon test. Subgroup analysis was performed for CT and MRI examinations separately, as well as for examinations performed in house and examinations performed at other institutions submitted for reinterpretation. The proportions of reports finalized within 24 hours and reports that were delayed (ie, finalized more than 72 hours after the end of the examination) were compared with a chi-square test. P values < .05 were considered indicative of statistically significant differences. All tests were two-tailed. R version 4.0.5 (R Foundation for Statistical Computing, Vienna, Austria) was used for all computations.
It should be noted that we only included the types of examinations managed by the newly introduced software program. Certain types of examinations (eg, inpatient CTs, and cardiac CT or MRI) have dedicated workflows and were excluded, as were ultrasound, fluoroscopy, radiographs, and CT/MRI examinations from other services (nuclear medicine and breast imaging).
RESULTS
The workflow manager consists of 1,782 lines of R code in 24 files and 1,350 lines of code in R-Markdown documents. Median CC was 3 (2-11), which is in accordance with the recommendations of McCabe.13 The core functions optimizing the CT and MRI distribution among radiologists had CCs of 153 and 47, respectively, mirroring the inherent complexity of optimizing a subspecialized workflow. Although a modularization of these functions into multiple subfunctions with CCs < 10 would have been possible, this was deemed more complicated to debug and maintain compared with one single coherent function.
The total number of MRI and CT examinations was 124,507 in 2019/20 and 138,601 in 2020/21. The increase in examinations was accompanied by an increase in full-time equivalent radiologists (ie, newly hired faculty); hence, the number of weighted CT/MRI examinations per radiologist per day, 19.4 (16.7-24.1) v 20.0 (16.9-23.3), did not change significantly (P = .77).
For all CT and MRI examinations, the median TAT decreased from 4 (1-22 hours) to 3 hours (1-17 hours, P < .001). Reports completed within 24 hours increased from 78% (124,127) to 89% (138,601). For MRI, TAT decreased from 22 (5-49 hours) to 8 hours (2-21 hours), and reports completed within 24 hours increased from 55% (14,211) to 80% (23,744). For CT, TAT decreased from 3 (1-19 hours) to 2 hours (1-13 hours), and reports completed within 24 hours increased from 84% (82,342) to 92% (99,922). Additionally, delayed reporting defined as > 72 hours decreased from 17.0% (4,176) to 2.2% (649) for MRI and from 2.5% (2,500) to 0.7% (745) for CT.
All differences above were statistically significant (P < .001) and are summarized in Table 1. Visual inspection of data confirmed that the shorter TATs were not simply a continuation of a trend from prior years (Fig 3).
TABLE 1.
Turnaround Times and Proportions of Examinations Reported Within 24 Hours Before (2019/2020) and After (2020/2021) Implementation of a Custom Workflow Manager
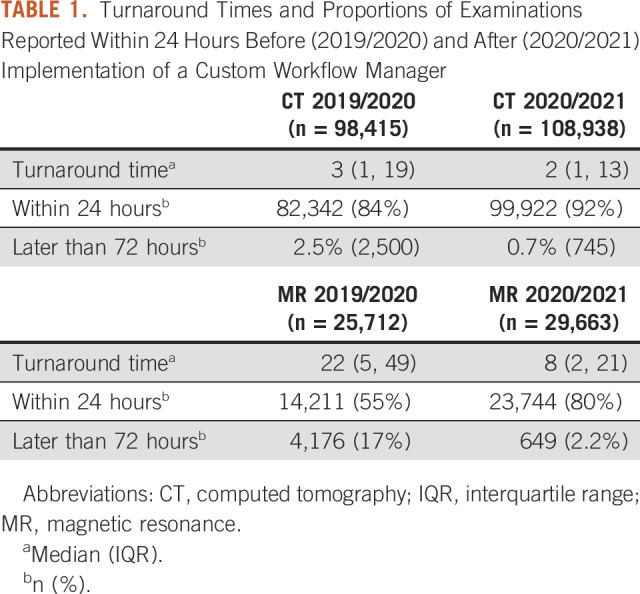
FIG 3.

While the total examination volume increased over the years 2017-2021 (shown: period July-June), so did the proportion of reports finalized later than a day after image acquisition. In May 2020, the new custom workflow manager software program was implemented, leading to a significant shortening of TAT in the 2020/2021 period and a significant decrease in reports finalized after > 24 hours (P < .001). Months March, April, and May were excluded in all years for illustratory purposes (reduced volume in 19/20 because of lockdown). TAT, turnaround time.
DISCUSSION
In this study, we investigated the implementation of a radiologic workflow manager tailored to a subspecialized workflow in a large tertiary cancer center. We found that a subspecialized workflow could be efficiently implemented through a custom software program, leading to a marked decrease in magnetic resonance and CT report TAT, without changing individual radiologists' workload. The latter was particularly important to us, as being an academic radiology department, maintaining clinical workload was essential to be able to provide dedicated academic and administrative time to all radiologists. Moreover, the inclusion of reading preferences enabled us to increase the percentage of examinations radiologists reviewed that matched their preferences by around 30%, all while maintaining the core principles of even workload distribution, different state licensing, and subspecialization among faculty.
Several attempts to improve radiologic workflow have been described in the literature. Doshi et al14 provide a comprehensive summary of various informatics components used at different stages of the imaging chain. Rao et al15 evaluated the implementation of a web-based workflow software program for tumor assessment readings for clinical research studies (although not for readings of routine clinical examinations) and achieved a significant reduction of TAT from 19.6 to 8.0 hours. Wildman-Tobriner et al16 from Duke University (North Carolina) moved from a PACS-driven workflow to an electronic health record–driven workflow. Such a move is of course heavily constrained by the available electronic health record software program and may not be feasible for many institutions. Moreover, the authors used data from satisfaction questionnaires and operational data, such as number of clicks, as primary end points (which improved), and they did not investigate TAT. More than a decade earlier, Halsted and Froehle17 implemented a custom workflow manager more akin to the solution proposed in our present paper. They also achieved an improvement in TATs. Their software program presents a curated, internally prioritized worklist to the user, similarly to the software program investigated in a more recent study by Wong et al.18 Hence, it takes up additional screen real estate on the radiologist's monitor, introduces an additional step in the workflow, and does not alleviate the user of the task of selecting examinations. By contrast, our proposed system follows the logic of “don't automate, obliterate”19 and runs entirely in the background, thus removing manual selection from the workflow.
The lack of studies of the reproducibility of results achieved with approaches evaluated in the literature sheds light on another issue: adaptability to new institutions or sites. This problem is not unique to radiology; a longitudinal study examining the implementation of workflow manager software programs for various business processes found that only one half to one third of proposed or planned workflow management software programs are eventually implemented.20 The reasons for this may be manifold and may include prohibitive monetary cost, hesitation to change existing processes, or technical inability to integrate with existing systems. The latter problem has been greatly mitigated in the United States in the past few years, and the available APIs in hospital IT systems will likely continue to improve in the wake of the introduction of the CURES act in 2016.9 The source code of the software program presented in the current paper is freely available and builds on the foundation of the programming language R, which is also freely available and widely used within the scientific community. R is highly extensible and provides interfaces to most common data sources. Custom functions to communicate with SQL databases or HTTP APIs are already implemented in the present software program and can be modified to suit individual needs. Additional interfaces can easily be added by using the existing functions as a template.
Since we already had a subspecialized workflow in place before implementation of the software program, the TAT improvement cannot be explained by a switch from general to subspecialized radiology, as observed in prior studies.2,21,22 However, some possible limitations were not formally investigated. For example, hypothetically, as the volume of cases increased, the complexity of cases could have conversely decreased. We consider such a phenomenon to be highly unlikely over a time frame of multiple months and saw no evidence for this in prior years. Moreover, it is not possible to accurately measure the complexity of a given case.
Finally, the use of TAT as a primary target metric is inherently limited. Although a short TAT is generally thought to represent a smooth clinical workflow, it does so with a certain myopic focus on the radiology department. In our workflow, for example, we prioritized newer examinations of patients with upcoming clinical visits over older ones with no or more remote visits. This may seem likely to increase departmental TAT; however, it contributes to decreased patient waiting times at an institutional level. The waiting times of different referring clinics would have been an interesting metric to analyze but, unfortunately, were not available.
Although the core of the software program is built around our particular organizational structure, it remains flexible to exchange, extend, or reduce the examination distribution rules and categories. Notwithstanding that one of the underlying premises for our approach was the facilitation of subspecialized radiology, the software program could still be useful in a general radiology setting; for example, our application of licensing status as a constraint could be helpful in directing examinations in an interstate (tele)radiology practice. This approach could potentially be extended for other purposes, such as the inclusion of different insurance companies.
One limitation that was identified during the implementation phase was that trainees would encounter empty worklists in the morning and remain idle until the first examinations trickled in. This problem was easily circumvented by assigning the trainees a small number of randomly selected cases on the basis of modality rotation; however, it shows that in a teaching hospital, a balance must be struck between TAT optimization and resident training.
In summary, we found that a custom-developed workflow management software program significantly decreased CT and MRI report TATs in a large tertiary subspecialized cancer center.
ACKNOWLEDGMENT
The authors thank the departmental IT team for their hard work and support of this project. The research of this department is in part funded by the NIH/NCI Cancer Center Support Grant P30 CA008748.
Pierre Elnajjar
Employment: Amgen
Stock and Other Ownership Interests: Amgen
Hedvig Hricak
Leadership: Ion Beam Applications (IBA)
Joseph P. Erinjeri
Consulting or Advisory Role: AstraZeneca
No other potential conflicts of interest were reported.
AUTHOR CONTRIBUTIONS
Conception and design: All authors
Administrative support: All authors
Collection and assembly of data: All authors
Data analysis and interpretation: All authors
Manuscript writing: All authors
Final approval of manuscript: All authors
Accountable for all aspects of the work: All authors
AUTHORS' DISCLOSURES OF POTENTIAL CONFLICTS OF INTEREST
The following represents disclosure information provided by authors of this manuscript. All relationships are considered compensated unless otherwise noted. Relationships are self-held unless noted. I = Immediate Family Member, Inst = My Institution. Relationships may not relate to the subject matter of this manuscript. For more information about ASCO's conflict of interest policy, please refer to www.asco.org/rwc or ascopubs.org/cci/author-center.
Open Payments is a public database containing information reported by companies about payments made to US-licensed physicians (Open Payments).
Pierre Elnajjar
Employment: Amgen
Stock and Other Ownership Interests: Amgen
Hedvig Hricak
Leadership: Ion Beam Applications (IBA)
Joseph P. Erinjeri
Consulting or Advisory Role: AstraZeneca
No other potential conflicts of interest were reported.
REFERENCES
- 1.Redfern RO, Horii SC, Feingold E, et al. : Radiology workflow and patient volume: Effect of picture archiving and communication systems on technologists and radiologists. J Digit Imaging 13:97-100, 2000 [DOI] [PMC free article] [PubMed] [Google Scholar]
- 2.Meyl TP, de Bucourt M, Berghöfer A, et al. : Subspecialization in radiology: Effects on the diagnostic spectrum of radiologists and report turnaround time in a Swiss university hospital. Radiol Med 124:860-869, 2019 [DOI] [PubMed] [Google Scholar]
- 3.Wibmer A, Vargas HA, Donahue TF, et al. : Diagnosis of extracapsular extension of prostate cancer on prostate MRI: Impact of second-opinion readings by subspecialized genitourinary oncologic radiologists. AJR Am J Roentgenol 205:W73-W78, 2015 [DOI] [PubMed] [Google Scholar]
- 4.Hussein R, Winter A: Towards more integrated implementation of healthcare information systems: Using the 3LGM2 for modeling the IHE-scheduled workflow integration profile. 2008 21st IEEE International Symposium on Computer-Based Medical Systems, IEEE, 2008, pp 650-652 [Google Scholar]
- 5.Mettler FA, Bhargavan M, Faulkner K, et al. : Radiologic and nuclear medicine studies in the United States and worldwide: Frequency, radiation dose, and comparison with other radiation sources—1950-2007. Radiology 253:520-531, 2009 [DOI] [PubMed] [Google Scholar]
- 6.Harolds JA, Parikh JR, Bluth EI, et al. : Burnout of radiologists: Frequency, risk factors, and remedies: A report of the ACR commission on human resources. J Am Coll Radiol 13:411-416, 2016 [DOI] [PubMed] [Google Scholar]
- 7.Bosmans JML, Weyler JJ, De Schepper AM, et al. : The radiology report as seen by radiologists and referring clinicians: Results of the COVER and ROVER surveys. Radiology 259:184-195, 2011 [DOI] [PubMed] [Google Scholar]
- 8.Niehaus K, Epstein C, Temple L, et al. : A patient and family advisory council for quality: Making its voice heard at Memorial Sloan Kettering Cancer Center. NEJM Catal 5, 2017 [Google Scholar]
- 9.114th Congress: 21st Century Cures Act [Internet]. 2016. https://www.congress.gov/114/plaws/publ255/PLAW-114publ255.pdf
- 10.R Core Team: A Language and Environment for Statistical Computing. R Foundation for Statistical Computing, Vienna, Austria, 2020. https://www.R-project.org/ [Google Scholar]
- 11.Lai J, Lortie CJ, Muenchen RA, et al. : Evaluating the popularity of R in ecology. Ecosphere 10:e02567, 2019 [Google Scholar]
- 12.Breil B, Fritz F, Thiemann V, et al. : Mapping turnaround times (TAT) to a generic timeline: A systematic review of TAT definitions in clinical domains. BMC Med Inform Decis Mak 11:34, 2011 [DOI] [PMC free article] [PubMed] [Google Scholar]
- 13.McCabe TJ: A complexity measure. IEEE Trans Softw Eng SE-2:308-320, 1976 [Google Scholar]
- 14.Doshi AM, Moore WH, Kim DC, et al. : Informatics solutions for driving an effective and efficient radiology practice. Radiographics 38:1810-1822, 2018 [DOI] [PubMed] [Google Scholar]
- 15.Rao SH, Virarkar M, Yang WT, et al. : Streamlining the quantitative metrics workflow at a comprehensive cancer center. Acad Radiol 28:1401-1407, 2021 [DOI] [PubMed] [Google Scholar]
- 16.Wildman-Tobriner B, Thorpe MP, Said N, et al. : Moving radiology workflow to the electronic health record: Quantitative and qualitative experience from a large academic medical center. Acad Radiol 27:253-259, 2020 [DOI] [PubMed] [Google Scholar]
- 17.Halsted MJ, Froehle CM: Design, implementation, and assessment of a radiology workflow management system. AJR Am J Roentgenol 191:321-327, 2008 [DOI] [PubMed] [Google Scholar]
- 18.Wong TT, Kazam JK, Rasiej MJ: Effect of analytics-driven worklists on musculoskeletal MRI interpretation times in an academic setting. AJR Am J Roentgenol 5:1091-1095, 2019 [DOI] [PubMed] [Google Scholar]
- 19.Hammer M: Reengineering work: Don’t automate, obliterate. Harv Bus Rev 68:104-112, 1990 [Google Scholar]
- 20.Reijers HA, Vanderfeesten I, van der Aalst WMP: The effectiveness of workflow management systems: A longitudinal study. Int J Inf Manage 36:126-141, 2016 [Google Scholar]
- 21.Stern C, Boehm T, Seifert B, et al. : Subspecialized radiological reporting expedites turnaround time of radiology reports and increases productivity. Rofo 190:623-629, 2018 [DOI] [PubMed] [Google Scholar]
- 22.Verma N, Pacini GS, Torrada JP, et al. : Subspecialized radiology reporting: Productivity and impact on the turnaround times for radiology reports in a middle-income country. Radiol Bras 53:236-240, 2020 [DOI] [PMC free article] [PubMed] [Google Scholar]