Abstract
23Na-MRI provides information on Na+ content, and its application in the medical field has been highly anticipated. However, for existing clinical 1H-MRI systems, its implementation requires an additional broadband RF transmitter, dedicated transceivers, and RF coils for Na+ imaging. However, a standard medical MRI system cannot often be modified to perform 23Na imaging. We have developed an add-on crossband RF repeater system that enables 23Na-MRI simply by inserting it into the magnet bore of an existing 1H MRI. The three axis gradient fields controlled by the 1H-MRI system were directly used for 23Na imaging without any deformation. A crossband repeater is a common technique used for amateur radio. This concept was proven by a saline solution phantom and in vivo mouse experiments. This add-on RF platform is applicable to medical 1H MRI systems and can enhance the application of 23Na-MRI in clinical usage.
Keywords: add-on platform, crossband repeater, live mouse imaging, sodium magnetic resonance imaging
Introduction
Conventional MRI systems visualize 1H nuclei in biological tissues and are widely used for clinical diagnosis and research. With the recent technical improvements (e.g., higher magnetic field strengths and improved gradient hardware and sequences), X-nuclei (non-proton) MRI has attracted much attention. X-nuclei MRI (e.g., 13C, 17O, 23Na, 35Cl, 31P, and 39K nuclei MRI) provides metabolic information on ions metabolism and homeostasis in vivo, which cannot be detected by traditional 1H-MRI, and thus has the potential of being a tool for precise diagnosis and for clarifying physiological milieu.1 23Na has a high natural abundance and high concentration in the body. In addition, 23Na has short relaxation times, which allows for fast imaging with a large flip angle. For these reasons, 23Na-MRI signals can be obtained with relatively high sensitivity, and many studies have been performed with 23Na imaging. The value of 23Na-specific applications in the kidney,2–5 brain,6 multiple sclerosis,7,8 stroke,9 heart,10,11 muscle, and brain,12 as well as knee,13 has been shown.
Conventional clinical MRI systems for 1.5 Tesla or 3 Tesla are optimized for 1H imaging with narrow-band RF digital electronics working at the 1H resonance frequency. Thus, 23Na or other X-nuclei imaging cannot be performed with the conventional MRI without additional hardware (transceiver and spectrometer, RF transmitter, RF coils, etc.) corresponding to the resonance frequency of the specific target nucleus. For this additional purpose for medical research, a broadband multinuclear spectroscopy (MNS) package that works at the resonance frequencies of multiple X-nuclei is commercially available only for high-end medical MRI systems or research MRI systems. There is another type of signal transceiver that uses frequency conversions between the resonance frequencies of 1H and the X-nucleus.14 Dedicated RF coils and an RF transmitter are also needed to transmit and receive X-nucleus signals. To this end, multiresonant RF coils14,15 are often employed, but the design of multituned RF coils resonating at even two frequencies has unavoidable disadvantages because their sensitivity tends to be inferior to that of single-tuned coils. The design of double-tuned RF coils for X-nuclei is reviewed in Ref. 16.
Several advanced research facilities have the MNS package and appropriate hardware on their clinical scanners. However, 23Na-MRI has not been available in clinical practice because of the high cost and the poor availability of dedicated hardware setups, such as the additional 23Na transmitter and RF coils. Once a clinical MRI system is installed solely for 1H imaging, the system configuration cannot be modified to 23Na-MRI until the next major reinstallation. These additional costs are a major obstacle to further development for clinical applications of 23Na-MRI.
Another challenge is that the MNS package cannot technically be installed into a standard or low-end MRI system, and the only way to perform 23Na-MRI is to replace the entire system. However, the lifespan of the MRI system is generally more than 10 years, making it difficult to replace frequently.
To address these issues, here we developed a novel add-on 23Na-MRI RF platform consisting of a crossband repeater (CBR), which is an amateur radio technology, with a low-band RF transmitter to pick up and transmit coils. Three axis gradient fields controlled and applied from a 1H-MRI scanner can be directly used for 23Na imaging. The proposed add-on RF platform can be installed into existing 1.5 or 3 Tesla 1H-MRI scanners without modifying the parent scanner configuration at minimal cost, and thus enables 23Na-MRI with the standard 1H scanners. Most of the existing systems use RF equipment operating at a single frequency, and thus, equipment needs to be added for transmission and reception to control and observe the second set of RF signals synchronously. In contrast, this system can be realized at a low cost because it uses 1H RF equipment for the transmission and reception of the second set of RF signals. The add-on RF platform can also be shared with different scanners at the same site or at a neighboring site, or targeting other nuclei like 31P, thus reducing the total hardware cost and promoting its usability. This study presents an initial proof-of-concept for an add-on 23Na-MRI platform to a 1.5 T 1H scanner, followed by its application to in vivo imaging of a live mouse. The concept of the proposed RF platform is applicable to other 1H scanners and would expand the opportunity for researchers to assess the clinical applications of 23Na-MRI.
Add-on 23Na-MRI RF platform
Concept and operating principle
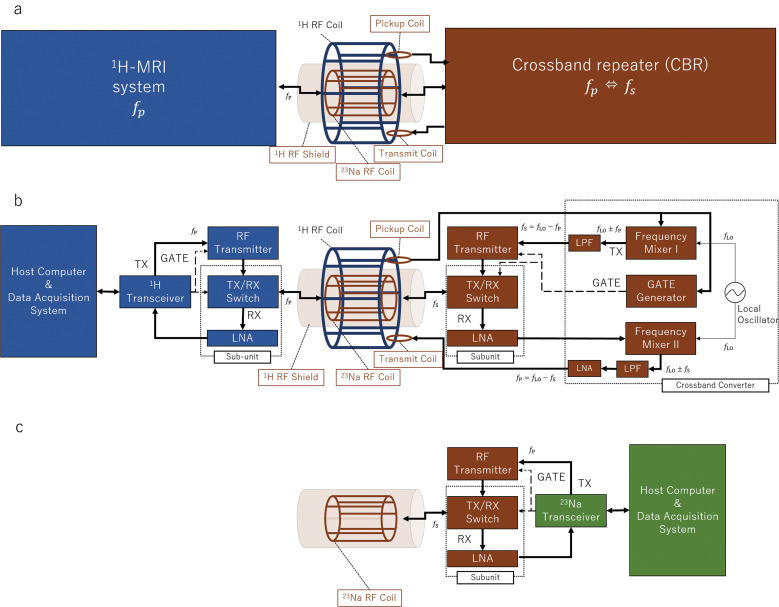
A schematic diagram of the proposed add-on 23Na platform built into a conventional 1.5 Tesla 1H-MRI system is presented in Fig. 1a. The add-on RF platform consists of a 23Na birdcage RF transmit and receive coils, loop pickup and transmit coils, a 1H-RF shield, and a CBR system. The loop pickup and transmit coils were used to receive and transmit 1H-RF pulses from or to the 1H system. The 1H-RF shield was used to shield the 23Na-RF coil and sample from the 1H transmitted pulse. The CBR system was mainly used to convert the signals between 1H- and 23Na-NMR frequencies ( and ). At the B0 field strength of 1.5 Tesla, the 1H frequency is about 64 MHz and the 23Na frequency is about 17 MHz. For 23Na imaging, the RF probe head of the add-on platform was inserted into the imaging bore in the transmission coil of the 1H-MRI system. For 1H, the probe head of the add-on RF platform was removed from the imaging bore.
Fig. 1.
Block diagrams of the add-on platform using the CBR. (a and b) The add-on 23Na/1H-MRI system. (c) Conventional 23Na-MRI system. CBR, crossband repeater; LNA, low-noise amplifier; LPF, low-pass filter; RX, receive; TX, transmit.
The operating principle of 23Na imaging is as follows. Briefly, a 1H-RF pulse is emitted from the 1H system and is detected by the loop pickup coil of the CBR. Next, the CBR down-converts the 1H pulse (modulated at ) to the 23Na frequency, and the 23Na pulse (modulated at ) is used to excite the sample with the birdcage 23Na RF coil. Instead of the birdcage-type coil, a loop coil can also be used. The excitation pulse amplitude should be carefully adjusted. Because the gyromagnetic ratio for 23Na is about 1/4 of the 1H proton, specific absorption ratio (SAR) is not severe when the small local 23Na transmission coil is used. The resulting 23Na-MRI signal from the imaging sample is received by the same 23Na RF coil, transferred to the CBR, up-converted to , and transmitted back with the loop-transmit coil to the birdcage 1H-RF coil. In summary, the 1H system receives the 23Na-MRI signal converted at the 1H resonant frequency by the CBR.
More specifically (Fig. 1b), the CBR consists of an RF transmitter, a transmit and receive (TX/RX) switch, a low-noise amplifier (LNA), and a crossband converter. The transmitted 1H-pulse signal is picked up, divided, and transferred to a gate generator and a frequency mixer I in the crossband converter. The generated gate pulse is used to control the timing of the RF pulse transmission and the TX/RX switch. The transmitted 1H pulse (modulated at ) is mixed with the signal from a local oscillator (with the oscillation frequency = fp − fs) in the frequency mixer I. The modulated pulse (at fp ± fLO) passes through a low-pass filter (LPF) to output the signal for the 23Na transmit RF pulse (modulated at = fp − fLO), and is transferred to the RF transmitter. The 23Na birdcage coil transmits the 23Na RF pulse and receives the 23Na-MR signal from the sample. The 23Na-MR signal (modulated at ) is pre-amplified by the LNA, up-converted to the 1H resonance frequency ( ) with the frequency mixer II and an LPF, and amplified by another LNA. The up-converted 23Na-MR signal is transmitted to the birdcage 1H-RF coil of the 1H system and is detected by the 1H system. To this end, the 1H system receives the 23Na-MRI signal without recognizing it as being the frequency-converted signal by the CBR. The 1H-MRI system works as if the 1H birdcage coil transmitted and received the 1H signal, but what was transmitted and received was the 23Na signal modulated by the 1H resonance frequency. Since the gyromagnetic ratio for 23Na is about 1/4 of the 1H proton, the FOV of the 23Na becomes 4 times wider than original 1H proton’s MRI sequence.
Setup
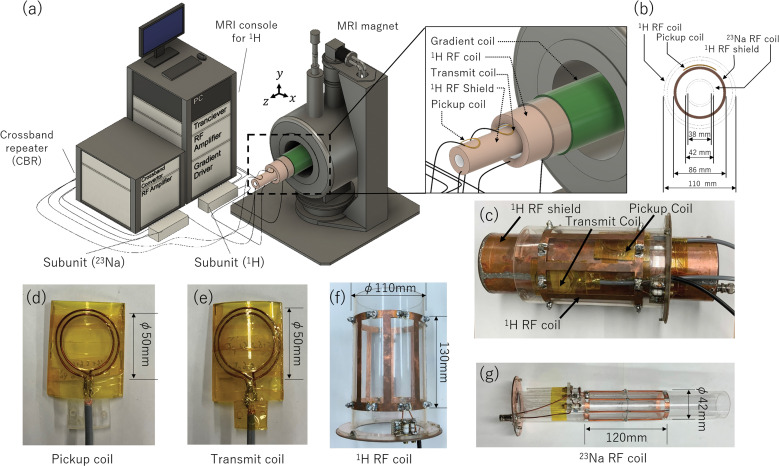
The add-on 23Na RF platform equipped with a conventional 1H-MRI system is shown in Fig. 2. The 1H-MRI system consisted of a 1.5 T superconducting magnet with a 280 mm bore (JMBT-1.5/280/SS; JASTEC, Hyogo, Japan), a home-built birdcage RF transmit and receive coil for 1H (Fig. 2f), a home-built shielded gradient coil, an RF transmitter (150 W, 64 MHz; DST, Saitama, Japan), a three-axis gradient driver (20 V, 20 A; DST), a digital MRI transceiver for 1H (DTRX6; MRTechnology, Ibaraki, Japan),17 a digital subunit consisting of a preamplifier and a TX/RX switch (64 MHz; DST), and a Windows PC. The resonance frequencies for 1H ( ) and 23Na ( ) were 63.903 and 16.908 MHz, respectively. The imaging volume was 10 cm diameter-sphere-volume (DSV). The maximum field gradient was 14.9 mT/m.
Fig. 2.
Add-on 23Na-MRI platform equipped with the 1.5 T 1H system. (a) Schematic overview of the system. (b and c) RF coil assembly. (d) Pickup coil. (e) Transmit coil. (f) 1H-RF coil (without the shield). (g) 23Na RF coil (without the shield). CBR, crossband repeater.
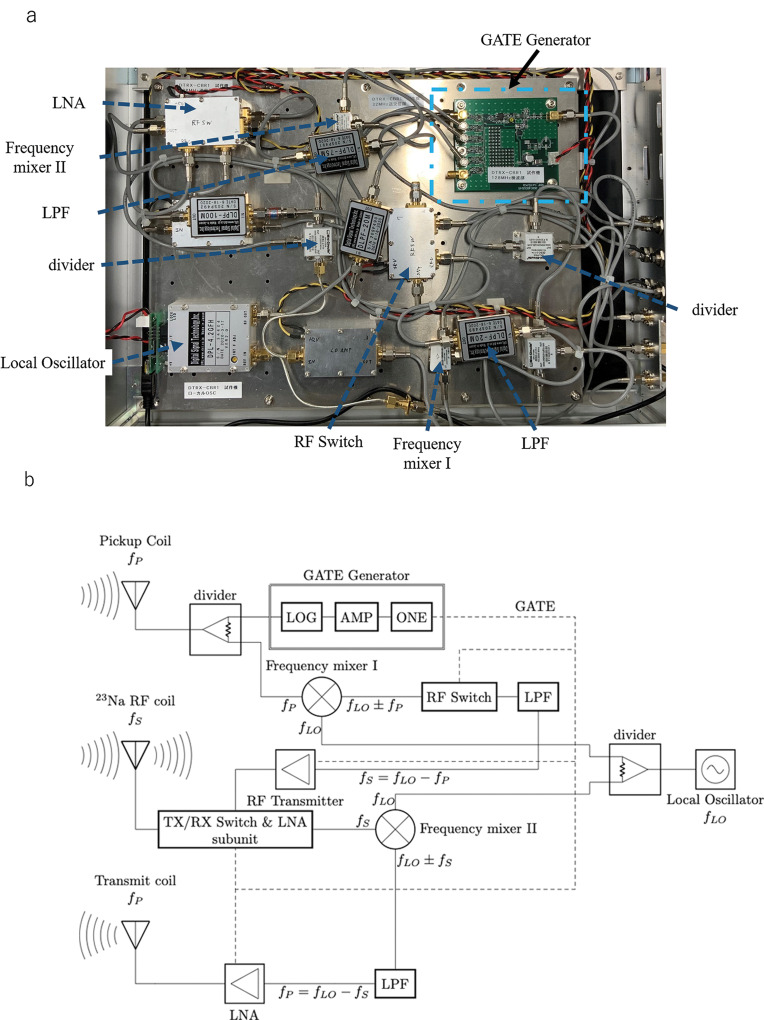
The add-on RF platform consisted of the CBR, 1H-RF shield, and RF coils. The CBR consisted of an RF transmitter (500 kHz–150 MHz, 2 kW, BTO2000-AlphaSA; TOMCO, Stepney, Australia), a crossband converter (16–64 MHz; MRTechnology), and a digital subunit consisting of a pre-amplifier and a TX/RX switch (17 MHz; DST). A picture and a block diagram of the crossband converter are shown in Fig. 3.
Fig. 3.
Crossband converter. (a) Crossband converter unit. (b) Block diagram. AMP, amplifier; LNA, low-noise amplifier; LOG, logarithmic; LPF, low-pass filter; ONE, one-shot circuit; RX, receive; TX, transmit.
The RF coil assembly is shown in Fig. 2b and 2c. The 1H birdcage RF coil was located at the outermost side, and the 1H pickup and transmit coils, 1H-RF shield, 23Na birdcage RF coil, and the sample were placed in this order toward the inner side. The 1H birdcage coil was a part of the 1H-MRI system, and its coil diameter and length were 110 and 130 mm, respectively.
Other RF coils were prepared in this study; the pickup and transmit coils (Fig. 2d and 2e, respectively) were tuned and matched to . These were two-loop coils of 50 and 45 mm diameter. After construction, they were slightly bent and attached with Kapton tape to the 1H-RF shield. The configurations of pickup and transmit coils were optimized in advance using a commercial electromagnetic simulator (FEKO, www.feko.info) so that the transfer functions between the pickup coil and 1H-RF coil and that between the transmit coil and 1H RF coil were maximized. (See Supplementary Information for the optimization details).
The 1H-RF shield was designed in a way that the shielding isolation efficiency was more than 60 dB inside the shield. The shielding efficiency was calculated with FEKO (see Subsection of Shield efficiency of 1H-RF shield in Materials and Methods). It was constructed by wrapping 100-μm-thick copper sheets inside and outside an acrylic pipe (300 mm long, 86 mm outer diameter, and 80 mm inner diameter).
We also constructed a 23Na RF coil (Fig. 2g) tuned and matched to . It was a low-pass birdcage coil (6 legs, 42 mm in diameter, and 120 mm in length). The end-ring was made of copper sheet (100 um thick and 6 mm wide), the leg was made of copper wire (2 mm in diameter), and they were fixed on an acrylic cylinder. The 23Na-RF coil was fixed to the 1H-RF shield with stainless steel screws and acrylic spacers. The Q values of the 1H and 23Na coil were 137/118 and 82.2/67.0 (unloaded/loaded), respectively.
Comparison with conventional 23Na system
A conventional 23Na system (Fig. 1c) was used to compare the performance with the add-on system. The conventional 23Na system consisted of a 23Na birdcage RF coil, 23Na RF transmitter, gradient driver, gradient coils, and a digital subunit (the same devices as used in the add-on system), and consisted of a digital MRI transceiver for 23Na (DTRX6; MRTechnology) and a Windows PC (that were used only in the conventional 23Na system).
Materials and Methods
Bench test of control signals
The RF fidelity and time response of the control signals were measured using an oscilloscope (2 GHz, ViewGo II; Iwatsu, Tokyo, Japan). The measured signals were as follows: a 1H transmitted RF pulse and a gate pulse from the 1H system, a pulse acquired by the 1H pickup coil, a 23Na transmitted RF pulse, and a gate pulse from the add-on system. The transmission power gain of 23Na was proportional to the detected 1H transmission power, and the gain was carefully chosen not to apply an overpowered RF of 23Na pulse more than the SAR limit of 1H pulse. The local 23Na RF coil was small enough compared with the 1H body coil installed in the outermost diameter of the MRI’s imaging bore.
Shield efficiency of 1H-RF shield
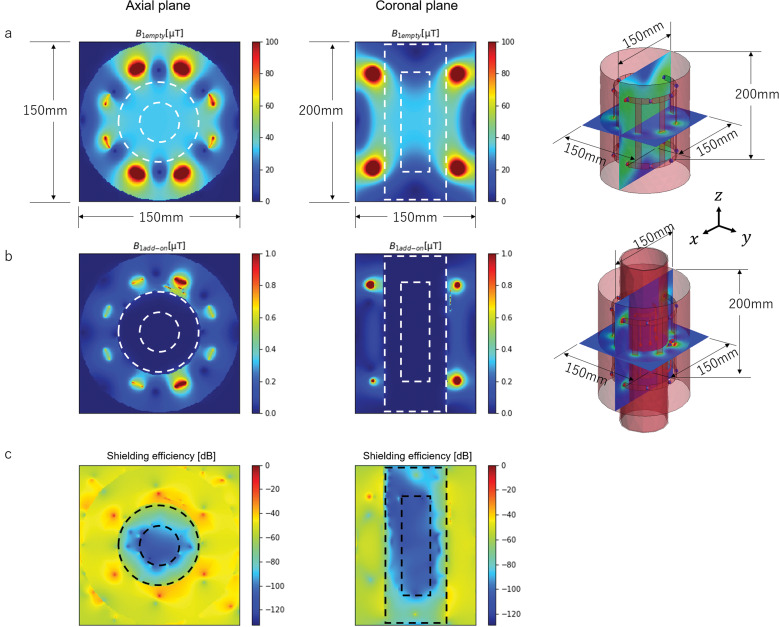
The shielding isolation efficiency was evaluated with a FEKO simulator. The maps of the magnetic field B1 generated by the 1H birdcage coil was calculated in the center area with and without the RF shield, and the shielding efficiency map was calculated from the ratio of the two maps. The evaluated areas were an xy plane (axial plane, 150 mm × 150 mm) and an xz plane (coronal plane, 150 mm × 200 mm), where z was the B0 direction (Fig. 2a).
Sensitivity measurement
To evaluate the sensitivity of the 23Na signals, the free induction decay (FID) signal from a saline phantom was measured in the following three cases: (A) using the conventional 23Na system (for reference), (B) using the add-on system, and (C) using the add-on system with a direct bypass electrical connection (DEC) from the crossband converter (the LNA after the LPF) to the 1H-MRI transceiver using a coaxial cable with Bayonet Neill-Concelman (BNC) connectors, instead of connecting via electromagnetic coupling between the transmit coil and the birdcage coil of the 1H system. Experiment C was performed to evaluate the RF signal loss in the electromagnetic coupling between the two 1H-RF coils.
The temporal signal intensity was measured from the FID magnitude, 140 μs after the excitation pulse applied with the saline phantom. The relative signal loss was calculated from the signal intensity and the total receiver gain.
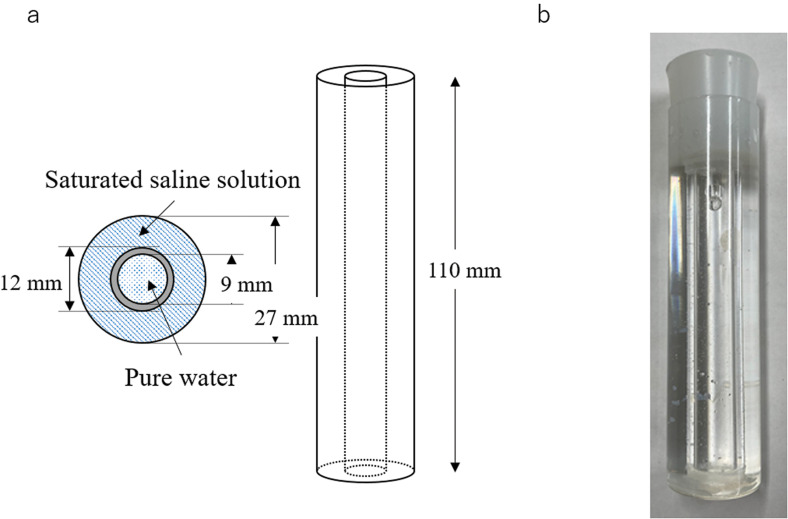
The phantom consisted of 19.4 cm3 of a saturated saline solution and 7.0 cm3 purified water (Fig. 4). Here, the saturated saline solution was the only source of the 23Na-MR signal because there are no 23Na nuclei in pure water. This was indeed confirmed by the imaging (see Subjection of Phantom imaging in Results).
Fig. 4.
Phantom consisting of saturated saline solution and pure water. (a) Schematic view. (b) Photograph.
Phantom imaging
The saline phantom described above was also used for imaging measurement. The image sequences were 3D, coronal, and axial gradient-echo sequences. The detailed parameters are listed in Table 1. The 90 degrees of flip angle was determined under the condition that the FID signal is maximized. The signal was integrated four times to increase the image SNR. The image SNR was measured by dividing the mean signal level over a given area in saturated saline solution by the standard deviation of the signal level in an outside area.
Table 1.
Sequence parameters used for phantom imaging (3D, SE, and GE)
| 1H-MRI coronal 3D-SE | 1H-MRI axial 3D-SE | 23Na-MRI coronal 3D-GE | 23Na-MRI axial 3D-GE | |
|---|---|---|---|---|
| TR (ms) | 500 | 500 | 40 | 40 |
| TE (ms) | 15 | 15 | 2.8 | 2.8 |
| DW (µsec) | 40 | 40 | 35 | 70 |
| FA (deg) | 90 | 90 | 90 | 90 |
| FOV (cm3) | 14 7 7 | 7 7 14 | 14 7 7 | 7 7 14 |
| Matrix size | 128 64 64 | 64 64 64 | 64 32 32 | 32 32 32 |
| NEX | 1 | 1 | 4 | 4 |
| Scan time | 34 min 13 s | 34 min 13 s | 2 min 44 s | 2 min 44 s |
DW, dwell time: FA, flip angle: GE, gradient echo; NEX, number of excitations: SE, spin echo.
In vivo MR imaging
For in vivo imaging, an 11-week-old mouse (C57BL/6J, Male) was imaged under gas anesthesia. The anesthesia was administrated by isoflurane with a gas anesthesia system (MRTechnology). The sequence parameters are listed in Table 2. We used compressed sensing (CS) encoding18 to shorten the scan time for 23Na mouse imaging, and the acceleration factor was 3.
Table 2.
Sequence parameters used for in vivo imaging (3D, SE, and GE)
| 1H-MRI coronal 3D-SE | 23Na-MRI coronal 3D-GE | |
|---|---|---|
| TR (ms) | 40 | 40 |
| TE (ms) | 15 | 2.8 |
| DW (µsec) | 40 | 35 |
| FA (deg) | 90 | 90 |
| FOV (cm3) | 14 7 7 | 14 7 7 |
| Matrix size | 256 128 64 | 64 32 32 |
| NEX | 1 | 256 |
| Acceleration factor | 1 | 3 |
| Scan time | 5 min 36 s | 58 min 12 s |
DW, dwell time: FA, flip angle: GE, gradient echo; NEX, number of excitations: SE, spin echo.
Due to the configuration difference between the 1.5 Tesla 1H-MRI and the add-on MRI systems, when switching the target configuration between the two systems, repositioning of the mouse from the bore was required. This led to misalignment in the mouse position in the 1H- and 23Na-MR images. To remedy this problem, saline solution markers were placed close to the mouse to guide the alignment of these images.
We also calculated the fused image of the 1H and 23Na images. Since the matrix sizes of the 1H and 23Na images differed by a factor of almost 4, zero-interpolation filling was used to match their matrix sizes. The image SNRs were calculated in the saline and bladder regions.
All experiments and procedures were approved by our Institutional Animal Care and Use Committee.
Results
Bench test of control signals
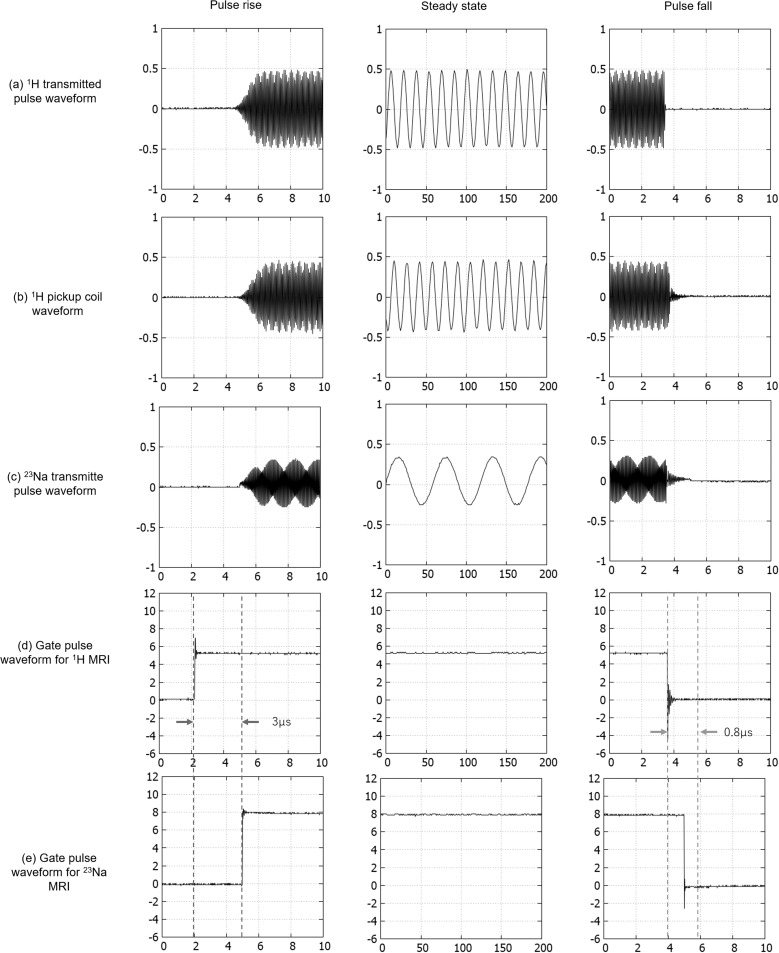
The measured control signals are shown in Fig. 5. The 1H pickup coil waveform (Fig. 5b) was almost perfectly synchronized with the waveform of the 1H transmitted pulse (Fig. 5a). The 23Na transmitted pulse waveform (Fig. 5c) was modulated at frequency in synchronization with the 1H transmitted pulse. The gate pulse for 23Na-MRI (Fig. 5e) was also synchronized with that for 1H-MRI (Fig. 5d). The delay time for the rising edge of the 23Na gate pulse was about 3 µs, and that of the falling edge was about 0.8 µs. The 23Na transmitted pulse signal was only transmitted, while the 23Na gate was ON.
Fig. 5.
Waveforms of control signals. (a) 1H transmitted pulse waveform. (b) 1H pickup coil waveform. (c) 23Na transmitted pulse waveform. (d) Gate pulse waveform for 1H-MRI. (e) Gate pulse waveform for 23Na-MRI.
Effect of 1H-RF isolation shield
The B1 and RF shielding efficiency maps calculated by the electromagnetic field simulation are shown in Fig. 6. Here, the outer and inner dotted lines indicate the 1H-RF isolation shield and 23Na birdcage RF coil, respectively. The shielding efficiency inside the 1H-RF shield was about 63 dB (the mean was 58 dB in the axial plane and 68.2 dB in the coronal plane), and that inside the 23Na RF coil was about 94 dB (the mean was 100 dB in the axial plane and 88.3 dB in the coronal plane).
Fig. 6.
B1 generated by the 1H birdcage RF coil and shielding efficiency maps. (a) B1 maps with the 1H-RF shield. (b) B1 maps without the 1H-RF shield. (c) Shielding efficiency maps.
Sensitivity measurement
The 23Na-FID signals acquired with the three setups (A–C) (see Subsection of Sensitivity measurement in Materials and Methods) are shown in Fig. 7. The FIDs decayed with the decay time (T2*) of 5 ms. The sensitivity results are summarized in Table 3. The signal intensity for the add-on system was –78.6 dBm (–104 dBm/cm3 for the saturated saline solution), which was close to the result from the conventional 23Na-MRI system (–79.0 dBm, –105 dBm/cm3 for saturated saline solution). Compared with the conventional 23Na system, the relative signal loss in the add-on system was 21.1 dB, and that in the add-on system with DEC was 9.1 dB.
Fig. 7.
23Na FID signals from the phantom. (a) Conventional 23Na-MRI system. (b) Add-on system. (c) Add-on system with DEC. The black lines indicate the estimated signal levels. DEC, direct bypass electrical connection; FID, free induction decay.
Table 3.
Signal intensity and loss measured from the FID measurement (DEC, from the crossband converter to the 1H-MRI system)
| System | Signal intensity [dBm] | Total receiver gain [dB] | Relative signal loss compared with A [dB] |
|---|---|---|---|
| Conventional 23Na-MRI System (A) | –79.0 | 83.7 | - |
| Add-on system (B) | –78.6 | 104.4 | 21.1 |
| Add-on system with DEC (C) | –78.5 | 92.3 | 10.9 |
DEC, direct bypass electrical connection; FID, free induction decay.
Phantom imaging
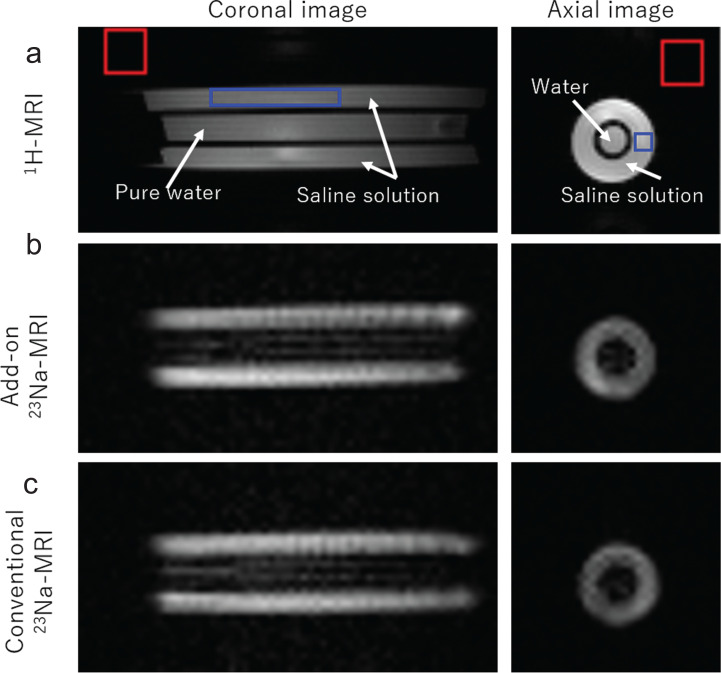
1H and 23Na images of the saline phantom are shown in Fig. 8. The 23Na images were acquired with both the add-on system (Fig. 8b) and the conventional 23Na-MRI system (Fig. 8c). In the 1H image, both the saturated saline solution and pure water were imaged, whereas in the 23Na images, the saturated saline solution was imaged with high intensity, and pure water was not almost visible. Two faint lines may be seen in the inner region of purified water in the coronal image. These would be truncation artifacts because of the limited matrix size.
Fig. 8.
1H-and 23Na-MR images of the phantom. (a) 1H-MR images. (b) 23Na-MR images acquired with the add-on system. (c) 23Na-MR images acquired with the conventional 23Na-MRI system. The red and blue squares indicate the areas used for estimating the noise and signal levels.
The image SNRs are listed in Table 4. The image SNRs for the add-on system were comparable to those for the conventional 23Na-MRI system setting.
Table 4.
Image SNRs estimated from the saturated saline phantom images
| System | SNR (coronal) (dB) | SNR (axial) (dB) |
|---|---|---|
| 1H-MRI system | 42.0 (1H) | 45.2 (1H) |
| Add-on system | 32.5 (23Na) | 32.0 (23Na) |
| Conventional 23Na-MRI | 32.6 (23Na) | 32.8 (23Na) |
In vivo study
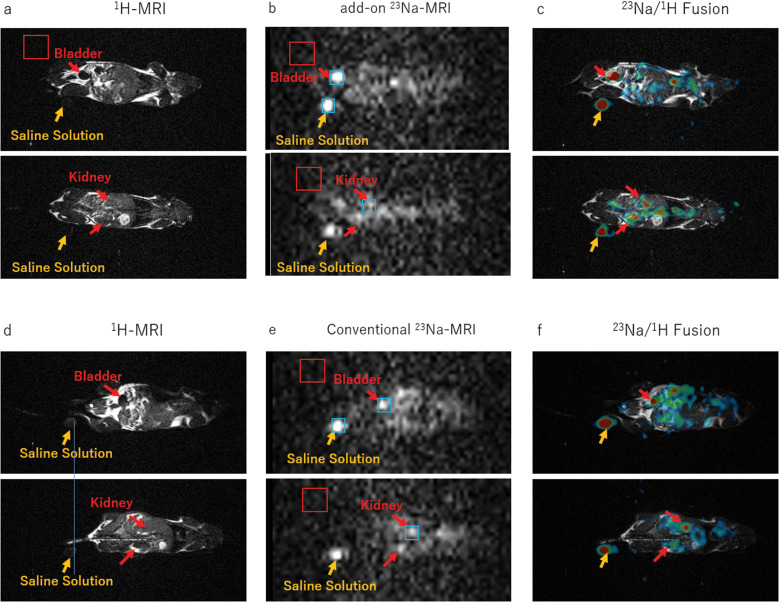
1H and 23Na images of the live mouse are shown in Fig. 9. In the 1H image, the lungs, bladder, and intestines were visualized. The 23Na images acquired with the add-on RF platform showed bright spots around the bladder, kidney, and saline markers, and the image quality was almost the same as the 23Na images acquired with the conventional 23Na system setting.
Fig. 9.
1H- and 23Na-MR images of the live mouse. (a) 1H-MR images acquired with the 1H-MRI system. (b) 23Na-MR images acquired with the add-on system. (c) Fusion images of (a) and (b). (d) 1H-MR images acquired with the 1H-MRI system. (e) 23Na-MR images acquired with the conventional 23Na system. (f) Fusion images of (d) and (e). The red and blue squares indicate the areas used for estimating the noise and signal levels, respectively.
The image SNRs are shown in Table 5. As in the phantom study, the image SNRs for both the systems were almost the same.
Table 5.
Image SNRs estimated from the mouse 23Na images
| System | Saline solution | Bladder | Kidney |
|---|---|---|---|
| Add-on system | 19.8 | 19.9 | 15.1 |
| Conventional 23Na-MRI | 18.3 | 20.3 | 14.2 |
Discussion
In this study, we developed and evaluated an add-on RF platform that enables 23Na-MRI without any modification to an existing 1H-MRI system. The benchmark result revealed that the control signals generated in the add-on RF platform had high fidelity, and the transmit and gate pulses for 23Na-MRI could be generated synchronously with the 1H-MRI system. The performance of the add-on RF platform was confirmed by the 23Na-MRI images of the saline water phantom and live mouse with high SNRs, which is comparable to the conventional system setting. The results are discussed in detail below.
The observed control signal waveforms generated in the add-on system showed high fidelity: the delay times for the rising and falling edges of the 23Na gate pulse were only a few µs, which was short enough compared with a typical RF pulse width of 120 µs and had little effect on the operation of the add-on system. The reason that the control waveform could be generated with such a short delay time is that only analog, not digital, processing was performed in the add-on system; digital processing is prone to longer delays.
While performing 23Na-MRI using the add-on system, it was necessary to prevent the sample from being irradiated by the 1H RF transmitted (excitation) pulse generated by the 1H system. For this purpose, we designed a 1H-RF isolation shield, which was shown to have a shielding efficiency of more than 60 dB. In the 23Na image of the phantom, purified water that did not contain 23Na was not imaged. These results indicate that the shielding performance of the add-on system was sufficiently high.
There was also a concern that the transmission and reception signals of 1H and 23Na might be mixed in the add-on system. For example, there might be coupling between the pickup and transmit coils, and interference between 1H and 23Na frequencies in the crossband converter. However, the saline water phantom imaging result showed that these possibilities were negligible and the separation of the 1H and 23Na transmitting and receiving systems worked well as designed.
The signal loss in the add-on system (21.1 dB) was dominated by the loss in the crossband converter (9.1 dB) and the loss in the electromagnetic coupling between the transmit coil and the 1H birdcage coil (12.0 dB). The most likely sources of loss in the crossband converter are the frequency mixers and LPFs. Based on the datasheet, the loss in the frequency mixer was about 6.5 dB. The loss in the LPF is unknown, but a standard LPF attenuates the signal by only a few dB. Most of the remaining loss occurred in the electromagnetic coupling, and the total signal loss might be improved by optimizing the coil layout to transmit the signal more efficiently.
Despite the larger signal loss compared with the conventional 23Na system setting, the add-on rf platform provided 23Na images with a high SNR, which is comparable to the conventional system setting. Based on Friis’s formula, when the gain of the first-stage amplifier (preamp) is sufficiently high, the SNR of the final signal is determined by the SNR of the input signal and the noise figure (NF) of the first-stage amplifier. This was the case in this study, and the signal loss was compensated by the LNA used as the first-stage amplifier, which had a high NF with little additional noise.
The detection limit of the Na concentration is determined by the coil sensitivity, the NF, and sequence, and can be roughly estimated from the condition that the image SNR is 1. The image SNR was 32.0 dB (Table 4) for the saturated saline phantom with a concentration of approximately 26 wt%. Since the Na signal intensity is proportional to the Na concentration, the concentration at which the SNR is 1 is estimated to be 1 wt%, which gives a typical detection limit. The concentration of Na in the kidney is higher than that of saline (0.9 wt%) and the estimated detection limit.
In the in vivo mouse imaging measurements, strong signals of 23Na were detected in the kidney and bladder. This is consistent with previous studies showing that 23Na tends to accumulate in these regions.3,19 Live mouse 23Na imaging has important roles for preclinical studies, and this result indicates that our system can contribute to these applications.
In this study, we used CS undersampling and signal integration to improve the intrinsically low SNR of the 23Na signal. If the SNR is still too low, CS reconstruction may not work well because of the failure of denoising. However, we confirmed that this was not the case by comparing the CS reconstructed image with the zero-fill image (not shown here).
The following issues should be noted when converting the developed add-on RF platform to other 1H-MRI systems. First, it may be necessary to make new 1H pickup and 23Na transmit and receive coils. This is because the S-parameters may change depending on the coil configuration and the resonance frequency of the target 1H system. This issue is more remarkable when different types of RF coils are used for transmission and reception, as is often the case in clinical scanners. To ease this implementation, it may be possible to prepare several types of 1H pickup coils and transmit coils and make them interchangeable, so that they can be used in various devices. This issue may be mitigated to some extent for clinical 1H-MRI scanners because there are not so many variations in coils supplied by vendors.
The second issue is the reproducibility of the sample (or subject) position. In this study, the magnet bore was very small compared with a clinical scanner. When the target configuration is switched from 1H-MRI to the 23Na-MRI system, the sample has to be removed from the RF coil, the add-on RF coil assembly inserted, and then the sample reinserted. This is not only time-consuming but also reduces the reproducibility of the sample location. However, if a clinical scanner that had a larger useable volume was employed, a more sophisticated platform that might have removable RF isolation shield could be designed. The positioning reproducibility should be better for all of the 1H/23Na overlay imaging.
Third problem is that of free space constriction: the free space in the 1H-RF coil was reduced by installing the add-on RF coil assembly, consisting of the RF shield, pickup and transmit coils, and the 23Na birdcage coil. This leads to a reduction in the available sample size and 1H sensitivity. In this study, the free space in the coil was equivalent to 100 mm DSV when only the 1H-RF coil was used, but when the add-on coil assembly was added, the free space was reduced to less than half of that. There is room for more improvement in the size and placement of these additional devices. For example, the use of flat, surface coils, instead of the 23Na birdcage coil, might increase the free space. In contrast, for actual clinical 23Na imaging, a transmission/receive 1H coil, such as a birdcage head coil, could be used outside the B0 magnetic field. In this setting, the 1H transmission and receive head coils would be just a part of the RF signal transducer line, and therefore, the 1H-RF isolation shield of this study could be smaller. The use of an RF shield with a thinner or smaller casing would also reduce the size of the add-on coil assembly. It is also possible to employ a normal setting of a clinical 1H-MRI with a 1H transmission coil and 1H-receive only coils: a similar alignment of 23Na coils and proper transfer of the receiving signals to each coupled 23Na/1H coils could be usable. A 23Na sensitivity map could be made in the future. The reduced 1H sensitivity would be compensated for by the use of a multichannel array coil with a large number of elements and flexible coil geometry, enabling the close fitting to an imaging object.
The fourth concern is the implementation of short TE sequences. Whether it is possible to image with an extremely short TE depends on the performance of the parent 1H-MRI system, the imaging sequence, and the specific delay of the add-on system. Of course, sequences that cannot be performed on the parent system are impossible to perform. Otherwise, the delay of the add-on system is quite short (a few microseconds), and standard sequences would be almost unaffected. However, sequences with extremely short TE, such as zero echo-time imaging, ultrashort TE imaging, and sweep imaging with Fourier transformation, might be affected.
Conclusion
In this paper, we proposed a new method for realizing 23Na-MRI with minimal modifications to the standard 1H MRI at minimal cost. Using the RF CBR, we have developed a prototype of an RF add-on 23Na platform that can realize 23Na-MRI by attaching to an existing 1H-MRI system. The CBR generated the control signals for 23Na-MRI with high fidelity. The performance of the add-on system was evaluated using phantom and in vivo studies. The add-on system provided 23Na-MR images with comparable image quality and SNR to the conventional 23Na-MRI system, without modifying the scanner configuration. The concept of the proposed system is applicable to other conventional 1H-MRI scanners and would provide the opportunity to assess the clinical and research applications of 23Na -MRI.
Acknowledgment
This research was supported by Japan Agency for Medical Research and Development (AMED) under Grant Number JP20hm0102062.
Footnotes
Conflicts of Interest
Tomoyuki Haishi is an employment of MRTechnology Inc. The other authors declare that they have no conflicts of interest.
Supplementary Information
Supplementary files below are available online.
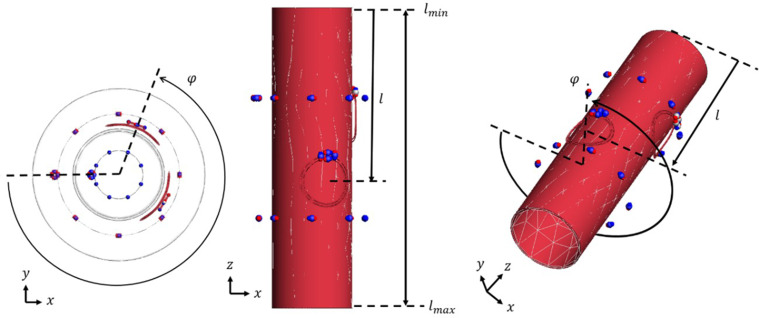
Optimization of configurations of pickup/transmit coil The configurations of pickup/transmit coils were optimized in advance using a commercial electromagnetic simulator (FEKO, www.feko.info) in such a way that the transfer functions between the pickup coil and 1H-RF coil and that between the transmit coil and 1H-RF coil were maximized. The optimization was performed as follows. Let φ be the azimuth angle and l be the axial position of the center of the coil (Supplementary Fig. 1), the parameter ranges are listed in Supplementary Fig. 1. The object function for the pickup coil (or transmit coil) optimization was the transfer function between the pickup coil (or transmit coil) and the 1H birdcage RF coil. An optimal solution (φopt, lopt) with the maximum objective function was obtained by a particle swarm optimization algorithm.
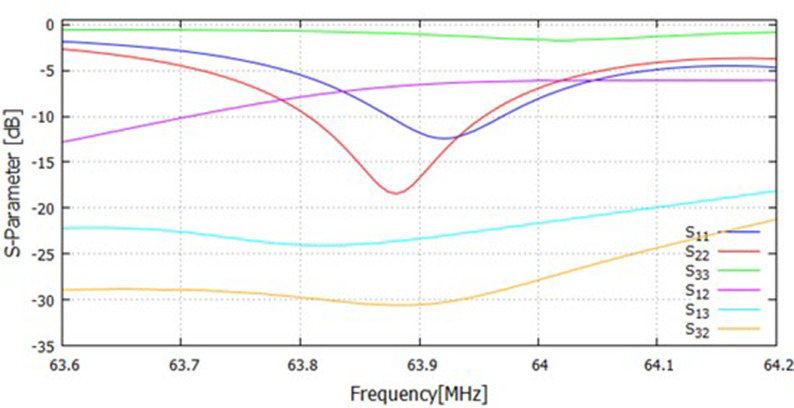
The optimal solutions are listed in Supplementary Table 2. The pickup and transmit coils used in this study were constructed according to this optimization result. Supplementary Fig. 2 shows the S-parameters measured with the constructed coils.
Supplementary Fig. 1.
Coil configuration.
Supplementary Fig. 2.
S-parameters measured for the constructed pick-up, transmit, and 1H birdcage RF coils. 1: pick-up coil; 2: transmit coil; 3: 1H birdcage RF coil.
Supplementary Table 1.
Search ranges for optimization.
Supplementary Table 2.
Optimal solutions.
References
- 1.Hu R, Kleimaier D, Malzacher M, et al. X-nuclei imaging: Current state, technical challenges, and future directions. J Magn Reson Imaging 2020; 51:355–376. [DOI] [PubMed] [Google Scholar]
- 2.Zöllner FG, Kalayciyan R, Chacón-Caldera J, et al. Pre-clinical functional Magnetic Resonance Imaging Part I: The kidney. Z Med Phys 2014; 24:286–306. [DOI] [PubMed] [Google Scholar]
- 3.Zöllner FG, Konstandin S, Lommen J, et al. Quantitative sodium MRI of kidney. NMR Biomed 2016; 29:197–205. [DOI] [PubMed] [Google Scholar]
- 4.Haneder S, Michaely HJ, Schoenberg SO, et al. Assessment of renal function after conformal radiotherapy and intensity-modulated radiotherapy by functional 1H-MRI and 23Na-MRI. Strahlenther Onkol 2012; 188:1146–1154. [DOI] [PubMed] [Google Scholar]
- 5.Maril N, Rosen Y, Reynolds GH, et al. Sodium MRI of the human kidney at 3 Tesla. Magn Reson Med 2006; 56:1229–1234. [DOI] [PubMed] [Google Scholar]
- 6.Shah NJ, Worthoff WA, Langen KJ. Imaging of sodium in the brain: a brief review. NMR Biomed 2016; 29:162–174. [DOI] [PubMed] [Google Scholar]
- 7.Petracca M, Fleysher L, Oesingmann N, et al. Sodium MRI of multiple sclerosis. NMR Biomed 2016; 29:153–161. [DOI] [PMC free article] [PubMed] [Google Scholar]
- 8.Petracca M, Vancea RO, Fleysher L, et al. Brain intra- and extracellular sodium concentration in multiple sclerosis: a 7 T MRI study. Brain 2016; 139:795–806. [DOI] [PubMed] [Google Scholar]
- 9.Dani KA, Warach S. Metabolic imaging of ischemic stroke: the present and future. AJNR Am J Neuroradiol 2014; 35(6 Suppl):S37-43. [DOI] [PubMed] [Google Scholar]
- 10.Bottomley PA. Sodium MRI in human heart: a review. NMR Biomed 2016; 29:187–196. [DOI] [PMC free article] [PubMed] [Google Scholar]
- 11.Constantinides C. Cardiac multinuclear imaging. In: Constantinides C, ed. Protocols and methodologies in basic science and clinical cardiac MRI. Cham:Springer International Publishing, 2018; 215–236. [Google Scholar]
- 12.Umathum R, Rösler MB, Nagel AM. In vivo 39K MR imaging of human muscle and brain. Radiology 2013; 269:569–576. [DOI] [PubMed] [Google Scholar]
- 13.Guermazi A, Alizai H, Crema MD, et al. Compositional MRI techniques for evaluation of cartilage degeneration in osteoarthritis. Osteoarthritis Cartilage 2015; 23:1639–1653. [DOI] [PubMed] [Google Scholar]
- 14.Fitzsimmons JR, Beck BL, Brooker HR. Double resonant quadrature birdcage. Magn Reson Med 1993; 30:107–114. [DOI] [PubMed] [Google Scholar]
- 15.Isaac G, DSchnall M, Lenkinski RE, et al. A design for a double-tuned birdcage coil for use in an integrated MRI/MRS examination, J Mag Reson 1969; 89:41–50. [Google Scholar]
- 16.Choi CH, Hong SM, Felder J, et al. The state-of-the-art and emerging design approaches of double-tuned RF coils for X-nuclei, brain MR imaging and spectroscopy: A review. Magn Reson Imaging 2020; 72:103–116. [DOI] [PubMed] [Google Scholar]
- 17.Hashimoto S, Kose K, Haishi T. Comparison of analog and digital transceiver systems for MR imaging. Magn Reson Med Sci 2014; 13:285–291. [DOI] [PubMed] [Google Scholar]
- 18.Lustig M, Donoho D, Pauly JM. Sparse MRI: The application of compressed sensing for rapid MR imaging. Magn Reson Med 2007; 58:1182–1195. [DOI] [PubMed] [Google Scholar]
- 19.Near J, Bartha R. Quantitative sodium MRI of the mouse prostate. Magn Reson Med 2010; 63:822–827. [DOI] [PubMed] [Google Scholar]


