

Abstract
Rationale and Objectives:
To determine which methods of assessment of splenic size most accurately represent the actual spleen volume in patients with Chronic Lymphocytic Leukemia (CLL).
Materials and Methods:
The Abdominal Computed Tomography images of 48 patients with CLL enrolled on a phase 2 clinical trial at two time-points before and after 2-months of continuous acalabrutinib treatment were analyzed. Linear one-dimensional measurements of the spleen were taken in different planes. Two-dimensional and three-dimensional measurements were calculated from the linear measurements using mathematical formulae. The spleen volume was determined by manual segmentation as the ground truth. Data derived were analyzed using Pearson correlation and statistical significance was set at p < 0.05.
Results:
Among the single-dimensional measurements, the strongest correlation with the segmented splenic volume was the sagittal long axis diameter (LAD) (r = 0.89, p < 0.05), followed closely by Coronal LAD (r = 0.87, p < 0.05) and cephalocaudal length (iwCLL) (r = 0.84, p < 0.05). For the two-dimensional indices, the sum of LAD and short axis diameter (SAD) of the spleen in axial plane showed good correlation with the splenic volume (r = 0.77, p < 0.05). Among the three-dimensional indices, the splenic index (0.523 × axial LAD × axial SAD × coronal height) and a formula for volume (30 + 0.58 × axial LAD × axial SAD × coronal height) had the strongest correlation (both r = 0.92, p < 0.05) with the spleen volume.
Conclusion:
The three-dimensional formulae showed the strongest correlation with volumetric reference spleen measurement. Among unidimensional measurements, the sagittal LAD had the best correlation with the actual splenic volume. The two-dimensional calculation methods were less reliable.
Keywords: Chronic Lymphocytic Leukemia (CLL), Splenic Volume, Computed tomography (CT)
INTRODUCTION
Chronic lymphocytic leukemia (CLL) is the most common leukemia among adults in the Western world (1,2). An enlarged spleen is frequently found in many hematological disorders and the spleen can be a major site of disease bulk in CLL patients (3–6). Splenic size is an indicator of disease activity in hematological disorders and reduction in spleen volume during treatment has long been believed to be due to the therapeutic effect on malignant lymphocytes associated with splenomegaly (7). Not achieving normalization of spleen size in CLL patients on treatment can be a common reason for not meeting the complete response criteria.(8) Therefore, the appropriate evaluation method of the size of the spleen before, during, and after treatment is useful to make proper therapeutic decisions throughout the course of the disease (7). Choosing an accurate and reproducible method of assessment of the splenic size is valuable while evaluating patients at every stage of CLL management.
Prior to the development of thin-slice computed tomography (CT) volumetry measurement, spleen size was evaluated by less accurate methods which include physical examination (dimension of the spleen below the costal margin in centimeters), several single unidimensional measurements, and multi-dimensional measurements (9,10). These methods may not accurately reflect variations in spleen shape and size during the course of treatment and may not be sufficiently sensitive in cases of borderline splenomegaly (11). Examples of previously used measurements include non-orthogonal single unidimensional measurements of the spleen, such as craniocaudal length, width, or thickness; orthogonal measurements such as the maximum diameters of spleen projected in sagittal, coronal, and transverse planes; formula-based bi-dimensional and multi-dimensional calculations of splenic volume. =(10,12)
A common unidimensional measurement used to determine splenomegaly is the International Workshop on Chronic Lymphocytic Leukemia (iwCLL) guideline method -which uses the craniocaudal length of the spleen (9). Another frequently used multi-dimensional method is the splenic index which is a product of maximal axial length, coronal height, and maximal thickness of the spleen (10). However, so far, there has been no general agreement regarding whether unidimensional, bi-dimensional, multidimensional, or volumetric measurements should be routinely used to determine splenomegaly (13).
The size, shape and contour of the spleen vary considerably from one patient to another (14). This variation is also seen in the same patient during changes between healthy and disease states as well as during different stages of disease. This complex and highly variable shape of the spleen makes volumetric measurement more accurate than linear dimensional measurement, thereby making it the method of choice for spleen size evaluations (3,14,15). CT is the imaging modality of choice for screening and follow up of patients with CLL according to recent guidelines (9). Other imaging modalities such as Ultrasound and MRI have their limitations. Ultrasound is more operator dependent and is not routinely used for for follow-up of CLL patients (16). MRI, when compared to CT is more more expensive, less widely available, technically more difficult to perform and more prone to motion artifacts.
While the thin-slice CT volumetry method of determining spleen volume clearly shows better accuracy compared to unidimensional and bi-dimensional methods, it is time-consuming, labor-intensive and not widely available (10,14). A single unidimensional spleen measurement method increases speed, ease of use, uniformity and reproducibility. Therefore, there is a need to determine the most efficient and accurate measurement method that correctly reflects the volume of the spleen. The aim of this study is to determine which unidimensional, bi-dimensional and multi-dimensional methods of assessment of splenic size most accurately correlate with the ground truth of segmented splenic volume evaluation.
MATERIALS AND METHODS
Study Population
Between January 2015 and June 2018, 48 patients (Table 1) with CLL were enrolled on a phase 2 clinical trial of acalabrutinib; results of which have been reported (17). All patients underwent contrast-enhanced Computed Tomography (CT) scan of the chest, abdomen and pelvis done before the commencement of treatment. All CT exams were performed under procedures and protocols approved by the Institutional Review Board of the National Institutes of Health. Written informed consent was obtained from all subjects prior to participating in the study. In this study we compared the performance of different methods of assessing spleen size on these CT scans before and 2 months after the treatment. Four patients did not have follow up CT scans after the treatment.
TABLE 1.
Patients’ Demographic Data
| N = 48 | Mean | SD | Min | Max |
|---|---|---|---|---|
|
| ||||
| Age (year) | 64 | 9 | 46 | 84 |
| Height (cm) | 173.64 | 11.07 | 149.10 | 195.20 |
| Weight (kg) | 84.42 | 18.66 | 44.80 | 134.10 |
| Body Mass Index (kg/m2) | 27.84 | 4.86 | 19.66 | 41.38 |
Technical Parameters
Imaging was performed using multi-slice CT scanners Siemens Somatom force: 384-slice with acquisition at 120 kV; 220 mAs, Siemens Perspective: 128-slice with acquisition at 130 kV; 162 mAs (Erlangen, Germany), Philips Brillance 64, 64-slice: with acquisition at 120 kV; 220 mAs (Eindhoven, The Netherlands), GE Discovery 600: 16-slice with acquisition at 120 kV; 68 mAs (Milwaukee, USA), Canon Aquilion One: 320-slice with acquisition at 120 kV; 94 mAs (Melville, USA), slice thickness of 2 mm. Contrast-enhanced CT images were acquired with non-ionic contrast agents at the portal venous phase during a single breath.
Measurements Method
The linear measurements and volume of the spleen on the contrast-enhanced CT images were measured by a radiologist with 2 years of experience (O.O.) and reviewed by another radiologist with 27 years of experience (H.B.). We used Carestream picture archiving and communication system medical image processing software version 12.2.2.1024 (Carestream Health Inc., Rochester, NY, USA) to measure the dimensions. Measurements were done in soft tissue window (window width = 450, level = 50). All linear measurements were recorded in centimeters, while the volume of the spleen was calculated in cm3 (Table 2).
TABLE 2.
Mean Dimensions for Patients’ Spleen Size Indices and Volumes
| N = 92 | Mean | SD | Max | Min |
|---|---|---|---|---|
|
| ||||
| Axial LAD (cm) | 14.02 | 2.72 | 20.70 | 9.00 |
| Axial SAD (cm) | 7.96 | 2.25 | 12.80 | 4.10 |
| IWCLL H (cm) | 13.89 | 3.20 | 21.80 | 7.50 |
| Coronal LAD (cm) | 14.62 | 2.78 | 22.20 | 9.40 |
| Sag LAD (cm) | 14.98 | 3.59 | 24.50 | 9.00 |
| Axial Bi-D product (cm2) | 116.29 | 51.97 | 264.96 | 38.70 |
| Axial Sum (cm) | 21.98 | 4.73 | 33.50 | 13.30 |
| Axial Ratio1 | 1.83 | 0.34 | 3.26 | 1.26 |
| Axial Ratio2 | 0.56 | 0.10 | 0.79 | 0.31 |
| Formula1 Volume (cm3) | 1011.12 | 579.99 | 2842.29 | 239.47 |
| Formula2 Volume (cm3) | 932.39 | 531.25 | 2539.54 | 222.96 |
| Splenic Index (cm3) | 884.70 | 522.99 | 2535.91 | 188.88 |
| Splenic Volume (cm3) | 753.66 | 457.43 | 2056.62 | 124.45 |
On the axial plane, the long axis diameter (axial LAD) was measured as the maximal length between the poles of the spleen in the axial plane and the short axis diameter (axial SAD) was measured as the widest dimensions perpendicular to the LAD on the same plane (Fig 1). On the coronal plane, the long axis dimension (coronal LAD) was measured as the maximal length between the poles of the spleen, and the vertical height (coronal cephalocaudal height or iwCLL height) was measured as the longest vertical dimension between cranial and caudal borders of the spleen (Figs 2 and 3). On the sagittal plane, the long axis dimension (sagittal LAD) was measured as the maximal length between the poles of the spleen on this plane (Fig 4).
Figure 1.

Example of measurement of axial long axis diameter (a–b) and axial short-axis diameter (c–d) of the spleen.
Figure 2.

Example of measurement of coronal long axis diameter (e–f) of the spleen.
Figure 3.
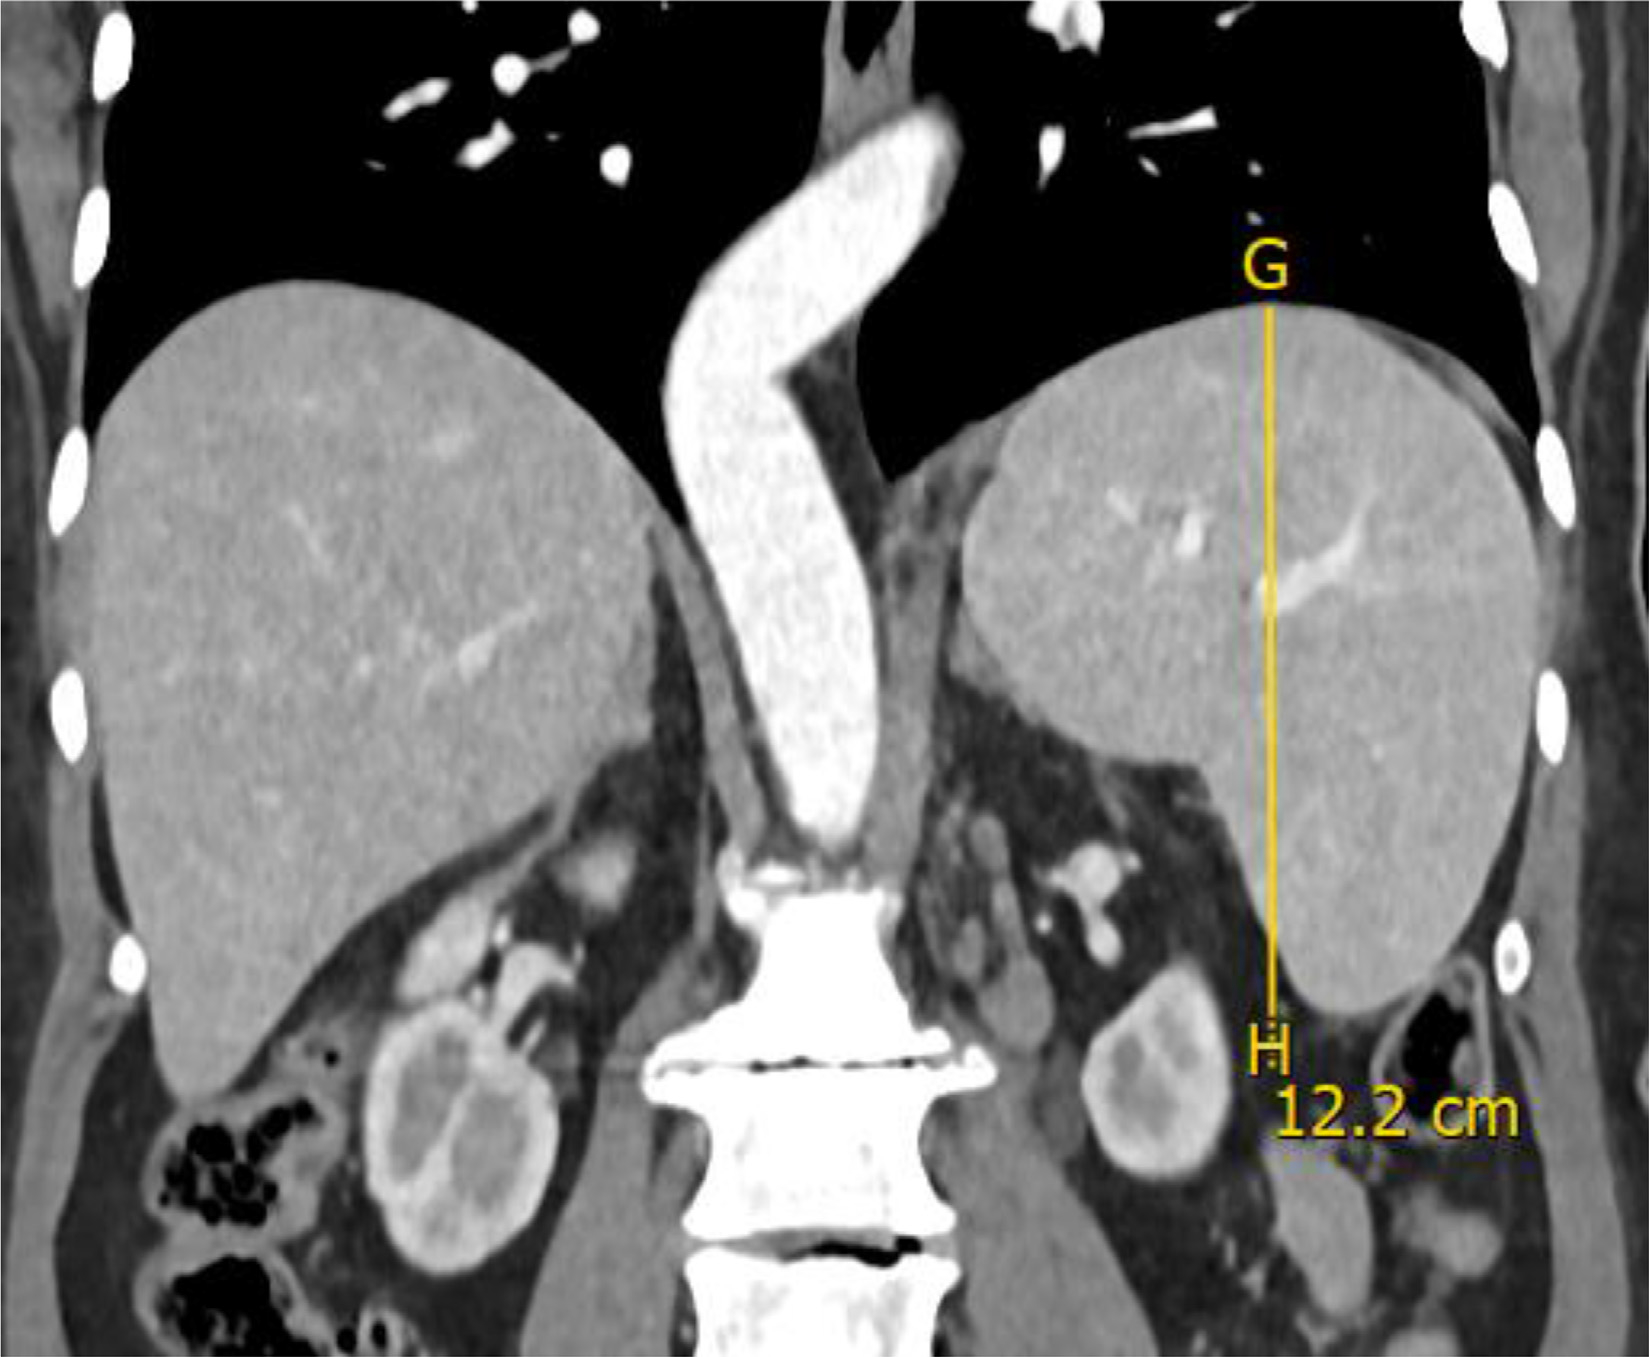
Example of measurement of coronal vertical height (g–h) of the spleen.
Figure 4.

Example of measurement of sagittal long axis diameter (i–j) of the spleen.
Using these dimensions, we calculated the splenic bi-dimensional product value as a product of axial LAD and axial SAD (i.e., axial LAD × axial SAD), the axial sum as the addition of axial LAD and axial SAD (i.e., axial LAD + axial SAD), the axial ratio-1 as axial LAD divided by axial SAD (i.e., axial LAD ÷ axial SAD) and the axial ratio-2 as axial SAD divided by axial LAD (i.e., axial SAD ÷ axial LAD). We also calculated the derived splenic volume using two volume formulations (formula-1 = 30 + 0.58 × axial LAD × axial SAD × coronal height (18) and formula-2 =0.524 × axial LAD × axial SAD × coronal LAD (19) as well as the Splenic index (20) (i.e., 0.523 × axial LAD × axial SAD × coronal height). We measured the actual spleen volume by manually segmenting the spleen boundary using the Vitrea Software version 7.11.6.38 (Vital Images Inc., Minnetonka, MN, USA) segmentation tool in the axial section, followed by sagittal and coronal modification and correction, after which the splenic volume was automatically computed and recorded (Fig 5).
Figure 5.

Examples of Coronal (Left) and Sagittal (Right) three-dimensional reconstruction of the spleen (blue color) and calculation of its volume (Color version of figure is available online.)
Statistical Analysis
Statistical analysis was performed in Python v.3.8 (Python Software Foundation) using the SciPy statistics package. Data are expressed as mean ± standard deviation (SD) unless specified. The relationships of each spleen size index (Axial LAD, Axial SAD, IWCLL H, Coronal LAD, Sag LAD, Axial Bi-D product, Axial Sum, Axial Ratio-1, Axial Ratio-2, Formula-1 Volume, Formula-2 Volume, Splenic Index) versus the spleen volume as measured by Vitrea (Splenic Volume) were evaluated by linear correlations. The Shapiro-Wilk test was used to test for the normality of each measurement distribution. The Pearson correlation coefficient (r) was used to compare the relationship between each spleen measurement (the linear-dimensional values, the bi-dimensional values, and the volumetric formulations) versus the reference spleen volume.
All spleen measurements are considered continuous variables and normalized (n) to the same unity range between 0 and 1 for further comparisons. (i.e., nAxial LAD, nAxial SAD, nIWCLL H, nCoronal LAD, nSag LAD, nAxial Bi-D product, nAxial Sum, nAxial Ratio-1, nAxial Ratio-2, nFormula-1 Volume, nFormula-2 Volume, nSplenic Index, nSplenic Volume). We compared each normalized spleen measurement versus the normalized reference splenic volume using two-tailed, paired student’s t-test (Wilcoxon signedrank, if not normal). A p-value < 0.05 was considered statistically significant for each statistical test. Bland and Altman (BA) plot was used to compare the relative agreement between each normalized spleen index versus the normalized reference spleen volume. The estimated relative bias from BA analysis can be considered as the percentage of difference to the reference splenic volume.
RESULTS
A total of 92 abdomen CT scans of the 48 subjects were studied. There were 33 males and 15 females. The mean age of the subjects was 64 ± 9 years. As summarized in Table 1, the mean height and weight were 173.64 ± 11.07 cm and 84.42 ± 18.66 kg respectively. The mean body mass index was 27.84 ± 4.86.
The mean, SD and the range of different spleen size and volume measurements from all 92 scans were summarized in Table 2. The normalized values for all spleen measurements were summarized in Table 3. To compare each spleen measurements versus the reference splenic volume, Table 4 summarized the Pearson correlation coefficient as well as the relative bias of agreement from the normalized spleen measurements. For separate baseline and follow-up analyses, please see Appendix for additional information.
TABLE 3.
Mean Dimensions for Patients’ Normalized Spleen Size Indices and Volumes. (N: Normalized)
| N = 92 | Mean | SD | Max | Min |
|---|---|---|---|---|
|
| ||||
| nAxial LAD | 0.43 | 0.23 | 1.00 | 0.00 |
| nAxial SAD | 0.44 | 0.26 | 1.00 | 0.00 |
| nlWCLL H | 0.45 | 0.22 | 1.00 | 0.00 |
| nCoronal LAD | 0.41 | 0.22 | 1.00 | 0.00 |
| nSag LAD | 0.39 | 0.23 | 1.00 | 0.00 |
| nAxial Bi-D product | 0.34 | 0.23 | 1.00 | 0.00 |
| nAxial Sum | 0.43 | 0.23 | 1.00 | 0.00 |
| nAxial Ratio1 | 0.29 | 0.17 | 1.00 | 0.00 |
| nAxial Ratio2 | 0.53 | 0.20 | 1.00 | 0.00 |
| nFormula1 Volume | 0.30 | 0.22 | 1.00 | 0.00 |
| nFormula2 Volume | 0.31 | 0.23 | 1.00 | 0.00 |
| nSplenic lndex | 0.30 | 0.22 | 1.00 | 0.00 |
| nSplenic Volume | 0.33 | 0.24 | 1.00 | 0.00 |
TABLE 4.
Comparison of Different Spleen Size Indices with the Reference Splenic Volume
| vs. nSplenic Volume | Pearson (r) | BA (bias) | p value |
|---|---|---|---|
|
| |||
| nAxial LAD | 0.81 | 0.10 | < 0.05 |
| nAxial SAD | 0.66 | 0.12 | < 0.05 |
| nIWCLL H | 0.84 | 0.12 | < 0.05 |
| nCoronal LAD | 0.87 | 0.08 | < 0.05 |
| nSag LAD | 0.89 | 0.06 | < 0.05 |
| nAxial Bi-D product | 0.76 | 0.02 | NS |
| nAxial Sum | 0.77 | 0.10 | < 0.05 |
| nAxial Ratio-1 | −0.19 | −0.04 | NS |
| nAxial Ratio-2 | 0.20 | 0.20 | < 0.05 |
| nFormula-1 Volume | 0.92 | −0.03 | < 0.05 |
| nFormula-2 Volume | 0.89 | −0.02 | NS |
| nSplenic lndex | 0.92 | −0.03 | < 0.05 |
(r: Pearson correlation coefficient, BA:,Bland-Altman, NS, not-significant)
Among the single-dimensional measurements, the strongest linear correlation with the ground truth of segmented splenic volume was the sagittal LAD (r = 0.89, p < 0.05) followed closely by coronal LAD (r = 0.87, p < 0.05) and coronal cephalocaudal (CC) height (r = 0.84, p < 0.05) as shown in Figure 6. The least linear correlation with splenic volume was axial SAD (r = 0.66, p < 0.05). In the Bland-Altman analysis, the sagittal LAD had the least bias of 0.06 as well as the narrowest limits of agreement compared to the reference splenic volume. On the other hand, both the Coronal CC Height and axial SAD had the largest bias of 0.12 and the axial SAD has the widest limits of agreement (not shown) among all single-dimensional measurements.
Figure 6.

Scatterplots of data showing correlations between linear dimension indices and splenic volume. Bland-Altman plots of data showing inter-observer variability between linear dimension indices and splenic volume.
When comparing the two-dimensional products of the axial measurements, the splenic axial sum and axial bi-dimensional product showed good correlations with the splenic volume (r = 0.77, p < 0.05) and (r = 0.76, p=non-significant [NS]) respectively, as shown in Figure 7. However, the BA plot suggested that the bias was much smaller in the axial bi-dimensional product (bias = 0.02) than in the axial sum (bias = 0.10). Both ratios of axial SAD and LAD had a poor correlation with the splenic volume and the widest limits of agreement (not shown) among all measurements.
Figure 7.

Scatterplots of data showing correlations between two-dimensional indices (the product of Axial LAD and Axial SAD and the sum of Axial LAD and axial SAD) and splenic volume. Bland-Altman plots of data showing inter-observer variability between two-dimensional indices and splenic volume.
All three-dimensional calculated volumes correlated strongly with the reference splenic volume measured by manual segmentation as shown in Figure 8. The splenic index and formula-1 volume had the strongest correlation (both r = 0.92, p < 0.05) followed by the formula-2 volume (r = 0.89, p = NS). These results are consistent with the BA analysis showing the least bias (−0.03) as well as narrower limits of agreement among these formulated volumes.
Figure 8.

Scatterplots of data showing correlations between three-dimensional indices and splenic volume. Bland-Altman plots of data showing inter-observer variability between three-dimensional indices and splenic volume.
DISCUSSION
In this study, we assessed three sets of metrics in the evaluation of spleen size and compared these metrics with the ground truth of segmented spleen volume to understand which methods of measurement of splenic size most accurately correlates with splenic volume in patients with CLL at the baseline and 2-months post treatment. Our endpoint was to determine the most efficient and accurate measurement method that correctly reflects the volume of the spleen. We found that the sagittal long axis diameter is the single-dimensional measurement method that most correctly reflects the actual volume of the spleen and the splenic index and a formula for volume (30 + 0.58 × axial LAD × axial SAD × coronal height) had the strongest correlation with the spleen volume.
The presence of splenomegaly in a patient can be determined either by physical examination or by imaging. Each imaging modality has its different advantages and drawbacks. Ultrasonography is less expensive, commonly available, and does not utilize ionizing radiation. However, it is user-dependent and results vary with the skill of the sonographer. Also, ultrasound measurements have been reported to overestimate the splenic volume. (21) Magnetic Resonance Imaging, like ultrasound, does not use ionizing radiation but is expensive, time-consuming, and not as widely available as CT and ultrasound. CT is a widely available form of imaging and is considered to be the most accurate method for both diagnosis and follow-up of suspected and confirmed cases of splenomegaly. (10) Recent guidelines in the management of CLL patients with splenomegaly suggest the use of CT as the imaging modality of choice for the diagnosis and follow-up during treatment. (9)
Our study in CLL patients found that the sagittal LAD (r = 0.89) was the unidimensional method that correlated best with the splenic volume and had the least relative bias of agreement (0.06). This was then followed closely by coronal LAD (r = 0.87) and craniocaudal height (r = 0.84), however, with a modest increased relative bias (0.08 and 0.12). A report by Kucybala et al. suggested that the coronal LAD is the unidimensional method that best correlated with splenic volume. (10) Kucybala et al. did not collect data on sagittal LAD thus the authors did not report on this important index.
Another recent study by Gunes et al. suggested that the vertical height index is the best unidimensional method for the determination of splenomegaly (4). Similarly, Nuffer et al reported that the coronal CC height is the most sensitive and specific single measurement for massive splenomegaly (22). Nuffer et al. did not collect data on Sagittal LAD. It is worth mentioning that Gunes et al., Kucybala et al. and Nuffer et al. did not target or recruit patients already diagnosed with CLL and undergoing treatment as we did. The difference between the results of our study and these studies may include the fact that the normal splenic shape and contour can change considerably in subjects with lymphoproliferative disorders including CLL (23).
The splenic axial bi-dimensional product correlated moderately with the actual splenic volume (r = 0.76), whereas the ratio of axial LAD and SAD, as well as the ratio of axial SAD and LAD correlated poorly with the actual splenic volume. Our findings show that the splenic axial bi-dimensional correlation coefficient is weak when compared to some unidimensional coefficients. This result suggests that the axial bi-dimensional coefficient is not a reliable tool for the determination of splenomegaly or the assessment of changes in the volume of the spleen. A recent publication suggested that the splenic axial bi-dimensional coefficient has a low sensitivity in screening for splenomegaly when compared to unidimensional methods such as maximal length, maximal height and vertical height (10).
We found that all three-dimensional formulae for calculation of splenic volume showed a higher correlation than two-dimensional and one-dimensional methods – making three-dimensional formulae the best method of determining the splenic volume. This was similar both in pre and post treatment scans. Similar recent studies on the determination of splenomegaly on CT suggests that the three-dimensional calculation of splenic volume correlates best with actual spleen volume (10,12). Our findings suggest that these formulae can be used as an alternative to detect splenomegaly and assess volume changes in the spleen during the treatment of patients with CLL. The splenic index and the formula-1 volume had the strongest correlation (r = 0.92) and the least relative bias (−0.03) with the actual volume of the spleen. Similar strong correlations were reported in previous similar studies. Kucybala et al. recorded a correlation of 0.946 for the product of maximal length, maximal thickness, and vertical height (axial LAD × axial SAD × coronal CC height). (10) However considering the cost of time and effort needed to achieve minimal improvement by using volumetric measurements, a one-dimensional method of measurement is still acceptable. Considering that a one-dimensional measurement is more practical in daily practice, we found that the Sag LAD had the best correlation with segmented splenic volumetry.
As mentioned earlier, we have performed additional analysis of different spleen size measurements on the baseline as well as 2-months post-treatment separately. We found that the three-dimensional formula showed the best correlations with volumetric reference spleen measurements, followed by the one dimensional and then the two-dimensional methods.
One limitation of this study is its small sample size. Among one-dimension measurements, we noticed that the Sag LAD was slightly better than Coronal LAD and iwCLL. This needs validation in a future study with a larger sample size. A technical limitation of this study is that the first reader made the measurements and then the second reader modified the measurements as needed. Evaluation of intra and inter-reader variabilities should be included in future studies. Another limitation of this study is that we evaluated spleen size changes only at the baseline and 2-months post-treatment. Evaluation of splenic measurements in longer follow up may shed additional light on this.
We identified Sag LAD as the one-dimension measurement that best correlated with true splenic volume, while Coronal LAD and craniocaudal length as recommended by iwCLL were less accurate. This needs validation in a future study, ideally in a multicenter, prospective setting. Also of interest will be to include patients with different types of hematologic malignancies. To test our approach also in the setting of active therapy, we included measurements at baseline and after 2-months of treatment. We observed regression of spleen size in treated patients and, importantly, the correlation between true spleen size and dimensional measurements remained comparable between timepoints. However, future studies should also include splenic measurements at later timepoints to confirm the correlation of Sag LAD with spleen volume across a larger dynamic range.
In conclusion, three-dimensional formulae based on the product of axial LAD, axial SAD and coronal CC height showed the strongest correlation with volumetric reference spleen measurement than two-dimensional and one-dimensional methods, making them the most superior approach for determining the splenic volume in CLL patients. The two-dimensional calculation methods are not reliable for the determination of splenomegaly or the assessment of the volume of the spleen. For unidimensional measurements of spleen size, the sagittal LAD agrees the best with the actual splenic volume of CLL patients in our cohort and thus can be used to facilitate a quick assessment of spleen size.
Supplementary Material
ACKNOWLEDGMENTS
This work was supported by the intramural research program of the Clinical Center and National Heart, Lung and Blood Institute, National Institutes of Health (Grant No. Z99 CL999999).
Abbreviations:
- BAp
Bland and Altman
- CC
Coronal Cephalocaudal
- CLL
Chronic Lymphocytic Leukemia
- CT
Computed Tomography
- iwCLL
International Workshop on Chronic Lymphocytic Leukemia
- LAD
Long Axis Diameter
- n
Normalized
- PACS
Picture Archiving and Communication System
- SAD
Short Axis Diameter
Footnotes
SUPPLEMENTARY MATERIALS
Supplementary material associated with this article can be found in the online version at doi:10.1016/j.acra.2022.06.013.
Contributor Information
Olanrewaju A. Ogunleye, Department of Radiology and Imaging Sciences, Clinical Center, National Institutes of Health, Bethesda, Maryland.
Li-Yueh Hsu, Department of Radiology and Imaging Sciences, Clinical Center, National Institutes of Health, Bethesda, Maryland.
Clare C. Sun, National Heart, Lung, and Blood Institute, National Institutes of Health, Bethesda, Maryland.
Pia Nierman, National Heart, Lung, and Blood Institute, National Institutes of Health, Bethesda, Maryland.
Adrian Wiestner, National Heart, Lung, and Blood Institute, National Institutes of Health, Bethesda, Maryland.
Elizabeth C. Jones, Department of Radiology and Imaging Sciences, Clinical Center, National Institutes of Health, Bethesda, Maryland.
Hadi Bagheri, Department of Radiology and Imaging Sciences, Clinical Center, National Institutes of Health, Bethesda, Maryland.
REFERENCES
- 1.Song MK, Chung JS, Lee HS, et al. Splenic volume can be a novel predictive parameter for the prognosis of chronic lymphocytic leukemia? Ann Oncol 2010; 21(12):2443–2445. [DOI] [PubMed] [Google Scholar]
- 2.Rozman C, Montserrat E. Chronic lymphocytic leukemia. N Engl J Med 1995; 333(16):1052–1057. [DOI] [PubMed] [Google Scholar]
- 3.Linguraru MG, Richbourg WJ, Farooqui M, et al. 3.1 Natural History of Splenomegaly in CLL from Automated Volumetric Analysis. Clin Lymph, Myel Leuk 2011; 11:196. [Google Scholar]
- 4.Gunes SO, Akturk Y. Determination of splenomegaly by coronal oblique length on CT. Japanese J radiol 2018; 36(2):142–150. [DOI] [PubMed] [Google Scholar]
- 5.Zhang B, Lewis SM. The splenomegaly of myeloproliferative and lymphoproliferative disorders: splenic cellularity and vascularity. Eur J Haematol 1989; 43(1):63–66. [DOI] [PubMed] [Google Scholar]
- 6.Herman SE, Niemann CU, Farooqui M, et al. Ibrutinib-induced lymphocytosis in patients with chronic lymphocytic leukemia: correlative analyses from a phase II study. Leukemia 2014; 28(11):2188–2196. [DOI] [PMC free article] [PubMed] [Google Scholar]
- 7.Lamb PM, Lund A, Kanagasabay RR, et al. Spleen size: how well do linear ultrasound measurements correlate with three-dimensional CT volume assessments? Br J Radiol 2002; 75(895):573–577. [DOI] [PubMed] [Google Scholar]
- 8.Ahn IE, Farooqui MZ, Tian X, et al. Depth and durability of response to ibrutinib in CLL: 5-year follow-up of a phase 2 study. Blood 2018; 131 (21):2357–2366. [DOI] [PMC free article] [PubMed] [Google Scholar]
- 9.Hallek M, Cheson BD, Catovsky D, et al. iwCLL guidelines for diagnosis, indications for treatment, response assessment, and supportive management of CLL. Blood 2018; 131(25):2745–2760. [DOI] [PubMed] [Google Scholar]
- 10.Kucybała I, Ciuk S, Tęczar J. Spleen enlargement assessment using computed tomography: which coefficient correlates the strongest with the real volume of the spleen? Abdom Radiol 2018; 43(9):2455–2461. [DOI] [PMC free article] [PubMed] [Google Scholar]
- 11.Imamoglu H, Zararsız G, Özdemir M, et al. The orthogonal measurements approach in estimating spleen size on CT images. Diagnost Intervent Radiol 2020; 26(1):5. [DOI] [PMC free article] [PubMed] [Google Scholar]
- 12.Bezerra AS, D’Ippolito G, Faintuch S, et al. Determination of splenomegaly by CT: is there a place for a single measurement? Am J Roentgenol 2005; 184(5):1510–1513. [DOI] [PubMed] [Google Scholar]
- 13.Cheson BD, Fisher RI, Barrington SF, et al. Recommendations for initial evaluation, staging, and response assessment of Hodgkin and non-Hodgkin lymphoma: the Lugano classification. J Clin Oncol 2014; 32(27):3059. [DOI] [PMC free article] [PubMed] [Google Scholar]
- 14.Pattanayak P, Turkbey EB, Summers RM. Comparative evaluation of three software packages for liver and spleen segmentation and volumetry. Acad Radiol 2017; 24(7):831–839. [DOI] [PubMed] [Google Scholar]
- 15.Linguraru MG, Sandberg JK, Jones EC, et al. Assessing splenomegaly: automated volumetric analysis of the spleen. Acad Radiol 2013; 20 (6):675–684. [DOI] [PMC free article] [PubMed] [Google Scholar]
- 16.Andrews MW. Ultrasound of the spleen. World J Surg 2000; 24(2):183–187. [DOI] [PubMed] [Google Scholar]
- 17.Sun CC, Nierman PK, Kendall EK, et al. Clinical and biological implications of target occupancy in CLL treated with the BTK inhibitor acalabrutinib. Blood 2020; 136(1):93–105. [DOI] [PMC free article] [PubMed] [Google Scholar]
- 18.Prassopoulos P, Daskalogiannaki M, Raissaki M, et al. Determination of normal splenic volume on computed tomography in relation to age, gender and body habitus. Eur Radiol 1997; 7(2):246–248. [DOI] [PubMed] [Google Scholar]
- 19.Yetter EM, Acosta KB, Olson MC, et al. Estimating splenic volume: sonographic measurements correlated with helical CT determination. Am J Roentgenol 2003; 181(6):1615–1620. [DOI] [PubMed] [Google Scholar]
- 20.Badran DH, Kalbouneh HM, Al-Hadidi MT, et al. Ultrasonographic assessment of splenic volume and its correlation with body parameters in a Jordanian population. Saudi medical journal. 2015;36 (8):967. [DOI] [PMC free article] [PubMed] [Google Scholar]
- 21.Elstein D, Hadas-Halpern I, Azuri Y, et al. Accuracy of ultrasonography in assessing spleen and liver size in patients with Gaucher disease: comparison to computed tomographic measurements. J Ultrasound Med 1997; 16(3):209–211. [DOI] [PubMed] [Google Scholar]
- 22.Nuffer Z, Marini T, Rupasov A, et al. The best single measurement for assessing splenomegaly in patients with cirrhotic liver morphology. Acad Radiol 2017; 24(12):1510–1516. [DOI] [PubMed] [Google Scholar]
- 23.Hanson JA, Papageorges M, Girard E, et al. Ultrasonographic appearance of splenic disease in 101 cats. Vet Radiol Ultrasound 2001; 42 (5):441–445. [DOI] [PubMed] [Google Scholar]
Associated Data
This section collects any data citations, data availability statements, or supplementary materials included in this article.