

Abstract
Background:
Although T1ρ and T2 have emerged as early indicators for hip osteoarthritis (OA), there is little information regarding longitudinal changes across the cartilage in the early stages of this disease.
Purpose:
To characterize the variability in two-year hip cartilage T1ρ and T2 changes and investigate associations between these patterns of change and common indicators of hip OA.
Study Type:
Prospective
Population:
25 women (age: 51.9±16.3 yo; BMI: 22.6±2.0 kg/m2) and 17 men (age: 55.8±14.9 yo; BMI: 24.4±3.8 kg/m2) that were healthy or with early-to-moderate hip OA.
Field Strength/Sequence:
3T MRI (GE), 3D combined T1ρ/T2 Magnetization-Prepared Angle-Modulated Partitioned k-Space Spoiled Gradient Echo Snapshots.
Assessment:
principal component (PC) analysis of Z-score difference maps of two-year changes in hip cartilage T1ρ and T2 relaxation times, participant Hip disability and Osteoarthritis Outcome Scores (HOOS) and functional tests at two-year follow-up.
Statistical Tests:
Shapiro Wilkes tests, unpaired t-tests, Kruskal Wallis tests, Pearson or Spearman (ρ) correlations. Significance was set at p<0.05.
Results:
Women (−6.40±14.48) had significantly lower T1ρ PC1 scores than men (10.05±26.15). T1ρ PC4 was significantly correlated with HOOSsport, HOOSsymptoms, HOOSpain, HOOSadl, and HOOSqol at two-year follow-up (ρ: [0.36, 0.50]). T1ρ PC2 and PC4 were significantly correlated with 30s chair test (ρ =−0.39 and ρ =0.24, respectively) and side plank (ρ =−0.32 and ρ =0.21). T1ρ and T2 PC2 were significantly correlated with 40m walk test (ρ =0.34 and ρ =0.31) and 30s chair rise test (ρ =−0.39 and ρ =−0.32).
Data Conclusion:
Men exhibited accelerated T1ρ increases across the femoral cartilage compared to women, suggesting sex should be considered when evaluating early hip OA. Participants with poorer HOOS and function exhibited greater T1ρ and T2 increases in superior and anterior femoral cartilage and greater T1ρ increases in the anterior femoral cartilage. These patterns of short-term relaxometry increases could indicate hip OA progression.
Keywords: hip osteoarthritis, voxel based T1ρ/T2 quantification, principal component analysis
INTRODUCTION
Osteoarthritis (OA) the most common cause of disability in the US, affects an estimated 52.5 million adults and costs upwards of $80 billion in estimated aggregate expenditures each year (1,2). At the hip alone, the prevalence of OA has been reported up to 27% for individuals over 45 years old (3). While radiographic findings are considered the reference standard for diagnosis, these semi-quantitative scores are not adequately sensitive to reliably assess early-stage OA, due to their inability to reflect critical soft tissue changes, reader reliability, and acquisition techniques (4). In addition to radiographic assessments, rates of hip OA progression have been evaluated according to patient-reported outcome measures, functional tests, and magnetic resonance (MR) morphological evaluations, as well as how these metrics were predictive of, or associated with, hip OA progression (5–13). However, these studies provide limited information regarding how cartilage structure or health vary and change over time, which is essential to understanding the pathomechanics of early hip OA.
In addition to morphological imaging, MR T1ρ and T2 relaxation times can provide quantitative measures of cartilage health and have been linked to early signs of cartilage degeneration (14). In cartilage, higher T1ρ relaxation times are indirect measures of decreased proteoglycan content, while higher T2 relaxation times are indicative of increased water content and disorganization of the collagen (15–18). Previous work found participants with hip OA or hip cartilage defects exhibited significantly higher hip cartilage T1ρ and T2 relaxation times in select sub-regions (19). However, T1ρ and T2 relaxation times were averaged across these sub-regions, which may have masked patterns unique to hip OA. Techniques that leverage voxel-wise comparisons of T1ρ and T2 relaxation times can prevent potential washout of significant areas due to the effects of averaging within cartilage sub-regions. In fact, a cross-sectional voxel-wise comparison of hip cartilage identified significant localized differences in T1ρ and T2 relaxation times between asymptomatic controls and those with OA, which were not detectable via a sub-regional analysis (20). Additional work employed principal component analysis (PCA) on cross-sectional T1ρ and T2 relaxometry maps to investigate global changes across the cartilage, and found OA participants had higher T1ρ and T2 values in isolated areas of the posterior femoral and acetabular cartilage and higher T1ρ values in the deep layers of the superior femoral and acetabular cartilage (21). Adaptation of these voxel-wise analysis techniques to longitudinal data can provide the sensitivity necessary to characterize the subtle nuances present in early progression of this disease. The aims of this study were to 1) characterize participant variability in longitudinal T1ρ and T2 changes across healthy and early-to-moderate hip OA participants; and 2) investigate associations between these patterns of change and common indicators of hip OA.
MATERIALS AND METHODS
Participants
This study was approved by the local Institutional Review Board (IRB). All participants signed written informed consent prior to data collection. Participants were recruited from the Orthopaedic clinic on campus and from the surrounding community through local advertisements. Prior to study inclusion, bilateral hip anterior-posterior screening radiographs were acquired of each participant and graded by a fellowship-trained musculoskeletal radiologist (TML) with 35 years of experience, according to Kellgren Lawrence (KL) scoring (22). This radiographic assessment was performed to characterize our participants, ensure recruitment of healthy and early-to-moderate hip OA, and exclude any participants with advanced stages of the disease. Inclusion in this study was contingent upon bilateral hip KL scores being <4. Participants were excluded from this study if under 18 years of age, previous history of hip surgery, presence of clinical knee OA and affirmative responses to all National Health and Nutrition Examination Survey questions, hip trauma in the past three months, an intra-articular injection in the past six months, inflammatory arthropathy, hematochromatosis, sickle cell disease, hemoglobinopathy, or contraindications to MRI.
Patient-reported Outcomes Measures and Physical Functional Assessment
Each participant was assessed for physical function and completed a self-administered Hip disability and Osteoarthritis Outcome Score (HOOS) questionnaire at baseline and two-year follow-up (23,24). Functional testing included: the 30 second Chair Rise Test: number of sit-to-stand repetitions in 30 seconds; the 40 meter Walk Test: time to walk 40 m; the Stair Climb Test: time to climb one standard flight of stairs; and a timed side plank on each side (right and left) (24–28). Answers to the HOOS questionnaire were used to calculate normalized scores (on a scale of 0-100, with 0 representing severe symptoms and 100 indicating no symptoms) for pain (HOOSpain), symptoms (HOOSsymptoms), activities of daily living (HOOSadl), function in sports and recreation (HOOSsport), and hip-related quality of life (HOOSqol).
MR Image Acquisition
Bilateral hip images were acquired serially for each side at baseline and two-year follow up on a 3T MR scanner (Discovery MR750, GE Healthcare, Waukesha, WI) using a 32-channel coil (Invivo Corp., Amsterdam, Netherlands). An anatomical neutral was created by securing the toes of each participant in place during the scan. A sagittally combined T1ρ/T2 Magnetization-Prepared Angle-Modulated Partitioned k-Space Spoiled Gradient Echo Snapshots (MAPSS) sequence (TSL = 0/15/30/45 ms; TE = 0, 10.4, 20.8, 41.6 ms; receiver bandwidth = 62.50 kHz; NEX = 1; FOV = 14 cm; views per segment = 64; TR = 1.2s; spin lock frequency = 300 Hz; matrix size = 256 x 128; slice thickness = 4.0mm) was acquired of each hip (29).
Image Processing
All analyses were performed in MatLab (MathWorks, Natick, MA) unless otherwise noted. The acetabular and femoral cartilage volumes were automatically segmented from the combined T1ρ/T2 MAPSS sequence using a previously validated in-house MatLab program, that leveraged a single atlas-based approach (20). Briefly, the participant images that minimized the average deformation of the overall dataset was chosen as the reference atlas (20). For each participant, the first spin lock time (TSL) = 0 ms T1ρ-weighted image was non-rigidly registered to the reference atlas, to quantify the registration transformation field. This transformation field was applied to the remaining TSLs to align the T1ρ-weighted images of each participant with the reference atlas (20). Each voxel of these registered images, acquired with different TSLs or echo times (TEs), was mono-exponentially fit with a Levenberg-Marquardt optimization algorithm to create T1ρ and T2 maps (29). As part of a previous study, acetabular and femoral cartilage masks were manually segmented on the reference atlas by a technician and reviewed by a musculoskeletal radiologist (TML). These cartilage masks were applied to the registered T1ρ and T2 maps to automatically isolate the four main 2D slices of the acetabular and femoral cartilage on each participant (20). Briefly, the four main slices were determined by using Hugh transform to detect the femoral head as a circle. The slice with the largest detected circle was used to identify the center of the femoral head. Along with this center slice, the slices with the next three largest circles were chosen as the four main slices of the hip cartilage (20). The automatic non-rigid registration to the reference atlas and cartilage segmentation were qualitatively evaluated (KER) by visualizing the reference cartilage masks on the transformed images of each hip, to ensure proper image registration and cartilage inclusion within the segmented volumes. A threshold of 100 ms for T1ρ and 80 ms for T2 was applied to the relaxometry maps to remove any values that may have been influenced by fluid (19).
A voxel-wise difference map was calculated for each participant by subtracting the baseline T1ρ and T2 maps from their respective two-year T1ρ and T2 maps. A subset of asymptomatic control participants, identified to represent typical short-term cartilage changes, were defined as those who exhibited no signs of radiographic hip OA (KL < 2) at baseline and no detectable progression in HOOS scores, defined as a score decrease over two years that exceeded the respective minimal detectable change (30). The mean and standard deviation of the asymptomatic controls that met these criteria were used to calculate Z-scores from the T1ρ and T2 difference maps of each participant, where T(x,y,z)i represents the T1ρ or T2 relaxometry value for participant i at point (x,y,z) and and represent the mean and standard deviation, respectively, of the asymptomatic controls at point (x,y,z):
Z-scores were saturated by setting all Z-scores > 4 or < −4 to 4 or −4, respectively.
Mean T1ρ and T2 difference maps were calculated for the asymptomatic controls and visualized as heat maps and binary maps of positive and negative mean T1ρ and T2 values. The percentage of voxels with positive, negative, and no value T1ρ and T2 changes over two years were calculated, along with the percentages of voxels with positive T1ρ and T2 Z-scores. Values were reported as mean ± standard deviation.
Principal component (PC) analysis was performed on the T1ρ and T2 Z-score difference maps from all participant hips (n = 84). Each PC mode of variation was descriptively characterized by comparing visualizations of the mean T1ρ or T2 Z-score difference maps to the mean Z-score difference maps ± 3 standard deviations of the variation for that mode and observing changes in the relaxometry patterns. To keep a balance between the statistical power of the dataset and interpretability of the PC modes, the first five PC modes were characterized and used for subsequent analyses.
Statistical Analysis
A Shapiro Wilkes test was used to evaluate normality of age, BMI, PC scores, and two-year HOOS and functional test outcomes. Correlations were evaluated between T1ρ and T2 PC scores to assess whether these measures were directly related. To assess correlations between T1ρ and T2 PC scores, Pearson and Spearman (ρ) correlation coefficients were used to evaluate normally and non-normally distributed PC scores, respectively, in R using the corrplot package (R Core Team, 2020, version 4.0.3).
To investigate the effects of sex on patterns of longitudinal changes, T1ρ and T2 PC modes were compared between men and women. For normally distributed data, sex comparisons were made with Student t tests, while Kruskal-Wallis tests were performed on data with non-normal distributions. If significant differences were found between groups, an ad hoc analysis of covariance (ANCOVA) was used to determine if the group difference was affected by the independent or combined addition of age or BMI. Mean Z-score difference maps and those of representative participants were visualized to aid interpretation of any PC modes that were significantly different between women and men.
To determine if patterns in T1ρ or T2 Z-score difference maps were associated with clinical indicators of hip OA, correlations were determined between PC scores and two-year HOOS and physical function metrics. Spearman correlation coefficients were used to evaluate non-normally distributed data (R Core Team, 2020, version 4.0.3). Significance was set at p < 0.05.
RESULTS
Participant Characteristics
Forty-two subjects (25 women, 17 men; age: 53.7 ± 14.6 years; BMI: 23.3 ± 3.0 kg/m2) were recruited for this study (Table 1). Eight participants (6 women, 2 men; age: 40 ± 9 yo, BMI: 24 ± 2 kg/m2, 4 KL0 and 4 KL1) met the criteria for asymptomatic controls and their data were used to calculate Z-scores for all participants.
Table 1:
Participant demographic, clinical, and functional information presented as mean ± standard deviation unless otherwise noted.
| Women (n = 50 hips) | Men (n = 34 hips) | |
|---|---|---|
| Age (years) | 51.9 ± 16.3 | 55.8 ± 14.9 |
| BMI (kg/m2) | 22.6 ± 2.0 | 24.4 ± 3.8 |
| KL 0* | 16 (19.1) | 5 (6.0) |
| KL 1* | 25 (29.8) | 12 (14.3) |
| KL 2* | 6 (7.1) | 10 (11.9) |
| KL 3* | 3 (3.6) | 7 (8.3) |
| HOOSpain | 94.8 ± 7.3 | 95.8 ± 11.7 |
| HOOSsymptoms | 91.8 ± 10.3 | 92.2 ± 12.7 |
| HOOSadl | 94.8 ± 7.3 | 95.8 ± 11.7 |
| HOOSsport | 90.8 ± 11.8 | 94.1 ± 13.0 |
| HOOSqol | 87.6 ± 18.8 | 89.5 ± 15.4 |
| 30s Chair Rise Test (repetitions) | 20.7 ± 7.1 | 22.1 ± 6.3 |
| 40m Walk Test (s) | 19.8 ± 2.9 | 18.9 ± 3.5 |
| Stair Climb Test (s) | 10.1 ± 2.7 | 10.1 ± 2.8 |
| Side Plank Test (s) | 73.4 ± 46.3 | 82.9 ± 49 |
Data expressed as hip count (percentage of total sample, %)
Description of Two-year T1ρ and T2 Difference Maps and Interpretation of Z-score Difference Maps
On average, most (56.33 ± 6.34%) cartilage voxels of the asymptomatic controls had increased T1ρ relaxation times over two years (Figure 1A/1B, left). For two-year T1ρ difference maps of the controls, 56.33 ± 6.34% of pixels were stable (i.e., no change over two years) or positive (i.e., increased over two years), 42.42 ± 6.62% were negative, and 1.24 ± 1.57% had no value. Across all participants, the mean absolute T1ρ two-year difference was 8.49 ± 12.02 ms. Across all participants, 48.91 ± 9.13% of cartilage voxels had T1ρ Z-scores greater than or equal to zero (Figure 1C, left), where positive Z-scores indicated greater increases in T1ρ values compared to controls.
Figure 1:
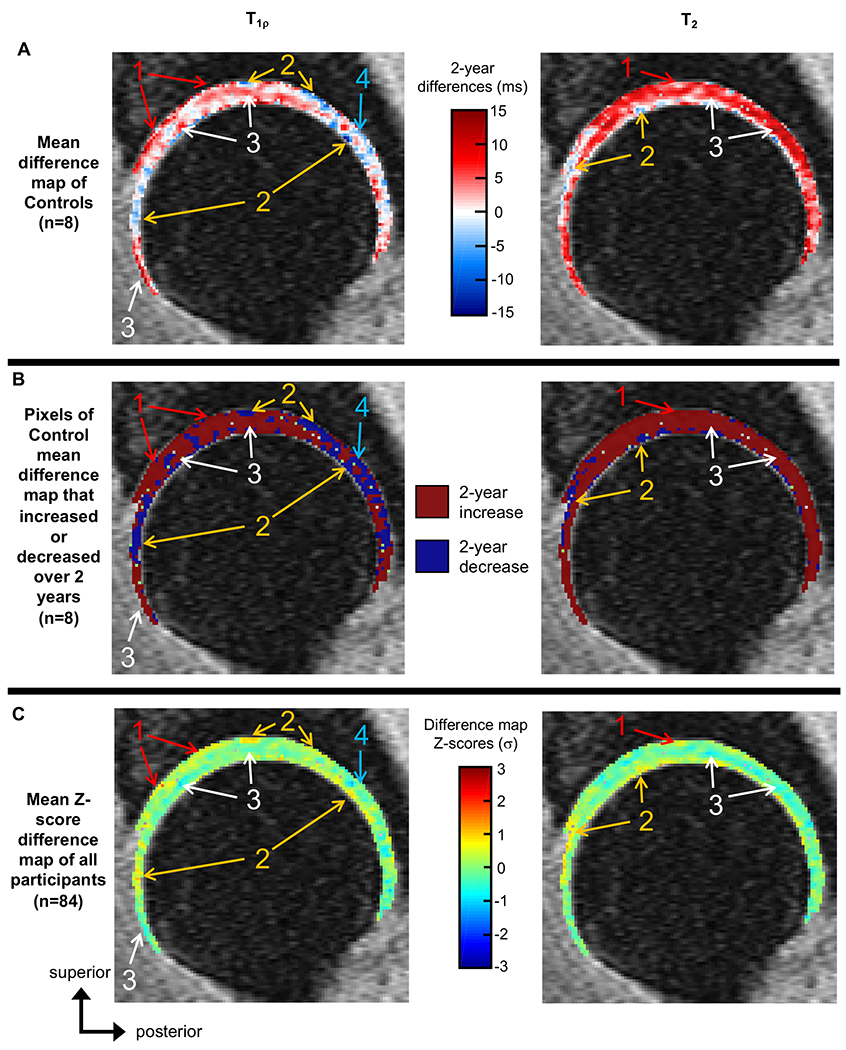
- Areas of the mean Z-score difference maps with positive Z-scores (C), where asymptomatic controls showed mean two-year increases (A and B), indicating that on average, participants had greater two-year T1ρ or T2 increases compared to controls.
- Areas of the mean Z-score difference maps with positive Z-scores (C), where asymptomatic controls showed mean two-year decreases (A and B), indicating that on average, participants had smaller two-year T1ρ or T2 decreases compared to controls and potentially saw T1ρ or T2 increases in these regions.
- Areas of the mean Z-score difference maps with negative Z-scores (C) where asymptomatic controls showed mean two-year increases (A and B), indicating that on average, participants had smaller T1ρ or T2 increases compared to controls and potentially saw T1ρ or T2 decreases in these regions.
- Areas of the mean Z score difference maps with negative Z-scores (C), where asymptomatic controls also showed two-year decreases (A and B), indicating that on average, participants had greater T1ρ or T2 decreases compared to controls.
On average, most (70.20 ± 6.78%) cartilage voxels of the controls had increased T2 relaxation times over two years (Figure 1A/1B, right). For the mean T2 two-year difference map of the controls, 70.20 ± 6.78% of pixels were stable or positive, 28.26 ± 8.02% of pixels were negative, and 1.54 ± 1.88% had no value. Across all participants, the mean absolute T2 two-year difference was 8.40 ± 10.76 ms. Across all participants, 43.81 ± 10.41% of cartilage voxels had T2 Z-scores greater than or equal to zero, (Figure 1C, right), where positive Z-scores indicated greater increases in T2 values compared to controls.
Principal Component Modes of Variation
For the T1ρ Z-score difference maps, the first five PC modes of variation accounted for 30.0% of the overall variation. PC1 accounted for 8.0% of variation and was primarily characterized by changes in the femoral cartilage, mainly the anterior and posterior regions (Figure 2). T1ρ PC2 accounted for 7.7% of variation and was primarily characterized by changes in the acetabular cartilage, mainly the superior-posterior regions, with smaller opposing changes in the superior femoral cartilage (Figure 2). T1ρ PC3 accounted for 6.5% of variation and was primarily characterized by changes in the anterior and the superficial layers of the anterior-superior acetabular cartilage regions, with opposing changes in the posterior acetabular cartilage and anterior-superior femoral cartilage (Figure 2). T1ρ PC4 accounted for 4.5% of variation and was primarily characterized by changes in the superficial cartilage layers (Figure 2). T1ρ PC5 accounted for 3.3% of variation and was primarily characterized by changes in the superficial layers of the posterior acetabular cartilage, with opposing changes in the deeper layers of acetabular cartilage.
Figure 2:

The T1ρ principal component (PC) modes of variation that were significantly associated with Hip disability and Osteoarthritis Outcome Scores or physical function metrics, visualized as the mean Z-score difference map across all participants (center) ±3 standard deviations (σ) of the PC mode. Red boxes denote higher or lower PC scores associated with poorer HOOS, while purple boxes denote higher or lower PC scores associated with poorer performance on functional tests. White arrows denote areas of notable two-year change that characterize the PC mode. PC1 was characterized by changes in the femoral cartilage, mainly the anterior and posterior regions. Participants with higher T1ρ PC1 scores exhibited greater T1ρ increases in the femoral cartilage. T1ρ PC2 was characterized by changes in the acetabular cartilage, mainly the superior-posterior regions, with smaller opposing changes in the superior femoral cartilage. Participants with higher T1ρ PC2 scores exhibited greater T1ρ increases in the superior femoral cartilage and smaller T1ρ increases in the superior-posterior acetabular cartilage. T1ρ PC3 was characterized by changes in the anterior and the superficial layers of the anterior-superior acetabular cartilage regions, with opposing changes in the posterior acetabular cartilage and anterior-superior femoral cartilage. Participants with higher T1ρ PC3 scores exhibited greater T1ρ increases in the posterior acetabular and anterior-superior femoral cartilage, with smaller T1ρ increases in the anterior and superficial layers of the anterior-superior acetabular cartilage. T1ρ PC4 was characterized by changes in the superficial cartilage layers. Participants with higher T1ρ PC4 scores exhibited greater T1ρ increases in the superficial cartilage layers. T1ρ PC5 was characterized by changes in the superficial layers of the posterior acetabular cartilage, with opposing changes in the deeper layers of acetabular cartilage. Participants with higher T1ρ PC5 scores exhibited greater T1ρ increases in superficial anterior and posterior acetabular cartilage with smaller T1ρ increases in deep superior acetabular cartilage.
The first five PC modes of the T2 Z-score difference maps accounted for 32.2% of the overall variation. T2 PC1 accounted for 12.1% of variation and was primarily characterized by widespread changes throughout the femoral cartilage (Figure 3). T2 PC2 accounted for 7.6% of variation and was primarily characterized by changes in the superior acetabular cartilage, with opposing changes in the superior femoral cartilage (Figure 3). T2 PC3 accounted for 4.6% of variation and was primarily characterized by changes in the anterior acetabular cartilage, with opposing changes in the corresponding femoral cartilage and posterior acetabular cartilage (Figure 3). T2 PC4 accounted for 4.3% of variation and was primarily characterized by changes in the superior-posterior superficial cartilage layers, with opposing changes in the anterior femoral cartilage. Participants with higher T2 PC4 scores exhibited greater T2 increases in superficial superior-posterior and smaller T2 increases in the anterior femoral cartilage. T2 PC5 accounted for 3.6% of variation and was primarily characterized by changes in the deep layers of the superior-anterior femoral and acetabular cartilage, with opposing changes in the superficial layers of the superior-posterior acetabular cartilage.
Figure 3:

The T2 principal component (PC) modes of variation that were significantly associated with Hip disability and Osteoarthritis Outcome Scores or physical function metrics, visualized as the mean Z-score difference map across all participants (center) ±3 standard deviations (σ) of the PC mode. Red boxes denote higher or lower PC scores associated with poorer HOOS, while purple boxes denote higher or lower PC scores associated with poorer performance on functional tests. White arrows denote areas of notable two-year change that characterize the PC mode. T2 PC1 was characterized by widespread changes throughout the femoral cartilage. Participants with higher T2 PC1 scores exhibited greater T2 increases in the femoral cartilage. T2 PC2 was characterized by changes in the superior acetabular cartilage, with opposing changes in the superior femoral cartilage. Participants with higher T2 PC2 scores exhibited greater T2 increases in the superior and primarily deep layers of femoral cartilage, with smaller T2 increases in the superior acetabular cartilage. T2 PC3 was characterized by changes in the anterior acetabular cartilage, with opposing changes in the corresponding femoral cartilage and posterior acetabular cartilage. Participants with higher T2 PC3 scores exhibited greater T2 increases in the anterior acetabular cartilage and smaller T2 increases in the adjacent femoral cartilage and posterior acetabular cartilage. T2 PC4 was primarily characterized by changes in the superior-posterior superficial cartilage layers, with opposing changes in the anterior femoral cartilage.
T1ρ PC scores were not directly correlated with T2 PC scores (Figure 4). T1ρ PC2 was significantly correlated with T2 PC1 (ρ = 0.67) and PC4 (ρ = −0.30). T1ρ PC3 was significantly correlated with T2 PC1 (ρ = 0.22), PC2 (ρ = −0.30), and PC3 (ρ = 0.23). T1ρ PC5 was significantly correlated with T2 PC3 (ρ = 0.30).
Figure 4:

Visualization of Spearman correlation (ρ) matrix for T1ρ and T2 PC scores. Correlation coefficients are denoted for each combination of PC scores. Significant correlations (p < 0.05) are designated by circles within the cells, with the size of the circle proportional to the strength of statistical significance (i.e., larger circles indicate smaller p values) and the color of the circle indicating the strength of the correlation corresponding to the color bar on the right.
Sex Group Comparison
The T1ρ PC1 (p > 0.073), PC2 (p > 0.507), and PC3 (p > 0.478) and T2 PC2 (p > 0.257) scores of women and men were normally distributed. The T1ρ PC4 and PC5 scores, the T2 PC1, PC3, PC4, and PC5 scores, age, and BMI of at least one group were not normally distributed. Women (−6.40 ± 14.48) had significantly lower T1ρ PC1 scores than men (10.05 ± 26.15). An ad hoc ANCOVA found this group difference was not affected by the independent or combined addition of age or BMI, which were non-significant co-variates (p = 0.372 and p = 0.528, respectively). Qualitative comparisons of mean and representative T1ρ Z-score difference maps from men and women illustrate areas of the femoral cartilage with subtle variations in Z-scores (Figure 5).
Figure 5:

Top: Mean T1ρ Z-score difference maps for women and men that visualize areas of different Z-scores between the sexes (white arrows). Bottom: T1ρ Z-score difference maps of representative participants that exemplify how patterns in two-year changes, specifically those attributed to T1ρ PC1, differ between women and men. Female participant P068 had a T1ρ PC1 score of −27.49 while male participant P014 had a T1ρ PC1 score of 62.03.
Women (−4.303 ± 17.212) had lower T2 PC1 scores than men (7.334 ± 31.818); however, this did not reach significance (p = 0.056, power = 0.53). There were no other significantly different PC scores between women and men (p > 0.059, power: [0.05, 0.47]).
Associations between PC Modes and Indicators of Hip OA
All HOOS and functional test metrics, except 30s Chair Rise test (p = 0.167), had non-normal distributions. T1ρ PC4 was significantly correlated with HOOSpain (ρ = 0.50), HOOSsymptoms (ρ = 0.37), HOOSadl (ρ = 0.40), HOOSsport (ρ = 0.36), and HOOSqol (ρ = 0.37) at two- year follow up (Figure 6). T1ρ PC3 was significantly correlated with HOOSpain (ρ = 0.18) and HOOSsymptoms (ρ = 0.32) at two-year follow-up. T2 PC3 was significantly correlated with HOOSsymptoms (ρ = −0.30) and HOOSqol (ρ = −0.25) at two-year follow-up.
Figure 6:

Spearman correlations (ρ) between principal component (PC) modes (rows) and Hip disability and Osteoarthritis Outcome Scores (HOOS) and functional indicators of hip OA (columns). PC modes include an arrow indicating whether higher (up arrow) or lower (down arrow) PC scores were related to poorer HOOS and/or functional tests and a visualization of the corresponding high or low PC score. The cells of the HOOS and functional metrics that were significantly associated with PC scores are bold, colored to indicate the strength of the correlation, and include an arrow indicating whether higher or lower HOOS or functional metrics represented poorer hip health. s = seconds, reps = repetitions, σ = standard deviation(s).
T1ρ (ρ = −0.39) and T2 (ρ = −0.32) PC2 and T1ρ PC4 (ρ = 0.24) were significantly associated with performance on the 30s Chair Rise test at two-year follow-up. T1ρ (ρ = 0.34) and T2 (ρ = 0.31) PC2 were significantly associated with performance on the 40m Walk test at two-year follow-up. T1ρ PC2 (ρ = −0.32) and PC4 (ρ = 0.21) were significantly associated with performance on the side plank test at two-year follow-up.
DISCUSSION
This study developed a process to characterize patterns in longitudinal relaxometry changes relative to a subset of asymptomatic controls. Certain patterns identified by PCA were significantly associated with HOOS metrics and measures of physical function, which have often been used to evaluate hip OA progression (5,7–13). Additionally, group differences between men and women provide insight regarding the effect of sex on longitudinal cartilage changes. This investigation of two-year relaxometry changes provides evidence that distinct patterns exist across the cartilage, which may be washed out by averaging T1ρ and T2 across numerous voxels.
Women and men exhibited significantly different voxel-based patterns of T1ρ changes over two years, which may provide insight regarding sex-specific cartilage changes across early stages of hip OA. Men may be more likely to exhibit two-year patterns of change that reflect greater, wide-spread T1ρ increases across the femoral cartilage and anterior regions of the acetabular cartilage. Although men also had higher T2 PC1 scores compared to women, this difference was shy of statistically significant. However, this analysis was under-powered and additional data may indicate that, like T1ρ PC1, men may be more prone to accelerated two-year T2 increases in the femoral cartilage. Previous work reported knee cartilage T1ρ increases with age, so over two years, T1ρ might be expected to increase, and when paired with results of the current study, may indicate that this trend is more pronounced in men. However, these prior studies averaged T1ρ across cartilage regions, so it is unclear whether there was a general increase in T1ρ or whether T1ρ increased in isolated pockets of the cartilage (31,32). In the current study, the addition of age and BMI covariates did not affect the relationship with T1ρ PC1, which suggests that short term T1ρ cartilage changes may be more dependent on sex than age and BMI. Numerous studies have reported mixed results regarding the effects of sex on hip OA risk or incidence, with fewer studies reporting on the link with hip OA progression (6,33,34). Of the latter, studies found that female sex was a predictive variable for hip OA progression and that structural hip OA progression was seen in a larger proportion of women than men (8,9). In contrast, when considering study quality and strength of results, a review article found inconclusive evidence that 1) female sex was related to hip OA progression, and 2) male sex was not associated with hip OA progression (35). However, previous work has focused on hip OA progression defined via joint space narrowing, radiographic assessment, and patient-reported outcomes of pain, function, or disability, which may not be directly comparable to longitudinal voxel-wise relaxometry differences between women and men.
Several patterns of T1ρ and T2 short-term longitudinal changes (i.e., PC modes) were significant predictors of HOOS at two-year follow-up. Generally, participants with greater T1ρ increases in the anterior acetabular and femoral cartilage, greater T2 increases in the anterior acetabular cartilage, smaller T1ρ and T2 increases in the posterior acetabular cartilage, and smaller T1ρ increases in the superficial cartilage layers had worse HOOS at two-year follow up. These results suggest that individuals with worse HOOS exhibited areas of smaller T1ρ or T2 increases over two years, which is counter intuitive. However, these results may instead indicate those cartilage areas that may be less important when detecting early signs of hip OA. Specifically, changes in T1ρ of the superficial cartilage layers or in T1ρ and T2 of the posterior acetabular cartilage should not be points of focus when detecting short term compositional changes in early-to-moderate hip OA. Alternatively, early hip OA may first be detected in the anterior femoral and acetabular cartilage, which exhibited greater T1ρ and T2 increases in participants that reported lower HOOS after two years. The unique analysis of the current study prevents direct comparisons with previous research; however, the current results support prior work which reported higher T1ρ and T2 values in the antersuperior acetabular cartilage associated with greater pain and worse symptoms, quality of life, and function during sports and activities of daily living (20).
Patterns of T1ρ and T2 longitudinal changes were also significant predictors of participant functional health at two-year follow-up. Generally, participants with greater T1ρ and T2 increases in superior femoral cartilage and smaller T1ρ and T2 increases in superior acetabular cartilage, completed fewer sit-to-stand repetitions in 30s and took longer to walk 40m at two-year follow up. Poorer performance on these tests could be indicators of hip OA progression, as previous studies reported end-stage hip OA patients had significantly poorer performance on sit-to-stand and walking tests compared to healthy controls (36). Participants that exhibited greater T1ρ increases in the anterior and superior femoral cartilage and smaller T1ρ increases in superficial cartilage layers and superior-posterior acetabular cartilage held a side plank for a shorter amount of time at two-year follow up. Previous work reported side plank activities associated with gluteus maximus and medius muscle activation and both muscles, along with the gluteus minimus, exhibited significant atrophy and decreased muscle volume when affected by OA (26,37). Furthermore, the gluteus medius and minimus muscles exhibited significant associations with T1ρ and T2 relaxation times in the hip cartilage and significantly higher levels of fatty infiltration in OA-affected limbs compared to controls (37,38). Taken together, poorer side plank performance could be indicative of weakening hip and core stabilizer muscles in conjunction with hip OA progression. The associations between PC modes and functional tests suggest that greater increases in T1ρ and T2 values in the superior femoral cartilage may be predictors of functional decline. Alternatively, a combination of regional changes, such as a ratio of increased superior femoral cartilage relaxation times to smaller increases in superior acetabular cartilage relaxation times could be indicators of hip OA progression and an area of focus in future studies.
Some T1ρ PC scores were significantly correlated with one or more of the T2 PC scores. However, these were not direct correlations (e.g., T1ρ PC1 correlated with T2 PC1), as demonstrated in cross-sectional PCA of knee T1ρ and T2 relaxometry maps (39). This may indicate that T1ρ and T2 relaxation times over two years progress at different paces or in different patterns within hip cartilage.
Limitations
Images were acquired on a single scanner, at a single center, on a relatively small cohort, over a two-year period, which should be taken into consideration when interpreting the results of the present study. However, these results demonstrate the feasibility and usefulness of voxel-based relaxation time mapping and PCA, as this analysis technique prevented important differences in healthy and early-to-moderate hip OA participants from being overlooked. Additionally, this voxel-wise analysis technique promotes examination of anatomical heterogeneity and patterns that would normally be washed out if only calculating mean T1ρ and T2 across the cartilage volume. This study featured a two-year follow-up, which, with traditional whole-cartilage or sub-regional analyses, may be too short to detect T1ρ and T2 changes in early-to-moderate hip OA participants. The significant associations between these patterns of cartilage change and HOOS and functional tests provide evidence that short- and longer-term cartilage changes could be effectively evaluated with the proposed technique. Changes in participant T1ρ and T2 values over two years can reflect factors other than hip cartilage degradation, such as physical activity and loading directly prior to MR acquisition. To minimize the effects of exercise and joint loads on the participant difference maps, participants were asked to refrain from exercise before, and were instructed to sit directly prior to, their MR scan. Furthermore, previous work found T1ρ and T2 measurements highly reproducible between scans (40). Although validated, the atlas-based registration only segmented four slices of the acetabular and femoral cartilage, which may limit in-plane resolution for thin cartilage of the hip. Additionally, these analyses may be subject to partial volume effects due to the 4 mm slice thickness. However, these segmentations encompass the four middle sagittal slices of the hip joint and account for most of the quantifiable cartilage volume. Finally, the first five PC modes only described 30% of variation across participants. Although additional PC modes could have been included in this analysis to increase this variation, higher PC modes become harder to interpret, resulting in a compromise between the number of PC modes, number of comparisons, and interpretability.
Conclusion
Short-term longitudinal cartilage changes were tied to sex, HOOS, and physical function in healthy participants and those with early-to-moderate hip OA. Over two-years, men exhibited accelerated T1ρ increases in the femoral cartilage compared to women, which suggests sex should be considered when evaluating early stages of this disease. Potential indicators of hip OA progression were identified as patterns demonstrating increased T1ρ and T2 relaxation times in the superior femoral and anterior acetabular cartilage, as well as increased T1ρ in the anterior femoral cartilage. These findings provide target areas for early diagnosis and future development of hip OA imaging biomarkers.
Acknowledgements:
The authors gratefully acknowledge the assistance of Dr. Thomas M. Link (TML) for the Kellgren-Lawrence scoring of our participants. This work was supported by a grant from Stryker administered by the Orthopaedic Research Society (ORS) and the National Institutes of Health: K24 AR072133, R01 AR069006, R00 AR070902.
REFERENCES
- 1.Yelin E, Murphy L, Cisternas MG, Foreman AJ, Pasta DJ, Helmick CG. Medical care expenditures and earnings losses among persons with arthritis and other rheumatic conditions in 2003, and comparisons with 1997. Arthritis Rheum 2007;56:1397–1407. [DOI] [PMC free article] [PubMed] [Google Scholar]
- 2.Hootman JM, Helmick CG, Barbour KE, Theis KA, Boring MA. Updated Projected Prevalence of Self-Reported Doctor-Diagnosed Arthritis and Arthritis-Attributable Activity Limitation Among US Adults, 2015-2040. Arthritis Rheum 2016;68:1582–1587. [DOI] [PMC free article] [PubMed] [Google Scholar]
- 3.Lawrence RC, Felson DT, Helmick CG, et al. Estimates of the prevalence of arthritis and other rheumatic conditions in the United States. Part II. Arthritis Rheum 2008;58:26–35. [DOI] [PMC free article] [PubMed] [Google Scholar]
- 4.Guermazi A, Roemer FW, Burstein D, Hayashi D. Why radiography should no longer be considered a surrogate outcome measure for longitudinal assessment of cartilage in knee osteoarthritis. Arthritis Res Ther 2011;13:247. [DOI] [PMC free article] [PubMed] [Google Scholar]
- 5.Ledingham J, Dawson S, Preston B, Milligan G, Doherty M. Radiographic progression of hospital referred osteoarthritis of the hip. Ann Rheum Dis 1993;52:263–267. [DOI] [PMC free article] [PubMed] [Google Scholar]
- 6.Dieppe P, Cushnaghan J, Tucker M, Browning S, Shepstone L. The Bristol ‘OA500 study’: progression and impact of the disease after 8 years. Osteoarthritis Cartilage 2000;8:63–68. [DOI] [PubMed] [Google Scholar]
- 7.Lane NE, Nevitt MC, Hochberg MC, Hung YY, Palermo L. Progression of radiographic hip osteoarthritis over eight years in a community sample of elderly white women. Arthritis Rheum 2004;50:1477–1486. [DOI] [PubMed] [Google Scholar]
- 8.Dougados M, Gueguen A, Nguyen M, et al. Radiological progression of hip osteoarthritis: definition, risk factors and correlations with clinical status. Ann Rheum Dis 1996;55:356–362. [DOI] [PMC free article] [PubMed] [Google Scholar]
- 9.Maillefert JF, Gueguen A, Monreal M, et al. Sex differences in hip osteoarthritis: results of a longitudinal study in 508 patients. Ann Rheum Dis 2003;62:931–934. [DOI] [PMC free article] [PubMed] [Google Scholar]
- 10.Ahedi H, Aitken D, Blizzard L, Cicuttini F, Jones G. Quantification of hip effusion-synovitis and its cross-sectional and longitudinal associations with hip pain, MRI findings and early radiographic hip OA. BMC Musculoskelet Disord 2020;21:533. [DOI] [PMC free article] [PubMed] [Google Scholar]
- 11.Thomas GE, Palmer AJ, Batra RN, et al. Subclinical deformities of the hip are significant predictors of radiographic osteoarthritis and joint replacement in women. A 20 year longitudinal cohort study. Osteoarthritis Cartilage 2014;22:1504–1510. [DOI] [PubMed] [Google Scholar]
- 12.Conrozier T, Jousseaume CA, Mathieu P, et al. Quantitative measurement of joint space narrowing progression in hip osteoarthritis: a longitudinal retrospective study of patients treated by total hip arthroplasty. Br J Rheumatol 1998;37:961–968. [DOI] [PubMed] [Google Scholar]
- 13.Schwaiger BJ, Gersing AS, Lee S, et al. Longitudinal assessment of MRI in hip osteoarthritis using SHOMRI and correlation with clinical progression. Semin Arthritis Rheum 2016;45:648–655. [DOI] [PMC free article] [PubMed] [Google Scholar]
- 14.Souza RB, Stehling C, Wyman BT, et al. The effects of acute loading on T1rho and T2 relaxation times of tibiofemoral articular cartilage. Osteoarthritis Cartilage 2010;18:1557–1563. [DOI] [PubMed] [Google Scholar]
- 15.Collins AT, Hatcher CC, Kim SY, et al. Selective Enzymatic Digestion of Proteoglycans and Collagens Alters Cartilage T1rho and T2 Relaxation Times. Ann Biomed Eng 2019;47:190–201. [DOI] [PMC free article] [PubMed] [Google Scholar]
- 16.Duvvuri U, Reddy R, Patel SD, Kaufman JH, Kneeland JB, Leigh JS. T1rho-relaxation in articular cartilage: effects of enzymatic degradation. Magn Reson Med 1997;38:863–867. [DOI] [PubMed] [Google Scholar]
- 17.Lusse S, Claassen H, Gehrke T, et al. Evaluation of water content by spatially resolved transverse relaxation times of human articular cartilage. Magn Reson Imaging 2000;18:423–430. [DOI] [PubMed] [Google Scholar]
- 18.Lusse S, Knauss R, Werner A, Grunder W, Arnold K. Action of compression and cations on the proton and deuterium relaxation in cartilage. Magn Reson Med 1995;33:483–489. [DOI] [PubMed] [Google Scholar]
- 19.Wyatt C, Kumar D, Subburaj K, et al. Cartilage T1rho and T2 Relaxation Times in Patients With Mild-to-Moderate Radiographic Hip Osteoarthritis. Arthritis Rheumatol 2015;67:1548–1556. [DOI] [PMC free article] [PubMed] [Google Scholar]
- 20.Pedoia V, Gallo MC, Souza RB, Majumdar S. Longitudinal study using voxel-based relaxometry: Association between cartilage T1rho and T2 and patient reported outcome changes in hip osteoarthritis. J Magn Reson Imaging 2017;45:1523–1533. [DOI] [PMC free article] [PubMed] [Google Scholar]
- 21.Liao TC, Pedoia V, Neumann J, Link TM, Souza RB, Majumdar S. Extracting Voxel-Based Cartilage Relaxometry Features in Hip Osteoarthritis Subjects Using Principal Component Analysis. J Magn Reson Imaging 2020;51:1708–1719. [DOI] [PMC free article] [PubMed] [Google Scholar]
- 22.Kellgren JH, Lawrence JS. Radiological assessment of osteo-arthrosis. Ann Rheum Dis 1957;16:494–502. [DOI] [PMC free article] [PubMed] [Google Scholar]
- 23.Nilsdotter AK, Lohmander LS, Klassbo M, Roos EM. Hip disability and osteoarthritis outcome score (HOOS)--validity and responsiveness in total hip replacement. BMC Musculoskelet Disord 2003;4:10. [DOI] [PMC free article] [PubMed] [Google Scholar]
- 24.Dobson F, Hinman RS, Hall M, Terwee CB, Roos EM, Bennell KL. Measurement properties of performance-based measures to assess physical function in hip and knee osteoarthritis: a systematic review. Osteoarthritis Cartilage 2012;20:1548–1562. [DOI] [PubMed] [Google Scholar]
- 25.Schmitz A, Russo K, Edwards L, Noehren B. Do novice runners have weak hips and bad running form? Gait Posture 2014;40:82–86. [DOI] [PMC free article] [PubMed] [Google Scholar]
- 26.Boren K, Conrey C, Le Coguic J, Paprocki L, Voight M, Robinson TK. Electromyographic analysis of gluteus medius and gluteus maximus during rehabilitation exercises. Int J Sports Phys Ther 2011;6:206–223. [PMC free article] [PubMed] [Google Scholar]
- 27.Bennell K, Dobson F, Hinman R. Measures of physical performance assessments: Self-Paced Walk Test (SPWT), Stair Climb Test (SCT), Six-Minute Walk Test (6MWT), Chair Stand Test (CST), Timed Up & Go (TUG), Sock Test, Lift and Carry Test (LCT), and Car Task. Arthritis Care Res (Hoboken) 2011;63 Suppl 11:S350–370. [DOI] [PubMed] [Google Scholar]
- 28.Wright AA, Cook CE, Baxter GD, Dockerty JD, Abbott JH. A comparison of 3 methodological approaches to defining major clinically important improvement of 4 performance measures in patients with hip osteoarthritis. J Orthop Sports Phys Ther 2011;41:319–327. [DOI] [PubMed] [Google Scholar]
- 29.Li X, Wyatt C, Rivoire J, et al. Simultaneous acquisition of T1rho and T2 quantification in knee cartilage: repeatability and diurnal variation. J Magn Reson Imaging 2014;39:1287–1293. [DOI] [PMC free article] [PubMed] [Google Scholar]
- 30.Arbab D, van Ochten JHM, Schnurr C, Bouillon B, Konig D. Assessment of reliability, validity, responsiveness and minimally important change of the German Hip dysfunction and osteoarthritis outcome score (HOOS) in patients with osteoarthritis of the hip. Rheumatol Int 2017;37:2005–2011. [DOI] [PubMed] [Google Scholar]
- 31.Stahl R, Luke A, Li X, et al. T1rho, T2 and focal knee cartilage abnormalities in physically active and sedentary healthy subjects versus early OA patients--a 3.0-Tesla MRI study. Eur Radiol 2009;19:132–143. [DOI] [PubMed] [Google Scholar]
- 32.Goto H, Iwama Y, Fujii M, et al. A preliminary study of the T1rho values of normal knee cartilage using 3T-MRI. Eur J Radiol 2012;81:e796–803. [DOI] [PubMed] [Google Scholar]
- 33.Jiang L, Rong J, Wang Y, et al. The relationship between body mass index and hip osteoarthritis: a systematic review and meta-analysis. Joint Bone Spine 2011;78:150–155. [DOI] [PubMed] [Google Scholar]
- 34.Prieto-Alhambra D, Judge A, Javaid MK, Cooper C, Diez-Perez A, Arden NK. Incidence and risk factors for clinically diagnosed knee, hip and hand osteoarthritis: influences of age, gender and osteoarthritis affecting other joints. Ann Rheum Dis 2014;73:1659–1664. [DOI] [PMC free article] [PubMed] [Google Scholar]
- 35.Wright AA, Cook C, Abbott JH. Variables associated with the progression of hip osteoarthritis: a systematic review. Arthritis Rheum 2009;61:925–936. [DOI] [PubMed] [Google Scholar]
- 36.Judd DL, Thomas AC, Dayton MR, Stevens-Lapsley JE. Strength and functional deficits in individuals with hip osteoarthritis compared to healthy, older adults. Disabil Rehabil 2014;36:307–312. [DOI] [PMC free article] [PubMed] [Google Scholar]
- 37.Zacharias A, Pizzari T, English DJ, Kapakoulakis T, Green RA. Hip abductor muscle volume in hip osteoarthritis and matched controls. Osteoarthritis Cartilage 2016;24:1727–1735. [DOI] [PubMed] [Google Scholar]
- 38.Tibrewala R, Pedoia V, Lee J, et al. Automatic hip abductor muscle fat fraction estimation and association with early OA cartilage degeneration biomarkers. J Orthop Res 2020. [DOI] [PubMed] [Google Scholar]
- 39.Tibrewala R, Pedoia V, Bucknor M, Majumdar S. Principal Component Analysis of Simultaneous PET-MRI Reveals Patterns of Bone-Cartilage Interactions in Osteoarthritis. J Magn Reson Imaging 2020;52:1462–1474. [DOI] [PMC free article] [PubMed] [Google Scholar]
- 40.Carballido-Gamio J, Link TM, Li X, et al. Feasibility and reproducibility of relaxometry, morphometric, and geometrical measurements of the hip joint with magnetic resonance imaging at 3T. J Magn Reson Imaging 2008;28:227–235. [DOI] [PubMed] [Google Scholar]