

Abstract

Biodegradable poly(3-hydroxybutyrate-co-3-hydroxyvalerate) (PHBV)/poly(butylene adipate-co-terephthalate) (PBAT) blends hold great potential for use in sustainable packaging applications for their advanced performance. Understanding the structure–property relationship in the blends at various proportions is significantly important for their future application, which is addressed in this work. The study found that the inherent brittleness of PHBV can only be modified with the addition of 50 wt % PBAT, where co-continuous structures formed in the blend as revealed by scanning electron microscopy (SEM) analysis. The elongation at break (%) of the blends increased from 3.81 (30% PBAT) to 138.5% (50% PBAT) and 345.3% (70 wt % PBAT), respectively. The fibrous structures of the PBAT formed during breaking are beneficial for energy dissipation, which greatly increased the toughness of the blends. Both the SEM observation and glass-transition temperature study by dynamic mechanical analysis indicated that the PHBV and PBAT are naturally immiscible. However, by simply mixing the two polymers with different composition ratios, the properties including melt flow index, heat deflection temperature, and mechanical properties can be tailored for different processing methods and applications. Our research work herein illustrates the fundamental structure–property relationship in this popular blend of PHBV/PBAT, aiming to guide the future modification direction in improving their properties and realizing their commercial applications in different scenarios.
1. Introduction
The growing impact of plastic pollution is becoming more apparent with each passing year. Increased awareness about global environmental issues due to the accumulation of plastic waste is driving academics and industries to find alternatives to nonbiodegradable products. These plastics cannot safely decompose and, therefore, significantly contribute to landfills and environmental pollution.1 Among them, only a minimal quantity of recyclable plastics is successfully converted into a new product. It is estimated that as little as 14% of plastic produced around the globe is effectively recovered annually.2 This results from the fact that recycling currently suffers from some limitations such as worsened quality (mechanical recycling) and significant investment into the process (chemical recycling).3 A shift toward biobased and renewable plastics, which can be a drop-in replacement for these other materials, is being encouraged in addition to improved end-of-life strategies.4 With potentially similar properties to conventional plastics with biodegradability, these polymers can relieve the current strain being placed on landfills while still maintaining the useful properties of petroleum-based plastics.
Polyhydroxyalkanoates (PHAs) are a family of bacterial polyesters which are synthesized within the cytoplasm of microbes under growth-limiting conditions.5,6 Initially formed by the bacteria as energy storage molecules, they are aliphatic polyesters that have drawn significant attention from the academic community over the past several decades. PHAs are considered universally biodegradable, meaning they can safely biodegrade in any environment, whether in a landfill, compost, soil, the ocean, or freshwater.7 As an aliphatic polyester, the high concentration of ester bonds within the polymer chain creates many sites for enzymatic attack and, subsequently, rapid hydrolysis of the polymer chains.8,9 Poly(hydroxybutyrate-co-3-hydroxyvalerate) (PHBV) is the most popular polymer in the PHA family. The properties of PHBV are highly dependent on the hydroxyvalerate (HV) content. Higher HV contents normally lead to improved elongation/flexibility of the polymer by decreasing the overall crystallinity, subsequently increasing its toughness.10 Several studies have been conducted to show how the HV content of PHBV governs the polymer behavior.11−13 The key benefit of PHBV is its excellent oxygen and water vapor barrier properties, which is a crucial consideration for food packaging. Minimizing the transmission of gasses and water vapors through packaging is one of the best ways to maintain the quality and shelf life of the goods inside.14,15
Despite these significant advantages, they do not come without drawbacks which have prevented the widespread adoption of biopolymers, specifically PHBV, throughout various industries. Some intrinsic weaknesses of PHBV are its extremely high brittleness, thermal instability, narrow processing window, and high production cost.16,17 The poor mechanical properties are linked to its high degree of crystallinity (70–85%) and slow rate of crystallization.18 To overcome this and conserve the most significant appeal of PHBV, its biodegradability, PHBV is often blended with other biodegradable or compostable polymers. Such polymers include poly(lactic acid) (PLA), poly(butylene succinate-co-butylene adipate) (PBSA), poly(caprolactone) (PCL), poly(butylene adipate-co-terephthalate) (PBAT), or natural rubbers.19−24 The main issue faced in those blends is the inadequate compatibility between the two polymers, leading to distinct phase-separated morphologies and poor interfacial adhesion.25 This heterogeneous structure results in lower-than-expected mechanical performance. Therefore, the full benefit of polymer blending cannot be realized.
Among them, PHBV/PBAT blends hold great potential for commercial applications for their balanced properties such as stiffness-toughness balance. Using a commercially available PHBV/PBAT blend (6010P) as the matrix, Javadi et al. prepared biodegradable composites with recycled wood fibers and nanoclay using various processing methods.26 It was found that while various processing strategies and fillers can be used to improve the mechanical and thermal performance of the PHBV/PBAT blends, the miscibility of the polymers was not improved. In a similar study, Pal et al. used a PHBV/PBAT (40/60) blend in conjunction with nanoclay to develop flexible packaging films using cast film extrusion and compared their properties with compression molded counterparts.21 The addition of a nanoclay filler was able to dramatically reduce the oxygen permeability of the blend, lending credibility to the possibility of using PHBV/PBAT/filler blends in packaging applications. Bittman et al. used a variety of PHBV/PBAT blends in conjunction with nanoclay to investigate the role of nanoclay in the morphology of the fabricated composite.27 Similar to Pal et al., the addition of the nanoclay was able to improve the performance of the blend for packaging applications. These studies provide an excellent look into the role that fillers can play in improving biodegradable polyester blends, though none focus directly on the interaction between PHBV and PBAT themselves.
Structure–property relationship studies are always the core of polymer research. To promote the application of PHBV/PBAT in different fields, understanding the dependence of macro-performance including thermal-mechanical properties, rheological behavior, etc., on the blending ratio is significant. Therefore, an in-depth analysis of the effect of blending PHBV and PBAT at various weight percentages on the morphological, rheological, mechanical, and thermal properties is conducted in this work, aiming to understand the miscibility and phase adhesion behavior of PHBV/PBAT. It is done to improve the understanding of how the blending of two immiscible polymers in different weight ratios impacts the properties of the final composition and identify whether any trends emerge.
As mentioned previously, the universal biodegradability of PHBV is well documented.7 For example, various studies have demonstrated this with up to 70% mass loss in soil, 95% mass loss in composting conditions, and 87% mass loss in a marine environment after 350, 45, and 160 days, respectively.28,29 PBAT is known to readily degrade in industrial composting conditions, with one study noting 100% degradation after 60 days.30 Soil degradation can yield slower results due to the aromatic chain present in the molecule; however, one study determined a 50% weight loss in 22 months and noted no signs of soil toxicity.31,32 While it is expected that the blends produced in this study will maintain the degradation behavior of the neat polymers consistent with their blending ratio, this cannot be known for certain without a specific study to confirm it.
2. Results
2.1. Crystallization Behavior of Blends
The second heating cycle of both the polymers and their prepared blends are shown in Figure 1. Table 1 was prepared based on the average of the second heating curve for two runs. The melting temperature of PHBV is relatively unchanged as the weight ratio of PBAT increases. Very subtle PBAT melting and crystallization peaks (Figure 1i,ii, respectively) can be seen in the 30/70 and 50/50 blends, while no peak was observed in the 70/30 blend, as the degree of crystallinity was too low to be measured. This behavior was also noted in low-PBAT-content blends in the work by Bittmann et al.27 and Javadi et al.33 The enthalpy of fusion for both polymers decreases as their respective weight fraction decreases. It occurs in a significant fashion for PHBV while being slightly less notable in the case of PBAT. The %crystallinity of PHBV decreases as the weight fraction of PBAT increases, due to an effect known as deactivation of heterogeneity.34 This is a phenomenon in which the melt of a noncrystallizing polymer blocks the growth of the crystalline polymer, in this case PHBV being blocked by PBAT melt. This is due to the difference in crystallization temperatures between the two polymers, as PHBV would be crystallizing while PBAT is still in a melted state. This has been observed in polypropylene (PP) and polyethylene (PE) blends, PHBV/PCL blends, and other PHBV/PBAT studies.19,33,35
Figure 1.
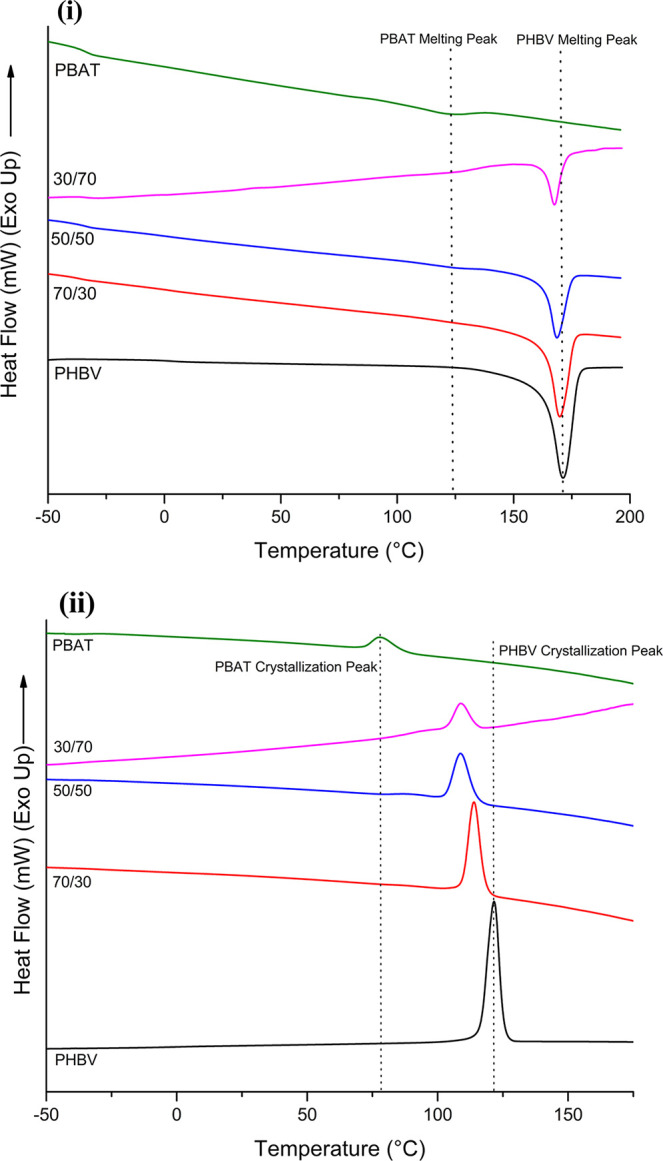
(i) Second heating cycle and (ii) first cooling cycle of PHBV, PBAT, and blends.
Table 1. Data Collected from DSC and DMA Analysesa.
|
Tg (°C) (DMA) |
Tm (°C) |
Hf(J/g) |
Xc (%) |
||||||
|---|---|---|---|---|---|---|---|---|---|
| Blend | PHBV | PBAT | Tc (°C) | PHBV | PBAT | PHBV | PBAT | PHBV | PBAT |
| PHBV | 26.67 | 123.87 | 172.07 | 89.53 | 82.14 | ||||
| 70/30 | 26.75 | –19.19 | 113.96 | 169.81 | 58.84 | 77.11 | |||
| 50/50 | 25.29 | –17.73 | 108.78 | 168.75 | 125.39 | 37.61 | 0.81 | 69.01 | 1.39 |
| 30/70 | 26.51 | –16.18 | 90.26 | 170.31 | 124.16 | 20.9 | 1.89 | 61.44 | 2.38 |
| PBAT | –16.02 | 78.18 | 122.36 | 4.51 | 3.96 | ||||
Blank cells indicate scenarios where the information was either not applicable or not detectable.
2.2. Phase Morphology Analysis
When a shear force is exerted on two molten polymers, one of two phenomena will generally occur: (i) the individual particles of each polymer will amalgamate into larger particles and separate from the other polymer, or (ii) they will separate into small particles and form droplets within a matrix of the other polymer. The resulting mechanical performance of the blend is highly dependent on which of these two phenomena occurs.
All samples were cryo-fractured using liquid nitrogen prior to analysis. SEM images of the fracture surface morphology of the investigated blends are provided in Figure 2i–vi. Each blend was viewed both with and without having undergone a solvent etching process so that the interaction between each phase can be more clearly examined. Beyond simply removing the chosen polymer for improved analysis, etching allows one to observe the samples at a depth beyond simply the fracture surface.36 A droplet-matrix morphology is seen in the 70/30 sample, with small PBAT droplets dispersed throughout a PHBV matrix. These droplets result in a slight improvement in impact strength by potentially absorbing minimal amounts of force, but major improvements are not possible due to the brittle nature of the PHBV matrix, which dominates the specimen. Once added in a higher weight percent, these small PBAT droplets can be observed to agglomerate into larger particles and adopt a co-continuous relationship with PHBV within the 50/50 blend. Here, a significant enhancement in mechanical properties is possible as the PBAT is more able to bear the load imposed during testing. The result is a significant jump in both elongation at break and impact strength compared to the 70/30 blend. The droplet-matrix morphology is again present in the 30/70 blend, except the major phase of the matrix is PBAT instead of PHBV. In this case, the droplets are much smaller in size, narrow in shape, and more finely dispersed than in the 70/30 sample. The etched sample in this blend reveals that the PBAT fraction forms a network throughout the PHBV in fine strands, compared to the separated globules formed in the 50/50 blend. This network allows force to be more easily distributed throughout the sample, subsequently improving properties such as elongation at break and tensile strength. PHBV droplets only provide reinforcement in aspects such as tensile modulus and general sample stiffness. Furthermore, previous studies have shown that narrow, elongated droplets have improved energy absorption compared to those that are spherical in nature, which is able to further improve the overall toughness of the blend compared to either 70/30 or 50/50 blends.37
Figure 2.

SEM images of fractured samples from impact test, captured at 12500x magnification: (i) PHBV70/PBAT30, (ii) PHBV50/PBAT50, (iii) PHBV30/PBAT70, (iv) solvent-etched PHBV70/PBAT30, (v) solvent-etched PHBV50/PBAT50, and (vi) solvent-etched PHBV30/PBAT70.
2.3. Mechanical Properties
The mechanical properties of the blends are presented in Table 2. The crystalline nature of PHBV results in it exhibiting high stiffness and tensile strength (modulus: 3.3 GPa and strength: 37 MPa, respectively). It showed poor %elongation and impact strength of 2.5% and 20 J/m, respectively. PBAT showed antagonistic properties to this, with a very low stiffness modulus of 0.067 GPa and tensile strength (25 MPa), yet high %elongation at break (406%) and not failing during notched Izod impact testing.
Table 2. Mechanical Properties of Tested Blends.
| Tensile |
Impact | Flexural |
||||
|---|---|---|---|---|---|---|
| Blend | Tensile Strength (MPa) | Young’s Modulus (MPa) | Elongation at Break (%) | Impact Strength (J/m) | Maximum Stress (MPa) | Flexural Modulus (MPa) |
| PHBV | 36.6 ± 0.99 | 3281.0 ± 168.27 | 2.5 ± 0.53 | 20.4 ± 0.75 | 64.1 ± 3.27 | 2870.0 ± 59.51 |
| 70/30 | 27.9 ± 0.81 | 2302.4 ± 135.72 | 3.8 ± 0.46 | 28.0 ± 2.64 | 51.0 ± 1.59 | 2179.8 ± 105.01 |
| 50/50 | 27.5 ± 1.89 | 1563.6 ± 174.70 | 138.6 ± 40.68 | 293.9 ± 61.07 | 30.6 ± 1.75 | 1384.0 ± 29.92 |
| 30/70 | 26.5 ± 3.46 | 609.0 ± 97.44 | 345.3 ± 38.09 | no break | 15.8 ± 1.11 | 593.8 ± 52.13 |
| PBAT | 25.1 ± 0.55 | 67.0 ± 1.22 | 406.8 ± 11.60 | no break | 4.0 ± 0.18 | 90.6 ± 3.65 |
Other studies utilizing low percentages of blending partners such as PLA, PCL, and PBAT had difficulty improving the toughness of PHBV without the use of additives, which showed the same results found in this study.19,22,38,39 While PBAT has been shown to be capable of acting as a toughening agent in previous studies to enhance the elongation of PHBV, PLA, and others, its addition in low weight percentages in this study showed minimal improvement.40,41 The PHBV/PBAT (70/30) blend exhibited an enhanced impact strength compared to neat PHBV by 37% but was only able to improve the %elongation at break by 50%. While seemingly a significant improvement, it corresponds to a %elongation of only 3.81%. It suggests insufficient interfacial adhesion among the PHBV and PBAT within the blend. As confirmed by SEM images, the PBAT is not adequately dispersed throughout the PHBV matrix to make a significant enough contribution to increasing the toughness. While the addition of compatibilizers would surely be able to improve this even further, this is beyond the scope of the current study.
The PHBV/PBAT (50/50) blend showed significant improvements in both impact strength and %elongation at break, increasing by a factor of 14 and 55, respectively. It can be attributed to the better dispersion of PBAT throughout the PHBV to sufficiently bear the load exerted on the sample during testing. However, there is still a clear distinction between the PBAT and PHBV phases, as they are immiscible and do not completely blend during the melt-compounding process.
The blend of PHBV/PBAT (30/70) exhibited properties very similar to neat PBAT, which did not break during impact testing and had a 17% decrease in %elongation from PBAT while having a nearly 10x greater tensile modulus and slightly higher tensile strength (5% improvement). The SEM images show that the PHBV portion of the blend is only present in a small, elongated droplet form rather than a significant contributor to the strength of the specimen. The dominance of the PBAT portion of the blend allows for a significant improvement in toughness while still maintaining some of the stiffness provided by PHBV.
An increase in PBAT has a corresponding reduction in sample stiffness. The tensile modulus can be found in both Table 2 and Figure 3. It has been well established that the %crystallinity and crystal morphology within crystalline or semicrystalline polymers has a significant impact on their mechanical properties.42,43 As determined by the differential scanning calorimetry (DSC) analysis, the crystallinity of the PHBV fraction of the blend significantly decreases as the PBAT content increases. Both the high-toughness PBAT and reduced crystallinity of the PHBV phase work in conjunction to improve the mechanical performance of the blends. However, this comes at the expense of other properties such as the maximum tensile strength and Young’s modulus, which decrease with the addition of PBAT. This exchange is expected and must be taken into consideration by scientists and engineers when designing new blends for specific applications such as packaging.
Figure 3.
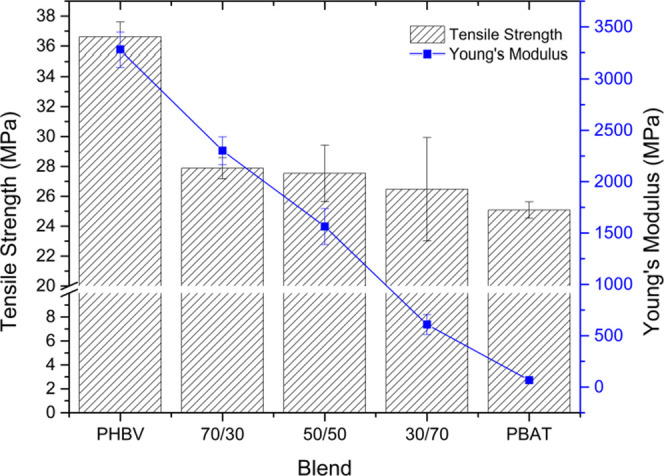
Tensile strength and modulus of tested samples.
2.4. Thermogravimetric Analysis (TGA)
The thermal stability of each blend is investigated via thermogravimetric analysis. Figure 4i contains the thermogravimetric analysis (TGA) curves of the tested blends. Neat PHBV begins to degrade around 273 °C, while the 70/30 and 50/50 blends begin around 280 °C. The 30/70 blend and neat PBAT start to degrade at 293 and 350 °C, respectively. The difference in thermal stability between the two polymers results in two distinct stages of degradation, the first being when PHBV degrades followed by the more stable PBAT component. The PHBV portion of all blends shows slightly improved thermal stability as a result of the PBAT blending, with an approximately 10 °C improvement in both the 70/30 and 50/50 blend, with a 20 °C improvement in the 30/70 sample. Similar behavior has been noted by Bittman et al.27 This is a result of a protective layer of char being formed by the PBAT which temporarily shields the PHBV from degradation as the TGA temperature increases.44 The influence of this char layer increases at higher weight percentages, which explains the delayed onset of degradation in more PBAT-dominant blends. This is further evidenced by the higher char content left by PBAT during TGA testing, as seen by the weight fraction remaining in Figure 4i.
Figure 4.

TGA of blends and neat polymers: (i) weight loss% as a function of temperature and (ii) first derivative of weight loss% with respect to temperature.
Figure 4ii contains the derivative of weight loss curves (DTGA), which represents the rate of change of degradation at each degree of temperature increase. While the onset of degradation for the PHBV fraction shifts slightly higher with increasing PBAT content, the peak degradation of the PHBV fraction slightly changes from 304 to 309.5 °C by changing the blend ratios. For the 50/50 blend, the maximum degradation temperature of PHBV was slightly reduced by ∼3 °C compared to pristine PHBV, which may be due to processing effects. Both the onset and peak degradation rates of PBAT do not seem to be related to the weight fraction in the blend. The difference in thermal stability between the two polymers is clear as the PHBV degrades much faster than PBAT, which is made clear by the different widths of their DTGA peaks. A wider peak suggests that the polymer degrades over a larger temperature range as opposed to very quickly within a small window.
2.5. Melt Flow Index (MFI)
One of the key properties of a polymer that determines how well it can be used in large-scale manufacturing processes is the melt flow index (MFI). The MFI of a polymer can be altered by several factors such as its thermal history or molecular weight. Table 3 contains the MFI of the blends tested in this study. No previously published work could be found to compare these results. The experiments conducted in this study show that the MFI of the blends is very close to the weighted average of their constituent polymers based on weight fraction. A consistent and predictable change in the MFI suggests that no new interactions are formed between either polymer throughout the melt extrusion and injection molding process, as it would be expected for the MFI to be lowered in the event of new interactions.45 Consistent performance of the MFI also suggests that no thermal degradation has occurred throughout the process as this would result in reduced molecular weight, shortened polymer chains, and ultimately a greater flowability resulting in a higher MFI. Polymers with a low MFI are used for film-blowing applications, whereas those with a high MFI are considered more ideal for injection molding applications due to their ability to easily flow inside a mold.46,47 These blends fit in a comfortable mid-range between low and high extremes, providing the interesting opportunity to customize specific blends such that they could be used for either application. The PHBV/PBAT (70/30) blend with an MFI of ∼16.6 g/10 min is ideally suited for injection molding, while PHBV/PBAT (30/70) having a lower MFI is better suited for film-blowing processes.
Table 3. MFI and HDT of Tested Blends.
| Sample | MFI (g/10 min) | HDT (°C) |
|---|---|---|
| PHBV | 19.1 ± 1.3 | 137.03 ± 0.70 |
| 70/30 | 16.6 ± 1.7 | 117.19 ± 2.36 |
| 50/50 | 12.8 ± 1.3 | 94.63 ± 0.61 |
| 30/70 | 9.9 ± 0.1 | 69.44 ± 0.97 |
| PBAT | 6.9 ± 0.2 | 44.52 ± 1.51 |
2.6. Heat Deflection Temperature (HDT)
The heat deflection temperature (HDT) is an important value to consider when determining the applications a polymer can be used in. It describes the maximum temperature that a sample can be exposed to without deflecting to a significant degree. The HDT of the neat polymers and blends examined within this study can be found in Table 3. PHBV and PBAT have extremely different HDT values, with values similar to those found in other published work.48−51 The HDT of the PHBV decreases approximately 25 °C with every 20 wt % increase in PBAT content due to the increment in the amorphous phase in PHBV/PBAT blends.
2.7. Dynamic Mechanical Analysis (DMA)
Dynamic mechanical analysis (DMA) was utilized to determine the viscoelastic properties of the blends. Figure 5i shows the storage modulus of the blends, which can help determine the glass-transition region of the materials. The storage modulus (E′) can help determine a given polymer’s glass-transition temperature window.
Figure 5.

Viscoelastic measurements of PHBV/PBAT blends: (i) storage modulus with respect to temperature and (ii) tan δ (loss factor) with respect to temperature.
In the case of PHBV, E′ begins to drop at an accelerated rate around 26 °C, while this change begins at approximately −20 °C in PBAT. The width of the transition window is significantly greater for PHBV than PBAT as the higher degree of crystallinity requires a higher input of energy to mobilize the polymer chains.52
DMA was used to evaluate the glass-transition behavior of the blends. The Tg of PHBV was found to remain fairly constant throughout the various blends. Such behavior was not observed in the case of PBAT, as the Tg slightly increased as the weight fraction became more significant. It can then be said that PHBV impeded the ability of the amorphous PBAT to form crystalline structures. This is also confirmed through DSC analysis, as the degree of crystallinity is lessened with reduced PBAT content.
Figure 5ii presents the tan δ of the blends. The peaks denote the glass-transition temperature of each polymer within the blend. In the case of the blends, there appear to be two distinct glass-transition regions, one for the PHBV fraction and another for the PBAT fraction with amplitudes relative to the weight fraction of each polymer. This again shows that the two blended polymers are immiscible as there is no observed shifting of glass-translation temperature.53 The tan δ (tan δ = E″/E′) is also referred to as the damping or loss factor of a material. The higher the damping factor, the greater the ability of the material to dissipate energy when subject to mechanical displacement. It is also a common way to better understand the stiffness of a blend, as a material with a high tan δ will generally have low stiffness. Based on the tan δ curves found in Figure 5ii, the stiffness of the blends decreases with increasing PBAT content. This is confirmed by the mechanical test results in Table 2, with the flexural modulus steadily decreasing throughout the blends.
2.8. Melt Rheology
Rheological analysis can be a valuable way to investigate the properties of a molten polymer when subjected to shear forces. The behavior of the blended polymers is highly dependent on their individual macromolecular structures. Figure 6i–iv shows the rheological properties of the studied blends. Previous works by Lajewski et al. and Szegda et al. have demonstrated the dependence of the rheological properties of PHBV on the measurement temperature.54,55 While these studies recommend testing the rheological properties of PHBV above 177 °C, all samples in this study were tested at 175 °C to simulate injection molding conditions.
Figure 6.

Rheological measurements of blends and their constituent polymers: (i) complex viscosity, (ii) storage and loss moduli, (iii) tan δ, (iv) modified linear Cole–Cole plot.
Figure 6i shows the complex viscosity of the tested blends. Both PHBV and PBAT exhibit slight shear-thinning throughout the frequency sweep, with PHBV being more pronounced. PHBV exhibits shear-thinning throughout the frequency sweep, with a gradual decrease in complex viscosity as frequency increases. This behavior indicates weak interactions within the polymer melt at this temperature, as not much force was required to overcome the intermolecular bonds between polymers even at low frequencies. The polymer exhibits more solidlike properties at low frequencies and transitions to a more liquid state as frequency increases. This is in contrast to PBAT, where it exhibits Newtonian behavior at low frequencies and then transitions to shear-thinning behavior at higher frequencies. In the blended samples, the 70/30 blend behaves as expected with a lower complex viscosity throughout the frequency sweep compared to neat PHBV while at lower frequencies, followed by closely matching the complex viscosity of PBAT at higher frequency values. However, both the 50/50 and 30/70 blends feature a lower complex viscosity than their neat polymers across the entire range of frequencies. This is potentially due to the immiscibility of the polymers and a complete lack of interactions between the two, as they are more likely to slide past each other in a molten state rather than interact in any capacity. For this reason, the 50/50 blend has the lowest viscosity, as there is the greatest volume of both polymers present to be able to slip past each other when a force is exerted upon them.56 This could also be attributed to the degradation and polymer chain scission of PHBV, with the higher mass fraction of PHBV in the 50/50 and 30/70 blends making this change significantly more notable.57 This degradation reduces the entanglement between polymer chains and as a result lowers the viscosity of the melt.58
The storage modulus of a polymer melt describes its ability to store energy under a shear load. This contrasts with the loss modulus, a measure of a polymer’s ability to dissipate energy. Figure 6ii compares the storage and loss moduli of the studied blends throughout a frequency sweep. PHBV has a notably higher storage modulus than PBAT, indicating the lower elasticity of the melt at the measured temperature. All of the tested blends have values that lie between the two neat polymers. The 50/50 blend’s storage modulus behaves independently of frequency at the bottom of the range, forming a plateau. This is commonly seen in immiscible polymer blends, which form co-continuous morphologies as the storage modulus is made up of two components, one from the polymers themselves and the other from the interfacial relaxation.59 The storage modulus acts independently of frequency as a result of interfacial relaxation absorbing energy prior to the force being exerted and stored within the polymer system as a whole.
The tan δ of the blends can be found in Figure 6iii. The tan δ is a ratio of the loss modulus to the storage modulus and serves to describe whether a blend has more viscoelastic or elastic behavior. If the value is greater than 1, the loss modulus is more dominant than the storage modulus and therefore the melt will have more viscoelastic properties. The neat polymers as well as all blends in this study have a value over 1. Therefore, the blends that melt within this study all tend to behave as a viscous fluid as opposed to exhibiting elastic properties.
Figure 6iv plots the loss modulus vs storage modulus in a modified linear Cole–Cole plot. In blends where the two component polymers are compatible with each other, these trend lines are expected to be linear.60,61 In the case of these blends, the lines deviate from each other at low shear rates, further showing that they are incompatible with each other. This is particularly apparent in the 50/50 blend, with a notable “hook” found at lower frequencies. At higher shear rates, it is possible that the PBAT droplets are able to sufficiently blend into the PHBV matrix and then dissociate upon reaching lower rates or coming to a stop. This matrix-droplet morphology is supported by the previously provided SEM images.
3. Conclusions
This study successfully blended two compostable polymers (PHBV and PBAT) at varying weight fractions in an in-depth analysis. The blending was able to dramatically toughen PHBV at a 50% loading of PBAT despite a lack of miscibility between the two polymers, as noted by SEM analysis. The jump between 30 and 50% PBAT loading yielded a significant difference in morphology and mechanical properties, suggesting that the morphological transition occurs at some point between these two values. DSC analysis revealed that with increasing PBAT content, the crystallinity of PHBV was found to decrease, showing that PBAT impedes the ability of PHBV to form crystals. This contributed to the toughening of the blends and change in stiffness as seen in mechanical and DMA testing. Rheological analysis suggested a lack of significant interaction between the two polymers, which was further confirmed by an investigation into the melt flow index. It is thought that although the use of additives in future studies will be able to further improve the properties of these blends, the current lack of additives gives rise to the thought that these blends will be just as biodegradable as their constituent polymers. The blends studied within this work will address the plastic waste crisis by providing alternatives to current petroleum-based products in varying applications such as in packaging. Future studies will be required to confirm the biodegradability of these blends, as well as to examine the ability of the blends to prevent oxygen and vapor transmission. These properties will be key for the success of these blends as biodegradable packaging options.
4. Materials and Experimental Procedures
4.1. Materials
PHBV-grade Y1000P (∼3% HV content, beige-colored pellets) was purchased from Ningbo TianAn Biologic Material Co. Ltd., China. The company-provided datasheet specifies a density of 1.25 g/cm3 and a melting point of 170–176 °C. PBAT, by the trade name of Ecoflex (F Blend C1200, white granules), was acquired from BASF, Canada. The company-provided datasheet specifies a density of 1.25–1.27 g/cm3 and a melting point of 110–120 °C. Both polymers were unaltered from their original form prior to processing.
4.2. Sample Preparation
The pellets were dried in an oven at 70°C for at least 12 h before processing. The moisture content was ensured to be <1% prior to processing. The polymers (PHBV and PBAT) were weighed in appropriate ratios (as mentioned in Table 4) and mixed mechanically in a zip-lock bag. The injection-molded specimens were prepared using a 15cc twin-screw micro-compounder with an attached injection molder (DSM, the Netherlands). The mixing was performed at 175 °C at 100 rpm for 2 min in a micro-compounder (screw L/D ratio: 18 and length: 150 mm) to ensure thorough blending of the polymers. The molten polymer blend was collected in a transfer device at the same temperature (175 °C). It was injected into the mold with an optimal injection pressure of 2.5 bar for 24 s using an injection molder, which resulted in the highest-quality specimens. Tensile, flexural, and impact specimens for all of the blends and controls (PHBV and PBAT) were prepared using same operating conditions.
Table 4. Nomenclature Used for Prepared Controls and Polymer Blends.
| Formulation | PHBV Content (wt %) | PBAT Content (wt %) | Data Label |
|---|---|---|---|
| PHBV | 100 | 0 | PHBV |
| PHBV70/PBAT30 | 70 | 30 | 70/30 |
| PHBV50/PBAT50 | 50 | 50 | 50/50 |
| PHBV30/PBAT70 | 30 | 70 | 30/70 |
| PBAT | 0 | 100 | PBAT |
5. Methods
5.1. Differential Scanning Calorimetry (DSC)
DSC analysis was done using a DSC Q200 (TA Instruments) machine with a heat–cool–heat cycle. Samples weighing approximately 12 mg were placed in aluminum pans for testing. The first heating cycle increased the temperature to 200 °C at a rate of 10 °C/min to remove the thermal history of the sample. The cooling cycle went down to −80 °C at a rate of 5 °C/min. The sample was then heated once more up to 200 °C at a rate of 10 °C/min during the second heating cycle. Nitrogen was set to flow at 50 mL/min to ensure the thermal stability of samples in testing. The %crystallinity (Xc) of the blends was determined via eq 1
| 1 |
where subscript X represents the polymer for which the %crystallinity is determined (PHBV or PBAT), ΔHf represents the heat of fusion as provided by the DSC curve, Wf,X is the weight fraction of PHBV or PBAT in the blend, and ΔHX° is the heat of fusion for a theoretically 100% crystalline polymer. For this purpose, 109 J/g for PHBV and 114 J/g for PBAT were used.19,27
5.2. Scanning Electron Microscopy (SEM)
Morphological analysis was done with a scanning electron microscope (Phenom ProX Desktop, Netherlands) using an accelerating voltage of 10 kV. Samples were cryo-fractured prior to analysis via submersion in liquid nitrogen. PHBV70/PBAT30 and PHBV50/PBAT50 blends were etched using tetrahydrofuran (THF) at room temperature to selectively dissolve the PBAT fraction. The PHBV30/PBAT70 blend was etched using formic acid at room temperature to dissolve the PHBV fraction. Etched samples were submerged in the solvent for 5 minutes. Samples were sputter-coated to prevent electrostatic charging of the samples.
5.3. Mechanical Properties
The tensile and flexural properties were measured using a universal testing machine (Instron, Massachusetts), equipped with a 5 kN load cell. Tensile samples (Type IV) were tested at 50 mm/min (except neat PHBV, which was tested at 5 mm/min) as prescribed by ASTM standard D682.62 Injection-molded flexural bars were submitted to a three-point bending test at a rate of 14 mm/min, according to ASTM standard D790.63 Impact testing was done by a Zwick/Roell HIT25P impact testing machine (Ulm, Germany). Notched Izod samples were struck by a 2.75 J capacity hammer according to ASTM standard D256.64 Five specimens of each formulation were used for tensile and flexural testing, while 10 samples were used for impact testing.
5.4. Thermogravimetric Analysis (TGA)
TGA was conducted using a TGA Q500 (TA Instruments) to determine the thermal stability of the control samples and blends. A heat ramp was used from 30 to 800 °C at 10 °C/min. An inert atmosphere was maintained by providing a flow of nitrogen gas at 60 mL/min. Weight loss and maximum degradation percentage were obtained by graphical means. The average of two runs was taken for analysis.
5.5. Melt Flow Index (MFI)
MFI of all of the samples was analyzed using a Qualitest melt flow indexer 2000A according to ASTM standard D1238.65 Samples to be used were collected while melt-compounding, with approximately 7 g of material used for each test. As there is no preexisting standard procedure for PHBV/PBAT composites, the method for LDPE was adopted, which sets the temperature to 190 °C and 2.16 kg of applied mass. Measurements were performed in triplicate.
5.6. Heat Deflection Temperature (HDT)
The HDT of the samples was determined using a DMA Q800 machine (TA Instruments) following ASTM D648.66 The sample was placed in a three-point bending clamp under a static force of 0.445 MPa. A temperature ramp of 2 °C/min from a starting point of 30 °C was used. The HDT value was measured at a deflection of 250 μm.
5.7. Dynamic Mechanical Analysis (DMA)
DMA was conducted using a DMA Q800 (TA Instruments). The sample was loaded into a dual cantilever in frequency sweep–strain mode with an amplitude of 20 μm at 1 Hz. The sample was initially cooled via liquid N2 down to −80 °C and heated to 100 °C at 3 °C/min. This data was primarily used to establish the storage modulus (E′) and glass-transition temperature (Tg) of the samples.
5.8. Melt Rheology
Rheological properties were tested in a strain-controlled rheometer (MCR-302, Anton Paar, Germany) at a temperature of 175 °C to match processing conditions. A parallel plate with a diameter of 25 mm and a fixed measurement gap of 1 mm in a nitrogen environment were used. The sample was allowed to melt entirely, and excess material was removed prior to testing, with no notable air gaps present throughout the sample. Storage and loss moduli along with complex viscosity were determined using a dynamic frequency sweep through 0.1–100 rad/s, at a strain of 1% within the linear viscoelastic (LVE) region of the materials.
Acknowledgments
The authors thank the following for their financial support to carry out this research: Ontario Ministry of Economic Development, Job Creation and Trade ORF-RE09–078 (Project Nos. 053970 and 054345); Agriculture and Agri-Food Canada (AAFC), Maple Leaf Food, Canada and Bank of Montreal (BMO), Canada through Bioindustrial Innovation Canada (BIC) Bioproducts AgSci Cluster Program (Project Nos. 054015, 054449, and 800148); Natural Sciences and Engineering Research Council (NSERC), Canada Discovery Grants (Project No. 401716); and the Ontario Ministry of Agriculture, Food and Rural Affairs (OMAFRA)—University of Guelph, the Bioeconomy Industrial Uses Research Program Theme (Project Nos. 030486 and 030578).
The authors declare no competing financial interest.
References
- Rabnawaz M.; Wyman I.; Auras R.; Cheng S. A Roadmap towards Green Packaging: The Current Status and Future Outlook for Polyesters in the Packaging Industry. Green Chem. 2017, 19, 4737–4753. 10.1039/c7gc02521a. [DOI] [Google Scholar]
- Garcia J. M.; Robertson M. L. The Future of Plastics Recycling. Science 2017, 358, 870–872. 10.1126/science.aaq0324. [DOI] [PubMed] [Google Scholar]
- Liu Y.; Zheng Z.; Zhao L.; Wang Z. Quality Assessment of Post-Consumer Plastic Bottles with Joint Entropy Method: A Case Study in Beijing, China. Resour., Conserv. Recycl. 2021, 175, 105839 10.1016/j.resconrec.2021.105839. [DOI] [Google Scholar]
- Mohanty A. K.; Wu F.; Mincheva R.; Hakkarainen M.; Raquez J. M.; Mielewski D. F.; Narayan R.; Netravali A. N.; Misra M. Sustainable Polymers. Nat. Rev. Methods Primers 2022, 2, 46 10.1038/s43586-022-00124-8. [DOI] [Google Scholar]
- Reddy C. S. K.; Ghai R.; Rashmi; Kalia V. C. Polyhydroxyalkanoates: An Overview. Bioresour. Technol. 2003, 87, 137–146. 10.1016/S0960-8524(02)00212-2. [DOI] [PubMed] [Google Scholar]
- Tebaldi M. L.; Maia A. L. C.; Poletto F.; de Andrade F. V.; Soares D. C. F. Poly(-3-Hydroxybutyrate-Co-3-Hydroxyvalerate) (PHBV): Current Advances in Synthesis Methodologies, Antitumor Applications and Biocompatibility. J. Drug Delivery Sci. Technol. 2019, 51, 115–126. 10.1016/j.jddst.2019.02.007. [DOI] [Google Scholar]
- Meereboer K. W.; Misra M.; Mohanty A. K. Review of Recent Advances in the Biodegradability of Polyhydroxyalkanoate (PHA) Bioplastics and Their Composites. Green Chem. 2020, 22, 5519–5558. 10.1039/d0gc01647k. [DOI] [Google Scholar]
- Bedade D. K.; Edson C. B.; Gross R. A. Emergent Approaches to Efficient and Sustainable Polyhydroxyalkanoate Production. Molecules 2021, 26, 3463 10.3390/Molecules26113463. [DOI] [PMC free article] [PubMed] [Google Scholar]
- Muthuraj R.; Misra M.; Mohanty A. K. Biodegradable Poly(Butylene Succinate) and Poly(Butylene Adipate-Co-Terephthalate) Blends: Reactive Extrusion and Performance Evaluation. J. Polym. Environ. 2014, 22, 336–349. 10.1007/s10924-013-0636-5. [DOI] [Google Scholar]
- Chodak I.Polyhydroxyalkanoates: Origin, Properties and Applications. In Monomers, Polymers and Composites from Renewable Resources; Belgacem M. N.; Gandini A., Eds.; Elsevier Science, 2008; pp 451–477. [Google Scholar]
- Thellen C.; Coyne M.; Froio D.; Auerbach M.; Wirsen C.; Ratto J. A. A Processing, Characterization and Marine Biodegradation Study of Melt-Extruded Polyhydroxyalkanoate (PHA) Films. J. Polym. Environ. 2008, 16, 1–11. 10.1007/s10924-008-0079-6. [DOI] [Google Scholar]
- Modi S.; Koelling K.; Vodovotz Y. Assessment of PHB with Varying Hydroxyvalerate Content for Potential Packaging Applications. Eur. Polym. J. 2011, 47, 179–186. 10.1016/j.eurpolymj.2010.11.010. [DOI] [Google Scholar]
- Gunaratne L. M. W. K.; Shanks R. A. Multiple Melting Behaviour of Poly(3-Hydroxybutyrate-Co-Hydroxyvalerate) Using Step-Scan DSC. Eur. Polym. J. 2005, 41, 2980–2988. 10.1016/j.eurpolymj.2005.06.015. [DOI] [Google Scholar]
- Lagarón J. M.; López-Rubio A.; Fabra M. J. Bio-Based Packaging. J. Appl. Polym. Sci. 2016, 133, 42971. 10.1002/app.42971. [DOI] [Google Scholar]
- Wu F.; Misra M.; Mohanty A. K. Challenges and New Opportunities on Barrier Performance of Biodegradable Polymers for Sustainable Packaging. Prog. Polym. Sci. 2021, 117, 101395 10.1016/j.progpolymsci.2021.101395. [DOI] [Google Scholar]
- Gerassimidou S.; Martin O. V.; Chapman S. P.; Hahladakis J. N.; Iacovidou E. Development of an Integrated Sustainability Matrix to Depict Challenges and Trade-Offs of Introducing Bio-Based Plastics in the Food Packaging Value Chain. J. Cleaner Prod. 2021, 286, 125378 10.1016/j.jclepro.2020.125378. [DOI] [Google Scholar]
- Shen M.; Song B.; Zeng G.; Zhang Y.; Huang W.; Wen X.; Tang W. Are Biodegradable Plastics a Promising Solution to Solve the Global Plastic Pollution?. Environ. Pollut. 2020, 263, 114469 10.1016/j.envpol.2020.114469. [DOI] [PubMed] [Google Scholar]
- Kunioka M.; Tamaki A.; Doi Y. Crystalline and Thermal Properties of Bacterial Copolyesters: Poly(3-Hydroxybutyrate-Co-3-Hydroxyvalerate) and Poly(3-Hydroxybutyrate-Co-4-Hydroxybutyrate). Macromolecules 1989, 22, 694–697. 10.1021/ma00192a031. [DOI] [Google Scholar]
- Zytner P.; Wu F.; Misra M.; Mohanty A. K. Toughening of Biodegradable Poly(3-Hydroxybutyrate-Co-3-Hydroxyvalerate)/Poly(ε-Caprolactone) Blends by In Situ Reactive Compatibilization. ACS Omega 2020, 5, 14900–14910. 10.1021/acsomega.9B04379. [DOI] [PMC free article] [PubMed] [Google Scholar]
- Le Delliou B.; Vitrac O.; Castro M.; Bruzaud S.; Domenek S. Characterization of a New Bio-Based and Biodegradable Blends of Poly(3-Hydroxybutyrate-Co-3-Hydroxyvalerate) and Poly(Butylene-Co-Succinate-Co-Adipate). J. Appl. Polym. Sci. 2022, 139, 52124 10.1002/app.52124. [DOI] [Google Scholar]
- Pal A. K.; Wu F.; Misra M.; Mohanty A. K. Reactive Extrusion of Sustainable PHBV/PBAT-Based Nanocomposite Films with Organically Modified Nanoclay for Packaging Applications: Compression Moulding vs. Cast Film Extrusion. Composites, Part B 2020, 198, 108141 10.1016/j.compositesb.2020.108141. [DOI] [Google Scholar]
- Modi S.; Koelling K.; Vodovotz Y. Assessing the Mechanical, Phase Inversion, and Rheological Properties of Poly-[(R)-3-Hydroxybutyrate-Co-(R)-3-Hydroxyvalerate] (PHBV) Blended with Poly-(l-Lactic Acid) (PLA). Eur. Polym. J. 2013, 49, 3681–3690. 10.1016/j.eurpolymj.2013.07.036. [DOI] [Google Scholar]
- Parulekar Y.; Mohanty A. K. Biodegradable Toughened Polymers from Renewable Resources: Blends of Polyhydroxybutyrate with Epoxidized Natural Rubber and Maleated Polybutadiene. Green Chem. 2006, 8, 206–213. 10.1039/b508213g. [DOI] [Google Scholar]
- Parulekar Y.; Mohanty A. K. Extruded Biodegradable Cast Films from Polyhydroxyalkanoate and Thermoplastic Starch Blends: Fabrication and Characterization. Macromol. Mater. Eng. 2007, 292, 1218–1228. 10.1002/mame.200700125. [DOI] [Google Scholar]
- Salehiyan R.; Ray S. S.; Stadler F. J.; Ojijo V. Rheology-Microstructure Relationships in Melt-Processed Polylactide/Poly(Vinylidene Fluoride) Blends. Materials 2018, 11, 2450 10.3390/ma11122450. [DOI] [PMC free article] [PubMed] [Google Scholar]
- Javadi A.; Srithep Y.; Lee J.; Pilla S.; Clemons C.; Gong S.; Turng L. S. Processing and Characterization of Solid and Microcellular PHBV/PBAT Blend and Its RWF/Nanoclay Composites. Composites, Part A 2010, 41, 982–990. 10.1016/j.compositesa.2010.04.002. [DOI] [Google Scholar]
- Bittmann B.; Bouza R.; Barral L.; Castro-Lopez M.; Dopico-Garcia S. Morphology and Thermal Behavior of Poly (3-Hydroxybutyrate-Co-3-Hydroxyvalerate)/Poly(Butylene Adipate-Co-Terephthalate)/Clay Nanocomposites. Polym. Compos. 2015, 36, 2051–2058. 10.1002/pc.23115. [DOI] [Google Scholar]
- Chen H.Assessment of Biodegradation in Different Environmental Compartments of Blends and Composites Based on Microbial Poly(Hydroxyalkanoate)s; University of Pisa, 2012. [Google Scholar]
- Volova T. G.; Boyandin A. N.; Vasil’ev A. D.; Karpov V. A.; Kozhevnikov I. V.; Prudnikova S. V.; Rudnev V. P.; Xuån B. B.; Dũng V. V.; Gitel’zon I. I. Biodegradation of Polyhydroxyalkanoates (PHAs) in the South China Sea and Identification of PHA-Degrading Bacteria. Microbiology 2011, 80, 252–260. 10.1134/S0026261711020184. [DOI] [PubMed] [Google Scholar]
- Ruggero F.; Belardi S.; Carretti E.; Lotti T.; Lubello C.; Gori R. Rigid and Film Bioplastics Degradation under Suboptimal Composting Conditions: A Kinetic Study. Waste Manage. Res. 2022, 40, 1311–1321. 10.1177/0734242X211063731. [DOI] [PubMed] [Google Scholar]
- Rychter P.; Kawalec M.; Sobota M.; Kurcok P.; Kowalczuk M. Study of Aliphatic-Aromatic Copolyester Degradation in Sandy Soil and Its Ecotoxicological Impact. Biomacromolecules 2010, 11, 839–847. 10.1021/bm901331t. [DOI] [PubMed] [Google Scholar]
- Ferreira F. V.; Cividanes L. S.; Gouveia R. F.; Lona L. M. F. An Overview on Properties and Applications of Poly(Butylene Adipate-Co-Terephthalate)–PBAT Based Composites. Polym. Eng. Sci. 2019, 59, E7–E15. 10.1002/pen.24770. [DOI] [Google Scholar]
- Javadi A.; Kramschuster A. J.; Pilla S.; Lee J.; Gong S.; Turng L. S. Processing and Characterization of Microcellular PHBV/PBAT Blends. Polym. Eng. Sci. 2010, 50, 1440–1448. 10.1002/pen.21661. [DOI] [Google Scholar]
- Martuscelli E. Influence of Composition, Crystallization Conditions and Melt Phase Structure on Solid Morphology, Kinetics of Crystallization and Thermal Behavior of Binary Polymer/Polymer Blends. Polym. Eng. Sci. 1984, 24, 563–586. 10.1002/pen.760240809. [DOI] [Google Scholar]
- Bartczak Z.; Galeski A.; Pracella M. Spherulite Nucleation in Blends of Isotactic Polypropylene with High-Density Polyethylene. Polymer 1986, 27, 537–543. 10.1016/0032-3861(86)90239-9. [DOI] [Google Scholar]
- Su C. C.; Woo E. M.; Hsieh Y. T. Perpendicularly Oriented Lamellae in Poly(3-Hydroxybutyric Acid-Co-3-Hydroxyvaleric Acid) Blended with an Amorphous Polymer: Ultra-Thin to Thick Films. Phys. Chem. Chem. Phys. 2013, 15, 2495–2506. 10.1039/c2cp43523c. [DOI] [PubMed] [Google Scholar]
- Odent J.; Leclère P.; Raquez J. M.; Dubois P. Toughening of Polylactide by Tailoring Phase-Morphology with P[CL-Co-LA] Random Copolyesters as Biodegradable Impact Modifiers. Eur. Polym. J. 2013, 49, 914–922. 10.1016/j.eurpolymj.2012.12.006. [DOI] [Google Scholar]
- Pawar S. P.; Misra A.; Bose S.; Chatterjee K.; Mittal V. Enzymatically Degradable and Flexible Bio-Nanocomposites Derived from PHBV and PBAT Blend: Assessing Thermal, Morphological, Mechanical, and Biodegradation Properties. Colloid Polym. Sci. 2015, 293, 2921–2930. 10.1007/s00396-015-3700-y. [DOI] [Google Scholar]
- Quiles-Carrillo L.; Montanes N.; Lagaron J. M.; Balart R.; Torres-Giner S. In Situ Compatibilization of Biopolymer Ternary Blends by Reactive Extrusion with Low-Functionality Epoxy-Based Styrene–Acrylic Oligomer. J. Polym. Environ. 2019, 27, 84–96. 10.1007/s10924-018-1324-2. [DOI] [Google Scholar]
- Gigante V.; Canesi I.; Cinelli P.; Coltelli M. B.; Lazzeri A. Rubber Toughening of Polylactic Acid (PLA) with Poly(Butylene Adipate-Co-Terephthalate) (PBAT): Mechanical Properties, Fracture Mechanics and Analysis of Ductile-to-Brittle Behavior While Varying Temperature and Test Speed. Eur. Polym. J. 2019, 115, 125–137. 10.1016/j.eurpolymj.2019.03.015. [DOI] [Google Scholar]
- Jin Y.; Wang E.; Weng Y.; Men S.; Dong Y.; Sima Y.; Huang Z. The Investigation of the Toughening Mechanism of PHBV/PBAT with a Novel Hyperbranched Ethylenediamine Triazine Polymer Based Modifier: The Formation of the Transition Layer and the Microcrosslinking Structure. J. Polym. Environ. 2018, 26, 4158–4167. 10.1007/s10924-018-1286-4. [DOI] [Google Scholar]
- De Rosa C.; Scoti M.; di Girolamo R.; de Ballesteros O. R.; Auriemma F.; Malafronte A. Polymorphism in Polymers: A Tool to Tailor Material’s Properties. Polym. Cryst. 2020, 3, 10101 10.1002/pcr2.10101. [DOI] [Google Scholar]
- Wang B. J.; Zhang Y. J.; Zhang J. Q.; Gou Q. T.; Wang Z. B.; Chen P.; Gu Q. Crystallization Behavior, Thermal and Mechanical Properties of PHBV/Graphene Nanosheet Composites. Chin. J. Polym. Sci. 2013, 31, 670–678. 10.1007/s10118-013-1248-1. [DOI] [Google Scholar]
- Li F.; Yu H. Y.; Li Y.; Abdalkarim S. Y. H.; Zhu J.; Zhou Y. Soft-Rigid Synergistic Reinforcement of PHBV Composites with Functionalized Cellulose Nanocrystals and Amorphous Recycled Polycarbonate. Composites, Part B 2021, 206, 108542 10.1016/j.compositesb.2020.108542. [DOI] [Google Scholar]
- Alidadi-Shamsabadi M.; Behzad T.; Bagheri R.; Nari-Nasrabadi B. Preparation and Characterization of Low-Density Polyethylene/Thermoplastic Starch Composites Reinforced by Cellulose Nanofibers. Polym. Compos. 2015, 36, 2309–2316. 10.1002/PC.23144. [DOI] [Google Scholar]
- Barletta M.; Puopolo M. Thermo-Mechanical Properties of Injection Molded Components Manufactured by Engineered Biodegradable Blends. J. Polym. Environ. 2019, 27, 2105–2118. 10.1007/s10924-019-01500-4. [DOI] [Google Scholar]
- Chikhalikar K.; Banik S.; Azad L. B.; Jadhav K.; Mahajan S.; Ahmad Z.; Kulkarni S.; Gupta S.; Doshi P.; Pol H.; Lele A. Extrusion Film Casting of Long Chain Branched Polypropylene. Polym. Eng. Sci. 2015, 55, 1977–1987. 10.1002/pen.24039. [DOI] [Google Scholar]
- Muthuraj R.; Misra M.; Mohanty A. K. Biodegradable Biocomposites from Poly(Butylene Adipate-Co-Terephthalate) and Miscanthus: Preparation, Compatibilization, and Performance Evaluation. J. Appl. Polym. Sci. 2017, 134, 45448 10.1002/app.45448. [DOI] [Google Scholar]
- Li Z.; Reimer C.; Wang T.; Mohanty A. K.; Misra M. Thermal and Mechanical Properties of the Biocomposites of Miscanthus Biocarbon and Poly(3-Hydroxybutyrate-Co-3-Hydroxyvalerate) (PHBV). Polymers 2020, 12, 1300 10.3390/polym12061300. [DOI] [PMC free article] [PubMed] [Google Scholar]
- Mazur K.; Kuciel S. Mechanical and Hydrothermal Aging Behaviour of Polyhydroxybutyrate-Co-Valerate (PHBV) Composites Reinforced by Natural Fibres. Molecules 2019, 24, 3538 10.3390/molecules24193538. [DOI] [PMC free article] [PubMed] [Google Scholar]
- Chiu H. T.; Huang S. Y.; Chen Y. F.; Kuo M. T.; Chiang T. Y.; Chang C. Y.; Wang Y. H. Heat Treatment Effects on the Mechanical Properties and Morphologies of Poly (Lactic Acid)/Poly (Butylene Adipate-Co-Terephthalate) Blends. Int. J. Polym. Sci. 2013, 2013, 1–11. 10.1155/2013/951696. [DOI] [Google Scholar]
- Ojijo V.; Ray S. S.; Sadiku R. Role of Specific Interfacial Area in Controlling Properties of Immiscible Blends of Biodegradable Polylactide and Poly[(Butylene Succinate)-Co-Adipate]. ACS Appl. Mater. Interfaces 2012, 4, 6690–6701. 10.1021/am301842e. [DOI] [PubMed] [Google Scholar]
- Brostow W.; Chiu R.; Kalogeras I. M.; Vassilikou-Dova A. Prediction of Glass Transition Temperatures: Binary Blends and Copolymers. Mater. Lett. 2008, 62, 3152–3155. 10.1016/j.matlet.2008.02.008. [DOI] [Google Scholar]
- Lajewski S.; Mauch A.; Geiger K.; Bonten C. Rheological Characterization and Modeling of Thermally Unstable Poly(3-Hydroxybutyrate-Co-3-Hydroxyvalerate) (Phbv). Polymers 2021, 13, 2294 10.3390/polym13142294. [DOI] [PMC free article] [PubMed] [Google Scholar]
- Szegda D.; Duangphet S.; Song J.; Tarverdi K. Extrusion Foaming of PHBV. J. Cell. Plast. 2014, 50, 145–162. 10.1177/0021955X13505249. [DOI] [Google Scholar]
- Lv Y.; Huang Y.; Kong M.; Zhu H.; Yang Q.; Li G. Stress Relaxation Behavior of Co-Continuous PS/PMMA Blends after Step Shear Strain. Rheol. Acta 2013, 52, 355–367. 10.1007/s00397-013-0696-4. [DOI] [Google Scholar]
- Gerard T.; Budtova T. Morphology and Molten-State Rheology of Polylactide and Polyhydroxyalkanoate Blends. Eur. Polym. J. 2012, 48, 1110–1117. 10.1016/j.eurpolymj.2012.03.015. [DOI] [Google Scholar]
- Modi S. J.; Cornish K.; Koelling K.; Vodovotz Y. Fabrication and Improved Performance of Poly(3-Hydroxybutyrate-Co-3-Hydroxyvalerate) for Packaging by Addition of High Molecular Weight Natural Rubber. J. Appl. Polym. Sci. 2016, 133, 43937 10.1002/app.43937. [DOI] [Google Scholar]
- Lee H. M.; Park O. O. Rheology and Dynamics of Immiscible Polymer Blends. J. Rheol. 1994, 38, 1405–1425. 10.1122/1.550551. [DOI] [Google Scholar]
- Chuang H.-K.; Han C. D. Rheological Behavior of Polymer Blends. J. Appl. Polym. Sci. 1984, 29, 2205–2229. 10.1002/app.1984.070290625. [DOI] [Google Scholar]
- Harrell E. R.; Nakajima N. Modified Cole–Cole Plot Based on Viscoelastic Properties for Characterizing Molecular Architecture of Elastomers. J. Appl. Polym. Sci. 1984, 29, 995–1010. 10.1002/app.1984.070290327. [DOI] [Google Scholar]
- ASTM International Standard Test Method for Tensile Properties of Plastics; ASTM D638-14, 2014.
- ASTM International Standard Test Methods for Flexural Properties of Unreinforced and Reinforced Plastics and Electrical Insulating Materials; ASTM D790-15, 2015.
- ASTM International Standard Test Methods for Determining the Izod Pendulum Impact Resistance of Plastics; ASTM D256-10, 2010.
- ASTM International Standard Test Method for Melt Flow Rates of Thermoplastics by Extrusion Plastometer; ASTM D1238-13, 2013.
- ASTM International Standard Test Method for Deflection Temperature of Plastics Under Flexural Load in the Edgewise Position; ASTM D648-18, 2016.