

Abstract
We present results of an experiment designed to reveal the “face effect” on pricing behavior in a supply chain game. In particular, we study the variation in wholesale prices driven by subjective judgments of three facial traits—attractiveness, trustworthiness, and dominance—of a retailer’s face and own appearance. Our experimental data suggest that the distributions of decisions in settings whether individuals see, or not see, retailers’ faces are not equivalent. Furthermore, we find the complex dependencies between decision behaviors and facial traits. Subjective evaluations of facial traits, both self-reported and others, have a significant effect on the selected decisions.
Keywords: Newsvendor, Face effect, Behavioral operations, Human judgment and decision-making, Experimental study
Introduction
In a survey conducted by Forbes Insight (2009), 84% of 760 business executives prefer face-to-face meetings to technology-enabled, remote ones. They believe that face-to-face interactions help build stronger business relationships (85%), better social interactions (75%), and gives the ability to “read” another person (77%). Many other studies report the same. Wakefield Research's Fourth Annual Business Travel Survey (2012) reports that 96% of business travelers value face-to-face meetings as the fundamentals for long-lasting business relationships. A Berger (2016) conducted by the Meetings Mean Business coalition and the Association of Public-Safety Communications Officials (APCO) finds that “96% of small business owners say in-person meetings yield a return on investments” (Berger 2016). Requests made face-to-face are 34 times more effective than those made “blind” (Roghanizad and Bohns 2017). However, in 2019–2021 the coronavirus disease (COVID-19) pandemic made in-person meetings impossible and accelerated a shift to online communication. Video-conferencing (via Zoom, MS Teams, Skype, etc.) and app-based messaging (WhatsApp, WeChat, LinkedIn InMail, etc.) became the sustainable alternatives to face-to-face interactions. According to Priori Data, global downloads of video-conferencing applications have increased dramatically since the pandemic began. For instance, Zoom was downloaded nearly 27 million times in March 2020, while in January 2020, it was just 2.1 million times (Richter 2020).
Ahearne et al. (2022) claim that “face-to-face communication is no longer the main format of buyer–seller interactions.” While business practitioners were forced to rapidly adopt the online format for meetings due to the imposed restrictions, they continued using video calls even after the restrictions were lifted. Video-conferencing and app-based messaging have gained popularity over other technology-enabled communication modes (phone calls, emails, etc.) because they offer attributes which are important for building trustful relationships. In particular, virtual calls make it possible to see the partner’s face during a conversation. Also, users may add their profile photograph to display on the app. However, frequently participants choose not to turn the web camera on, and only their profile pictures are available to observe. Zoom User Survey reports that only 63% of Zoom users prefer taking calls with their video cameras on (Zoom 2021). Furthermore, the choice of a profile picture may affect the individual’s perception and subsequent business relationships (Xu 2014). Thus, the question of how the face observed during virtual communication affects cooperation of business partners becomes an important topic for business practitioners and should be considered in scientific research.
Behavioral economics literature, indeed, finds that seeing a face improves trust and cooperation (Lewis 2004; Eckel and Petrie 2011). In the Eckel and Petrie (2011) study, responders, in a trust game, were more trustworthy if they saw a photo of the sender. In addition, they were willing to pay to see the photo, as well as to show their own photos to their counterparts (Heyes and List 2016). These results establish, in general, that just the availability of images of faces, even without any verbal or social interactions, can change economic decisions. Surprisingly, there is little research of this issue in operations management contexts, given the importance of contexts in business decision-making (Kremer et al. 2010). The scarcity of knowledge about how to interact effectively using new technologies leaves business practitioners in a black box (Yadav and Pavlou 2014; Khan and Ebner 2019). In particular, intuitively, one would expect this issue may be especially important to supply chain contracting. Improving supply chain communication is a vital step in information sharing between managers of buying and supplying firms. Information is crucial to supply chain performance because it provides the foundation for managerial decisions. Information sharing within the supply chain has numerous positive effects, including inventory reduction and efficient inventory management, cost reduction, optimized capacity utilization, significant reduction of bullwhip effect, and others (Lotfi et al. 2013; Inderfurth et al. 2013). The COVID-19 pandemic caused a significant disruption to the supply chains across the globe (Alicke et al. 2021). To sustain their operations, proactive companies have realized that they need to have greater visibility, transparency, and information sharing (Sajjad 2021). Collaboration and enhanced communication are important strategies to effectively respond to disruption risks and improve supply chain operations. Scientific research on available instruments to strengthen the buyer–supplier relationship is essential to support business practices.
In this study, by the use of laboratory experiments, we explore the “face effect” in a supply chain contracting scenario. The core idea is that individuals form judgments about behavioral traits of others when they see their faces, and these judgments change their decision-making behavior. Our goal is to determine how such judgments can nudge decisions. Note that it is out of the scope of this research of whether faces actually reflect behavioral traits, and whether these judgements are accurate. As we focus on the judgments of faces, we intentionally choose the simplest supply chain contracting scenario where a supplier sets a simple linear wholesale price for a newsvendor retailer. In this scenario, both a supplier and a retailer can react to the judgments of faces. We focus on the supplier’s wholesale price decision as to help isolate the impact of face judgements. The retailer’s order decision can be affected by both face judgments, if available, and also the wholesale price and the resulting social preference (e.g., fairness). Hence, we believe that focusing on the supplier’s wholesale price decision behavior will be most appropriate for this research. As such, we conducted experiments where human subjects played the role of the supplier, and the retailers were controlled by software. Using “robot” players is not uncommon in the behavioral operations management literature (e.g., Kalkanci et al. 2011, 2014).
If retailers are robots, whose face are we going to show the suppliers? We choose to use original computer-generated images of faces, with an algorithm developed in the Social Perception Lab of Princeton University (Oosterhof and Todorov 2008; Todorov and Oosterhof 2011; Todorov et al. 2011). Obviously, the subjects would know that these were not the real faces of their supply chain partners; in fact, in the instructions, we include the statement “Imagine that the person on the picture is your buyer” as to employ no deception in the experiment. Literature has shown that individuals do react to robot players with social preferences, albeit more weakly than when facing real humans (Kalkancı et al. 2014). We believe the same principle allows here. This research strategy provides two significant advantages. First, the computer algorithm we employed allows us to manipulate several facial traits, discussed below, independently. Second, we can exact control for emotional neutrality, age, and race.
Wilson and Eckel (2006) show that individuals can judge the level of trust by looking at a face appearance. Attractive trustees are perceived as more trustworthy and, consequently, are trusted more. Hence, behavioral traits may be reflected in the face image of a person. To facilitate exposition, we refer to such a trait (e.g., trustworthiness) as a “facial trait”, interpreted as a behavioral trait that can be informed by the image of a face. In this study, we focus on three facial traits, chosen for their importance to operations management decision-making, and the fact that the algorithm used to generate faces, discussed above, allows for the manipulation of these traits in the images that it creates. We pick the faces varying on dimensions of attractiveness, trustworthiness and dominance. Existing literature suggests these three traits may have impacts on how people are treated under business settings (Krumhuber et al. 2007; Fruhen et al. 2015; Linke et al. 2016; Todorov et al. 2015).
Evolutionary, humans are attentive to physical attractiveness (Thornhill and Gangestad 1999; Rhodes 2006; Little et al. 2011). Attractive people are seen as more intelligent, competent, and trustworthy (Zebrowitz et al. 2002; Todorov et al. 2005; Wilson and Eckel 2006). These stereotypes influence people’s judgments and expectations. Thus, political scientists note candidate attractiveness can drive election results (Laustsen 2014; Berggren et al. 2010; Hart et al. 2011; King and Leigh 2009; Rosar et al. 2008). Economists, too, find that attractive borrowers and trustees are judged to have a better attitude (Jin et al. 2017) and earn more (Wilson and Eckel 2006). Trustworthy-looking individuals are benefited with higher chances to obtain loans (Duarte et al. 2012) and earn more (Tingley 2014; Wu et al. 2018). Dominance, on the other hand, evokes negative judgments as being associated with the individual’s power and aggressiveness (Oosterhof and Todorov 2008; Dietl et al. 2018). However, the context may change the effect: contrary to non-profit organizations, for-profit firms achieve a greater financial success when lead by the dominant-looking CEOs (Re and Rule 2016).
Our experimental design employs a within-subject design with a “blind” treatment where no face image is shown to the supplier, and a “face” treatment where a face image is shown. In the “face” treatment, we use 54 images which span three facial traits. First, we observe a significant treatment effect; the distributions of wholesale prices offered in “blind” and “face” settings are not equivalent. Second, we find that subjective evaluations of facial traits, both self-reported and others, have a significant effect on the selected decisions. For example, a supplier chooses to offer a higher average wholesale price to a more attractive retailer (i.e., a “beauty penalty” effect). A supplier who evaluates self-attractiveness low is likely to offer wholesale prices in a different range compared to offers made by a supplier who is confident in own attractiveness.
This paper makes two contributions. As far as we know, we are the first to, experimentally, study the impact of facial information (i.e., a face image) in supply chain contracting. Second, we capture the responses to different facial traits and elaborate insights that may help facilitate supply chain contracting.
The reminder of this study is organized as follows. In Sect. 2, we summarize the theoretical guidance of behavioral operations management literature and relevant behavioral economics studies. Section 3 describes the supply chain contracting environment we use to operationalize the faces and facial traits in our experiment. The experimental procedure is explained in Sect. 4. We present experimental results in Sect. 5 and offer concluding remarks in Sect. 6.
Theoretical guidance (literature review)
A growing literature on behavioral operations management explains a choice deviation from its optimum by bounded rationality of a decision-maker. The stream of studies has demonstrated various behavioral patterns in contracting referring to fairness (Haitao Cui et al. 2007; Ho et al. 2014; Kalkancı et al. 2014; Wu and Niederhoff 2014; Katok et al. 2014), loss-aversion (Zhang et al. 2016), friendly or long-run relationships (Loch and Wu 2008; Davis and Leider 2018), trust, and trustworthiness (Ozer et al. 2011, 2014; Beer et al. 2017). Despite the striking uniformity in pull-to-center and adaptive learning effects, the behavioral tendencies vary at the individual level. Both suppliers and retailers are highly heterogeneous as tp what impacts the significance and the strength of decision biases (Becker-Peth et al. 2013; Bolton and Katok 2008; Wu and Chen 2014; Katok et al. 2014; Moritz et al. 2013).
Coordinating supply chain contracts, designed to align economic incentives of two parts (Cachon 2003; Cachon and Lariviere 2005), have been rigorously studied in behavioral experiments (e.g., Katok and Wu 2009; Becker-Peth et al. 2013; Wu and Chen 2014; Zhang et al. 2016; Davis 2015). Theoretically, the contract should be optimally designed by rational authors; in practice, it often deviates from the optimum. One of the factors impacting the decision strategy is the context-sensitivity in supply chain contracting (Kremer et al. 2010); the context implies broad circumstances under which the contract is created, including social considerations (Loch and Wu 2008). The social context refers to physical and social settings of human interactions, and it influences human decision-makers and is impossible to avoid. However, the intervention of behavioral patterns (e.g., fairness and trust) can be either restricted or magnified by the contracting settings. Kalkancı et al. (2014) have identified evidence of human interaction effects on the bounds of rationality of a decision-maker. Researchers find that suppliers act less rationally in a human-to-human game than in a human-to-computer one, and are likely to provide better contracts with more favorable discount terms when interacting with humans. The idea of a change in behaviors in different settings triggered our interest to continue the research of the social context in supply chain contracting scenarios. We set two opposite settings: the first setup is the standard newsvendor problem with no revealed private information, which is widely used in the literature, and the second setting is the experiment which offers human features to the contracting content. Human features could be delivered via various venues including text, sound, photo, and video. In this study, we are interested in the effect of faces.
Because the social context in contracting has received relatively little attention among experimental studies in operations management, we search for theoretical support from other research fields. We find more evidence of human-to-human interactions effects in the behavioral economics literature. Various studies conclude that human faces have indigenous values which can be measured economically. This statement may sound unnatural, but it has been proven by multiple laboratory experiments and surveys. Recent research shows that people are affected by the shown faces and shift their decisions in a direction unfavorable for themselves (Eckel and Petrie 2011; Ma and Hu 2015; Ma et al. 2015, 2017; Zhang et al. 2011). In a trust game experiment, Eckel and Petrie (2011) demonstrated the strong willingness of subjects to see a counterpart’s photo; both senders and responders purchase the photo for a positive price. And those who bought the photo trusted more than those who did not. Moreover, Heyes and List (2016) experimentally revealed that subjects are willing to pay to show their own photo to counterparts. Following the examples from behavioral economics, we chose to use the face image to signal about human features in contracting scenario and set up the difference from utter human-to-computer settings. Although human-to-human interactions are not realized in full, but manipulated by showing images of the counterparts, the decision-makers cannot ignore the difference between settings and are expected to deviate in their performance.
We believe that our study is distinctive from previous behavioral research in operations management. By using the face images, we apply the direct reference to human-to-human settings opposed to oblique assumptions typically provided through the experimental instructions read prior the trials. To the best of our knowledge, this study is the first in operations management to investigate the effect of faces on supply chain contact terms. We believe that our results make a valuable contribution toward an understanding of the impact of social context on the contracting decisions.
Supply chain contracting environment
To operationalize the contracting environment, we choose to apply standard settings of a supply channel with a single supplier (a seller) and a single retailer (a buyer) (Cachon 2003). The supplier offers a supply chain contract to the retailer; within the contract terms, the supplier identifies a linear wholesale price for a product. The retailer decides on the amount of products to order and places the order quantity with the supplier. Both the supplier and the retailer are facing the uncertain market demand and exogenous retail price . We use the simplest supply chain contract—a wholesale price contract—with the purpose to minimize computational complexity and focus on the impact of social context on pricing decisions.
Under a wholesale price contract, the supplier is burdened with the right choice of to persuade the retailer to order larger and generate positive inflows after incurred the product cost . The retailer is optimizing to avoid the excessive order leading to the obsolete stocks with zero value and the shortage resulting in the loss of customer demand with potential profit. The theoretical literature assumes that both players are rational and act with a purpose to maximize own profits:
For simplicity, we assume that follows the normal distribution truncated between a and b, with , that is similar to the uniform distribution assumption for this case. The deterministic (normative) solution of the system of equations results in the best response choices for the retailer and for the supplier (for details see the Appendix).
Impact of faces on pricing decision
We assume that human interactions are unavoidable in supply chain contracting, and they are carried either through face-to-face meetings (e.g., in-person or virtual with visual representations) or technology-enabled blind communications (e.g., emails or texting). Social preferences are heterogenous on the individual level. However, business practice records and behavioral research literature provide multiple evidence of strong preferences for face-to-face meetings. Thus, 84% of 760 business executives surveyed for Forbes Insight study (2009) chose face-to-face meetings over virtual communications for their business goals. Wakefield Research (2012) revealed that in-person meetings are fundamental for sustaining business relationships (96% of respondents). Moreover, a face-to-face communication “yields a return on investments” according to the Berger (2016) conducted by the Meetings Mean Business coalition and APCO (Berger 2016). Judgments of CEOs faces correlate with the firms’ financial performance (Re and Rule 2016).
In controlled laboratory experiments, decision-makers also demonstrated a desire for a face-to-face communication (Eckel and Petrie 2011). In a trust game, both senders and receivers were willing to purchase a photo of their counterparts. Those who bought the picture sent more than those who did not. Interestingly, when a photo appeared involuntary, subjects did not differentiate in their trust compared to the blind settings. Furthermore, decision-makers were willing to share their own photos and even agreed to pay for that (Heyes and List 2016). By revealing their own facial characteristics, they expected to affect the actions of counterparts.
Listed findings suggest that private facial information learned either from images of faces or during in-person meetings influence judgements about behavioral traits of the seen person. These judgments lead to the change in pricing behavior of a decision-maker. Therefore, a set of certain facial characteristics can be used as a tool for behavioral manipulation, allowing to turn the decision to a favorite venue. Being influenced by the revealed facial information about the partner, the decision-maker reconsiders his or her own utility and deviates in the choice from the optimum. Under the assertion that facial human features impact the supplier’s pricing decision, we state
Hypothesis 1
People are not indifferent to the facial information of their counterparts. The wholesale price offered in a context of shown faces deviates from offered in a context of blind decision.
In our research, we explore the deviation in the choice of offered by a supplier within two types of contracting settings—(1) no private facial information about a retailer is available to a supplier (Blind), and (2) a face image of a retailer is shown to a supplier (Face). With a purpose to identify the face effect in the supply chain contracting on its aggregate level, we allocate and measure the difference in the average offered within two contexts.
Facial traits effects on pricing behavior
Behavioral economics suggests using attractiveness and trustworthiness to explain the variation in effects of facial traits on a trust (Wilson and Eckel 2006; Eckel and Petrie 2011). Studies of the individual’s facial characteristics find a significant association of trustworthiness and dominance with the leadership potential (Dietl et al. 2018; Re and Rule 2016). While the role of these three facial traits has been widely explored within socio-economic settings, to our knowledge no studies have been conducted within a supply chain contracting scenario. However, specific facial characteristics of a business partner are an essential source of information, which a supply chain manager uses to form the behavioral expectations about the partner. For the purpose of our research, we examine the influences of shown faces by manipulating their facial traits; in particular, we chose to explore the effects of the three facial traits: attractiveness, trustworthiness, and dominance. The impacts of these three facial dimensions have been recently studied in various business settings (Krumhuber et al. 2007; Fruhen et al. 2015; Linke et al. 2016; Todorov et al. 2015). The literature suggests the importance of these traits to judgments of a decision-maker, which implies the necessity to investigate their capacity in a context of operations management. We note that the effects of other facial characteristics can be also important to study, but leave them for the further research. In our experiment, we gather the informational impact of counterpart’s facial characteristics on a choice variance in pricing behavior of a supplier. Additionally, we observe the impact of individual’s beliefs about own facial traits on the economic choices.
Attractiveness
In a classic social psychology study, Dion et al. (1972) find that attractive individuals are more successful than unattractive. The social stereotype associated with physical attractiveness is tied to positive benefits in many spheres of life. Attractive people are given hiring preferences over unattractive ones (Cash and Kilcullen 1985; Chiu and Babcock 2002; Ruffle and Shtudiner 2014). A candidate’s physical attractiveness is a strong predictor for electoral success (Laustsen 2014; Berggren et al. 2010; Hart et al. 2011; King and Leigh 2009; Rosar et al. 2008). Attractive borrowers receive a tolerant attitude from lenders in financial transactions (Jin et al. 2017). A good-looking defendant is given a more lenient sentence for burglary (Sigall and Ostrove 1975). These are just a few of the positive benefits associated with physical attractiveness, demonstrating the “beauty premium” effect. However, contrary to the “beauty premium” effect, attractive people may be punished by the “beauty penalty.” Beautiful trustees earn less on the second stage in a trust game (Wilson and Eckel 2006). Attractive female applicants are hired less favorably for managerial positions (Heilman and Saruwatari 1979; Heilman and Stopeck 1985; Ruffle and Shtudiner 2014). When a crime is related to the use of physical beauty, an attractive defendant receives a harsher punishment compared to an unattractive defendant (Sigall and Ostrove 1975).
Researchers started to recognize the importance of physical attractiveness from the mid-1960s to early 1970s (Berscheid and Walster 1974; Hatfield and Sprecher 1986). By consensus, the measure of beauty was identified by judges; each judge was asked to provide his or her independent rating for the physical attractiveness of the subject on a scale from 1 to 10. The reported measures were averaged by subject, and the resulting score is called objective physical attractiveness (Walster et al. 1966). After a wide recognition of correlation of objective physical attractiveness with personality traits, popularity, and cognitive and social abilities, the measure of self-rated or subjective physical attractiveness became of interest (Murstein 1972). Several studies find that subjective physical attractiveness is correlated with cognitive and affective abilities and social skills (Cash et al. 1983; Lerner and Karabenick 1974; Major et al. 1984; Baumeister et al. 2003).
To explain the deviation in a supplier’s decisions about , we consider the effect of physical facial attractiveness of both supply chain partners—a retailer and a supplier. We differentiate subjective evaluative judgments about attractiveness of others and self-esteem attractiveness . The supplier evaluates the facial beauty of the retailer by assigning the score and own attractiveness by self-reporting . From the dual nature of the attractiveness effect (Wilson and Eckel 2006), we expect to observe both beauty effects: a “beauty penalty” and a “beauty premium.” By pleasing a supplier with his or her beauty, an attractive retailer will be awarded by a “beauty premium”—an offer with a lower compared to an unattractive retailer. However, self-judgments about own beauty may influence a supplier either to recognize an attractive retailer as a “beauty competitor” or to make him/her jealous of others' attractiveness (Ruffle and Shtudiner 2014). In this case, an attractive retailer will be punished by a “beauty penalty”—offered less appealing contract terms with a higher . Following the assertion of dubious outcomes for attractive faces, we formulate controversial Hypotheses 2a and 2b.
Hypothesis 2
A retailer with a high facial attractiveness rating is offered a lower wholesale price compared to a retailer with a lower attractiveness score featuring the presence of a “beauty premium” effect. A supplier who reports a highly scored self-attractiveness offers a lower w than a supplier with a low self-reported attractiveness featuring the reciprocate “beauty premium” effect.
retailer with a high facial attractiveness rating is offered a higher wholesale price compared to a retailer with a lower attractiveness score featuring the presence of a “beauty penalty” effect. A supplier who reports a highly scored self-attractiveness offers a higher w than a supplier with a low self-reported attractiveness featuring the reciprocate “beauty penalty” effect.
Trustworthiness
Trustworthiness is typically associated with positive benefits. Trustworthy-looking people have higher chances to obtain a loan and pay a lower interest rate (Duarte et al. 2012). Their offers are more likely to be accepted by businesses (Wu et al. 2018) and by consumers (Dean 2017). Individuals with trustworthy-looking avatars receive larger amounts in a trust game (Tingley 2014).
To understand the effect of trustworthiness on the pricing behavioral solution of a supplier, we study the facial trustworthiness T of both partners. Following the same concept as used to determine attractiveness, we differentiate subjective evaluations of trustworthiness of others and own trustworthiness . The supplier evaluates the facial trustworthiness of the retailer by assigning the score and own trustworthiness by . We expect that a trustworthy-looking retailer anticipates supplier’s positive judgments, which add an unfavorable decision noise in a supplier’s choice of . In parallel, self-rated trustworthiness should also negatively influence the rationality of a supplier. Under the expectations of positive benefits for being trustworthy-looking, we state Hypothesis 3.
Hypothesis 3
A retailer with a high facial trustworthiness rating is offered a lower wholesale price compared to a retailer with a lower trustworthiness score. A supplier who reports a highly scored self-trustworthiness offers a lower than a supplier with a low self-reported trustworthiness.
Dominance
Contrary to trustworthiness, dominance is associated with a greater power and aggressiveness (Oosterhof and Todorov 2008; Dietl et al. 2018). However, the effect of dominance varies with the change of social and organizational contexts. Dominant-looking CEOs of profit-based businesses are perceived as more powerful and achieve a greater financial success, whereas CEOs of non-profit organizations (NPO), who have dominant facial features, are not successful in fund-raising (Re and Rule 2016).
In the context of supply chain contracting, we seek to explain the effect of facial dominance D on the supplier’s decision about the wholesale price . In line with the concept used to determine attractiveness and trustworthiness, we differentiate subjective judgments about dominance of others and self-reported dominance . The supplier evaluates the facial dominance of the retailer by assigning the score and own dominance by . Judgments about trustworthiness and dominance approximate into two orthogonal dimensions used to evaluate faces (Oosterhof and Todorov 2008). While trustworthiness relates to positive factor of warmth, dominance loads to the negative factor of power (Dietl et al. 2018). This anticipates the adverse to trustworthiness expectations for the dominance effect on the human behavior. We expect that greater ratings in both evaluations (self and others) of dominance encourage a supplier for an aggressive pricing behavior. Under the assertion of punishment of having a dominant look, we state Hypothesis 4.
Hypothesis 4
A retailer with a high facial dominance rating is offered a higher wholesale price compared to a retailer with a lower dominance score. A supplier who reports a highly scored self-dominance offers a higher than a supplier with a low self-reported dominance.
Experimental procedure
We borrowed the initial experimental design of a human-to-computer game from Kalkancı et al. (2014) and developed it by adding a social context component—face images of potential retailers. Human subjects played a role as the supplier, and computers were programmed as the retailer. In our experiment, we used the within-subject design with two treatments:
“blind” (Blind) game when subjects have no facial information about the retailer,
“face” (Face) game with shown up of the retailer’s face image on the screen along with the statement “Imagine that the person on the picture is your buyer.”
The treatments were mixed and their order was randomized into 70 periods. Every participant had to make 16 offers blindly and 54 decisions facing an image.
In the experiment, we applied the wholesale price contracting scenario. The supplier had to make a decision about a wholesale price as an optional offer to the retailer. A computer was programmed with an algorithm to maximize the retailer’s profit. The choice distribution of a wholesale price was limited to discrete numbers from 0 up to $100. The market price and costs were kept constant at the rates of and . The demand was generated randomly with the uniform distribution from 0 up to 150 units. We used the z-Tree software (Fischbacher 2007) to program our experimental interface.
We performed two experimental sessions at the behavioral study laboratory of a major public US university; 41 undergraduate students from the college of business were employed to participate in the supply chain contracting game. At the beginning of each experimental session, participants read the instructions at their individual stations and then the instructions were read out loud with explanations of the game settings and examples of the economic decisions made within the game. We informed the participants that they would be playing against the computerized buyers pre-programmed to make a decision about an order quantity which maximizes the expected profit of the computerized buyer. However, we did not discuss the specifics about social context in the experimental treatments. We explained the conversion of the individual earnings in the experiment into the final payment. Participants were compensated in proportion to their individual profits earned in the game, plus a fixed $5 participation fee. The average payment was $14. Each student participated only in one session.
Facial context in experiment
In face treatments, an image of the face of a potential buyer appeared on the screen in front of subjects. The shown faces are not faces of real people. Figure 1 illustrates the example of face images. We selected 54 original computer-generated faces from the database “300 Random Faces” provided by the Social Perception Lab of Princeton University (https://tlab.princeton.edu/databases/). The database consists of 300 Caucasian faces randomly created in the Lab with computer models (Oosterhof and Todorov 2008; Todorov and Oosterhof 2011; Todorov et al. 2011). In order to avoid judgments affected by race stereotypes, the race control was set up as European. All faces have a neutral emotional expression allowing also to control for judgments associated with anger, fear, sadness, and happiness. In addition, the mouth shape, which can have the corners of the mouth up or down, was set up to neutral to further ensure that faces have a neutral expression. Each face has a black background on the image. The image dimensions are set up to a 400 × 400 pixels bitmap.
Fig. 1.
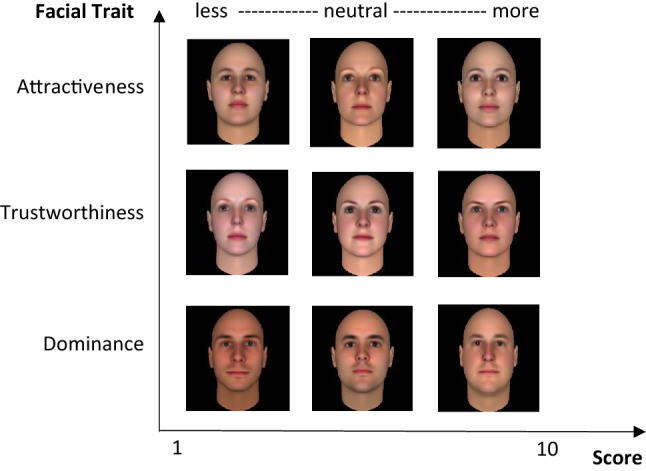
Examples of faces shown in face treatments
The computer models manipulated dimensions of nine facial traits—attractiveness, competence, trustworthiness, dominance, meanness, frightening, extraversion, threatening, and likability—to produce human faces. The scores of these nine facial traits, and the proportion of femininity, are reported for every face from the database. For our experiment, we selected 27 faces categorized as unambiguously male and 27 faces categorized as unambiguously female. The faces were chosen based on the criteria to maximize, minimize, and average the scores of three facial traits—attractiveness, trustworthiness, and dominance (see examples of the faces in Fig. 1). Every face from the total of 54 faces used in the experiment was shown to each subject once.
In addition to a decision about a wholesale price, in a face treatment subjects were asked to evaluate the shown face of an imaginable retailer in terms of one of three facial traits (attractiveness, trustworthiness, dominance) on a scale from 1 (very unattractive, untrustworthy, nondominant) to 10 (very attractive, very trustworthy, very dominant). During the session, every participant evaluated 18 faces in attractiveness, 18 faces in trustworthiness, and 18 faces in dominance. At the end of the experiment, participants were also asked to fill the questionnaire about self-identity (gender, age, ethnicity), their feelings during the game, and report scores of own attractiveness, trustworthiness, and dominance on a scale from 1 to 10.
Experimental results
We first check the effect of faces by comparisons of wholesale prices offered in blind and face conditions (Hypothesis 1). Next, we examine the effects of facial traits on the average (Hypotheses 2–4). Additionally, we compare the density distributions of wholesale prices in low and high conditions of facial traits. Finally, we take an aggregate view on the shape of data distributions.
Wholesale price decisions in blind and face treatments
Table 1 provides summary statistics of wholesale prices offered in blind and face (aggregate and across three facial traits) treatments. We observe systematic deviation of mean below the equilibrium optimum of $65 and across treatments. However, Wilcoxon tests for the subject-average difference do not confirm that in blind treatment differs from in face treatments (p > 0.05).
Table 1.
Offered wholesale price by treatment and primer
| Treatment | Primer | Mean | St.Dev. | Min | Median | Max | n obs |
|---|---|---|---|---|---|---|---|
| Blind | – | 62.99 | 14.83 | 5 | 65.00 | 100 | 656 |
| Face | – | 63.09 | 15.16 | 0 | 65.00 | 100 | 2214 |
| Attractiveness | 62.81 | 16.24 | 0 | 65.00 | 100 | 738 | |
| Trustworthiness | 62.79 | 15.31 | 0 | 65.00 | 100 | 738 | |
| Dominance | 63.67 | 13.83 | 0 | 65.00 | 100 | 738 |
Comparing the aggregate decisions of in blind and face conditions, the two-sided Kolmogorov–Smirnov test reveals that the two distributions are significantly different (p = 0.015). We find strong statistical evidence in support of Hypothesis 1. Therefore, the wholesale prices offered in treatments with shown faces deviate from the wholesale prices offered in treatments with no facial information. Figure 2 illustrates the distribution of over all subjects in face and blind treatments. We can visually observe the shift in the decisions of in blind and face conditions, whereas in blind conditions, participants were selected to offer within the $50–70 range 50% of the time; in Face conditions, they offered within the shorter $55–70 range 50% of the time.
Fig. 2.
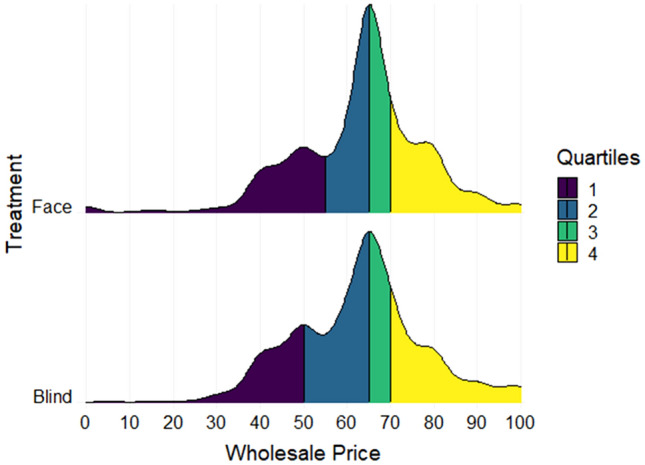
Density distribution of wholesale prices (over all subjects) in blind and face treatments
Facial traits effect on wholesale price decisions
To compare the effects of facial traits on the average wholesale price, we use regression analysis. We fit the data of choices into a regression model with the independent variables for facial traits of others , evaluated by subject for every shown face, and self-reported facial traits :
| 1 |
We apply the random-effects model as the most robust compared to pooled and fixed effects (Hausman Test: p > 0.05, Breusch–Pagan Test: p < 0.01). However, the results for all three effects are consistent. The estimated parameters in Table 2 inform that some of the three facial traits have a significant impact on average :
Attractiveness We find strong significant evidence of the positive effect of attractiveness of shown faces (p < 0.01) in support of Hypothesis 2b. A retailer with more attractive face is punished by a larger average wholesale price. This features the “beauty penalty” effect. However, the effect of self-attractiveness is weakly significant (p < 0.10) to support Hypothesis 2a.
Trustworthiness The facial trustworthiness of others has a significant positive effect (p < 0.01) on the average wholesale price. However, we do not find statistical evidence of the effect of self-reported trustworthiness. Therefore, we find evidence that contradicts Hypothesis 3.
Dominance Based on the regression analysis, the change in dominance of looks does not affect the choice of . No evidence is found to support Hypothesis 4.
Table 2.
Pricing aggregate model (random effects)
| Variable | Wholesale price (w) | ||
|---|---|---|---|
| Attractiveness of others (Ao) | 1.023*** | ||
| (p = 0.000) | |||
| Self-attractiveness (As) | − 1.817* | ||
| (p = 0.072) | |||
| Trustworthiness of others (To) | 0.583*** | ||
| (p = 0.007) | |||
| Self-trustworthiness (Ts) | − 0.375 | ||
| (p = 0.774) | |||
| Dominance of others (Do) | − 0.259 | ||
| (p = 0.186) | |||
| Self-dominance (Ds) | − 0.692 | ||
| (p = 0.350) | |||
| Constant | 70.295*** | 63.128*** | 69.360*** |
| (p = 0.000) | (p = 0.000) | (p = 0.000) | |
| Observations | 738 | 738 | 738 |
| R2 | 0.031 | 0.010 | 0.004 |
| Adjusted R2 | 0.028 | 0.007 | 0.001 |
| F statistic | 23.198*** (df = 2; 735) | 7.545** (df = 2; 735) | 2.667 (df = 2; 735) |
*p < 0.1; **p < 0.05; ***p < 0.01
Complementing the analysis of the average wholesale price, we take an aggregate view on the data distribution of reported choices. We find that the distribution of varies with a change in facial traits of shown faces. Figure 3 demonstrates the distributions of in low and high conditions of appeared facial traits. The Kolmogorov–Smirnov test confirms the difference in effects of low (1–3) and high (8–10) scores of some of the three facial traits, considering others and self-reported :
Attractiveness The suppliers with low self-reported attractiveness offer different wholesale prices compared to the suppliers with high confidence in own attractiveness (p = 0.001). Yet, no significant difference in is found for low and high scores of attractiveness of others.
Trustworthiness The data do not provide sufficient evidence to testify the effect of score difference in trustworthiness of others on . The subjects reported own trustworthiness either neutral or above it ().
Dominance The effects of low and high dominance on pricing behavior are significantly different for others (p = 0.018) and self-reported (p = 0.022) scores.
Fig. 3.

Variations in distribution of wholesale prices (over all subjects) for others and self-reported facial traits
Multimodality in aggregate distributions of wholesale price decisions
By visual inspection of Figs. 2 and 3, we observe that the entire pricing probability distribution is multimodal. The data of are shaped with multiple peaks in both face and blind treatments and in low and high conditions of facial traits. To test unimodality of distributions of , we applied the excess mass and dip statistics. Three non-parametric tests including Hartigan’s, Cheng and Hall, and Ameijeiras–Alonso provide strong evidence that the true number of modes is greater than one (p < 0.0001) in distributions of the pooled data and across treatments. A Gaussian finite mixture model confirms that it is significantly unlikely that choice distributions are unimodal (p < 0.0001). The expectation maximization algorithm identifies the split of density distributions into several components which represent decision choice intervals. Table 3 reports decision components identified in a structure of two distributions by using a Gaussian mixture model. We observe three decision components in a blind treatment and eight components in a face treatment. For comparison, we compound eight face components into three intervals with the means close to means of blind components. Interestingly, the proportion of components with the mean close to the optimum choice ($65) is higher in a face condition (compound to 0.51) than in a blind one (0.28). Multimodal distribution of appears on both the aggregate and individual data levels. Nonparametric excess mass test reports that up to 54% of subjects demonstrate the multimodal decision choices (p < 0.05). A Gaussian finite mixture model identifies that 83% of participants (p < 0.05) are likely to pick from several decision intervals.
Table 3.
Decision intervals identified by a Gaussian mixture model

In summary, the empirical analysis of experimental data reveals complicated patterns of observed behaviors. In particular, the decision distributions are multimodal and the dependencies on facial traits do not follow a simple pattern. To navigate these observations, we summarize our empirical results in Table 4. The phenomenon of multimodal distributions of experimental decisions has been observed before in newsvendor decisions by Wu and Chen (2014). We agree with their argument that “the traditional theory, which generates single-point predictions, is not able to explain” the behavioral patterns (Wu and Chen 2014, p. 259) and requires the new design of the traditional framework. In the next section, we develop a behavioral model to capture the underlying decision process.
Table 4.
Summary of empirical evidences
| Hypothesis/Effect | Average wholesale price (Wilcoxon test, regression analysis) | Distribution of wholesale prices (Kolmogorov–Smirnov test) | Distribution of wholesale prices (excess mass and dip statistics, Gaussian finite mixture model) |
|---|---|---|---|
| Hypothesis 1: face vs blind | No evidence | Different (p < 0.02) | Multimodal (p < 0.0001) |
| Hypothesis 2a and 2b: attractiveness effect | Multimodal (p < 0.0001) | ||
| Others | Positive (p < 0.01) | No evidence | |
| Self | Negative (p < 0.10) | Present (p < 0.01) | |
| Hypothesis 3: trustworthiness effect | Multimodal (p < 0.0001) | ||
| Others | Positive (p < 0.01) | No evidence | |
| Self | No evidence | No evidence | |
| Hypothesis 4: dominance effect | Multimodal (p < 0.0001) | ||
| Others | No evidence | Present (p < 0.02) | |
| Self | No evidence | Present (p < 0.03) |
Conclusion
In this paper, we study how facial traits impact supply chain contracting decisions. We experimentally analyze how decisions about which wholesale price to offer differ whether the participants see or do not see the face of the counterpart.1 We find that the distribution of wholesale price decisions changes depending on whether individuals see (face treatment) or not see (blind condition) faces. More importantly, facial traits, measured by self-reported subjective evaluations of the individual supplier (self) and the retailers (others), have significant impact on wholesale prices set by the supplier. Surprisingly, subjects, in the role of the supplier, respond to faces, even though they were informed that retailers are played by software, and the faces are obviously computer-generated imaginary. We speculate that much of the responses are driven by system 1 (Kahneman 2011) type decision-making process without conscious deliberation. It is, however, beyond the scope of this paper to probe into the detailed inner mechanism of the related cognitive processes.
The pattern of how decision behaviors are dependent on facial traits is complex. Contrary to “beauty premium” expectations, an attractive retailer is penalized with a higher wholesale price indicating a strong “beauty penalty” effect. This effect could be mitigated with a lower supplier’s confidence in own attractiveness. We find that trustworthy-looking retailers also were offered on average a higher wholesale price. However, no difference in selected choices was reported for the suppliers with low and high scores for self-reported trustworthiness. Interestingly, facial dominance, both as observed from shown retailers’ faces and as evaluated by the suppliers from their own faces, affects the distribution of offered wholesale prices.
In addition, we find evidence that decision behaviors are consistent with a hierarchical decision process. We observe features of the trend toward grouping in the selected wholesale price choices. Thus, decision-makers tend to consider a greater number of price ranges when they see the face of the counterpart compared to a blind condition. Moreover, in a face treatment, they are more likely to offer an optimal wholesale price to maximize their profit.
From a managerial perspective, we dispel the myth that face-to-face meetings are good for everyone. Even in the limited setting with no true interactions, seeing faces with certain traits can impact profitability. These reactions are likely not conscious choices, and we speculate that decision-makers may not even be aware. It is beyond the scope of this paper to investigate how to manage these reactions, and even if such management is possible.
This study is not without limitations. This study only addresses how looks impact supply chain decision-making. In practice, social interactions are believed to also play important roles with respect to business outcomes. That constitutes a natural direction, with a rich canvas, for future research. This research could be extended in numerous ways. First, in this study, we use computer-generated faces to elicit behavioral responses and set up a human-to-computer experiment to control other visual and verbal communication cues. It would be interesting to investigate the change in wholesale prices offered in the human-to-human interactions. Second, another intriguing avenue of future research would be to explore the effect of faces across genders, ages, and ethnic groups, which is highly important in virtual communication in the global context of operations management and contracting. Third, different supply chain scenarios should be used in the experimental designs. For example, one could explore the behavioral patterns in wholesale pricing in a scenario with multiple retailers; the facial information can be asymmetric by showing face images only for some players; the reputation effect through repeated interactions can be combined with the face effect. In short, we believe that numerous opportunities to study the effect of human faces on pricing behavior are available to researchers. Empirical answers to these research questions would provide business practitioners with practical knowledge on how to improve cooperation and operational efficiency.
Biographies
Lyudmyla Starostyuk
is an Assistant Professor of Computer Information Systems and Business Analytics at the Metropolitan State University of Denver. She received her Ph.D. degree from the University of Texas at Arlington in 2020. Her main current research areas are in the domains of Behavioral Operations Management and Applications of Business Analytics. The central theme of her research is to investigate the social, psychological, and physical nudges for business decisions applied in the supply chain. She studies the deviation in behavioral decisions of a supplier and a retailer triggered by individual judgments from physical observations (e.g., faces and facial traits, gender, age, and ethnicity) and implied from actions (e.g., shared private information, cheap-talks). Also, Dr. Starostyuk explores the alternative applications of business analytics to solve non-business problems.
Kay-Yut Chen
is a Professor of Information Systems and Operations Management in the College of Business at the University of Texas at Arlington (UTA). He received his Ph.D. degree from the California Institute of Technology, CA, USA, in 1994 and joined UTA later in 2014. Dr. Chen’s research focuses on Behavioral Operations Management, Supply Chain Management, Behavioral and Experimental Economics, and Information Economics. His work has appeared in the Management Science, Interfaces, Games and Economic Behavior, Manufacturing and Service Operation Management, Marketing Letters, Production and Operations Management, and several peer-reviewed proceedings. Dr. Chen serves on the editorial review boards of the Production and Operations Management, International Journal of Electronic Commerce, and has served as a reviewer for a number of journals and conferences including the Management Science, Production and Operations Management, International Journal of Electronic Commerce, Quantum Information Processing and California Management Review.
Edmund L. Prater
is a Professor of Global Supply Chain Operations at the University of Texas at Arlington (UTA). He received his Ph.D. degree from the Georgia Institute of Technology. He oversees the Veterans Business Outreach Center (VBOC) as Executive Director. Dr. Prater is the recipient of the Jefferson Science Fellowship from the National Academy of Sciences. During the 2020-2021 school year, he worked in Washington D.C. for the U.S. State Department. After the year on-site he continues to work and consult for the U.S. State Department. Dr. Prater has published 44 peer-reviewed papers, 6 book chapters, and a textbook. His current research interests are on Healthcare and Global Supply Chain Issues.
Appendix
Solution:
- Best response for the retailer
- Best response for the supplier
- Supply chain coordination:
Footnotes
Although we conducted the experiments with students and not with professional managers, the results can still be generalized to the population of experienced professionals. Moritz et al. (2013) demonstrated that “cognitive reflection is a better predictor of task outcome than other individual characteristics such as college major, years of experience, or managerial position.” In a set of experiments, they used different pools of participants including practicing professionals from a Fortune 500 firm that regularly made economic decisions and students from the business school. The collected experimental data showed no obvious differences by years of experience, education, or managerial position.
Publisher's Note
Springer Nature remains neutral with regard to jurisdictional claims in published maps and institutional affiliations.
References
- 300 random faces. Database. https://tlab.princeton.edu/databases/
- Alicke, Knut, Ed Barriball, and Vera Trautwein. 2021. How COVID-19 is reshaping supply chains. McKinsey and Company, 2011–2020. Retrieved from https://www.mckinsey.com/capabilities/operations/our-insights/how-covid-19-is-reshaping-supply-chains.
- Ahearne M, Atefi Y, Lam SK, Pourmasoudi M. The future of buyer–seller interactions: A conceptual framework and research agenda. Journal of the Academy of Marketing Science. 2022;50(1):22–45. doi: 10.1007/s11747-021-00803-0. [DOI] [PMC free article] [PubMed] [Google Scholar]
- Baumeister RF, Campbell JD, Krueger JI, Vohs KD. Does high self-esteem cause better performance, interpersonal success, happiness, or healthier lifestyles? Psychological Science in the Public Interest. 2003;4(1):1–44. doi: 10.1111/1529-1006.01431. [DOI] [PubMed] [Google Scholar]
- Becker-Peth M, Katok E, Thonemann UW. Designing buyback contracts for irrational but predictable newsvendors. Management Science. 2013;59(8):1800–1816. doi: 10.1287/mnsc.1120.1662. [DOI] [Google Scholar]
- Beer R, Ahn HS, Leider S. Can trustworthiness in a supply chain be signaled? Management Science. 2017;64(9):3974–3994. doi: 10.1287/mnsc.2017.2817. [DOI] [Google Scholar]
- Berger, Dan. 2016. Why small businesses rely on face-to-face meetings. http://www.meetingsmeanbusiness.com/posts/why-small-businesses-rely-face-face-meetings.
- Berggren N, Jordahl H, Poutvaara P. The looks of a winner: Beauty and electoral success. Journal of Public Economics. 2010;94(1–2):8–15. doi: 10.1016/j.jpubeco.2009.11.002. [DOI] [Google Scholar]
- Berscheid E, Walster E. Physical attractiveness. Advances in Experimental Social Psychology. 1974;7(1):157–215. doi: 10.1016/S0065-2601(08)60037-4. [DOI] [Google Scholar]
- Bolton GE, Katok E. Learning by doing in the newsvendor problem: A laboratory investigation of the role of experience and feedback. Manufacturing & Service Operations Management. 2008;10(3):519–538. doi: 10.1287/msom.1060.0190. [DOI] [Google Scholar]
- Cachon GP. Supply chain coordination with contracts. Handbooks in Operations Research and Management Science. 2003;11:227–339. doi: 10.1016/S0927-0507(03)11006-7. [DOI] [Google Scholar]
- Cachon GP, Lariviere MA. Supply chain coordination with revenue-sharing contracts: Strengths and limitations. Management Science. 2005;51(1):30–44. doi: 10.1287/mnsc.1040.0215. [DOI] [Google Scholar]
- Cash TF, Cash DW, Butters JW. “Mirror, mirror, on the wall…?” Contrast effects and self-evaluations of physical attractiveness. Personality and Social Psychology Bulletin. 1983;9(3):351–358. doi: 10.1177/0146167283093004. [DOI] [Google Scholar]
- Cash TF, Kilcullen RN. The aye of the beholder: Susceptibility to sexism and beautyism in the evaluation of managerial applicants. Journal of Applied Social Psychology. 1985;15(4):591–605. doi: 10.1111/j.1559-1816.1985.tb00903.x. [DOI] [Google Scholar]
- Chiu RK, Babcock RD. The relative importance of facial attractiveness and gender in Hong Kong selection decisions. International Journal of Human Resource Management. 2002;13(1):141–155. doi: 10.1080/09585190110092857. [DOI] [Google Scholar]
- Davis AM. An experimental investigation of pull contracts in supply chains. Production and Operations Management. 2015;24(2):325–340. doi: 10.1111/poms.12224. [DOI] [Google Scholar]
- Davis AM, Leider S. Contracts and capacity investment in supply chains. Manufacturing & Service Operations Management. 2018;20(3):403–421. doi: 10.1287/msom.2017.0654. [DOI] [Google Scholar]
- Dean DH. The benefit of a trustworthy face to a financial services provider. Journal of Services Marketing. 2017;31(7):771–783. doi: 10.1108/JSM-06-2016-0221. [DOI] [Google Scholar]
- Dietl E, Rule N, Blickle G. Core self-evaluations mediate the association between leaders’ facial appearance and their professional success: Adults’ and children’s perceptions. The Leadership Quarterly. 2018;29(4):476–488. doi: 10.1016/j.leaqua.2018.01.002. [DOI] [Google Scholar]
- Dion K, Berscheid E, Walster E. What is beautiful is good. Journal of Personality and Social Psychology. 1972;24(3):285–290. doi: 10.1037/h0033731. [DOI] [PubMed] [Google Scholar]
- Duarte J, Siegel S, Young L. Trust and credit: The role of appearance in peer-to-peer lending. The Review of Financial Studies. 2012;25(8):2455–2484. doi: 10.1093/rfs/hhs071. [DOI] [Google Scholar]
- Eckel CC, Petrie R. Face value. The American Economic Review. 2011;101(4):1497–1513. doi: 10.1257/aer.101.4.1497. [DOI] [Google Scholar]
- Fischbacher U. z-Tree: Zurich toolbox for ready-made economic experiments. Experimental Economics. 2007;10(2):171–178. doi: 10.1007/s10683-006-9159-4. [DOI] [Google Scholar]
- Forbes Insight. 2009. Business meetings: The case for face-to-face. https://www.forbes.com/forbesinsights/Business_Meetings_FaceToFace/.
- Fruhen LS, Watkins CD, Jones BC. Perceptions of facial dominance, trustworthiness and attractiveness predict managerial pay awards in experimental tasks. The Leadership Quarterly. 2015;26(6):1005–1016. doi: 10.1016/j.leaqua.2015.07.001. [DOI] [Google Scholar]
- Haitao Cui T, Raju JS, Zhang ZJ. Fairness and channel coordination. Management Science. 2007;53(8):1303–1314. doi: 10.1287/mnsc.1060.0697. [DOI] [Google Scholar]
- Hart W, Ottati VC, Krumdick ND. Physical attractiveness and candidate evaluation: A model of correction. Political Psychology. 2011;32(2):181–203. doi: 10.1111/j.1467-9221.2010.00812.x. [DOI] [Google Scholar]
- Hatfield E, Sprecher S. Mirror, mirror: The importance of looks in everyday life. Albany: Suny Press; 1986. [Google Scholar]
- Heilman ME, Saruwatari LR. When beauty is beastly: The effects of appearance and sex on evaluations of job applicants for managerial and nonmanagerial jobs. Organizational Behavior and Human Performance. 1979;23(3):360–372. doi: 10.1016/0030-5073(79)90003-5. [DOI] [Google Scholar]
- Heilman ME, Stopeck MH. Attractiveness and corporate success: Different causal attributions for males and females. Journal of Applied Psychology. 1985;70(2):379. doi: 10.1037/0021-9010.70.2.379. [DOI] [Google Scholar]
- Heyes A, List JA. Supply and demand for discrimination: Strategic revelation of own characteristics in a trust game. American Economic Review. 2016;106(5):319–323. doi: 10.1257/aer.p20161011. [DOI] [Google Scholar]
- Ho TH, Su X, Wu Y. Distributional and peer-induced fairness in supply chain contract design. Production and Operations Management. 2014;23(2):161–175. doi: 10.1111/poms.12064. [DOI] [Google Scholar]
- Inderfurth K, Sadrieh A, Voigt G. The impact of information sharing on supply chain performance under asymmetric information. Production and Operations Management. 2013;22(2):410–425. doi: 10.1111/j.1937-5956.2012.01372.x. [DOI] [Google Scholar]
- Jin J, Fan B, Dai S, Ma Q. Beauty premium: Event-related potentials evidence of how physical attractiveness matters in online peer-to-peer lending. Neuroscience Letters. 2017;640:130–135. doi: 10.1016/j.neulet.2017.01.037. [DOI] [PubMed] [Google Scholar]
- Kahneman D. Thinking, fast and slow. Macmillan; 2011. [Google Scholar]
- Kalkanci B, Chen KY, Erhun F. Contract complexity and performance under asymmetric demand information: An experimental evaluation. Management Science. 2011;57(4):689–704. doi: 10.1287/mnsc.1110.1318. [DOI] [Google Scholar]
- Kalkancı B, Chen KY, Erhun F. Complexity as a contract design factor: A human-to-human experimental study. Production and Operations Management. 2014;23(2):269–284. doi: 10.1111/poms.12067. [DOI] [Google Scholar]
- Katok E, Olsen T, Pavlov V. Wholesale pricing under mild and privately known concerns for fairness. Production and Operations Management. 2014;23(2):285–302. doi: 10.1111/j.1937-5956.2012.01388.x. [DOI] [Google Scholar]
- Katok E, Wu DY. Contracting in supply chains: A laboratory investigation. Management Science. 2009;55(12):1953–1968. doi: 10.1287/mnsc.1090.1089. [DOI] [Google Scholar]
- Khan, Mohammad Ayub, and Noam Ebner, eds. 2019. The Palgrave handbook of cross-cultural business negotiation. Cham: Springer International Publishing.
- King A, Leigh A. Beautiful politicians. Kyklos. 2009;62(4):579–593. doi: 10.1111/j.1467-6435.2009.00452.x. [DOI] [Google Scholar]
- Kremer M, Minner S, Van Wassenhove LN. Do random errors explain newsvendor behavior? Manufacturing & Service Operations Management. 2010;12(4):673–681. doi: 10.1287/msom.1100.0294. [DOI] [Google Scholar]
- Krumhuber E, Manstead AS, Kappas A. Temporal aspects of facial displays in person and expression perception: The effects of smile dynamics, head-tilt, and gender. Journal of Nonverbal Behavior. 2007;31(1):39–56. doi: 10.1007/s10919-006-0019-x. [DOI] [Google Scholar]
- Laustsen L. Decomposing the relationship between candidates’ facial appearance and electoral success. Political Behavior. 2014;36(4):777–791. doi: 10.1007/s11109-013-9253-1. [DOI] [Google Scholar]
- Lerner RM, Karabenick SA. Physical attractiveness, body attitudes, and self-concept in late adolescents. Journal of Youth and Adolescence. 1974;3(4):307–316. doi: 10.1007/BF02214744. [DOI] [PubMed] [Google Scholar]
- Lewis K. Knowledge and performance in knowledge-worker teams: A longitudinal study of transactive memory systems. Management Science. 2004;50(11):1519–1533. doi: 10.1287/mnsc.1040.0257. [DOI] [Google Scholar]
- Linke L, Saribay SA, Kleisner K. Perceived trustworthiness is associated with position in a corporate hierarchy. Personality and Individual Differences. 2016;99:22–27. doi: 10.1016/j.paid.2016.04.076. [DOI] [Google Scholar]
- Little AC, Jones BC, DeBruine LM. Facial attractiveness: Evolutionary based research. Philosophical Transactions: Biological Sciences. 2011;366(1571):1638–1659. doi: 10.1098/rstb.2010.0404. [DOI] [PMC free article] [PubMed] [Google Scholar]
- Loch CH, Wu Y. Social preferences and supply chain performance: An experimental study. Management Science. 2008;54(11):1835–1849. doi: 10.1287/mnsc.1080.0910. [DOI] [Google Scholar]
- Lotfi Z, Mukhtar M, Sahran S, Zadeh AT. Information sharing in supply chain management. Procedia Technology. 2013;11:298–304. doi: 10.1016/j.protcy.2013.12.194. [DOI] [Google Scholar]
- Ma Q, Hu Y. Beauty matters: Social preferences in a three-person ultimatum game. PLoS ONE. 2015;10(5):e0125806. doi: 10.1371/journal.pone.0125806. [DOI] [PMC free article] [PubMed] [Google Scholar]
- Ma Q, Hu Y, Jiang S, Meng L. The undermining effect of facial attractiveness on brain responses to fairness in the Ultimatum Game: An ERP study. Frontiers in Neuroscience. 2015;9:77. doi: 10.3389/fnins.2015.00077. [DOI] [PMC free article] [PubMed] [Google Scholar]
- Ma Q, Qian D, Hu L, Wang L. Hello handsome! Male’s facial attractiveness gives rise to female’s fairness bias in Ultimatum Game scenarios—An ERP study. PLoS ONE. 2017;12(7):e0180459. doi: 10.1371/journal.pone.0180459. [DOI] [PMC free article] [PubMed] [Google Scholar]
- Major B, Carrington PI, Carnevale PJ. Physical attractiveness and self-esteem: Attributions for praise from an other-sex evaluator. Personality and Social Psychology Bulletin. 1984;10(1):43–50. doi: 10.1177/0146167284101004. [DOI] [Google Scholar]
- Moritz BB, Hill AV, Donohue KL. Individual differences in the newsvendor problem: Behavior and cognitive reflection. Journal of Operations Management. 2013;31(1–2):72–85. doi: 10.1016/j.jom.2012.11.006. [DOI] [Google Scholar]
- Murstein BI. Physical attractiveness and marital choice. Journal of Personality and Social Psychology. 1972;22(1):8. doi: 10.1037/h0032394. [DOI] [PubMed] [Google Scholar]
- Oosterhof NN, Todorov A. The functional basis of face evaluation. Proceedings of the National Academy of Sciences of the United States of America. 2008;105(32):11087–11092. doi: 10.1073/pnas.0805664105. [DOI] [PMC free article] [PubMed] [Google Scholar]
- Ozer O, Zheng Y, Chen KY. Trust in forecast information sharing. Management Science. 2011;57(6):1111–1137. doi: 10.1287/mnsc.1110.1334. [DOI] [Google Scholar]
- Ozer O, Zheng Y, Ren Y. Trust, trustworthiness, and information sharing in supply chains bridging China and the United States. Management Science. 2014;60(10):2435–2460. doi: 10.1287/mnsc.2014.1905. [DOI] [Google Scholar]
- Re DE, Rule NO. Predicting firm success from the facial appearance of chief executive officers of non-profit organizations. Perception. 2016;45(10):1137–1150. doi: 10.1177/0301006616652043. [DOI] [PubMed] [Google Scholar]
- Richter, Felix. 2020. Video chat apps rise to prominence amid pandemic. https://www.statista.com/chart/21268/global-downloads-of-video-chat-apps-amid-covid-19-pandemic/.
- Rhodes G. The evolutionary psychology of facial beauty. Annual Review of Psychology. 2006;57:199–226. doi: 10.1146/annurev.psych.57.102904.190208. [DOI] [PubMed] [Google Scholar]
- Roghanizad MM, Bohns VK. Ask in person: You’re less persuasive than you think over email. Journal of Experimental Social Psychology. 2017;69:223–226. doi: 10.1016/j.jesp.2016.10.002. [DOI] [Google Scholar]
- Rosar U, Klein M, Beckers T. The frog pond beauty contest: Physical attractiveness and electoral success of the constituency candidates at the North Rhine-Westphalia state election of 2005. European Journal of Political Research. 2008;47(1):64–79. [Google Scholar]
- Ruffle BJ, Shtudiner ZE. Are good-looking people more employable? Management Science. 2014;61(8):1760–1776. doi: 10.1287/mnsc.2014.1927. [DOI] [Google Scholar]
- Sajjad A. The COVID-19 pandemic, social sustainability and global supply chain resilience: A review. Corporate Governance: The International Journal of Business in Society. 2021 doi: 10.1108/CG-12-2020-0554. [DOI] [Google Scholar]
- Sigall H, Ostrove N. Beautiful but dangerous: Effects of offender attractiveness and nature of the crime on juridic judgment. Journal of Personality and Social Psychology. 1975;31(3):410. doi: 10.1037/h0076472. [DOI] [Google Scholar]
- Thornhill R, Gangestad SW. Facial attractiveness. Trends in Cognitive Sciences. 1999;3(12):452–460. doi: 10.1016/S1364-6613(99)01403-5. [DOI] [PubMed] [Google Scholar]
- Tingley D. Face-off: Facial features and strategic choice. Political Psychology. 2014;35(1):35–55. doi: 10.1111/pops.12041. [DOI] [Google Scholar]
- Todorov A, Dotsch R, Wigboldus DH, Said CP. Data-driven methods for modeling social perception. Social and Personality Psychology Compass. 2011;5(10):775–791. doi: 10.1111/j.1751-9004.2011.00389.x. [DOI] [Google Scholar]
- Todorov A, Mandisodza AN, Goren A, Hall CC. Inferences of competence from faces predict election outcomes. Science. 2005;308(5728):1623–1626. doi: 10.1126/science.1110589. [DOI] [PubMed] [Google Scholar]
- Todorov A, Olivola CY, Dotsch R, Mende-Siedlecki P. Social attributions from faces: Determinants, consequences, accuracy, and functional significance. Annual Review of Psychology. 2015;66:519–545. doi: 10.1146/annurev-psych-113011-143831. [DOI] [PubMed] [Google Scholar]
- Todorov A, Oosterhof NN. Modeling social perception of faces [social sciences] IEEE Signal Processing Magazine. 2011;28(2):117–122. doi: 10.1109/MSP.2010.940006. [DOI] [Google Scholar]
- Wakefield Research. 2012. Fourth Annual Business Travel Survey. https://asae.cms-plus.com/files/FileDownloads/PublicPolicy/Value%20of%20Meetings_1389467355449_1.pdf.
- Walster E, Aronson V, Abrahams D, Rottman L. Importance of physical attractiveness in dating behavior. Journal of Personality and Social Psychology. 1966;4(5):508. doi: 10.1037/h0021188. [DOI] [PubMed] [Google Scholar]
- Wilson RK, Eckel CC. Judging a book by its cover: Beauty and expectations in the trust game. Political Research Quarterly. 2006;59(2):189–202. doi: 10.1177/106591290605900202. [DOI] [Google Scholar]
- Wu DY, Chen KY. Supply chain contract design: Impact of bounded rationality and individual heterogeneity. Production and Operations Management. 2014;23(2):253–268. doi: 10.1111/poms.12057. [DOI] [Google Scholar]
- Wu Y, Gao L, Wan Y, Wang F, Xu S, Yang Z, Rao H, Pan Y. Effects of facial trustworthiness and gender on decision making in the Ultimatum Game. Social Behavior and Personality: An International Journal. 2018;46(3):499–516. doi: 10.2224/sbp.6966. [DOI] [Google Scholar]
- Wu X, Niederhoff JA. Fairness in selling to the newsvendor. Production and Operations Management. 2014;23(11):2002–2022. doi: 10.1111/poms.12222. [DOI] [Google Scholar]
- Xu Q. Should I trust him? The effects of reviewer profile characteristics on eWOM credibility. Computers in Human Behavior. 2014;33:136–144. doi: 10.1016/j.chb.2014.01.027. [DOI] [Google Scholar]
- Yadav MS, Pavlou PA. Marketing in computer-mediated environments: Research synthesis and new directions. Journal of Marketing. 2014 doi: 10.1509/jm.12.0020. [DOI] [Google Scholar]
- Zebrowitz LA, Hall JA, Murphy NA, Rhodes G. Looking smart and looking good: Facial cues to intelligence and their origins. Personality and Social Psychology Bulletin. 2002;28(2):238–249. doi: 10.1177/0146167202282009. [DOI] [Google Scholar]
- Zhang Y, Kong F, Chen H, Jackson T, Han L, Meng J, Yang Z, Gao J, Najam ul Hasan A. Identifying cognitive preferences for attractive female faces: An event-related potential experiment using a study-test paradigm. Journal of Neuroscience Research. 2011;89(11):1887–1893. doi: 10.1002/jnr.22724. [DOI] [PubMed] [Google Scholar]
- Zhang B, Wu D, Liang L, Olson DL. Supply chain loss averse newsboy model with capital constraint. IEEE Transactions on Systems, Man, and Cybernetics: Systems. 2016;46(5):646–658. doi: 10.1109/TSMC.2015.2475720. [DOI] [Google Scholar]
- Zoom. 2021. Zoom user survey.https://explore.zoom.us/en/zoom-user-survey/.