

Abstract
Protein language modeling is a fast-emerging deep learning method in bioinformatics with diverse applications such as structure prediction and protein design. However, application toward estimating sequence conservation for functional site prediction has not been systematically explored. Here, we present a method for the alignment-free estimation of sequence conservation using sequence embeddings generated from protein language models. Comprehensive benchmarks across publicly available protein language models reveal that ESM2 models provide the best performance to computational cost ratio for conservation estimation. Applying our method to full-length protein sequences, we demonstrate that embedding-based methods are not sensitive to the order of conserved elements—conservation scores can be calculated for multidomain proteins in a single run, without the need to separate individual domains. Our method can also identify conserved functional sites within fast-evolving sequence regions (such as domain inserts), which we demonstrate through the identification of conserved phosphorylation motifs in variable insert segments in protein kinases. Overall, embedding-based conservation analysis is a broadly applicable method for identifying potential functional sites in any full-length protein sequence and estimating conservation in an alignment-free manner. To run this on your protein sequence of interest, try our scripts at https://github.com/esbgkannan/kibby.
Keywords: protein language models, sequence conservation, functional site prediction, deep learning
Introduction
Recent advances in natural language processing have yielded deep learning models capable of parsing and understanding human language [1]. Adapting these methods toward biological data, protein language models (pLM) are trained on millions of biologically observed protein sequences in a self-supervised manner, without annotations [2]. Despite being trained on sequences alone, these models are capable of learning protein representations which encode structural, functional and evolutionary features [3]. These representations are stored in the hidden states—typically referred to as embedding vectors, a representation of raw protein sequences as large numerical matrices. Protein sequence embeddings are further made up of individual residue embeddings which encode the unique context of each residue. Utilizing this context-rich information, previous studies have shown that embeddings can be used to predict long-range residue contacts [4], variant effects [5], and evolutionary relationships. However, applications toward estimating protein sequence conservation for functional site prediction have not been systematically explored and benchmarked.
In the context of protein evolution, conservation is the measure of how likely a given sequence residue is to be maintained by natural selection. Through evolution, residues that play important roles in protein structure and function tend to be more conserved than residues that do not. Consequently, sequence conservation is a good indicator for identifying functionally important residues [6]. Most methods for estimating sequence conservation rely on multiple sequence alignments. However, alignment-based methods are highly dependent on scoring parameters and the order in which conserved segments appear in primary sequence [7]. For instance, an alignment of a sequence composed of motif A followed by motif B would be difficult to align with a sequence in which the motifs appear in a different order (motif B followed by motif A). The order of conserved sequence elements can change throughout evolution due to events such as domain swapping, domain duplication or the insertion/deletion of peptide motifs [8]. As a solution to this issue, we propose that a sequence-embedding-based approach would not be sensitive to the order of conserved elements and would be robust to genomic rearrangements.
Here, we develop a method for estimating protein sequence conservation using embedding vectors generated from protein language models. Upon benchmarking publicly available protein language models from the ESM1, ESM1b [9], ESM2 [10] and ProtTrans [11] families, we found that embedding vectors generated from the ESM2 family of protein language models provide the best performance to computational cost ratio. Additional benchmarks indicate that our embedding-based method predicts a similar global distribution of sequence conservation scores compared with alignment-based methods. Finally, we demonstrate practical applications of our method in estimating sequence conservation for full length proteins and fast-evolving domain inserts.
Materials and methods
Dataset curation
We gathered a dataset of multiple sequence alignments from the Pfam database (retrieved on 10 April 2022) [12] which was used to train a model for predicting sequence conservation (Figure 1A). First, we downloaded all unfiltered UniProt [13] sequence alignments which were labeled as either ‘Domain’ or ‘Family’. Then we reduced redundancy by filtering each alignment at 70% similarity using hhfilter [14] and removing sequences which contained more than 30% gaps. We also removed small alignments containing less than 100 sequences. A total of 11 957 high-quality alignments remained after filtering. We randomly sampled three sequences from each alignment for a total of 35 871 sequences. All alignments were stored in A3M format which represents aligned residues in uppercase, while unaligned residues are retained in lowercase.
Figure 1.

A graphical overview of our overall workflow. (A) The flowchart describes our strategy for curating a training/testing dataset for predicting sequence conservation using protein sequence embeddings. The outer box indicates that all steps within the enclosure are repeated for each alignment sampled. Similarly, the inner box indicates that all steps within the enclosure are repeated for each sequence sampled. A more detailed version of this flowchart is provided in Supplemental Figure S1. (B) The traditional strategy for quantifying sequence conservation requires a multiple sequence alignment. Conservation scores can only be calculated at aligned residue positions. (C) Our strategy for quantifying sequence conservation utilizes sequence embedding vectors generated from protein language models. The sequence embedding is shown as a two-dimensional numerical matrix where each vertical column corresponds to a residue position-residue embeddings. Conservation scores can be calculated for each residue position using regression.
For each protein sequence, conservation is calculated using a multiple sequence alignment which provides conservation scores for aligned residues [6]. We generate an embedding of the same sequence using a protein language model. Each sequence embedding is composed of individual residue embeddings which correspond to each residue of the embedded protein sequence. Because conservation values cannot be generated for unaligned residues, we remove embeddings positions that correspond to unaligned residues. This leaves us with a series of conservation scores for each aligned residue and a corresponding series of residue embedding vectors for the same aligned residues. By repeating this process for all 35 871 sequences, we curated a total of 5543 729 aligned residues and discarded a total of 283 591 unaligned residues. It is important to note that each testing/training example corresponds to a single residue within a larger sequence context.
Sequence conservation
Typically, sequence conservation is quantified using multiple sequence alignments. Sequence conservation measures the degree to which each residue in a sequence is evolutionarily constrained across millions of years of evolution (Figure 1B). Residues that play important roles in protein structure or function tend to be evolutionarily conserved. There are many methods for quantifying conservation—most of which are based on statistical entropy or divergence. For instance, WebLogo [15], one of the most popular methods for quantifying sequence conservation, uses the Shannon entropy by default [16]. In addition to the metric, the conservation score also depends on the multiple sequence alignment. Our dataset curation procedure, described in the previous section, ensures that our alignments are diverse, deep and well-aligned.
Although there are multiple strategies for quantifying conservation from multiple sequence alignments, benchmarks show that the Jensen–Shannon divergence provides the best heuristic for identifying functional sites [6]. Jensen–Shannon divergence measures the similarity between two probability distributions and is bounded to a range of zero to one. We calculate the conservation of an aligned sequence residue by taking the amino acid distribution in the corresponding alignment column and calculating the Jensen–Shannon divergence against the BLOSUM62 background distribution of amino acids [17]. The score is further weighted by the proportion of gaps observed at the aligned column.
Protein sequence embeddings
Protein language models learn the underlying grammar of biological sequences by training on large, universal proteome databases. These models are trained by masked language modeling in which a random subset of residues in each sequence is replaced with blanks and the model is trained to fill in these blanks using contextual information. Given a protein sequence, protein language models generate an embedding vector of size  where each amino acid is represented by a single token and contextual information learned by the model is stored in
  dimensions. In addition to amino acid tokens, most models add additional special tokens which may denote the beginning or end of the sequence. For the given protein sequence embedding,
  corresponds to the total number of amino acid tokens and special tokens. We generate sequence embeddings from a wide variety of pre-trained protein language models [9–11]. All special tokens are removed such that the number of tokens in a given embedding matches the number of residues in its corresponding protein sequence. This allows us to map each residue in the protein sequence to a residue embedding vector in the protein sequence embedding.
Regression model
We fit our regression model using 35 000 examples selected by stratified random sampling, sourced from Pfam ‘Domain’ alignments (0.6% of the total data). Samples were stratified by their conservation scores in order to account for the relative abundance of non-conserved residues versus conserved residues. Model performance was evaluated using the remaining 5508 729 examples (99.4% of the total data). We tried various regression methods including ordinary least squares linear regression, ridge regression which applies an L2 penalty, LASSO regression which applies an L1 penalty and elastic net [18] which applies both penalties. Regression methods were evaluated based on their performance on the testing set. Final predictions from all linear models were clipped to a range of zero to one; values lower than zero were set to zero, while values higher than one were set to one.
Results
Comparison of protein language models for predicting sequence conservation
Our overall goal is to predict sequence conservation using sequence embedding vectors. Here, we benchmark a diverse range of protein language models in order to assess their ability to generate sequence embeddings vectors that capture sequence conservation. Although all protein language models utilize the Transformer-like architecture, there are important technical differences such as the attention module design, the self-supervised training dataset, the number of self-attention layers, the size of the embedding dimension and the method of encoding residue positions. Consequently, the quality of a sequence embedding will differ depending on the model.
We curated a dataset of protein sequences with residue conservation scores, calculated using curated alignments from the Pfam database. For each sequence, we generated embeddings using a wide range of protein language models. Embedding vectors were fit to residue conservation scores using a training set of 35 000 examples, accounting for 0.6% of the total data, while the remaining 99.4% was reserved to test the model. Performance was evaluated by the Pearson correlation of the predicted versus the actual conservation scores on per residue and per sequence level.
Our benchmarks indicate that ESM2 protein language models offer the best overall performance to computational cost ratio (Figure 2). While larger models perform better, they also require more computational resources. Across the ESM2 models, we observe that the exponential increase of model size corresponds to a linear increase in performance. This relationship plateaus at 3B parameters which exhibit similar performance to the 15B parameter models. Based on these benchmarks, we decided to utilize the ESM2 model containing 3B parameters, which offers good performance for a reasonable computational cost. Predicted conservation scores in the following sections will utilize this model unless stated otherwise.
Figure 2.

We compare the performance of various protein language models in generating embedding vectors for predicting sequence conservation. These plots depict the tradeoff between the accuracy of conservation score predictions (measured by Pearson correlation) and the required computational resources for each protein language model (measured by the number of model parameters). The left plot shows an individual residue level comparison, while the right plot is normalized by sequence. Each data point represents a distinct protein language model and the color indicates models from the same family where six ESM2 [10] models are shown in green, four ProtTrans [11] models in red, one ESM1b [9] model in gold and three ESM1 [9] models in blue. Protein language models from the same family are connected by dotted lines.
Our regression models also outperform VESPA (Table 1), a convolutional neural network classifier that predicts nine discrete levels of sequence conservation using embeddings generated from a ProtTrans protein language model [5]. To note a difference in methodology, VESPA used conservation scores calculated using Rate4Site [19], while we calculated conservation scores using Jensen–Shannon divergence. Although benchmark studies indicate that both metrics are equally effective at identifying functional sites, Rate4Site is several orders of magnitude slower [6]. Accounting for potential differences in conservation metric, our regression models also outperform VESPA when scored by Spearman correlation (Supplementary Table S1).
Table 1.
We benchmark the performance of all protein language models in generating embedding vectors for predicting sequence conservation. For each model, we indicate the best method for solving linear coefficients based on testing set performance. Scores for all methods are provided in Supplemental Table S1. On the next-to-last row, we benchmark VESPA, a neural network classifier for predicting sequence conservation using embeddings from a ProtTrans model with 3B parameters [11].
| Language model | Model parameters | Conservation estimator | Pearson (by residue) | Pearson (by sequence) |
|---|---|---|---|---|
| ESM1 | 85M | linear regression | 0.39 | 0.39 |
| 670M | linear regression | 0.47 | 0.46 | |
| 43M | linear regression | 0.34 | 0.35 | |
| ESM1b | 650M | linear regression | 0.62 | 0.64 |
| ESM2 | 8M | linear regression | 0.36 | 0.37 |
| 35M | linear regression | 0.46 | 0.46 | |
| 150M | linear regression | 0.57 | 0.60 | |
| 650M | linear regression | 0.67 | 0.71 | |
| 3B | elastic net regression | 0.71 | 0.74 | |
| 15B | LASSO regression | 0.72 | 0.75 | |
| ProtTrans | 224M | elastic net regression | 0.52 | 0.51 |
| 420M | linear regression | 0.57 | 0.61 | |
| 3B | linear regression | 0.69 | 0.72 | |
| VESPA (neural net) | 0.56 | 0.61 | ||
| 11B | linear regression | 0.67 | 0.71 |
Finally, we benchmark the computational time needed for performing embedding-based sequence conservation estimation (Table 2). Specifically, we benchmark the time it takes to generate an embedding from various language models, then benchmark the time it takes to estimate sequence conservation. Given embeddings from the same language model, our regression-based method outperforms VESPA by a significant margin. Overall results indicate that our regression-based approach is more accurate as well as more computationally efficient as it only requires a single matrix multiplication, followed by addition.
Table 2.
We benchmark the runtime of our method. Indicated on the top row, our method is divided into two steps which are ‘generating embeddings’ and ‘estimating conservation’. Benchmarks were performed using an average workstation with an NVIDIA RTX 2080 GPU and an Intel Xeon Gold 5118 CPU using a 254 residue protein sequence. GPU benchmarks are unavailable for some models which were too large to fit within GPU memory.
| Generating embeddings | Estimating conservation | ||||
|---|---|---|---|---|---|
| Language model | Model parameters | GPU runtime (RTX 2080) | CPU runtime (16 threads) | Conservation estimator | CPU runtime (1 thread) |
| ESM2 | 8M | 9 ms | 116 ms | linear regression | 30  s s |
| 35M | 14 ms | 186 ms | linear regression | 67  s s |
|
| 150M | 29 ms | 433 ms | linear regression | 71  s s |
|
| 650M | 177 ms | 1371 ms | linear regression | 54  s s |
|
| 3B | n/a | 4911 ms | elastic net regression | 61  s s |
|
| ProtTrans | 3B | 79 ms | 2271 ms | linear regression | 147  s s |
| VESPA (neural net) | 4666  s s |
||||
Protein residue embeddings encode sequence context
A protein sequence embedding can be broken down into individual residue embeddings which includes contextual information about each residue. Given that the conservation of a residue is dependent on its sequence context—the functional units which the residue takes part in—the ability to encode contextual information is highly important for embedding-based conservation prediction. In order to benchmark how much contextual information is encoded, we quantify the ability for an individual sequence embedding to predict the conservation of neighboring residues.
In the previous section, we trained regression models to predict the conservation of a given residue position based on the equivalent position in the sequence embedding vector. In this section, we train and test regression models that predict residue conservation using residue embeddings that are a fixed number of positions away from the prediction target which we refer to as the offset. For example, a regression model trained with a fixed offset of +2 would predict the conservation of residue 100 based on the embedding vector of residue 102 (Figure 3A). Separate regression models were trained for each offset.
Figure 3.

Benchmarks for the amount of contextual information encoded by residue embeddings. (A) The diagram on the left shows our method for predicting sequence conservation based on the individual residue embeddings of the corresponding residues. The diagram on the right shows the same method, except residue embeddings are used to predict conservation of residues 2 positions away. (B) The line graph shows the performance in separate regression models in predicting the sequence conservation (x-axis) of residues that are a fixed number of positions from the equivalent residue position on the sequence embedding (y-axis). Each labeled line corresponds to an ESM2 model with varying number of parameters, also indicated on the legend (top-right).
We conduct benchmarks on embeddings generated for all ESM2 models (Figure 3B). Across all ESM2 models, no offset yields the best performance which is expected because most of the information encoded by a residue embedding pertains to its corresponding sequence residue. We observe decreasing performance as the offset increases, which indicates that residue embeddings tend to contain more information on its immediate context. Although performance plateaus at 3B parameters (Figure 2), these benchmarks indicate that the 15B parameter model encodes more context than the 3B model (Figure 3B). For more general applications, this strategy can also be used as a highly informative benchmark for any protein language model to evaluate the amount of learned positional information.
Predicting conservation scores for unaligned sequence regions
The major advantage of our embedding-based method is the ability to assign conservation scores to all residues in a sequence. In comparison, alignment-based methods can only assign conservation scores to aligned residues. For further investigation, we compare the distribution of conservation scores calculated from alignments (Figure 4A) with the distribution of conservation scores calculated from embeddings (Figure 4B). We further separated embedding-based conservation scores based on whether the residue was aligned relative to our Pfam alignments.
Figure 4.

Histograms show the distribution of residue conservation scores calculated from (A) multiple sequence alignments and (B) sequence embedding vectors. We empirically define (non)conserved sites using a cutoff at 0.5 where conserved sites (greater than 0.5) are colored red, while nonconserved sites (less than 0.5) are colored blue. Percentages for conserved and nonconserved sites are provided at the bottom.
A comparison of aligned residues reveals that our embedding-based method predicts a similar ratio of conserved to non-conserved residues as the traditional alignment-based method—about five non-conserved residues for every one conserved residue. Our regression model further predicts the majority of unaligned residues are not conserved, however approximately 6% of these residues may be part of a functional site which is not typically found in a given protein domain context. Given that each Pfam alignment represents a distinct protein domain, our method has potential applications toward identifying novel functional sites that exist in non-conserved insert regions within protein domains. This will be demonstrated in the following section.
Embedding-based conservation analysis for full length proteins
Our embeddings-based method can be used to assign conservation scores to all residues in any full length, multi-domain protein sequence. Interestingly, benchmarks indicates that using full length sequences offers betters performance compared with using domain sequence (Table 3). This can likely be attributed to the additional context that is available in full length sequences.
Table 3.
We benchmark the effect of using full length, multi-domain protein sequences versus single domain sequence. From our curated dataset of 35 871 sequences, we retrieved all full length sequences and identified 9382 multi-domain sequences based on the NCBI Conserved Domain Database (CDD) [20]. We performed embedding-based conservation prediction for all full length sequences, compared with their corresponding domain sequences. In order to facilitate a fair comparison, we evaluated the performance of both groups using the domain sequence region.
| Using full sequence | Using domain sequence | ||||
|---|---|---|---|---|---|
| Language model | Model parameters | Pearson (by residue) | Pearson (by sequence) | Pearson (by residue) | Pearson (by sequence) |
| ESM2 | 8M | 0.36 | 0.38 | 0.36 | 0.38 |
| 35M | 0.46 | 0.49 | 0.45 | 0.46 | |
| 150M | 0.59 | 0.66 | 0.55 | 0.58 | |
| 650M | 0.69 | 0.74 | 0.65 | 0.69 | |
| 3B | 0.71 | 0.76 | 0.68 | 0.73 | |
We perform a case study on a full-length, multi-domain protein using human Bruton’s tyrosine kinase (BTK) which is composed of a Pleckstrin homology (PH) domain, a zinc finger motif, a Src homology 3 (SH3) domain, a Src homology (SH2) domain and a protein kinase domain [21]. We predicted the conservation of each residue by applying our regression model on a protein sequence embedding of full length BTK (Figure 5A). We compare this to the residue conservation score calculated from five separate Pfam alignments corresponding to the individually conserved sequence segments. Our predicted conservation scores are very similar to conservation scores calculated from multiple sequence alignments. Our regression method also predicts a conserved region between the zinc finger and SH3 domains which corresponds to two proline-rich repeat segments.
Figure 5.

We compare conservation scores generated from our regression-based method versus alignments. (A) Sequence conservation scores for full length human BTK (Uniprot Q06187). Shown on the upper histogram, alignment-based conservation scores were calculated from five separate multiple sequence alignments of PH domains (Pfam PF00169), zinc finger motifs (Pfam PF00779), SH3 domains (Pfam PF00018), SH2 domains (Pfam PF00017) and protein kinase domains (Pfam PF07714). Sequence regions covered by each alignment are highlighted gray, while aligned residues are indicated by the black bar at the top of the highlighted box. Shown on the lower histogram are predicted conservation scores calculated from our regression-based method. For all plots, the y-axis shows conservation scores in the range of 0.35 to 1.00. At the bottom, we provide residue numbers as well as the secondary structure where helices are shown in red, while sheets are shown in blue. All secondary structures were defined by DSSP using the AlphaFold2 [22] model prediction database [23]. A more detailed comparison plot for BTK is provided in Supplemental Figure S2. (B) We show a similar plot for human PDGFRB (Uniprot P09619). In the lower histogram, we label five conserved residues located in the disordered insertion segment which occurs in the middle of the kinase domain. A more detailed comparison plot for PDGFRB is provided in Supplemental Figure S3.
We perform another case study on another protein containing a long, disordered insertion segments which can occur between or within distinct protein domains. We demonstrate this using human-platelet-derived growth factor receptor beta (PDGFRB) (Figure 5B). Human PDGFRB contains a disordered, fast-evolving segment in the middle of the protein kinase domain spanning over 100 residues. Furthermore, this insert segment is not covered by the Pfam alignment. While our method predicts most residues in the insert segment to have low conservation, it identifies five conserved residues Y716, Y740, Y751, Y763 and Y771—all of which are tyrosine phosphorylation sites [24–26]. Overall results indicate that our embedding-based method can identify important functional sites and functionally conserved sequence segments, irrespective of the order in which they appear in the sequence.
Discussion
Here, we find that sequence embeddings generated from protein language models are directly correlated with sequence conservation. This allows us to estimate sequence conservation using simple linear models which are both more accurate and faster than the previous neural network-based approach (Tables 1, 2, Supplementary Table S1). However, why does our method work; why are sequence embeddings so correlated with sequence conservation? To provide a bit of background, language models are typically evaluated based on perplexity which measures the certainty of all possible words appearing at a position, given the available context. From an evolutionary biology perspective, we reason that residue positions with lower perplexity are more constrained by natural selection, while residue positions with higher perplexity are less constrained by natural selection. Thus, the concept of perplexity in natural language processing is very similar to the concept of conservation in evolutionary biology. From a more technical standpoint, calculating perplexity requires a full language model containing both an encoder and decoder, however decoders are not available for some pre-trained protein language models. In comparison, our regression-based approach is faster and more computationally efficient as it only requires the encoder half.
Embedding-based sequence conservation analysis offers many practical advantages over traditional alignment-based approaches. Given a protein sequence of interest, traditional methods require a database search in order to find similar sequences to define an alignment. If the protein contains multiple domains, it may also be necessary to define separate alignments for each, further increasing the computational cost and labor. After defining alignments, it is also necessary to map the aligned residues back to the original sequence of interest. In comparison, the most computationally intensive step of our method is generating the protein sequence embedding which takes seconds on an average computer and can be accelerated by several orders of magnitude with GPUs (Table 2). From the sequence embedding, estimating the sequence conservation by regression would take virtually no time at all. Mapping conservation scores back to the original sequence is also trivially easy because scores are generated for all residues, while alignment-based methods would need to account for gaps and unaligned residues.
Although embedding-based conservation analysis can identify conserved sites, the method does not explain why the site is conserved—a disadvantage that is also shared by alignment-based methods. Given the recent emergence of embedding-based sequence analysis, we are optimistic for the development of potential embedding-based solutions. Because our regression-based method for estimating conservation is compatible with all language models, the performance of our method is expected to improve alongside the release of updated protein language models. To propose a potential alternative, it would be interesting to directly characterize the relationship of perplexity and sequence conservation. Furthermore, estimating the perplexity of each residue using a similar regression-based approach would potentially facilitate a more unsupervised and equally fast method of estimating sequence conservation.
Overall, conservation analysis is highly informative for identifying functionally important residues for further experimental or computational characterization. For instance, residue conservation values can be mapped onto experimentally solved protein structures [27]. For even more context, our all-residue conservation scores can also be mapped onto any full length protein using AlphaFold models [22] (Figure 6) or Uniprot sequence annotations [13]. We provide easy-to-use scripts for implementing these analyses in our GitHub repository. These tools are expected to promote the discovery of novel functional sites, especially in fast-evolving or disordered sequence regions.
Figure 6.
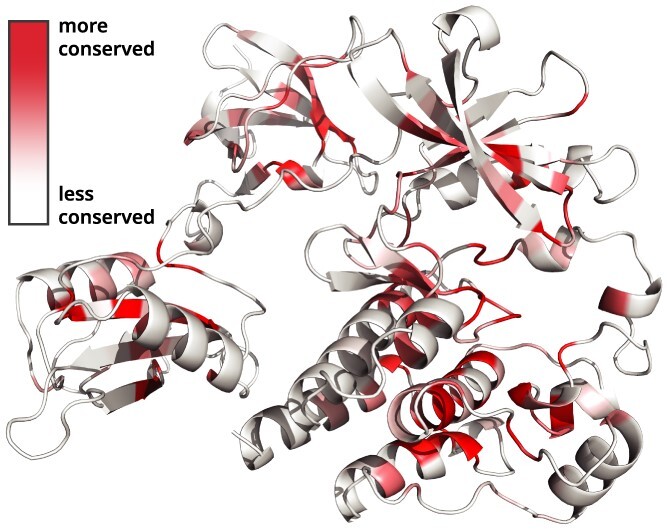
Conservation scores can be mapped onto AlphaFold models. The structure shown here is human BTK (Uniprot Q06187).
Key Points
Embedding-based sequence conservation analysis is an alignment-free method capable of assigning conservation scores for all residues in any given protein sequence.
Embedding-based conservation analysis is useful for identifying conserved functional sites that exist within fast-evolving sequence regions (such as domain inserts or linker regions) which would typically be excluded from multiple sequence alignments.
Compared with traditional alignment-based methods, embedding-based conservation analysis (1) does not require a genomic database search, (2) can parse multiple protein domains in the same run and (3) can be accelerated by GPU.
Supplementary Material
Acknowledgments
This research was supported by funding from ARO to SL (W911NF-21-1-0028) and from the National Institutes of Health (NIH) to NK (R35 GM139656).
Wayland Yeung is a postdoctoral associate at the Institute of Bioinformatics at the University of Georgia. He obtained his Ph.D. from the University of Georgia. His research include deep learning, bioinformatics, evolutionary biology and structural biology.
Zhongliang Zhou is a Ph.D. student at the School of Computing at the University of Georgia. His research focus on Machine Learning and Deep learning with application in bioinformatics and sequential data.
Sheng Li is an assistant professor at the School of Data Science at the University of Virginia. His research include trustworthy representation learning, visual intelligence, user modeling, natural language understanding, bioinformatics and biomedical informatics.
Natarajan Kannan is a professor at the Institute of Bioinformatics and the Department of Biochemistry and Molecular Biology at the University of Georgia. His research focus on using computational and experimental approaches to understand how natural sequence variation contributes to functional variation in different enzyme superfamilies, and how non-natural variation contributes to disease.
Contributor Information
Wayland Yeung, Institute of Bioinformatics, University of Georgia, 30602, Georgia, USA.
Zhongliang Zhou, School of Computing, University of Georgia, 30602, Georgia, USA.
Sheng Li, School of Data Science, University of Virginia, 22903, Virginia, USA.
Natarajan Kannan, Institute of Bioinformatics, University of Georgia, 30602, Georgia, USA; Department of Biochemistry and Molecular Biology, University of Georgia, 30602, Georgia, USA.
Data availability
Our code, models and curated datasets are publicly available at this GitHub repository https://github.com/esbgkannan/kibby.
Author contributions statement
WY, ZZ, SL and NK conceived the project. WY and ZZ implemented algorithms and methods. WY drafted the manuscript with edits from ZZ, SL and NK. NK and SL provided funding. All authors read and approved the manuscript.
References
- 1. Li H. Language models: past, present, and future. Communications of the ACM 2022;65(7):56–63. [Google Scholar]
- 2. Ofer D, Brandes N, Linial M. The language of proteins: Nlp, machine learning & protein sequences. Comput Struct Biotechnol J 2021;19:1750–8. [DOI] [PMC free article] [PubMed] [Google Scholar]
- 3. Bepler T, Berger B. Learning the protein language: evolution, structure, and function. Cell systems 2021;12(6):654–69. [DOI] [PMC free article] [PubMed] [Google Scholar]
- 4. Rao R, Meier J, Sercu T, et al. Transformer protein language models are unsupervised structure learners. In: ICLR, 2021. OpenReview.net.
- 5. Marquet C, Heinzinger M, Olenyi T, et al. Embeddings from protein language models predict conservation and variant effects. Hum Genet 2021;1–19. [DOI] [PMC free article] [PubMed] [Google Scholar]
- 6. Capra JA, Singh M. Predicting functionally important residues from sequence conservation. Bioinformatics 2007;23(15):1875–82. [DOI] [PubMed] [Google Scholar]
- 7. Zielezinski A, Vinga S, Almeida J, et al. Alignment-free sequence comparison: benefits, applications, and tools. Genome Biol 2017;18(1):1–17. [DOI] [PMC free article] [PubMed] [Google Scholar]
- 8. Song N, Joseph JM, Davis GB, et al. Sequence similarity network reveals common ancestry of multidomain proteins. PLoS Comput Biol 2008;4(5):e1000063. [DOI] [PMC free article] [PubMed] [Google Scholar]
- 9. Rives A, Meier J, Sercu T, et al. Biological structure and function emerge from scaling unsupervised learning to 250 million protein sequences. Proc Natl Acad Sci 2021;118(15):e2016239118. [DOI] [PMC free article] [PubMed] [Google Scholar]
- 10. Lin Z, Akin H, Rao R, et al. Language models of protein sequences at the scale of evolution enable accurate structure prediction. Cold Spring Harbor, NY: Cold Spring Harbor Laboratory, bioRxiv, 2022.
- 11. Elnaggar A, Heinzinger M, Dallago C, et al. Prottrans: towards cracking the language of lifes code through self-supervised deep learning and high performance computing. IEEE Trans Pattern Anal Mach Intell 2021;11(10):7112–27. [DOI] [PubMed] [Google Scholar]
- 12. Mistry J, Chuguransky S, Williams L, et al. Pfam: the protein families database in 2021. Nucleic Acids Res 2021;49(D1):D412–9. [DOI] [PMC free article] [PubMed] [Google Scholar]
- 13. Uniprot: the universal protein knowledgebase in 2021. Nucleic Acids Res 2021;49(D1):D480–9. [DOI] [PMC free article] [PubMed] [Google Scholar]
- 14. Steinegger M, Meier M, Mirdita M, et al. Hh-suite3 for fast remote homology detection and deep protein annotation. BMC bioinformatics 2019;20(1):1–15. [DOI] [PMC free article] [PubMed] [Google Scholar]
- 15. Crooks GE, Hon G, Chandonia J-M, et al. Weblogo: a sequence logo generator. Genome Res 2004;14(6):1188–90. [DOI] [PMC free article] [PubMed] [Google Scholar]
- 16. Lin J. Divergence measures based on the shannon entropy. IEEE Transactions on Information theory 1991;37(1):145–51. [Google Scholar]
- 17. Henikoff S, Henikoff JG. Amino acid substitution matrices from protein blocks. Proc Natl Acad Sci 1992;89(22):10915–9. [DOI] [PMC free article] [PubMed] [Google Scholar]
- 18. Zou H, Hastie T. Regularization and variable selection via the elastic net. J R Stat Soc Series B Stat Methodology 2005;67(2):301–20. [Google Scholar]
- 19. Pupko T, Bell RE, Mayrose I, et al. Rate4site: an algorithmic tool for the identification of functional regions in proteins by surface mapping of evolutionary determinants within their homologues. Bioinformatics 2002;18(suppl_1):S71–7. [DOI] [PubMed] [Google Scholar]
- 20. Shennan L, Wang J, Chitsaz F, et al. Cdd/sparcle: the conserved domain database in 2020. Nucleic Acids Res 2020;48(D1):D265–8. [DOI] [PMC free article] [PubMed] [Google Scholar]
- 21. Singh SP, Dammeijer F, Hendriks RW. Role of bruton’s tyrosine kinase in b cells and malignancies. Mol Cancer 2018;17(1):1–23. [DOI] [PMC free article] [PubMed] [Google Scholar]
- 22. Jumper J, Evans R, Pritzel A, et al. Highly accurate protein structure prediction with alphafold. Nature 2021;596(7873):583–9. [DOI] [PMC free article] [PubMed] [Google Scholar]
- 23. Varadi M, Anyango S, Deshpande M, et al. Alphafold protein structure database: massively expanding the structural coverage of protein-sequence space with high-accuracy models. Nucleic Acids Res 2022;50(D1):D439–44. [DOI] [PMC free article] [PubMed] [Google Scholar]
- 24. Kashishian A, Kazlauskas A, Cooper JA. Phosphorylation sites in the pdgf receptor with different specificities for binding gap and pi3 kinase in vivo. EMBO J 1992;11(4):1373–82. [DOI] [PMC free article] [PubMed] [Google Scholar]
- 25. Kovalenko M, Denner K, Sandström J, et al. Site-selective dephosphorylation of the platelet-derived growth factor β-receptor by the receptor-like protein-tyrosine phosphatase dep-1. J Biol Chem 2000;275(21):16219–26. [DOI] [PubMed] [Google Scholar]
- 26. Choi MH, Lee IK, Kim GW, et al. Regulation of pdgf signalling and vascular remodelling by peroxiredoxin ii. Nature 2005;435(7040):347–53. [DOI] [PubMed] [Google Scholar]
- 27. Chorin AB, Masrati G, Kessel A, et al. Consurf-db: an accessible repository for the evolutionary conservation patterns of the majority of pdb proteins. Protein Sci 2020;29(1):258–67. [DOI] [PMC free article] [PubMed] [Google Scholar]
Associated Data
This section collects any data citations, data availability statements, or supplementary materials included in this article.
Supplementary Materials
Data Availability Statement
Our code, models and curated datasets are publicly available at this GitHub repository https://github.com/esbgkannan/kibby.