

Abstract
Diabetes is far more prevalent in smokers than non-smokers, but little is known about underlying mechanisms of vulnerability. Here, we show that the diabetes-associated gene Tcf7l2 is densely expressed in the medial habenula (mHb), where it regulates the function of nicotinic acetylcholine receptors. Inhibition of Tcf7l2 signaling in the mHb increases nicotine intake in mice and rats. Nicotine elevates blood glucose levels through a Tcf7l2-dependent stimulatory action on the mHb. Virus tracing identifies a polysynaptic connection from the mHb to the pancreas, and wild-type rats with a history of nicotine consumption show elevated circulating levels of glucagon and insulin and diabetes-like dysregulation of blood glucose homeostasis. In contrast, Tcf7l2mut rats are resistant to these actions of nicotine. Our findings suggest that Tcf7l2 regulates the stimulatory actions of nicotine on a habenula-pancreas axis that links the addictive properties of nicotine to its diabetes-promoting actions.
Nicotine is the major reinforcing component of tobacco responsible for addiction in cigarette smokers 1. The stimulatory action of nicotine on dopamine neurons in the ventral tegmental area (VTA) is considered necessary and sufficient for the rewarding effects of the drug that motivate smoking behavior 2. Nicotine also activates cholinergic neurons in the medial habenula (mHb) that project to the interpeduncular nucleus (IPn), which elicits noxious responses to nicotine 3. Mechanisms that regulate the stimulatory actions of nicotine on mHb neurons remain poorly understood 4. This is important because sensitivity to the noxious effects of nicotine plays a crucial role in determining the likelihood of progressing from initial to habitual tobacco use and, once the habit is established, the amounts of tobacco that are consumed 4. Recently nicotine was shown to activate neurons in the hindbrain that synthesize glucagon-like peptide-1 (GLP-1) 5. These hindbrain neurons project to the IPn, where locally released GLP-1 enhances mHb-derived excitatory transmission 5. This action abolishes nicotine reward and promotes nicotine avoidance behaviors 5. Transcription factor 7-like 2 (Tcf7l2) is considered a core component of the GLP-1 signaling cascade in pancreatic β cells and in other tissues 6, but little is known about the function of Tcf7l2 in the brain. Tcf7l2 is expressed in all major tissues involved in glycemic control, including the pancreas and liver 7, and allelic variation in TCF7L2 is amongst the most strongly associated and best replicated genetic risk factors for type 2 diabetes (T2D) 8,9. Notably, nicotine contained in cigarettes can stimulate increases in blood glucose levels 10,11, and habitual tobacco smoking dramatically increases the risk of type 2 diabetes (T2D) 12,13. Remarkably little is known about how nicotine increases blood glucose or the relevance of this action to either the persistence of the smoking habit or the pathophysiology of diabetes in smokers. Here, we investigated the role of Tcf7l2 in regulating the motivational properties of nicotine and explored the link between habenular Tcf7l2 activity and the diabetes-promoting actions of nicotine.
Habenular Tcf7l2 regulates nicotine intake
Cholinergic neurons in the mHb co-release glutamate, are the major source of excitatory transmission in the IPn, and play a key role in controlling nicotine intake 5,14. Using Translating Ribosome Affinity Purification (TRAP) data collected from the mHb of ChATDW167 TRAP mice 15, we found that Tcf7l2 transcripts were highly enriched in mHb cholinergic neurons (Fig. 1a,b), and were 4–6-fold higher in the mHb than the striatum, frontal cortex or hippocampus 16,17 (Fig. 1c). Tcf7l2 protein was also densely expressed in the mHb compared with surrounding brain regions in ChAT-tdTom mice (Fig. 1d), in which the fluorescent reporter tdTomato is expressed in mHb cholinergic neurons. Tcf7l2 immunofluorescence colocalized with tdTom-positive and tdTom-negative cells in the mHb (Fig. 1d), suggesting that Tcf7l2 is expressed by both cholinergic and non-cholinergic cells. Robust β-galactosidase (β-gal) activity was detected in the mHb of BAT-GAL mice, in which β-gal expression is controlled by Tcf7l2 (Fig. 1e). Hence, Tcf7l2 is robustly expressed and functionally active in habenular cholinergic neurons that regulate nicotine intake 5,14.
Figure 1. Tcf7l2 is enriched in medial habenula and regulates nicotine intake.
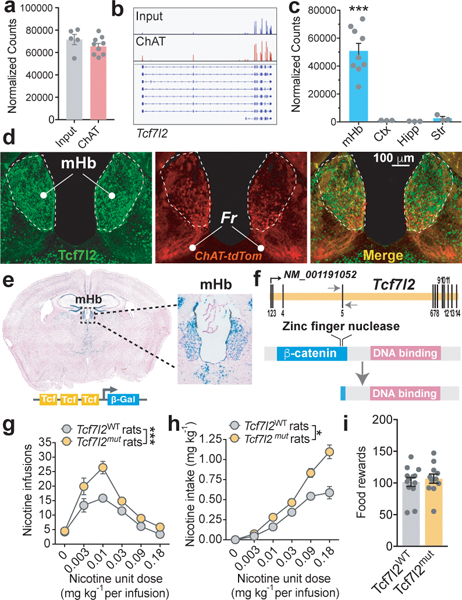
a, BAC-TRAP from ChATDW167 mice showed that Tcf7l2 is highly expressed in habenular cholinergic cells of mice compared with total habenular input (from n=9 mice for IP; n=5 for mice Input). b, Example of RNA-seq reads from habenula of ChATDW167 TRAP mice aligned to the Tcf7l2 gene; observation replicated in subsequent TRAP experiments. c, RNA-Seq showed that Tcf7l2 reads (mean ± S.E.M.) are higher in the mHb (from n=9 mice) than cortex (n=3 mice), hippocampus (n=3 mice) or striatum (n=3 mice) of mice (F3,14=23.6, P<0.001; One-way ANOVA; ***P<0.001 compared with each of the other brain regions, Bonferroni’s multiple comparisons test). d, Immunofluorescence detection of Tcf7l2 (green) in the mHb of ChAT-tdTom (red) reporter mice. e, β-Gal activity in the mHb of BAT-GAL reporter mice (seen independently in n=3 mice). f, Strategy for deleting the β-catenin binding domain of the Tcf7l2 gene using zinc finger nucleases in rats. g, Responding for nicotine (mean ± S.E.M.) was increased in Tcf7l2mut rats (n=30) compared with Tcf7l2WT rats (n=22) (F(1, 236) = 32.75, ***p<0.0001, main effect of Genotype in Two-way ANOVA). h, Total nicotine intake (mean ± S.E.M.) was increased in Tcf7l2mut rats compared with Tcf7l2WT rats (F (1, 193) = 6.72; *p=0.0102, main effect of Genotype in Two-way ANOVA). i, Responding for food rewards (mean ± S.E.M.) was similar in Tcf7l2mut and Tcf7l2WT rats (P=0.61, unpaired two-tailed t-test).
Next, we investigated the role for Tcf7l2 in regulating the motivational properties of nicotine. Mice with a null mutation in Tcf7l2 (Tcf7l2−/−) die during the early postnatal period 18,19. Therefore, we generated a line of Tcf7l2 mutant (Tcf7l2mut) rats using zinc finger nucleases (SS-Tcf7l2em1Mcwi; RGD ID: 5509993) 20. Specifically, we deleted the β-catenin binding domain of the rat Tcf7l2 gene (Extended data 1 and Methods), a site critical for stimulating its transcriptional activity 21 (Fig. 1f). Tcf7l2mut rats survived to adulthood, showed no obvious deleterious health effects, and did not have broad structural or functional abnormalities in the mHb-IPn circuit (Extended data 1). Tcf7l2mut rats responded far more vigorously than Tcf7l2WT rats for intravenous nicotine infusions (0.03–0.18 mg kg−1 per infusion) (Fig. 1g). Tcf7l2WT rats titrated their responding to earn a maximum of ~0.6 mg kg−1 during the 1 h sessions (Fig. 1h), whereas Tcf7l2mut rats showed far less restraint over their intake (Fig. 1h), and their intake progressively increased across sessions (Extended data 1). Tcf7l2mut and Tcf7l2WT rats responded at similar rates for food reinforcers (45 mg pellets) (Fig. 1i), and behaved similarly in an open field arena after acute nicotine injection (0.4 mg kg−1) (Extended data 1). These findings suggest that Tcf7l2 deficiency increases nicotine intake and this effect is not secondary to alterations in behavioral or motor performance.
Next, we used the CRISPR/Cas9 system to investigate the role for Tcf7l2 in the mHb in regulating nicotine intake. We delivered an adeno-associated virus to express a short guide RNA that cleaves mouse Tcf7l2 DNA (AAV-sgRNA-Tcf7l2; Extended data 2) or a control virus (AAV-sgRNA-eGFP), along with an AAV to express Cre recombinase (AAV2-hSYN1-iCre), into the mHb of Rosa26LSL-spCas9-eGFP mice, which express Cas9 in a Cre-dependent manner (Fig. 2c,d; Extended data 2). Rosa26LSL-spCas9-eGFP mice treated with AAV-sgRNA-Tcf7l2 self-administered far greater quantities of nicotine than those treated with AAV-sgRNA-eGFP (Fig. 2e,f; Extended data 2), whereas their responding for food rewards (25 mg pellets) was similar (Fig. 2g). siRNA-mediated knockdown of Tcf7l2 transcripts in the mHb also increased nicotine intake in rats (Fig. 2h,i,j). In addition to being a core component of the GLP-1 signaling cascade, Tcf7l2 is also activated by Wnt glycoproteins 22 and insulin 23. Infusion of the GLP-1 receptor agonist exendin-4 (Ex-4; 12.5–100 ng) into the mHb reduced nicotine intake (Extended data 2). By contrast, mHb infusion of Dickkopf-related protein 1 (rDKK1; 100 ng), a secreted endogenous inhibitor of Wnt signaling, XAV939 (12.5 ng), a small molecule inhibitor of Wnt signaling, 24, or insulin (30 nM), did not alter nicotine intake (Extended data 2). These data establish a key role for habenular Tcf7l2 in controlling nicotine intake and suggest that GLP-1 is likely to regulate habenular Tcf7l2 activity.
Figure 2. Tcf7l2 regulates habenular sensitivity to nicotine.

a, CRISPR-mediated cleavage of Tcf7l2 lowers Tcf7l2 mRNA in N2a cells (from three independent experiments); ***P<0.001, unpaired two-tailed t-test. b, Tcf7l2 Cleavage decreases Tcf7l2 transcriptional activity (from three independent experiments); *P=0.014, unpaired two-tailed t-test. c, Graphical representation showing delivery of Cre-expressing and sgRNA-expressing viruses to mHb. d, DAPI-counterstained brain slice from a ROSALSL-spCas9-eGFP mouse showing GFP- and tdTom-labelled cells in mHb. Representative result from n=3 mice. e, Responding for nicotine (mean ± S.E.M.) was increased in ROSALSL-spCas9-eGFP mice treated with AAV-sgRNA-Tcf7l2 (n=8) compared with those treated with AAV-sgRNA-eGFP (n=7) (F (1, 39) = 34.2; ***P<0.0001, main effect in Two-way ANOVA). f, Total nicotine intake (mean ± S.E.M.) was increased in ROSALSL-spCas9-eGFP mice treated with AAV-sgRNA-Tcf7l2 compared with those treated with AAV-sgRNA-eGFP (F (1, 13) = 16.98; ***P<0.005, main effect in Two-way ANOVA). g, Responding for food rewards (mean ± S.E.M.) was similar in ROSALSL-spCas9-eGFP mice treated with AAV-sgRNA-Tcf7l2 (n=8) compared with those treated with AAV-sgRNA-eGFP (n=7). h, Graphical representation of rat brain showing cannula above mHb (upper) and coronal brain slice showing accurate targeting of dye into mHb. i, Confirmation of siRNA-mediated Tcf7l2 knockdown using real-time PCR (n=5 biologically independent control rats; n=6 biologically independent siRNA rats). ***P=0.0007, unpaired two-tailed t-test. j, Tcf7l2 knockdown in mHb increased nicotine (0.03 mg kg−1 per infusion) intake (mean ± S.E.M.; n=8 biologically independent rats) (F (2, 26) = 5.03; *P=0.0142; interaction effect in two-way ANOVA). k, siRNA-mediated knockdown of Tcf7l2 in mHb increased nicotine (0.12 mg kg−1 per infusion) intake (mean ± S.E.M.; n=7 biologically independent rats) (F (2, 22) = 7.52; *P=0.0007; interaction effect in two-way ANOVA). l, Graphical representation of angled brain slice containing the mHb, fasciculus retroflexus (Fr) and IPn (upper panel) and representative brain slice showing position of pipettes for nicotine delivery and recording (lower panel). m, Representative traces of sEPSCs recorded in IPn neurons from Tcf7l2WT and Tcf7l2mut rats after delivery of nicotine to mHb neurons. n, Nicotine-induced increases in sEPSCs frequency (mean ± S.E.M.) were lower in IPn of Tcf7l2mut rats compared with Tcf7l2WT rats (F (1, 16) = 8.08; *P=0.0118, interaction effect in Two-way ANOVA). o, Nicotine did not alter the amplitude of sEPSCs (mean ± S.E.M.) in IPn of Tcf7l2WT or Tcf7l2mut rats.
Tcf7l2 regulates nAChR function in habenular neurons
Next, we investigated the mechanisms by which Tcf7l2 acts in the mHb to control nicotine intake. Nicotine increased the frequency but not the amplitude of spontaneous excitatory post-synaptic currents (sEPSCs) in IPn neurons when applied to the mHb in slices from Tcf7l2WT rats (Fig. 2m,n,o) 25. This effect was almost completely absent in Tcf7l2mut rats (Fig. 2m,n), suggesting that Tcf7l2 regulates the ability of nicotine to activate the mHb-IPn circuit. Nicotine had no effects on the transcriptional activity of Tcf7l2, or the activation status of its transactivator β-catenin, in rat PC12 cells (Extended data 3). Similarly, nicotine (0.125–1 mg kg−1) did not alter Tcf7l2 activity in the mHb of BAT-GAL mice, nor did nicotine self-administration (0.18 mg kg−1 per infusion) alter habenular Tcf7l2 levels in rats (Extended data 3; Supplementary Fig. 1). Hence, nicotine is unlikely to stimulate excitatory transmission in the IPn through a mechanism involving Tcf7l2 activation. Increases in intracellular calcium levels [Ca2+]I evoked by nicotine in HEK cells that stably express α4β2α5 nAChRs, considered one of the major subtypes of nAChRs in the mHb-IPn circuit 26, were attenuated by siRNA-mediated knockdown Tcf7l2 (Extended data 3). Furthermore, acetylcholine-evoked increases in radiolabeled rubidium (86Rb+) efflux, considered a measure of presynaptic nAChR function 3, were attenuated in synaptosomes from the IPn of Tcf7l2mut rats compared with Tcf7l2WT rats (Extended data 3). This suggests that Tcf7l2 regulates the function of habenular nAChRs. To directly investigate this possibility, we pharmacologically isolated nAChR currents in mHb neurons from Tcf7l2WT and Tcf7l2mut rats. The magnitude of nAChR currents evoked by low frequency pressure-application of nicotine (30 μM; pulsed at 0.1 Hz; Fig. 3a), was similar in mHb neurons from Tcf7l2WT and Tcf7l2mut rats (Fig. 3b,c; Extended data 3). Habenular nAChRs desensitized with the same temporal dynamics in Tcf7l2WT and Tcf7l2mut rats when the frequency of nicotine pulses was increased (0.1 to 1 Hz) (Fig. 3b; Extended data 3). Strikingly, nAChR currents rapidly recovered in mHb neurons from Tcf7l2WT rats when the frequency of nicotine application was decreased (1 to 0.1 Hz), whereas nAChR currents failed to recover in Tcf7l2mut rats (Fig. 3b,c). These findings reveal a crucial role for Tcf7l2 in regulating the function of habenular nAChRs by regulating their capacity to recover from nicotine-induced desensitization.
Figure 3. Tcf7l2 regulates habenular nAChR function.
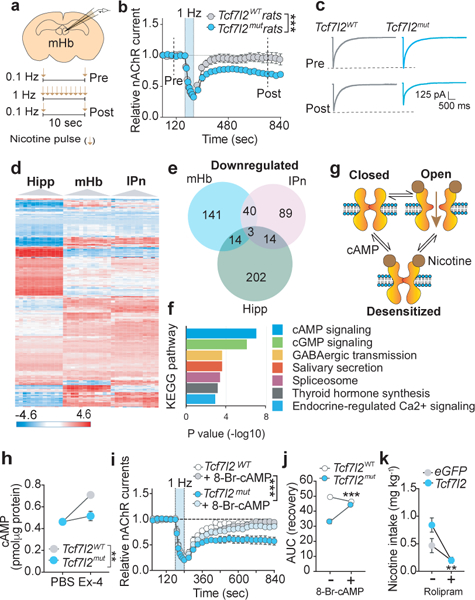
a, Representation of recording sites in mHb (upper) and protocol for nicotine delivery (lower). Image adapted from the Allen Brain Reference Atlas. b, Relative nAChR-mediated currents (mean ± S.E.M.) in response to low (0.1 Hz; Pre), high (1 Hz), then low (0.1 Hz; Post) frequency nicotine (30 μM) pulses in mHb neurons from Tcf7l2WT (10 cells from 4 animals) and Tcf7l2mut (11 cells from 4 animals) rats (F (31, 558) = 5.42; ***P<0.001, interaction effect in Two-way ANOVA). Dotted lines identify time-points at which representative traces shown in panel c were collected. c, Representative nAChR current traces in mHb neurons from Tcf7l2WT and Tcf7l2mut rats evoked by nicotine before (Pre) and after (Post) high-frequency nicotine pulses to desensitize nAChRs. d, Heatmap of RNA-Seq expression data from the hippocampus, mHb and IPn of Tcf7l2WT and Tcf7l2mut rats (n=9 animals per genotype). Displayed are 600 most differentially expressed genes clustered according to brain region. Data are log transformed and z-scored (shown in scale). e, Venn diagram of differentially downregulated genes in the hippocampus, mHb and IPn. f, KEGG analysis of differentially downregulated genes suggests that cAMP signaling is likely to be perturbed in mHb of Tcf7l2mut rats (9 animals per genotype); Fisher exact test. g, Representation of nAChR in the closed (inactive) conformation, nicotine-induced stabilization of the open (active) confirmation, and entry into a desensitized state from which cAMP facilitates recovery. h, cAMP content of mHb tissues (mean ± S.E.M.) from Tcf7l2WT and Tcf7l2mut rats treated with PBS or Ex-4 (100 nM) (3 animals per replicate; 9 animals per genotype); (F (1, 8) = 13.08; **P=0.0068, interaction effect in Two-way ANOVA). i, Relative nAChR-mediated currents (mean ± S.E.M.) in response to low, high and then low frequency nicotine pulses from Tcf7l2WT (6 cells/4 animals), Tcf7l2mut (6 cells/3 animals) rats, Tcf7l2WT+8-Br-cAMP (200 μM) (6 cells/3 animals) and Tcf7l2mut+8-Br-cAMP (6 cells/4 animals) neurons. (F (31, 640) = 2.42; ***P<0.0001; interaction effect in Three-way ANOVA). j, Area under the curve (AUC) of nAChR recovery from desensitization from time of maximal desensitization (240 sec) to end of the recording period (840 sec) in mHb neurons from Tcf7l2WT and Tcf7l2mut rats; (F (1, 20) = 44.1; ***P<0.0001; interaction effect Two-way ANOVA). Data are mean (± S.E.M.) AUC from 6 Tcf7l2WT cells (from 3 animals) and 6 Tcf7l2mut cells (from 3 animals). k, Rolipram decreased nicotine intake (mean ± S.E.M.) in ROSALSL-spCas9-eGFP mice that received intra-mHb injections of AAV-sgRNA-Tcf7l2 (F (1, 9) = 20.9; ***P<0.0001; interaction effect in Two-way ANOVA; n=5 AAV-sgRNA-Tcf7l2 mice, n=6 AAV-sgRNA-eGFP mice).
Tcf7l2 regulates cAMP signaling in the habenula to control nAChR function
Since Tcf7l2 is a transcription factor 27, we used RNA sequencing (RNA-Seq) to identify differentially expressed genes in the mHb of Tcf7l2mut rats that may explain its actions on nAChR function. For comparison, RNA from the IPn and hippocampus was also sequenced (Fig. 3d). This analysis identified ~195 genes that were differentially downregulated in the mHb of Tcf7l2mut rats compared with Tcf7l2WT rats, of which 141 were specifically downregulated in the mHb compared with the IPn or hippocampus (Fig. 3e). This pattern of differential expression was confirmed for representative genes using real-time PCR (Extended data 4). Notably, nAChR subunit transcript levels were similar in the mHb of Tcf7l2mut relative to Tcf7l2WT rats (Extended data 4), suggesting that Tcf7l2 regulates the function but not the expression of habenular nAChRs. siRNA-mediated knockdown of five of these differentially downregulated genes (Pafah1b1, Ndfip1, Arhgap5, Hnrnpu, and Akap9) did not alter α4β2α5 nAChR function in HEK cells (Extended data 4). However, KEGG analysis of the differentially downregulated genes predicted that habenular cAMP signaling is likely to be perturbed in Tcf7l2mut rats (P=9.78e−9; Fig. 3f). Consistent with this prediction, a dominant negative Tcf7l2 mutant (dn-Tcf7l2) reduced the activity of a cAMP luciferase reporter in rat PC12 cells (Extended data 5). Similarly, dn-Tcf7l2 reduced baseline and Ex-4-evoked increases in cAMP luciferase reporter activity in INS-1 cells, an immortalized rat pancreatic β cell line that constitutively expresses GLP-1 receptors 28 (Extended data 5). Ex-4 increased the activity of a lentivirus-expressed cAMP luciferase reporter in the mHb of Tcf7l2WT rats but not Tcf7l2mut rats (Extended data 5). Further, Ex-4-evoked increases in cAMP levels in mHb tissues, measured by ELISA, were greatly attenuated in mHb tissue from Tcf7l2mut rats compared with Tcf7l2WT rats (Fig. 3h). The cAMP analog 8-Bromo-cAMP (8-Br-cAMP) facilitated the recovery of α4β2α5 nAChRs stably expressed in HEK cells from nicotine-induced desensitization (Extended data 5), consistent with cAMP-dependent kinases regulating this process 29–31. Moreover, 8-Br-cAMP also rescued the failure of nAChRs to recover from nicotine-induced desensitization in mHb neurons from Tcf7l2mut rats (Fig. 3i,j). Finally, the phosphodiesterase inhibitor rolipram (1 mg kg−1), which increases cAMP levels in the brains of mice 32, rescued the otherwise increased nicotine intake in Rosa26LSL-spCas9-eGFP mice in which habenular Tcf7l2 was cleaved (Fig. 3k). Together, these findings identify a critical role for Tcf7l2 in regulating the function of habenular nAChR function, and hence nicotine intake, through a mechanism involving control of local cAMP signaling dynamics.
Habenular Tcf7l2 regulates glycemic responses to nicotine
In addition to downregulated genes, we detected 161 differentially upregulated genes in the mHb of Tcf7l2mut rats relative to Tcf7l2WT rats, 85 of which were specifically upregulated in mHb compared with IPn or hippocampus (Extended data 6). KEGG analysis of these upregulated genes suggested that 5 of the 6 top pathways predicted to be perturbed are involved in energy homeostasis, particularly glucose metabolism and blood glucose regulation (Extended data 6). Considering that nicotine can increase blood glucose in smokers 10,11, smoking is a major risk factor for T2D 12,13, and TCF7L2 alleles are strongly associated with T2D 8,9, we hypothesized that Tcf7l2 signaling in the mHb may regulate the actions of nicotine on blood glucose. Nicotine (0.25–1 mg kg−1) dose-dependently increased blood glucose levels in rats (Fig. 4a). By contrast, systemic injection of oxycodone (2.5 mg kg−1) or cocaine (20 mg kg−1) had no effects (Extended data 6). Blood glucose was unaltered in rats by self-administration of the standard nicotine dose used in most experiments (0.03 mg kg−1 per infusion) (Fig. 4b). However, a higher unit dose (0.12 mg kg−1 per infusion), known to stimulate activity in the mHb-IPn circuit 3, increased blood glucose (Fig. 4c). Chemogenetic stimulation of the mHb-IPn circuit similarly increased blood glucose in rats, mimicking the effects of nicotine (Fig. 4d-f; Extended data 7). Chemogenetic stimulation of the IPn of Chrna5-Cre mice also increased blood glucose levels (Extended data 6). Infusion of Ex-4 (100 ng) into the mHb had no effects on blood glucose in rats that self-administered saline (Fig. 4g), but enhanced the hyperglycemic response to nicotine (0.12 mg kg−1 per infusion) (Fig. 4g). Conversely, shRNA-mediated knockdown of GLP-1 receptors in the mHb reduced local Tcf7l2 expression and abolished the stimulatory effects of nicotine on blood glucose (Fig. 4h; Extended data 6). Finally, siRNA-mediated knockdown of Tcf7l2 in the mHb also reduced the hyperglycemic actions of nicotine (Fig. 4i). Similarly, the β1 adrenergic receptor (AR) antagonist atenolol (10 mg kg−1), and the β2AR antagonist ICI118,551 (2 mg kg−1), blocked the hyperglycemic response to nicotine injection (Extended data 6). Atenolol, which does not cross the blood-brain barrier 33,34, also blocked the hyperglycemic response to nicotine self-administration (Fig. 4j) or chemogenetic stimulation of the mHb-IPn circuit (Extended data 6). Mice treated with a hyperglycemic dose of nicotine (0.5 mg kg−1) had depleted glucagon levels in pancreatic islets (Extended data 8). Finally, injection into the pancreas but not the liver of pseudorabies virus expressing GFP (pRV-GFP), which travels in a retrograde fashion from sites of infection via synaptically connected neurons (Fig. 4k), resulted in GFP-expressing tdTom-positive cholinergic cells in the mHb and GFP-positive cells in the IPn that were in close apposition to tdTom-positive fibers from the mHb in these mice (Fig. 4i; Extended data 8). Together, these findings suggest that nicotine increases blood glucose levels in a GLP-1/Tcf7l2-dependent manner, through a mechanism involving recruitment of sympathetic nervous system transmission and release of glucagon from the pancreas.
Figure 4. Habenular Tcf7l2 regulates hyperglycemic response to nicotine.
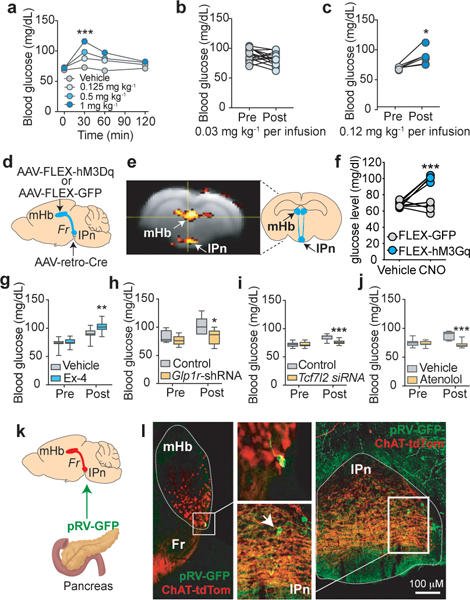
a, Nicotine elevated fasting blood glucose in rats (F (9, 66) = 13; ***P<0.0001; interaction effect in Two-way ANOVA; n=8). b, Self-administration of the standard dose of nicotine (0.03 mg kg−1 per infusion) did not alter blood glucose levels in rats (n=15). c, Self-administration of a higher nicotine dose (0.12 mg kg−1 per infusion) elevated blood glucose in rats (n=6). **P=0.0092, two-tailed paired t-test. d, Graphical representation of rat brain showing strategy to chemogenetically stimulate the mHb-IPn circuit. Retro-AAV-Cre was delivered into the IPn and Cre-dependent FLEX-hM3Dq (n=5) or FLEX-GFP (n=5) was delivered into the mHb. e, Clozapine-N-oxide (CNO) (3 mg kg−1) increased activity of the mHb-IPn circuit of rats expressing FLEX-hM3Dq but not in those expressing FLEX-GFP, reflected by changes in BOLD signal measured by fMRI. Experiment was performed on a single occasion. Coronal brain image adapted from the Allen Brain Reference Atlas. f, CNO injection elevated fasting blood glucose levels in rats expressing FLEX-hM3Dq (n=5 rats) compared with those expressing FLEX-GFP (n=5 rats); F (1, 8) = 85.2; ***P<0.0001; interaction effect in Two-way ANOVA. g, Intra-mHb infusion of Ex-4 (100 ng) enhanced the hyperglycemic response to self-administered nicotine in rats (n=10); F (1, 21) = 8.39; **P=0.0086; interaction effect in Two-way ANOVA. Box plot shows min-max range. h, Knockdown of Glp1r transcripts in mHb abolished the hyperglycemic response to self-administered nicotine infusions in rats (n=6 per virus); F (1, 10) = 5.15; *P=0.0466; interaction effect in Two-way ANOVA. Box plot shows min-max range. i, Tcf7l2 knockdown in mHb abolished the hyperglycemic response to self-administered nicotine in rats (n=10); F (1, 18) = 18.6; ***P<0.001; interaction effect in Two-way ANOVA. Box plot shows min-max range. j, Atenolol abolished the hyperglycemic response to self-administered nicotine in rats (n=7); F (1, 12) = 19.8; ***P<0.001; interaction effect in Two-way ANOVA. Box plot shows min-max range. k, Graphical representation of strategy to trace polysynaptic inputs from the mHb-IPn circuit to the pancreas in ChAT-tdTom reporter mice. l, Image of a pRV-GFP-labelled cholinergic cell in the ventral region of the mHb, and pRV-GFP-labelled IPn neuron in close apposition to cholinergic fibers (red) from the mHb (inserts show magnified images). Representative result from two independent experiments.
Glucose regulates nAChR function in the habenula
Next, we investigated the behavioral and physiological significance of the hyperglycemic actions of nicotine. Neither oral nor IV infusion of glucose or glucagon had any effects on nicotine self-administration in rats (Extended data 9). Similarly, a dose of atenolol that completely blocked the hyperglycemic actions of nicotine did not alter nicotine intake in rats (Extended data 9). This suggests that obtaining the stimulatory effects of nicotine on blood glucose is unlikely to contribute of the motivational properties of the drug. Notably, we identified 1160 transcripts whose translation was altered in mHb cholinergic neurons of ChATDW167 TRAP mice by 6 weeks of daily sucrose consumption (Extended data 9). This suggests that elevated circulating glucose levels can modulate mHb function. Increasing the glucose concentration in the extracellular solution (12.5 to 30 mM) had no effects on the spike frequency of mHb neurons, but decreased the magnitude of nicotine-evoked habenular nAChR currents (Extended data 9). This suggests that nicotine-induced increases in blood glucose may ‘feedback’ onto mHb neurons to inhibit local nAChR function and promote the development of habitual tobacco smoking. Glucose regulation of habenular nAChR function could also explain the high rates of tobacco use in those suffering from T2D and their greater difficulty quitting the habit that non-diabetic subjects 35. Finally, we investigated the effects of repeated exposure to the hyperglycemic actions of nicotine on blood glucose homeostasis. Fasting blood glucose levels were reduced in the rats with a history of nicotine self-administration (0.12 mg kg−1 per infusion; 21 daily sessions) compared with rats that self-administered saline when measured 24 h after their final session (Extended data 9). This hypoglycemic state during early nicotine withdrawal likely contributes to the well-known carbohydrate craving experienced by tobacco smokers during the initial stages of a quit attempt 36. By contrast, the nicotine-experienced rats showed elevated fasting blood glucose levels and deficits in glucose clearance compared with saline-experienced rats when measured 3 and 6 weeks after their final session (Fig. 5a-c; Extended data 9). Circulating glucagon and insulin levels were also elevated in the nicotine-experienced rats (Fig. 5d,e). Similarly, pancreatic glucagon and insulin content were increased in mice after >1 month of withdrawal from chronic nicotine treatment (0.5 mg kg−1 per day for 14 days) compared with saline-treated mice (Fig. 5f-h). Increased circulating glucagon and insulin levels is a hallmark of the counterregulatory response engaged during periods of fasting to maintain homeostatic blood glucose levels. The fact that nicotine-experienced rats showed counterregulatory-like elevations in glucagon and insulin, even though they were ad libitum fed and their body were similar to saline-experienced rats (Extended data 9), suggests that nicotine alters metabolism to trigger hunger-like adaptions in blood glucose regulation. To investigate the role for Tcf7l2 in this action, we examined the effects of chronic saline or nicotine (1 mg kg−1 per day; 21 consecutive days) injections on blood glucose homeostasis in Tcf7l2mut and Tcf7l2WT rats (Fig. 5i). There were no differences in pre-treatment blood glucose or glucagon levels in Tcf7l2mut and Tcf7l2WT rats (Extended data 9). After chronic saline treatment, fasting blood glucose levels were again similar in Tcf7l2WT and Tcf7l2mut rats (Fig. 5j). However, chronic treatment elevated fasting blood glucose (Fig. 5k) and glucagon (Extended data 9) levels in Tcf7l2WT compared with Tcf7l2mut rats when assessed 5 and 12 weeks after the final nicotine injection (Fig. 5), suggesting that Tcf7l2 regulates the emergence of diabetes-like abnormalities in blood glucose homeostasis in nicotine-experienced animals (see Extended data 10).
Figure 5. Tcf7l2 regulates the diabetes-promoting actions of nicotine.
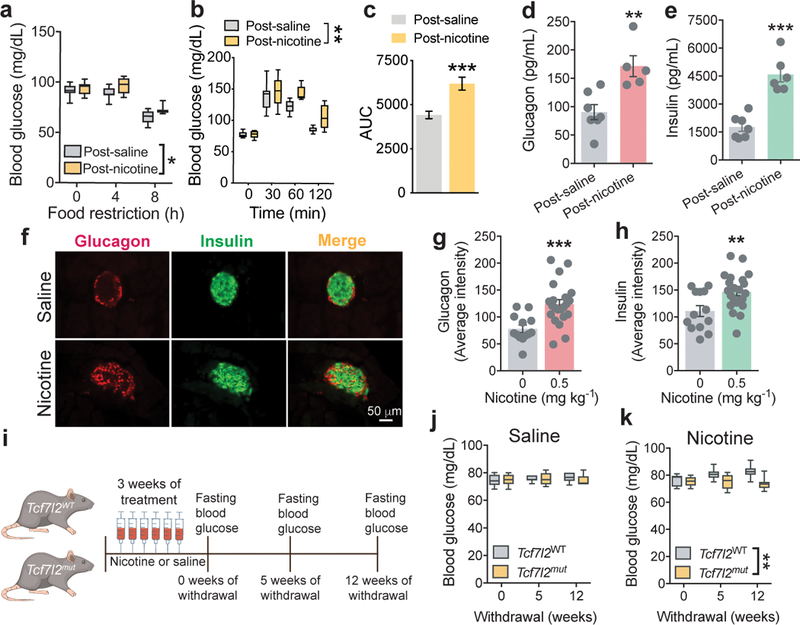
a, Blood glucose levels were assessed over 8 h of food restriction in rats with a history of self-administering saline (n=8) or nicotine (n=7); F (2, 26) = 71.1; P<0.0001, main effect of Time; F (1, 13) = 8.6; *P<0.05, main effect of Nicotine in Two-way ANOVA. Box plot shows min-max range. b, Glucose clearance was impaired in nicotine-experienced (n=6) compared with saline-experienced (n=8) rats in an oral glucose tolerance test (OGTT). Data are presented as change in blood glucose from time = 0 (F (1, 12) = 6.2; *P=0.0284, main effect in two-way ANOVA. c, Area under the curve (AUC) analysis (mean ± S.E.M.) of the time-course of glucose clearance in nicotine-experienced (n=6) and saline-experienced (n=8) rats in the OGTT. ***P=0.0007, unpaired two-tailed t-test. d, Circulating glucagon levels (mean ± S.E.M.) were elevated in post-nicotine rats (n=6) compared with post-saline rats (n=5). Data from biologically independent animals; **P=0.0042, unpaired two-tailed t-test. e, Circulating insulin levels (mean ± S.E.M.) were elevated in post-nicotine rats (n=6) compared with post-saline rats (n=6). Data from biologically independent animals; ***P<0.001, unpaired two-tailed t-test. f, Immunostaining for glucagon (left panels), insulin (middle panels) and their overlap (right panels) in mice treated chronically with saline (upper panels; n=3) or nicotine (0.5 mg kg−1; lower panels; n=3). Experiment was performed on a single occasion. g, Quantification of glucagon intensity (mean ± S.E.M.) in pancreatic islets from mice treated with saline (from 13 islets images in n=3 mice) or nicotine (from 22 islets images in n=3 mice); ***P=0.0006, unpaired two-trailed t-test. h, Quantification of insulin intensity (mean ± S.E.M.) in pancreatic islets from mice treated with saline (from 13 islets images in n=3 mice) or nicotine (from 22 islets images in n=3 mice); **P<0.006, unpaired two-trailed t-test. i, Graphical representation of experiment designed to test the effects of withdrawal from chronic nicotine injections on blood glucose in Tcf7l2WT and Tcf7l2mut rats. j, Fasting blood glucose levels (mean ± S.E.M.) were similar in Tcf7l2WT (n=6) and Tcf7l2mut (n=6) rats that were treated chronically with saline. Box plot shows min-max range. k, Fasting blood glucose levels (mean ± S.E.M.) were elevated in Tcf7l2WT (n=6) compared with Tcf7l2mut (n=8) rats after chronic nicotine (1 mg kg−1) treatment; F (1, 12) = 10.4; **P=0.0073, main effect in Two-way ANOVA. Box plot shows min-max range.
Conclusions
Our findings reveal a crucial role for the diabetes-associated transcription factor Tcf7l2 in regulating the function of nAChRs in the habenula and in controlling nicotine intake. Surprisingly, we find that habenular neurons provide polysynaptic input to the pancreas and that nicotine acts on this habenula-pancreas circuit, in a Tcf7l2-dependent manner and via the autonomic nervous system, to increase blood glucose levels. The reason why mHb stimulation should evoke such robust increases in blood glucose is unclear, but recent findings suggest that the mHb plays a key role in coordinating adaptive responses to stressful or threatening stimuli 37–40. Hence, it is likely that the mHb also regulates hyperglycemic responses to stress, the function of which is to mobilize energy stores for ‘fight-or-flight’ behaviors 41. By repeatedly hijacking this mHb-regulated stress response, chronic nicotine use precipitates abnormalities in blood glucose homeostasis in a Tcf7l2-dependent manner. It is striking that this pattern of effects is usually seen during periods of fasting, suggesting that nicotine withdrawal is associated with maladaptive alterations in metabolism that are analogous to a state of hunger. It is also notable that loss of Tcf7l2 function in the mHb increased nicotine consumption yet reduced hyperglycemic responses to the drug and protected against abnormalities in blood glucose homeostasis. If these findings extend to human smokers, they would suggest a complex action whereby deficits in Tcf7l2 signaling increases the risk of tobacco dependence yet simultaneously protects against smoking-related diabetes. More broadly, our findings provide compelling evidence that diabetes and perhaps other smoking-related diseases, such as hypertension and cardiovascular disease, may originate in the brain and reflect nicotine-induced disruption of habenula-regulated interactions with the autonomic nervous system.
METHODS
Animals
Tcf7l2 mutant rats were generated by directing zinc finger nucleases to a 169 base-pair (bp) region that spans the end portion of exon 5, which encodes the β-catenin binding domain, and the beginning portion of following intron on a Dahl/SS (derived from Sprague Dawley) background (Extended data 1); see Ref. 20. Accurate targeting of this region was confirmed by Sanger sequencing of genomic DNA from Tcf7l2 mutant rats (Extended data 1). This partial deletion of exon 5 is predicted to produce two truncated proteins, one that is 427 amino acids long and in which the majority of the β-catenin binding domain has been deleted and the other a shorter protein (207 amino acids) that contains only the N-terminal region of the β-catenin binding domain. To detect deletion near the targeted ZFN binding site, primers flanking exon 5 were used to amplify the intervening region by PCR from genomic DNA. The primer sequences were Tcf7l2-seq-F, CGCACAATGCTTATTCCTTAGC and Tcf7l2-seq-R, GGACGCCCACAAGTCTAGC. Wild-type and mutant PCR products were purified and sequenced by Sanger sequencing using the same primers. A 169 bp region comprising 49 bp of exon 5 and 120 bp of the following intron was confirmed to be deleted. Open reading frames of the predicted mutant Tcf7l2 mRNA were generated using Vector NTI software and based on the NCBI Tcf7l2 transcript NM_001191052.1. Tcf7l2WT and Tcf7l2mut rats were obtained by heterozygous mating schemes. Tcf7l2mut rats are available upon request. Rats were housed 2 per cage in an AALAC-approved vivarium on a 12-h reverse light–dark cycle. All experiments were carried out according to approved protocols from The Scripps Research Institute and Icahn School of Medicine at Mount Sinai Institutional Animal Care and Use Committees.
Rosa26LSL-spCas9-eGFP (Stock #026175), ChAT-Cre (Stock #006410), ChATDW167 TRAP (Stock #030250), BAT-GAL (Stock #00531) and ROSA-tdTom (Stock #007914) mice were obtained from Jackson Laboratories and were bred in our animal facilities. All breeding was conducted by mating heterozygous pairs. Mice were housed in cages of 1–3 and were at least 6 weeks of age at the beginning of experiments.
Drugs
For self-administration experiments in mice and rats, nicotine bitartrate dihydrate (CAS# 6019–06-3, MP Biomedicals, Santa Ana, CA) was dissolved in 0.9% sterile saline. All doses of nicotine refer to the free-base form. Atenolol (CAS# 29122–68-7, Sigma-Aldrich, St. Louis, MO) was dissolved in 2mM HCl in 0.9% sterile saline. The GLP-1 receptor agonist Ex-4 (Tocris, Ellisville, MO) was dissolved in 0.9% saline solution for in vivo use and 0.1M PBS for ex vivo use. Clozapine-N-oxide (CNO, Enzo Life Sciences, Farmingdale, NY), insulin (CAS# 11070–73-8, Sigma-Aldrich, St. Louis, MO) and glucagon (CAS# 16941–32-5, Sigma-Aldrich, St. Louis, MO) were diluted in 0.9% saline for intraperitoneal injection. D-(+)-Glucose (CAS# 50–99-7, Sigma-Aldrich, St. Louis, MO) was dissolved in dH2O for oral gavage. cAMPS-RP, 8-Br-cAMP, and Rolipram (Tocris, Ellisville, MO) were all dissolved in 0.9% saline. The pH of all solutions was adjusted to ~7.4. The pH of all solutions was adjusted to ~7.4.
Cell culture
Cell lines were maintained at 37°C in a 5% CO2 atmosphere. For experiments, cells were plated at 5×10⁴ cells/per well in tissue culture-treated 24-well plates (Corning, Corning, NY, USA) and transfected using the Lipofectamine 3000 Transfection Reagent (Thermo Fisher Scientific, Carlsbad, CA, USA) per the manufacturer’s instructions unless otherwise noted. Rat INS-1 cells (a pancreatic β-cell line) were cultured in RPMI 1640 medium containing 25 mM HEPES, 2 mM glutamine, 1 mM pyruvate, 10% FBS (Gibco, Carlsbad, CA, USA) and 1% Pen/Strep. Rat PC12 cells (a neuroblastic pheochromocytoma cells of the adrenal medulla) were grown in F-12k medium (Gibco, Carlsbad, CA, USA) with 10% FBS, 5% horse serum and 1% Pen/Strep, and differentiated using nerve growth factor (NGF) stimulation (50 ng/ml). Mouse Neuro2A cells were grown in DMEM medium (Cellgro,Corning, NY, USA) containing 10% FBS and 1% Pen/Strep. For luciferase reporter assays, samples were processed using the Dual-Glo Luciferase Assay System (Promega, Madison, WI, USA) per the manufacturer’s instructions.
DNA vectors
For luciferase experiments in INS-1 and PC12 cell lines, we obtained p-Lenti-7xTcf-FFluc-SV40-mCherry from Addgene (7TFC; Addgene plasmid #24307, gift from Roel Nusse). The p-Lenti-7xTcf-FFluc-SV40-mCherry construct contained 7 consensus binding sequences for human TCF7L2 to control luciferase transcription. EVX1-CREB-Luciferase-GFP was a gift from Michael Conkright. The EVX1-CREB-Luciferase-GFP contains cAMP-responsive elements to control luciferase transcription. A dominant-negative TCF7L2 construct (EdTc) was obtained from Addgene (EdTc; Addgene plasmid #24310, gift from Roel Nusse). The pGF-CREB-mCMV-EF1α-Puro CREB reporter and the control vector in a lentivirus backbone were purchased from System Biosciences Inc. (Catalog number TR202va-p, Pao Alto, CA, USA). The vector was packaged into active lentivirus particles (>108 IFUs) for in vivo experiments.
Viral vectors
All viruses were distributed into 10 μL aliquots, kept at −80 °C, and thawed immediately before injection. For knockdown of Glp1r transcripts in rat brain, a short hairpin (shRNA) construct that knocks down rat Glp1r by >80% in cultured cells and efficiently reduces Glp1r transcripts in rat brain (AAV1-sh-GLP1r-GFP; serotype 1) was used. The sequence of the shRNA was 5′-GATCGGGTTGCTGGTGGAAGGCGTGTATCTGTACTCAAGAGGTACAGATACACGCCTTCCACCAGCAACCTTTTTT-3′. Knockdown of Glp1r in the mHb was confirmed by real-time PCR using the rat Glp1r Taqman assay, Rn00562406_m1 (ThermoFisher Scientific, Waltham, MA). Following injection, animals were allowed to recover for at least 2 weeks before experimentation.
RNA extraction
For RNA extraction and analysis, habenula tissues were homogenized in 500 μl TRIzol Reagent (ThermoFisher Scientific, Carlsbad, CA, USA) according to the manufacturer’s instructions. Samples were sonicated to complete homogenization. 100 μl of chloroform was added and samples were vigorously vortexed for 15 sec. After a 3 min incubation at room temperature, the samples were centrifuged at 12,000 x g at 4°C for 15 min. The aqueous phase of the sample was removed by angling the tube at 45° and pipetting the solution to a fresh tube. 250 μl of 100% isopropanol was added to the aqueous phase and incubated for 10 min at room temperature. Samples were then centrifuged at 12,000 x g for 10 min at 4°C. Supernatant was removed and discarded, leaving behind the RNA pellet. The pellet was washed with 500 μl 75% ethanol twice. The tube was allowed to dry for 5 min at room temperature. The pellet was resuspended in 20 μl nuclease-free water. Residual genomic DNA was removed using the DNA-free Kit (ThermoFisher Scientific, Carlsbad, CA, USA) per the manufacturer’s instructions. The concentration was measured using a NanoDrop machine (ThermoFisher Scientific, Carlsbad, CA, USA). Samples were stored at −80 °C until processing.
In vitro Calcium measurement (FLIPR assays)
Cell lines were maintained at 37°C in a 5% CO2 atmosphere. For fluorometric imaging plate reader (FLIPR) assay, HEK293T cells were cultured in DMEM medium containing 25 mM HEPES, 2 mM glutamine, 1 mM pyruvate, 10% FBS (Gibco, Carlsbad, CA, USA) and 1% Pen/Strep. 48 and 72 h after transfection with control siRNAs or siRNAs to knockdown targeted transcripts, cells were incubated with an equal volume of calcium-4 loading buffer (Molecular Devices, Inc., Sunnyvale, CA, USA) containing 2.5 mM probenecid at 37 °C for 30 min, followed by addition of vehicle or nicotine (dose range: 20 nM–320 μM) for another 30 min. The plates were then placed into a fluorometric imaging plate reader (Molecular Devices, Inc., Sunnyvale, CA, USA) to monitor fluorescence (λexcitation = 488 nm, λemission = 540 nm).
RT-PCR
Samples were reverse transcribed into complementary DNA with the TaqMan High Capacity cDNA Reverse Transcription kit (ThermoFisher Scientific, Carlsbad, CA, USA). Thereafter, they were processed with either the TaqMan Universal PCR kit with the rat Glp1r or Tcf7l2 gene expression assay (ThermoFisher Scientific, Carlsbad, CA, USA) or custom-made primers compatible with the Sybr Green Kit (ThermoFisher Scientific, Carlsbad, CA, USA). Controls consisted of either β-actin or Gapdh. Samples were quantified by RT–PCR (7900 Real-Time PCR system; ThermoFisher Scientific, Carlsbad, CA). All data were normalized relative to the mean housekeeping messenger RNA expression levels as an internal control. Comparison between groups was made using the method of 2−ΔΔCt.
Brain perfusion and fixation
Mice and rats were anesthetized with an isoflurane (1–3%)/oxygen vapor mixture and perfused through the ascending aorta with 0.1 M PBS, followed by 4% paraformaldehyde (PFA) in 0.1 M PBS (pH 7.4). Brains were collected, post-fixed overnight in 4% PFA in 0.1 M PBS and then cryoprotected in 30% sucrose in 0.1 M PBS (pH 7.4) for 72 h at 4°C. The cryoprotected brains were embedded in Tissue-Tek OCT compound (Finetek, Torrance, CA). 30–40 μm coronal sections were cut on a cryostat (Leica Biosystems, Wetzlar, DE) and collected directly onto slides and allowed to dry overnight at room temperature. Slides were stored at −20°C until processing.
Immunohistochemistry
40 μm sections containing the mHb from ChAT-Cre::tdTom mice were washed three times for 10 min in 0.1M PBS (pH 7.4). Subsequently, sections were incubated in 10% normal donkey serum (NDS) with 0.5% Triton X-100 in PBS for 30 min at RT. The sections were then incubated with the Tcf7l2 primary antibody (#17–10109, Millipore Sigma, MA, USA) in 10% NDS, 0.5% Triton X100 in PBS overnight at 4°C. Slides were then washed 4× 10 min with 0.1 M PBS. Immunoreactivity was probed using Alexa 488/568-conjugated donkey anti-mouse/rabbit secondary antibodies (1:1000; Molecular Probes, OR, USA) for 1 h at room temperature. The secondary antibodies were diluted in PBS-T containing 2% NDS. The slides were mounted with Fluoro-Gel containing DAPI (Electron Microscopy Sciences, PA, USA). The images were collected using a Zeiss AxioImager Z2 microscope system.
Ex vivo cAMP stimulation and measurement of cAMP levels using ELISA
Fresh habenula and IPn samples were micro-dissected from Tcf7l2WT and Tcf7l2mut rats. The tissue samples from two animals were pooled together for one experimental replicate. A total of 3 experimental replicates per condition were used. Tissue was lightly homogenized with a motorized tissue grinder in 40 μl phosphate buffered saline. To stimulate cAMP production in tissue homogenates, 5 μl of vehicle (PBS) or 1 mg/ml Ex-4 (final concentration 100 μM) was spiked into the tube. Samples were briefly mixed and incubated for 30 min at 30°C. 5 μl of 1 M HCl was added to stop the reaction and lyse the tissue. Samples were stored at −80°C until use. When thawed, samples were centrifuged at 13,000 x g for 10 min at 4°C. The concentration of cAMP in the supernatant obtained from the rat habenula and IPN extracts was measured using the cAMP Direct Immunoassay Kit (Biovision Inc, Milpitas, CA, USA) per the manufacturer’s instructions.
Ex vivo assessment of cAMP signaling using luciferase imaging
On the day of each experiment, Tcf7l2WT and Tcf7l2mut rats that received intra-mHb injections with a lentivirus to express the pGF-CREB-mCMV-dscGFP-P2A-luciferase reporter were injected with luciferin (150 mg/kg IP) dissolved in sterile 0.9% saline (25 mg/mL). 20 min later, rats were lightly anesthetized with isoflurane, decapitated and brains rapidly dissected on ice. Coronal slices (~1.5 mm; 2–3 in total) were collected from each animal to include the full extent of the mHb. Slices were transferred to a 6-well plate and placed in a solution of 2–2.5 mL of oxygenated aCSF. All imaging was performed using the IVIS Spectrum imaging module from Caliper Life Sciences, with the manufacturer-provided Living Image software set to the following parameters: 4 min exposure length, medium binning, luminescent F/Stop set at 1, excitation filter blocked, and the emission filter open. 6-well plates with slices were placed in the IVIS and situated in the middle of the imaging grid with the stage temperature set to 37° C. Imaging experiments began following an addition of luciferin (at a concentration of 0.3 mg/mL) to characterize “baseline” luminance. To stimulate CREB activity, Ex-4 (final concentration of 250 nM) was then added to the bath and reads were collected every 5 minutes over the next 35 minutes. An ROI was manually drawn around the mHb in each sample, with the size of the ROI kept constant across all slices analyzed. A total of 6 ROIs from Tcf7l2WT rats (from 3 animals) and 7 from Tcf7l2mutrats (from 4 animals) were used for statistical comparison. Luminance was assessed over 35 min following bath application of Ex-4 (250 nM).
BAT-GAL transgenic mice and LacZ staining
Adult (10–12 weeks old) BAT-GAL transgenic were purchased from Jackson laboratories. The transgene expresses the lacZ gene under the control of a regulatory sequence consisting of seven consensus Tcf7l2-binding motifs upstream of the Xenopus siamois gene minimal promoter. Transgenic mice display β-galactosidase activity in the presence of active transcription factor binding. Mice were perfused with 2% PFA in PBS and brains post-fixed in 2% PFA in PBS containing 2 mM MgCl2. and 2 mM EGTA for 1 hr at 4°C. Brains were washed in wash buffer (0.1M PBS, 2mM MgCl2) 3 × 15 min. Then, brains were cryoprotected in 15% followed by 30% sucrose in wash buffer. The cryoprotected brains were embedded in Tissue-Tek OCT compound (Finetek, Torrance, CA, USA). 20 μm coronal sections containing the habenula were collected directly onto slides and dried overnight at room temperature. Slides were washed in wash buffer 10 mins on ice. Slices were then washed in LacZ buffer (0.1M PBS, 2mM MgCl2, 0.01% sodium deoxycholate, 0.02% NP-40). Slides were placed in a humidified chamber and 200 μl LacZ stain (0.1M PBS, 2mM MgCl2, 0.01% sodium deoxycholate, 0.02% NP-40, 5 mM potassium ferricyanide, 5 mM potassium ferrocyanide) was applied to each slide. Slides were placed at 37°C for 2–3 hours. After incubation, slides were washed in wash buffer 2 × 5 min followed by a finally wash in dH20 1 × 5 min. Tissue was counterstained with Nuclear Fast Red (Vector Laboratories, Burlingame, CA). Finally, slides were dehydrated through a methanol series (1 × 5 min each 50%, 70% and 100%), cleared in xylene 2 × 5 min, and mounted with Permount (Fisher Scientific, Waltham, MA, USA). Images of beta-galactosidase staining were obtained by brightfield microscopy.
86Rb+ Efflux
86RbCl (average initial specific activity 15 Ci mg−1) and Optiphase Supermix scintillation cocktail were purchased (Perkin-Elmer NEN, Waltham, MA, USA). To obtain crude synaptosomal preparations of habenula and IPn, fresh tissue was microdissected and prepared as previously described 3. Samples were loaded with 86Rb+ and acetylcholine-stimulated 86Rb+ efflux was measured, with each sample stimulated only once; see Ref. 3. 86Rb+ efflux was expressed as the increase in signal above basal efflux. A nonlinear least-squares curve fit to a first-order equation (Ct = C0 × e−kt), where Ct is the basal efflux counts at time t, C0 is the estimated efflux counts at t = 0 s, and k is the first-order decay constant) was used to estimate basal efflux for each sample. Counts in fractions preceding and following the peak were used for curve fitting. Acetylcholine-stimulated efflux was calculated by summing the counts in the fractions exceeding basal efflux during acetylcholine exposure and dividing by the corresponding basal efflux counts. This value represents total peak relative to baseline.
Brain slice preparation for physiology recordings
3–6 month old male and female Tcf7l2WT and Tcf7l2mut rats were used for all electrophysiology experiments. Rats were anesthetized with isoflurane followed by transcardial perfusion with oxygenated (95% O2/5% CO2) N-methyl-D-glucamine (NMDG) HPEPS solution (in mM: 92 NMDG, 2.5 KCl, 1.2 NaH2PO4, 30 NaHCO3, 20 HEPES, 25 glucose, 5 Na+ ascorbate, 2 thiourea, 3 Na+ pyruvate, 10 MgSO4 7H2O, 0.5 CaCl2, 2 H2O, with pH adjusted to 7.3– 7.4, 300 –310 mOsm). The brain was quickly removed into ice-cold NMDG HEPES solution for 1 min. For nAChR desensitization studies, 300-μm-thick coronal slices containing MHb were cut with a vibratome (Leica VT1200S, Germany). For studies involving measurement of sEPSCs in IPN, a custom brain block was used to cut the brain at a ~55º angle prior to collecting 300–350-μm-thick angled coronal slices containing intact mHb-Fr-IPN circuitry cut by a vibratome. Slices were then incubated at 32 °C for 25–35 min, then kept at room temperature for at least 1 h, in the following solution: 95% O2/5% CO2-equilibrated HEPES-holding-solution containing the following (in mM) 92 NaCl, 2.5 KCl, 1.2 NaH2PO4, 30 NaHCO3, 20 HEPES, 25 glucose, 5 Na+ ascorbate, 2 thiourea, 3 Na+ pyruvate, 2 MgSO4 7H2O, and 2 CaCl2, 2 H2O.
Voltage-clamp electrophysiology
Recordings were made under an upright microscope (Scientifica SliceScope Pro 2000, Scientifica, UK) equipped with infrared differential interference contrast optics for visualization. Slices were transferred to a recording chamber superfused with standard recording ACSF containing (in mM) 124 NaCl, 2.5 KCl, 1.2 NaH2PO4, 24 NaHCO3, 5 HEPES, 12.5 glucose, 2 MgSO4 7H2O and 2 CaCl2 2H2O, adjusted to pH 7.3–7.4, 295 – 305 mOsm. Recordings were performed at 32°C. Patch pipettes were made from borosilicate glass capillary tubing (1B150F-4; World Precision Instruments) using a micropipette puller (PC-10; Narishige, Japan).
For nAChR desensitization studies, the internal recording pipette solution was potassium-based and contained the following (in mM): K+ gluconate 130, KCl 4, EGTA 0.3, HEPES 10, MgATP 4, Na2GTP 0.3, Phosphocreatine 10; pH adjusted to 7.3 with KOH while the external solution was ACSF +0.5 μM TTX+ 100 μM picrotoxin, + 5 μM NBQX+ 50 μM APV. nAChR currents were recorded from the soma of MHb neurons using a Multiclamp 700B or an Axopatch 200B amplifier with a DigiData 1550 interface and Clampex 10.3 software (Molecular Devices) sampled at 5 kHz and low-pass filtered at 1 kHz. Voltage was held at −60 mV (Vhold = −60 mV). A baseline nAChR current was recorded for 3 min. For drug application, a 30 μM nicotine-filled glass pipette, identical to a typical recording pipette, was connected to a micropressure ejection system (PICOSPRTIZER®III, Parker, USA). Ejection pipettes were moved to within 20 – 40 μm of the recorded cell using a manipulator, drug was applied for 0.1 Hz. For the induction of nAChR desensitization, the frequency of drug application was changed to 1 Hz for 60 sec. After the induction, the frequency was returned to 0.1 Hz and nAChR were continuously measured for another 10 min.
For sEPSCs (sEPSCs) measurements in the IPn, the internal recording pipette solution was potassium-based contained the following (in mM): K+ gluconate 130, KCl 4, EGTA 0.3, HEPES 10, MgATP 4, Na2GTP 0.3, Phosphocreatine 10; pH adjusted to 7.3 with KOH while the external solution was ACSF + 100 μM picrotoxin. sEPSCs were recorded from the IPn neurons using a Multiclamp 700B amplifier with a DigiData 1500 interface and Clampex 10.3 software (Molecular Devices) sampled at 5 kHz and low-pass filtered at 1 kHz. Voltage was held at −70 mV (Vhold = −70 mV). A baseline sEPSCs was recorded for 5 min. For drug application, a 50 μM nicotine was locally applied to ventral MHb by gravity using nicotine-filled glass pipette (~200 μm) and was sucked by a local suction glass pipette (~200 μm) that was positioned to outside of MHb. The local suction pipette prevented the diffusion of nicotine to the recording site in the IPn. Local perfusion pipettes were moved to within 100 – 200 μm of the brain slice surface using a manipulator, drug was applied continuously for 5 min with a local suction pipette and sEPSCs were continuously measured for another 5 min.
Functional Magnetic Resonance Imaging
Rats were prepared with a tail vein catheter immediately before being placed in the scanner. Rats were anesthetized with medetomidine. First, the animal was anesthetized using isoflurane anesthesia (3% induction and 1.5% maintenance). Then a bolus of 0.05mg/kg medetomindine was administered subcutaneously. Isoflurane was discontinued 5 min after the bolus administration. Medetomidine was then infused (0.1 mg kg−1 per h) via the tail vein catheter to maintain sedation. All rats were imaged on a heated bed and respiration was monitored continuously until the end of the scan. After anesthesia was established, fMRI acquisition began. All imaging was performed using a Bruker Biospec 70/30 7 Tesla scanner with a B-GA12S gradient insert (gradient strength 440 mT/m and slew rate 3444 T/m/s). A Bruker 4 Channel rat brain phased array was used for all data acquisition in conjunction with a Bruker volume transmit 86 mm coil. After a three plane localizer, three short anatomical T2 scans were acquired for the purpose of anatomical localization and co-registration. Functional scans were acquired with a GE-EPI protocol with the following parameters: TR = 3000 ms, TE = 15 ms, flip angle = 70°, field of view = 25.6 mm × 25.6 mm, matrix size = 80 × 80, in-plane resolution = 320 μm × 320 μm, number of slices = 38, slice thickness = 0.7 mm, slice gap = 0 mm, number of volumes = 800, and dummy scans = 4. The total scanning time for the fMRI experiment was 40 mins. After 20 minutes of acquisition, rats were injected with CNO (1mg kg−1 ) intravenously and data acquisition continued for another 20 min for a 40 min scanning session in total.
RNA-Seq and differential analysis
RNA-Seq data generated from Illumina HiSeq 2500 were processed following an open source pipeline 42. A total of n=9 rats of each genotype (Tcf7l2WT and Tcf7l2mut) were used. RNA libraries for each brain region were generated from pooled RNA from three animals per group. Briefly, the paired-end sequencing reads were aligned to the human genome (version hg19) and rat genome (version rn6), using the Spliced Transcripts Alignment to a (STAR) 43. Next, featureCount 44 was employed to assign aligned reads to genes. Count per Million (CPM) was used as the expression quantification method. The CPM matrix was log2 transformed and Z-score scaled to center the expression values of each gene to 0 with a standard deviation of 1 before performing Principal Component Analysis (PCA) and Hierarchical Clustering (HC). The Characteristic Direction 45 was used to identify differentially expressed (DE) genes between the Tcf7l2mut and Tcf7l2WT samples. Enrichment analyses for DE genes were performed using Enrichr 46,47. RNA-Seq data generated from TRAP were processed and analyzed as previously described 16,17.
Tcf7l2 sgRNA synthesis and validation
Five sgRNA sequences that targeted all known 17 murine transcript variants of Tcf7l2 were designed and synthesized utilizing S. pyogenes Cas9 protospacer adjacent motif (PAM) sites. Off-target cleavage was bioinformatically assessed utilizing http://crispor.tefor.net. sgRNAs were synthesized via PCR with loci-specific primers followed by T7 in vitro transcription, purification and quantitation using the GeneArt Precision sgRNA Synthesis Kit from ThermoFisher (Cat no. A29377). The N2a neuroblastoma cells at 60% confluency were transfected, via Lipofectamine MessengerMAX Transfection Reagent, with Cas9 (0.5 μg) and sgRNA (125 ng) in triplicate. Cells were incubated for 48 h, lysed and PCR carried out using target-specific primers. The PCR strands were re-annealed and mismatches digested. Mismatches were quantified using a T7 endonuclease-based mismatch assay (ThermoFisher Cat no. A24372). The sgRNA with the greatest cleavage efficiency for Tcf7l2, and the fewest predicted off-targets, was selected for in vivo testing; sequence: GTGTACCCAATCACGACAGG AGG. The predicted off targets of this sgRNA were intergenic only. The selected Tcf7l2 sgRNA was cloned into an AAV plasmid (AAV:ITR-U6-sgRNA(backbone)-pCBh-Cre-WPRE-hGHpA-ITR) (Addgene plasmid # 60229). The sgRNA backbone was replaced with the sgRNA sequence for Tcf7l2 or eGFP to serve as a control vector; sequence: GAGCTGGACGGCGACGTAAA CGG. The Cre recombinase cassette in the plasmid was replaced with dTomato by Vector Biolabs. The plasmids were packaged into infectious particles with a titer greater than 1.0 × 10¹³ and aliquoted into 5 μl volumes and stored at −80 °C until use. The AAV carrying the sgRNA for Tcf7l2 was validated by viral transduction with AAV-CMV-spCas9 (Vector Biolabs, PA, USA) in N2a cells. Fluorophore abundance, mRNA knockdown, and genomic cleavage efficiency were assessed in vitro prior to infection. To confirm in vivo cleavage of Tcf7l2, Rosa26LSL-spCas9-eGFP mice were killed by cervical dislocation, their brains removed and frozen immediately in methylbutane on dry ice. The mHb was dissected using a 1.0 mm punch on the cryostat. Genomic DNA from the mHb was extracted using Purelink genomic DNA kit (catalogue number: k1820–01) from Thermofisher Scientific (Carlsbad, CA, USA). Primers were designed to surround the CRISPR cut site. F: AGCTTACTGTACGGCGAGAAC and R:TGTCTAGGTGAGTCGCTGTG. DNA amplicons were generated by PCR. The PCR product was purified using Qiagen PCR purification kit (Hilden, Germany, catalogue number: 28104). DNA amplicons were sequenced using EZ amplicon sequencing (Genewiz, South Plainfield, NJ, USA) and the percentage of indels calculated.
Cannula implantation and intracranial microinjection
For CRISPR-mediated cleavage of Tcf7l2, AAV2-hSYN1-iCre-WPRE and AAV 1-U6-sgRNA (Tcf7l2)-pCBh-dTomato-WPRE-hGHpA-ITR or AAV 1-U6-sgRNA (eGFP)-pCBh-dTomato-WPRE-hGHpA-ITR were locally infused into the mHb of male Rosa26LSL-spCas9-eGFP mice. The coordinates from bregma were: AP: −1.55, ML: 1.65, from dura DV: −2.9 – −3.1, at an angle of 32°. The incubation period was 3 months before behavior commenced. mRNA levels (Thermo Fisher Taqman probe: Mm01258049_m1) and genomic cleavage (Thermo Fisher Cat no. A24372) were quantified to ensure effective genomic editing of Tcf7l2. For intra-mHb siRNA injections in rats, three pooled siRNAs (ON-TARGETplus siRNA, GE Healthcare Bio-Sciences, Pittsburgh, PA, USA; LQ-107966) were purchased and diluted to 1 mg/ml with nuclease-free water. To deliver siRNA to the mHb, we utilized the jetSI 10 mM reagent (Polyplus-transfection, Illkirch, FR) and followed the manufacturer’s directions with some minor modifications. To prepare siRNA duplexes for in vivo delivery, 2.5 μl 1,2-dioleoyl-sn-glycero-3-phosphoethanolamine (DOPE; Sigma-Aldrich, St. Louis, MO, USA) was added to 10 μl jetSI 10 mM. To this, 7.5 μl of 100% molecular-grade ethanol (Sigma-Aldrich, St. Louis, MO, USA) was added to create Reagent B. 3 μl of Reagent B was added to 7.5 μl filter-sterilized 25% glucose and 27 μl nuclease-free water to create Reagent C. Reagent C was vortexed vigorously and incubated at room temperature for 10 min. Separately, the siRNA tube was prepared. To this tube, 2.8 μl of siRNA (control or Tcf7l2), 1.25 μl 25% filter-sterilized glucose and 2.2 μl nuclease-free water were added for a total volume of 6.25 μl and vortexed gently. 6.25 μl of Reagent C was added to the siRNA tube preparation and immediately vortexed for 10 sec. The mixture was incubated for 30 mins at room temperature to allow siRNA duplex formation. After this incubation, the prepared solution was injected into animals within 30 min. 1 μl (~0.22 μg μl−1) of siRNA duplex was infused through bilateral cannulae-injector system (PlasticsOne, Wallingford, CT, USA) directed toward the mHb as described above. To knock down Glp1r transcripts in mHb, rats were anesthetized with an isoflurane (1–3%)/oxygen vapor mixture and positioned in a stereotaxic frame (Kopf Instruments, Tujunga, CA, USA). The incisor bar was set to the ‘flat-skull’ position. Rats were injected with AAV1-sh-Glp1r-GFP or AAV1-GFP virus particles (titer = ~5 × 10¹²) according to the following stereotaxic coordinates: For bilateral mHb injections; flat skull, 10° angle toward midline; AP: 3.2 mm from bregma; ML: ±1.35 mm from midline; DV: −5.3 mm from skull surface. During microinjections, the injector needles extended into mHb and virus particles were administered in a volume of 0.3 μl and at a rate of 0.1 μl per minute. The injector needle remained in place for 2 min after injection. Animals were allowed to recover for at least 72 h, during which time they were administered post-surgery antibiotic and analgesic. For intra-MHb drug infusions, guide cannulae (PlasticsOne, Wallingford, CT, USA) were implanted as follows: flat skull; 10° angle toward midline; AP: −3.2 mm from bregma; ML: ±1.4 mm from midline; DV: −3.3 mm from skull surface. Guide cannulae were encased in dental acrylic to attach to the skull surface and hold in place. Animals were allowed to recover for at least 72 hr, during which time they were administered post-surgery antibiotic and analgesic. During microinjections, the injector system (PlasticsOne, Wallingford, CT, USA) was designed to extend 2 mm below the tip of the cannula for placement into the MHb. Here, Ex-4 (or vehicle) was administered in a volume of 0.5 μl and at a rate of 0.333 μl per min. The injector needle remained in place for a minimum of 2 min after injection to allow for diffusion and to prevent backflow into the cannulae. Ex-4 was dissolved in sterile, 0.1M PBS. For intra-IPn drug infusions (Dkk1 and XAV939), rats were anesthetized with an isoflurane (1–3%)/oxygen vapor mixture and guide cannulae (PlasticsOne, Wallingford, CT, USA) were implanted as follows: flat skull; 10° angle toward midline; AP: −5.2 mm from bregma; ML: +1.5 mm from midline; DV: −7.2 mm from skull surface. Guide cannula were encased in dental acrylic to attach to the skull surface and hold in place. Animals were allowed to recover for at least 72 h, during which time they were administered post-surgery antibiotic and analgesic. During microinjections of Dkk1 and XAV939, the injector needles were designed to extend 2 mm below the tip of the cannula for placement into the IPn and drug was administered in a volume of 0.5 μl and at a rate of 0.333 μl per min 30 min before the start of the experiment (100 ng/uL Dkk1 and 10ug/uL XAV939). The injector needle remained in place for a minimum of 2 min after injection to allow for diffusion and to prevent backflow into the cannula. All drugs were all dissolved in 0.1 M PBS unless otherwise noted. For ex vivo CREB luciferase imaging, Tcf7l2WT and Tcf7l2mut male rats were anesthetized with 1–3% isoflurane and positioned in a stereotaxic frame (Kopf Instruments). Each rat received a bilateral injection of the CREB-reporter (PGF1-CREB; 300nL) virus targeting the medial habenula (coordinates from bregma: AP: −3.6 mm from; ML, ± 1.2; DV, −4.5 mm from the surface of the brain. The injector was set at 10° from midline). Animals were permitted at least four weeks to recover and allow time for reporter expression prior to ex vivo imaging experiments.
Open field
Rats were placed in an 80 × 80 cm Plexiglas chamber, and distance traveled was measured by live automated tracking using an overhead CCD camera and Ethovision software (Noldus Information Technology, Leesburg, VA). Sessions were 60 minutes long, and all testing was performed during the animals’ active/dark phase under red light. Rats were first tested naïve to the open field. On each successive day, 15 minutes prior to testing they were injected subcutaneously with saline (days 1, 2, 6, 7) or 0.4 mg/kg nicotine (days 3, 4, 5). One cohort of animals was tested before and one cohort was tested after undergoing nicotine intravenous self-administration.
Intravenous nicotine self-administration
Mice and rats were mildly food restricted to 85–90% of their free-feeding body weight and trained to press a lever in an operant chamber (Med Associates, St. Albans, VT) for food pellets (20 mg pellets mice; 45 mg food pellets rats; TestDiet, Richmond, IN) under a fixed-ratio 5, time out 20 sec (FR5TO20 sec) schedule of reinforcement prior to catheter implantation. Once stable responding was achieved (>20 pellets per session in mice; >50 pellets per session in rats), subjects were catheterized as described above. The animals were allowed at least 48 h to recover from surgery, then permitted to respond for food reinforcement again under the FR5TO20 sec schedule. Once food responding criteria was reestablished, subjects were permitted to acquire intravenous nicotine self-administration by autoshaping during 1 h daily sessions, 7 days per week. Nicotine was delivered through the tubing into the intravenous catheter by a Razel syringe pump (Med Associates). Each nicotine self-administration session was performed using 2 retractable levers (1 active, 1 inactive) that extend 1 cm into the chamber. Completion of the response criteria on the active lever resulted in the delivery of an intravenous nicotine infusion (0.03 ml infusion volume for mice; 0.1 ml for rats). Responses on the inactive lever were recorded but had no scheduled consequences. For dose-response studies (fixed and progressive ratio schedules), animals were presented with each dose of nicotine for at least 3 days; the mean intake over the last 2 sessions for each dose was calculated and used for statistical analysis. Nicotine doses were presented according to a within-subjects Latin square design. In between each dose, subjects were placed back on the training dose for at least 2 days or until their intake returned to baseline levels before being tested on the next dose in the Latin-square design.
Blood sampling and collection
For blood glucose sampling (self-administration, oral glucose and fasting experiments), the Contour Blood Glucose Monitoring System (Bayer HealthCare LLC, Mishawaka, IN, USA) including meter and testing strips was used. The site of blood collection (end of the tail) was sterilized with 70% ethanol. A small blood sample, ~0.5 μl, was obtained by nicking the tail vein with a 22-gauge needle. After blood sampling, the site was cleaned with 70% ethanol. For ELISAs, the end of the tail was sterilized with 70% ethanol and nicked with a razor blade and ~300 μl blood was collected in tubes containing EDTA (RAM Scientific, Nashville, TN, USA) and 500 KIU/ml aprotinin (Sigma-Aldrich, St. Louis, MO, USA). To obtain serum, blood samples were allowed to clot for 30 min on a rocker, spun at 1,000 x g at 4°C for 10 min and aliquoted into separate tubes. Samples that displayed significant hemolysis were excluded from analysis. Samples were stored at −80 °C until processing.
Retrograde tracing with pRV-GFP
We used retrograde neuronal tracer pseudorabies virus expressing green fluorescent protein (pRV-GFP) to identify CNS regions innervating pancreas. Stock of pRV-152 encoding GFP210 was prepared to concentrations of 3.4 × 10⁸ pfu ml−1 and stored at −80 °C until use. Injection of pRV-152 (~500 nl) was performed in anesthetized mice over 30 sec using a Hamilton syringe fitted with a 30G1/2 needle, with the needle was left in place for 1 min after injection to allow for diffusion.
Fasting blood sugar test
Rats were food restricted for 4 or 16 h, with water maintained ad libitum. To sample fasting blood sugar levels, a small blood sample was obtained as described above.
Oral glucose tolerance test (OGTT)
Prior to the OGTT, rats were food restricted for 16 h, with water ad libitum. A baseline blood sample was obtained at the end of the fasting period, as described above. A bolus of glucose (1 g kg-1; 40% glucose solution, in water) was administered to rats by oral gavage. Blood sugar was sampled at 30, 60 and 120 min following the glucose bolus.
Measurements of circulating glucagon and insulin
Blood collection was performed as described above. Levels of glucagon and insulin were measured from serum using the Mouse/Rat Total Active Insulin/Glucagon Multi-Spot Assay System with a Sector Imager 2400 (Meso Scale Discovery, MD, USA) per the manufacturer’s instructions.
Statistical analyses
Animal sample size was justified by previously published data or preliminary experiments. Data distribution was assumed to be normal, but this was not formally tested. All experiments animals with the same genotype were randomly allocated to experimental groups. For self-administration experiments, animals that did not achieve stable levels of intake (<20% variation in intake across three consecutive days) or that took less than <5 nicotine infusions on average across sessions were excluded from experiments. Male and female Tcf7l2WT and Tcf7l2mut rats were used in nicotine self-administration experiment. All data were analyzed two-sided t-test or by one-, two- or three-way analysis of variance (ANOVA) as appropriate using GraphPad Prism software (La Jolla, CA, USA). Significant main or interaction effects were followed by Bonferroni post hoc tests as appropriate. The criterion for significance was set at P < 0.05. For all electrophysiological data, results are shown as the mean ± s.e.m.
Extended Data
Extended data 1. Generation of Tcf7l2 mutant rats.
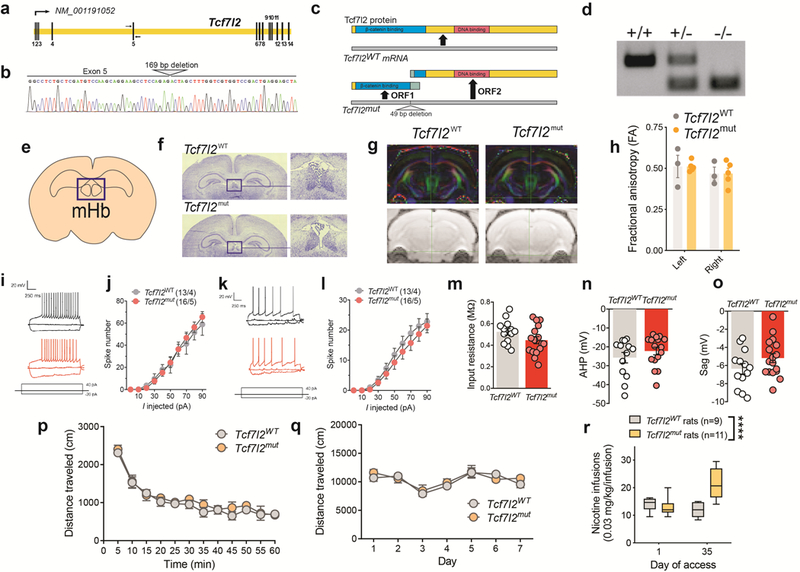
a, Schematic of the Rattus norvegicus Tcf7l2 gene. Exons are spliced to generate Tcf7l2 mRNA (NCBI Reference Sequence: NM_001191052.1). Primers for genotyping and Sanger sequencing are indicated by arrows flanking exon 5. b, Sequencing chromatograph of the Tcf7l2 mutant allele. The site of the 169 bp deletion from exon 5 and the following intron is labelled. c, Illustration of Tcf7l2 wild-type protein, containing an N-terminal β-catenin binding domain (blue) and C-terminal DNA binding domain (red). Predicted open reading frames and truncated proteins generated from the Tcf7l2 mutant mRNA. Green regions on predicted truncated proteins denote ectopic amino acid sequences not found in wild-type Tcf7l2 protein. d, Genotyping of Tcf7l2WT and Tcf7l2mut rats: wildtype animal (+/+) with single band at 304 bp; heterozygous animal (+/−) with bands at 304 and 144 bp; and mutant animal (−/−) with a single band at 144 bp. Image is representative of genotyping results obtained for Tcf7l2WT and Tcf7l2mut rats used each experiment. e, Graphical representation of mHb in coronal slice of rat brain. Image adapted from the Allen Brain Reference Atlas. f, Nissl staining showed similar mHb volumes in Tc7l2WT and Tcf7l2mut rats. Image is representative of results obtained in 3 biologically independent animals from each genotype. g, Diffusion tensor imaging (DTI) tractography of the fasciculus retroflexus in Tcf7l2WT (n=3) and Tcf7l2mut (n=5) rats. h, Fractional anisotropy (FA) (± s.e.m.) showed bilateral similar integrity (left and right sides) of the fasciculus retroflexus in Tcf7l2WT (n=3) and Tcf7l2mut (n=5) rats; Genotype: F (1, 6)=0.000003; P=0.99; Brain side: F (1, 6) = 2.562, p=0.16; Genotype x Brain side: F (1, 6) = 0.0007, p=0.98. i, The frequency at different steps of positive current used to calculate the slope of the input-output curve from dorsal mHb neurons. Example traces showing typical current steps at −20, 0 and 40 pA in dorsal mHb neurons from Tcf7l2WT, and Tcf7l2mut rats. j, Input-output curve (mean ± s.e.m.) in dorsal mHb neurons from Tcf7l2WT, and Tcf7l2mut (n=16 cells from 5 rats) rats. k, The frequency at different steps of positive current used to calculate the slope of the input-output curve from ventral mHb neurons. l, Input-output curve (mean ± s.e.m.) in ventral mHb neurons from Tcf7l2WT and Tcf7l2mut (n=16/5) rats. m, Input resistance (mean ± s.e.m.) from mHb neurons from Tcf7l2WT (13 cells from 4 rats) and Tcf7l2mut (16/5) rats; p=0.1036, unpaired two-tailed t-test. n, Afterhyperpolarization (mean ± s.e.m.) in mHb neurons from Tcf7l2WT (13/4) and Tcf7l2mut (16/5) rats; P=0.3043, unpaired two-tailed t-test. o, Sag current (mean ± s.e.m.) in mHb neurons Tcf7l2WT (13/4) and Tcf7l2mut (17/5) rats; p=0.1386, unpaired two-tailed t-test. p, Total distance traveled (mean ± s.e.m.) by drug-naive Tcf7l2WT (n=6) and Tcf7l2mut (n=5) rats during a 60 min session. q, Total distance traveled (mean ± s.e.m.) by Tcf7l2WT (n=6) and Tcf7l2mut (n=5) rats after daily saline or nicotine (0.4 mg kg−1) injections (15 min pretreatment time). r, Responding for the training dose of nicotine (0.03 mg/kg/inf) (mean ± s.e.m.) was assessed in a group of Tcf7l2WT (n=9) and Tcf7l2mut (n=11) rats on day 1 and day 35 of access. Nicotine responding was similar between the of Tcf7l2WT and Tcf7l2mut rats on day 1 of access, but Tcf7l2mut rats escalated their intake such that such that there responding was higher that on day 35 compared with Tcf7l2WT rats, and compared with their own intake on day 1 (F(1, 18) = 30.8, ****p<0.0001, interaction effect between Genotype and Session in two-way ANOVA). Box plot shows min-max range.
Extended data 2. CRISPR cleavage of Tcf7l2.
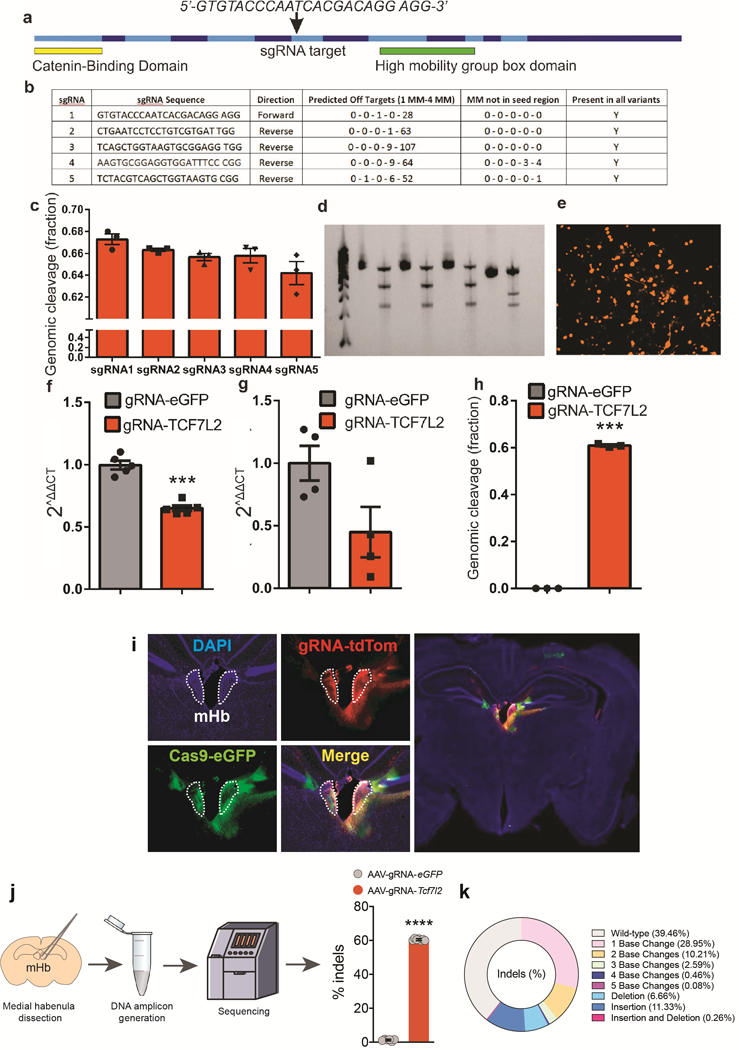
a, Exon diagram of mouse Tcf7l2 with the two pertinent domains highlighted and the sgRNA targeting locus. b, Bioinformatic comparison of the 5 different sgRNAs tested against Tcf7l2. MM = mismatches. c, Genomic cleavage percentage (mean ± s.e.m.) in N2A cells of the 5 sgRNAs targeted against Tcf7l2. Data represent n=3 biologically independent samples. d, T7-endonuclease-based assay illustrating intact PCR and cleaved bands of Tcf7l2 via CRISPR gene editing. Observations are from a single experiment. e, dTomato expression in N2A cells 48 h following transduction of the AAV carrying sgRNA against Tcf7l2 (AAV:ITR-U6-sgRNA(Tcf7l2)-pCBh-dTomato-WPRE-hGHpA-ITR). Data are representative of three biologically independent samples. f, Relative expression of Tcf7l2 transcripts (mean ± s.e.m.) in the N2A cells transfected with (AAV:ITR-U6-sgRNA(Tcf7l2 or eGFP)-pCBh-dTomato-WPRE-hGHpA-ITR) and AAV-CMV-spCas9 (Vector Biolabs, PA, USA). ***P<0.001, unpaired two-tailed t-test. Data represent n=5 biologically independent samples for each gRNA. g, Relative mRNA expression of habenular Tcf7l2 (mean ± s.e.m.) 6 weeks after viral stereotaxic injections of AAV:ITR-U6-sgRNA(eGFP or Tcf7l2)-pCBh-dTomato-WPRE-hGHpA-ITR or AAV2-hSyn1-WPRE-iCre into the mHb of Rosa26LSL-spCas9-eGFP mice. Data represent n=4 biologically independent samples for each gRNA. h, In vivo estimation of genomic cleavage of habenular Tcf7l2 (mean ± s.e.m.) 6 weeks following viral stereotaxic injection of AAV:ITR-U6-sgRNA(eGFP or Tcf7l2)-pCBh-dTomato-WPRE-hGHpA-ITR and AAV2-hSyn1-WPRE-iCre in Rosa26LSL-spCas9-eGFP mice. Genomic cleavage efficiency was estimated by average re-annealed mismatches in a T7 endonuclease assay. ***P<0.001, unpaired two-tailed t-test. Data represent n=3 biologically independent animals for each gRNA. i, Left panels: Representative DAPI-counterstained brain slice showing Cas9-eGFP (green) and Tcf7l2-gRNA (red) targeted to the mHb of LSL-spCas9-eGFP mice. Right panel: Whole image of brain slice from which left panels are derived. Representative result from n=3 mice. j, Medial habenula from Rosa26LSL-spCas9-eGFP mice injected with AAV-sgRNA-eGFP (n=6 independent mice) or AAV-sgRNA-Tcf7l2 (n=7 independent mice) was dissected and DNA amplicons of targeted region of Tcf7l2 sequenced. Percentage of indels (± s.e.m.) detected in the targeted region of Tcf7l2 is shown. ****P<0.0001, unpaired two-tailed t-test. Coronal brain image adapted from the Allen Brain Reference Atlas. k, Donut graph showing Cas9-induced modifications to Tcf7l2 in mHb of Rosa26LSL-spCas9-eGFP mice treated with AAV-sgRNA-Tcf7l2 (percental of total amplicons sequenced). A total of 13 amplicons (n=6 from AAV-sgRNA-eGFP-treated mice and n=7 from AAV-sgRNA-Tcf7l2-treated mice) were sequenced.
Extended data 3. Mechanism by which Tcf7l2 regulates nAChR function.
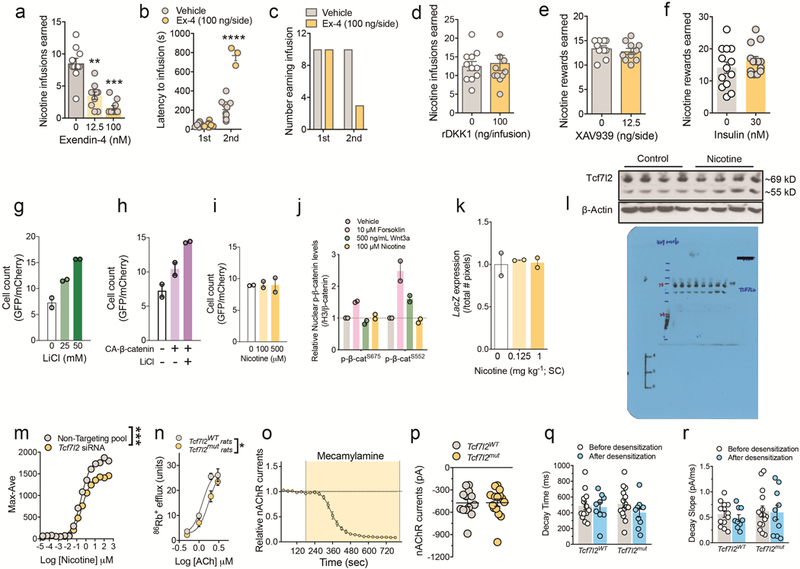
a, Effects of intra-mHb infusion of vehicle or Ex-4 (12.5, 100 nM) on nicotine intake (mean ± s.e.m.) in rats (n=10); F(1.696, 15.26) = 38.3, p<0.0001, one-way repeated measures ANOVA; **p<0.01, ***p<0.001, Bonferroni’s multiple comparisons test). b, Effects of intra-mHb infusion of vehicle or Ex-4 (100 nM) on the latency (mean ± s.e.m.) to earn the first and second nicotine infusion of a self-administration session in rats (n= 10); F (1, 29)=311.4, p<0.0001, main effect of Infusion number; F (1, 29) = 125.4, p<0.0001, main effect of Ex-4; F (1, 29) = 126.5, ****p<0.0001, interaction effect; two-way ANOVA). c, Numbers of animals (n=10 in total) that responded for the first and second nicotine infusion of a self-administration session after intra-mHb infusion of vehicle or Ex-4 (12.5, 100 nM). d, Effects of intra-mHb infusion of vehicle or rDKK1 (100 ng/side) on nicotine intake (mean ± s.e.m.) in rats (n=11); p=0.45; unpaired two-tailed t-test. e, Effects of intra-mHb infusion of vehicle or XAV939 (12.5 ng/side) on nicotine intake (mean ± s.e.m.) in rats (n=10); p=0.29; unpaired two-tailed t-test. f, Effects of intra-mHb infusion of vehicle or insulin (12.5 ng/side) on nicotine intake (mean ± s.e.m.) in rats (n=13); p=0.29; unpaired two-tailed t-test. LiCl (g) and CA-β-catenin (h), but not nicotine (i), increased the GFP relative to mCherry expression (mean ± s.e.m.) in PC12 cells transfected with the 7xTcf-eGFP//SV40-mCherry (7TGC) Tcf7l2 reporter. Data reflect results from two independent experiments. j, Levels of β-catenin phosphorylated at serine residue 675 or 552 (mean ± s.e.m.) in rat PC12 cells after forskolin, Wnt3a or nicotine treatment. Data reflect results from two independent experiments. k, LacZ expression (mean ± s.e.m.) in the mHb in the mHb of BAT-GAL β-galactosidase reporter mice after nicotine injection. Data reflect results from two independent animals in each group. l, Expression levels of Tcf7l2 (~69 kD) in the habenula were measured by Western blotting in rats that responded for intravenous nicotine infusions (0.18 mg kg−1 per infusion; n=12) or food rewards (n=12). Each lane contains pooled tissues from n=3 animals. Experiment was performed on a single occasion. For uncropped gel image, see Supplementary Figure 1. m, siRNA-mediated knockdown of Tcf7l2 attenuated intracellular calcium transients (mean ± s.e.m.) induced by nicotine (20 nM-320 μM) in HEK cells heterologously expressing α5α4β2 nAChRs. Two-way RM ANOVA; siRNA: F(1, 4)= 63.38, P<0.005; Nicotine: F(15, 60)=1388, P<0.0001; siRNA x Nicotine: F(15, 60)=20.89, ***P<0.0001; Bonferroni post hoc test after interaction effect in two-way ANOVA. Representative result from three experiments. n, 86Rb+ efflux (mean ± s.e.m.) from synaptosomes generated from IPn tissues derived from Tcf7l2WT (n=6) and Tcf7l2mut (n=6) rats. F(1,39)=4.267, *p=0.045; Shift in EC50 between genotypes using comparison of fits in a non-linear fit model. o, Pharmacologically isolated nAChR currents (normalized; ± SEM) evoked by nicotine (0.1 Hz application) in mHb neurons from wild-type rats (n=3 cells from 1 rat) were rapidly and completely blocked by bath application of mecamylamine (10 μM); F (1.335, 2.670)=332.5; P<0.001; one-way repeated measures ANOVA. p, Baseline nAChR currents (mean ± s.e.m.) in mHb neurons from Tcf7l2WT (n=13 cells/4 rats) and Tcf7l2mut (n=15 cells/4 rats) rats. P = 0.8180, unpaired two-tailed t-test. q, nAChR current decay time (mean ± s.e.m.) after nicotine stimulation (0.1 Hz) before and after nicotine (1 Hz) induced desensitization in mHb neurons from Tcf7l2WT (n=13 cells/4 rats) and Tcf7l2mut (n=9 cells/4 rats) rats; P = 0.7133, unpaired two-tailed t-test. r, Slope of nAChR current decay (mean ± s.e.m.) after nicotine stimulation (0.1 Hz) before and after nicotine (1 Hz) induced desensitization in mHb neurons from Tcf7l2WT (n=13 cells/4 rats) and Tcf7l2mut (n=9 cells/4 rats) rats; P=0.645, unpaired two-tailed t-test.
Extended data 4. Genes regulates by Tcf7l2 in the mHb.
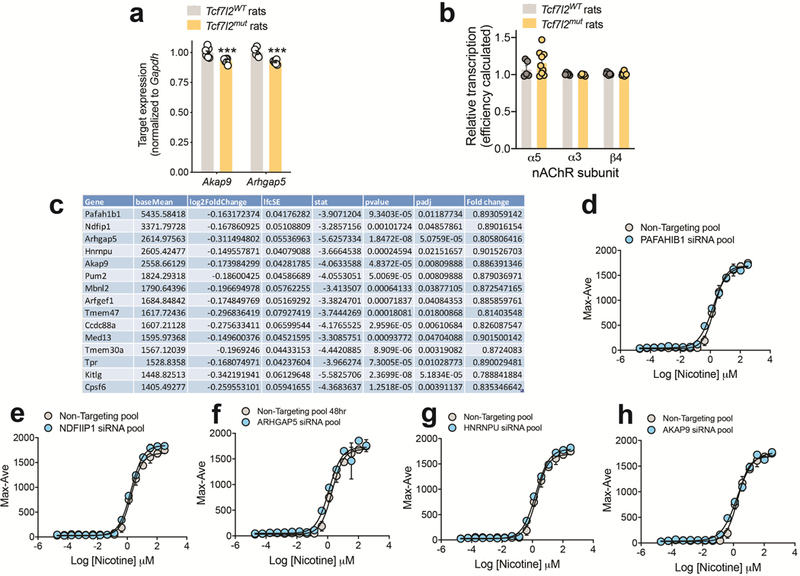
a, Quantitative real-time PCR analysis Akap9 transcript levels (mean ± s.e.m.) in the mHb of Tcf7l2WT (n=8) and Tcf7l2mut (n=7) rats; and Arhgap5 transcript levels (mean ± s.e.m.) in mHb of Tcf7l2WT (n=5) and Tcf7l2mut (n=7) rats; ***P<0.001, unpaired two-tailed t-test. b, Quantitative real-time PCR analysis of α5, α3 and β4 nAChR subunit expression (mean ± s.e.m.) in the mHb of Tcf7l2WT (n=5) and Tcf7l2mut (n=8) rats. c, Top 15 most abundantly expressed genes in the mHb of Tcf7l2WT rats that show differential downregulation in the mHb of Tcf7l2mut rats (n=9 animals per genotype). Genes are organized in descending order according to the baseline expression levels in Tcf7l2WT rats. BaseMean, mean of normalized counts for all samples; log2FoldChange, log2 fold change of down-regulated gene expression in mHb Tcf7l2mut rats compared with Tcf7l2WT rats; lfcSE, standard error of log2 fold change; stat, Wald Chi-Squared Test) of normalized counts for gene transcript in Tcf7l2mut rats versus with Tcf7l2WT rats; pval, uncorrected Wald test p value; padj, p value adjusted for multiple testing using Benjamini-Hochberg to estimate the false discovery rate. Knockdown of PAFAHIB1 (d), NDFIIP1 (e), ARHGAP5 (f), HNRNPU (g), or AKAP9 (h), mRNA transcripts using a pool of validated siRNAs had no effects on nicotine-stimulated increases in [Ca2+]I (mean ± s.e.m.) in HEK cells stably expressing α5α4β2 nAChRs. Data represent n=3 biologically independent samples.
Extended data 5. Tcf7l2 regulates cAMP signaling in PC-12 cells.
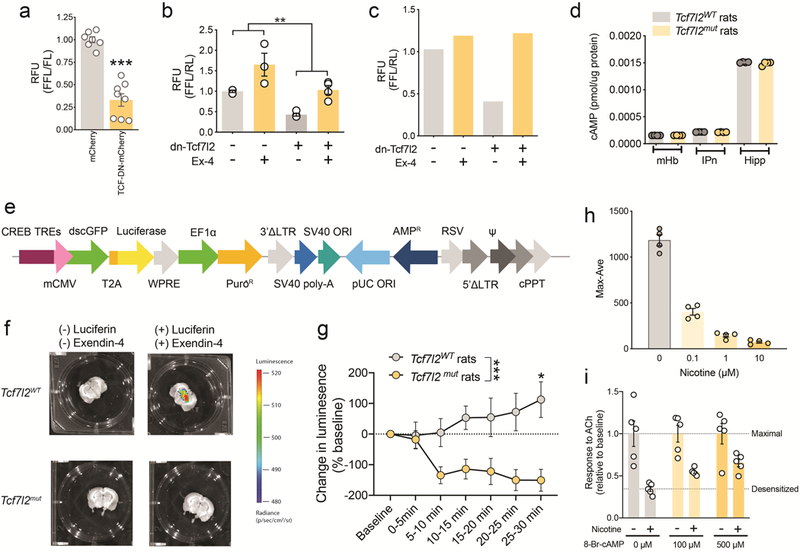
a, Expression of dnTcf7l2 in PC12 cells reduced the activity (± s.e.m.) of a cAMP-responsive luciferase reporter (EVX-1 luciferase). ***P<0.001, unpaired two-tailed t-test. Data represent biologically independent samples from cells transfected with mCherry (n=7) or dnTcf7l2 (n=8). RFU, relative fluorescent units; FFL, firefly luciferase; RL, renilla luciferase. b, dnTcf7l2 reduced baseline and Ex-4-induced increases in a cAMP-responsive reporter assay in PC-12cells; F(1, 10)=19.16, **p<0.0014, main effect of dnTcf7l2; F(1, 10) = 21.31, p=0.001, main effect of Ex-4; F(1, 10) = 0.027, p=0.87, dnTcf7l2 x Ex-4 interaction; two-way ANOVA. Data represent biologically independent samples from control cells (n=3 samples), control cells treated with exendin-4 (n=3 samples), cells transfected dnTcf7l2 (n=4 samples) and cells transfected dnTcf7l2 and treated with exendin-4 (n=4 samples). c, dn-Tcf7l2 reduced baseline and Ex-4-evoked increases in EVX-1-luciferase in INS-1 cells, an immortalized rat pancreatic β cell line that constitutively expresses GLP-1 receptors. Data represent results from a single experiment. d, cAMP content (mean ± s.e.m.) of mHb, IPn and hippocampus (hipp) were analyzed in tissues from Tcf7l2WT and Tcf7l2mut rats. Each sample contained mHb tissue from three animals, and data are from four independent samples were analyzed for a total of 12 animals per genotype. e, Vector map for the pGF-CREB-mCMV-dscGFP-P2A-luciferase (CREB reporter) lentivirus. f, Brain slices containing the mHb from Tcf7l2WT and Tcf7l2mut rats injected with CREB reporter lentivirus into mHb and injected with luciferin just before brain collection. g, Exendin-4 increased luciferase activity (mean ± s.e.m.) in mHb of Tcf7l2WT rats (n=3) but not Tcf7l2mut rats (n=4). F (1, 11) = 9.398, p=0.0107, main effect of Genotype; F (6, 66) = 7.945, ***p<0.0001, interaction effect between Genotype and Exendin-4; Two-way repeated-measures ANOVA. h, Pre-incubation (30 min) of HEK cells stably expressing α5α4β2 nAChRs with nicotine (0.1–10 μM) decreased the ability of acetylcholine (0.1 mM) to stimulate increases in [Ca2+]I (mean ± s.e.m.); F (3, 12) = 188.1, p<0.0001, main effect of Nicotine on one-way ANOVA.. Data represent n=4 independent experiment. i, 8-Br-cAMP (100–500 μM) attenuated the inhibitory effects of nicotine (0.1 μM) preincubation (30 min) on acetylcholine (0.1 mM) evoked in increases in [Ca2+]I (mean ± s.e.m.) in α5α4β2 nAChR HEK cells; F (1, 24) = 41.20, p<0.0001, main effect of cAMP in two-way ANOVA. Data represent n=5 independent experiments.
Extended data 6. Hyperglycemic actions of nicotine.
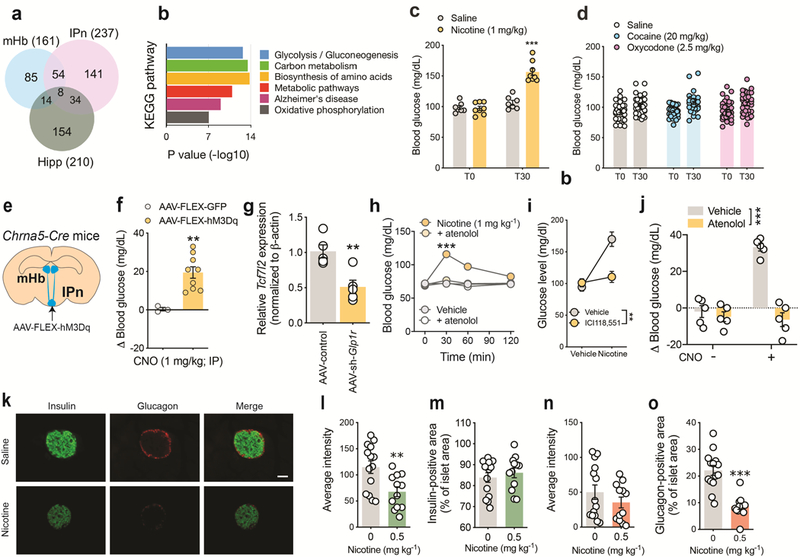
a, Venn diagram of differentially upregulated genes in the hippocampus, mHb and IPn of Tcf7l2mut rats compared with Tcf7l2WT rats. b, KEGG analysis of differentially upregulated genes identified processes relevant to glucose metabolism as those most likely to be perturbed in the mHb of Tcf7l2mut rats (n=9) compared with Tcf7l2WT rats (n=9). Fisher exact test. c, Blood glucose (mean ± s.e.m.) was measured before (T0) and 30 min after (T30) rats (n=7) were injected with saline or nicotine (1 mg kg−1); F (1, 13) = 52.3, ***p<0.0001, interaction effect between Nicotine and Time; Two-way repeated-measures ANOVA. d, Oxycodone (2.5 mg kg−1) or cocaine (20 mg kg−1) injection had no effects on blood glucose (mean ± s.e.m.) in rats (n=36). e, Chrna5-Cre mice were injected into the IPn with FLEX-GFP (n=3) or FLEX-hM3Dq-mCherry (n=9). Image adapted from the Allen Brain Reference Atlas. f, Blood glucose (mean ± s.e.m.) was measured in both groups of mice before and 30 min after injection of CNO (1 mg kg−1); **P<0.0051, unpaired two-tailed t-test. g, Tcf7l2 mRNA levels (mean ± s.e.m.) were reduced in the mHb of rats after shRNA-mediated knockdown of Glpr1 transcript expression. **P<0.0051, unpaired two-tailed t-test. h, Atenolol abolished the hyperglycemic response to experimenter-administered nicotine injection (1 mg kg−1) in rats (n=8): Atenolol, F (3, 25) = 43.54, p<0.0001; Time, F(2.406, 60.15) = 48.69, p<0.0001; Atenolol x Time interaction F (9, 75) =26.88; ***p<0.0001; two-way ANOVA. i, ICI118,551 abolished the elevations in blood glucose (mean ± s.e.m.) induced by experimenter-administered nicotine injection (1 mg kg−1) in rats (n=8): Nicotine, F (1, 7) = 50.83, p=0.002; ICI118,551, F(1, 7) = 13.17, p=0.0084; ICI118,551 x Nicotine interaction F (1, 7) = 27.75, **p=0.0012; two-way repeated-measured ANOVA. j, Atenolol abolished the elevations in blood glucose (mean ± s.e.m.) induced by CNO (3 mg kg−1) in rats (n=8) expressing FLEX-hM3Dq in the mHb-IPn circuit. CNO, F (1, 8) = 213.0, p<0.0001; Atenolol, F (1, 8) = 27.00, p=0.0008; CNO x Atenolol interaction F (1, 8) = 255.5, ***p<0.0001; two-way repeated-measures ANOVA. k, Immunostaining for insulin (left panels), glucagon (middle panels) and their overlap (right panels) in mice treated acutely with saline (upper panels; n=3) or nicotine (0.5 mg kg−1; lower panels; n=3). Quantification of insulin intensity (l), insulin relative area (m), glucagon intensity (n) and glucagon relative area (o) (mean ± s.e.m. in all cases) in pancreatic islets from the saline (n=3)- and nicotine (n=3)-treated mice; **P=0.0059, ***p<0.001 t-test, unpaired two-tailed t-test. Image is representative of results obtained in from 3 biologically independent animals in each treatment group.
Extended data 7. Chemogenetic stimulation of the habenula.
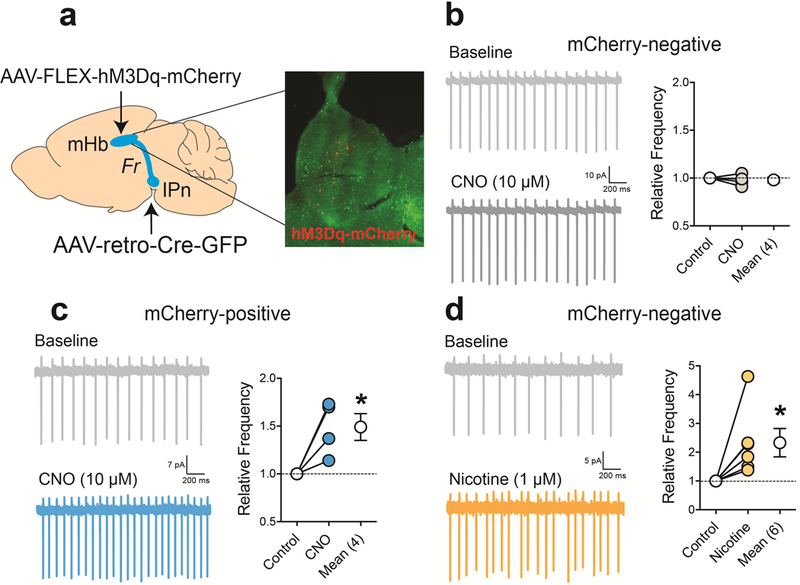
a, Rats were injected with AAV-retro-Cre into IPn and FLEX-GFP or FLEX-hM3Dq-mCherry into mHb. mCherry-positive cells were detected in mHb, confirming that virus targeting was effective. b, CNO (10 μM) had no effects on the relative spike frequency (mean ± s.e.m.) of mCherry-negative cells (n=4 cells/2 rats). c, CNO (10 μM) increased the relative spike frequency (mean ± s.e.m.) of mCherry-positive cells (n=4 cells/3 rats); *p=0.0124, unpaired two-tailed t-test. d, Nicotine (1 μM) increased the relative spike frequency (mean ± s.e.m.) of mHb neurons by a magnitude similar to that seen in mCherry-positive neurons after CNO treatment (n=6 cells/3 rats). *p=0.042, unpaired two-tailed t-test.
Extended data 8. pRV mapping of polysynaptic projections from brain to pancreas and liver.
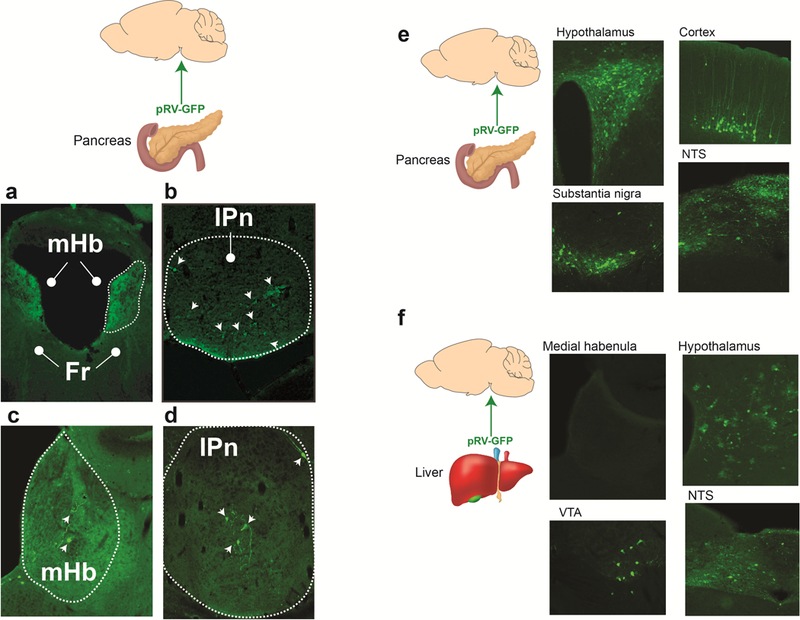
a, c Images of a pRV-GFP-labelled cells (indicated by white arrows) and fibers in the mHb. Fr = fasciculus retroflexus. b, d Representative images of pRV-GFP-labelled IPn neurons (indicated by white arrows). e, Images of GFP-labelled cells in hypothalamus, cortex, substantia nigra and nucleus of the solitary tract (NTS) after pancreas injection of pRV-GFP. r, Images of a GFP-labelled cells in hypothalamus, ventral tegmental area (VTA) and NTS after liver injection of pRV-GFP. Note the absence of GFP-positive cells in the medial habenula. Images are representative of results obtained from 3 separate experiments.
Extended data 9. Consequences of hyperglycemic actions of nicotine.
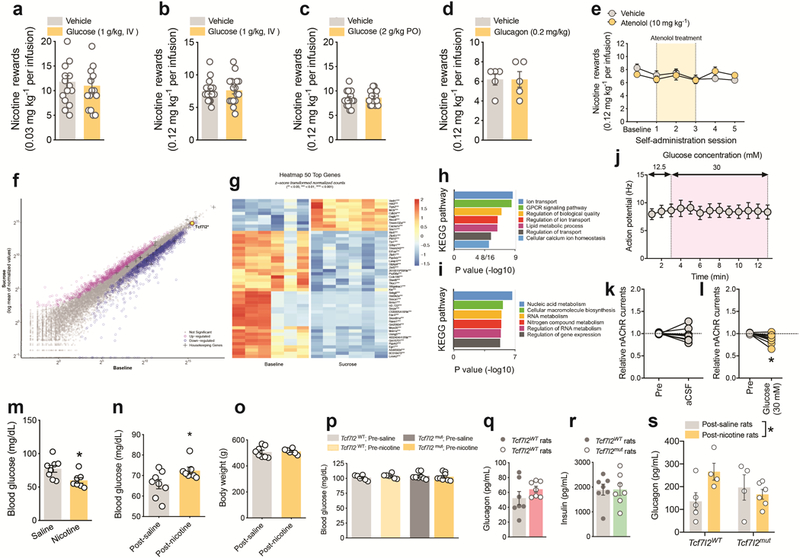
a, Effects of glucose (1 mg kg−1, IV) on nicotine (0.03 mg kg−1 per infusion) intake (mean ± s.e.m.) in rats (n=15). b, Effects of glucose (1 mg kg−1, IV) on nicotine (0.12 mg kg−1 per infusion) intake (mean ± s.e.m.) in rats (n=16). c, Effects of glucose (2 mg kg−1, PO) on nicotine (0.12 mg kg−1 per infusion) intake (mean ± s.e.m.) in rats (n=16). d, Effects of glucagon (0.2 mg kg−1, IV) on nicotine (0.12 mg kg−1 per infusion) intake (mean ± s.e.m.) in rats (n=5). e, Atenolol (10 mg kg−1) delivered prior to the self-administration on three consecutive days did not alter nicotine (0.12 mg kg−1 per infusion) intake (mean ± s.e.m.) in rats (n=8). f, Scatterplots of average TRAP IP samples from sucrose-drinking (y axis; n=28) versus IP samples from sucrose-naïve (x axis; n=8) ChATDW167 mice representing increased (>0.5 log2 fold change, magenta) or decreased (less than −0.5 log2 fold change, blue) levels of transcripts undergoing translation (tissues from n=4 mice were pooled for each sample; 7 samples from sucrose-drinking and 2 samples from sucrose-naïve mice were used). Differentially expressed genes were identified by performing a negative binomial test using DESeq2, with default settings. Significant P values were corrected to control the false discovery rate of multiple testing according to the Benjamini–Hochberg procedure at 0.05 threshold and minimum threshold of 0.6 log2 fold change. g, Expression levels (z-score transformed normalized counts) of the top 50 genes impacted by sucrose consumption in mHb cholinergic neurons. h, KEGG analysis of differentially upregulated genes in the mHb of ChATDW167 mice described in panel f identified pathways likely to be impacted in the mHb by sucrose consumption. Fisher exact test. i, KEGG analysis of differentially downregulated genes in the mHb of ChATDW167 mice described in panel f identified pathways likely to be impacted in the mHb by sucrose consumption. Fisher exact test. j, The frequency of action potentials (mean ± s.e.m.) in mHb neurons was unaltered by elevating the glucose concentrations in the extracellular solution from 12.5 to 30 mM (n=6 cells from 3 rats). k, Maintaining glucose concentration in artificial cerebrospinal fluid (aCSF) in the extracellular solution at 12.5 mM did not alter the magnitude of nicotine-evoked nAChR currents (mean ± s.e.m.) in mHb neurons (n=6 cells from 3 rats). l, Increasing the glucose concentration in the extracellular solution from 12.5 to 30 mM decreased the magnitude of nicotine (1 μM) evoked nAChR currents (mean ± s.e.m.) in mHb neurons (n=6 cells from 3 rats). *P<0.0121, unpaired two-tailed t-test. m, Blood glucose levels (mean ± s.e.m.) measured in rats 24 h after their final nicotine (0.12 mg kg−1 per infusion; n=7) or saline (n=8) self-administration session; *P<0.0223, unpaired two-tailed t-test. n, Blood glucose levels (mean ± s.e.m.) measured in rats 6 weeks after their final nicotine (0.12 mg kg−1 per infusion; n=7) or saline (n=8) self-administration session. *P<0.0371, unpaired two-tailed t-test. o, Body weights (mean ± s.e.m.) in post-saline (n=8) and post-nicotine rats (n=6) measured 6 weeks after their final self-administration session. p, Fasting blood glucose levels (mean ± s.e.m.) in Tcf7l2WT (n=14 in total) and Tcf7l2mut (n=14 in total) rats measured before chronic saline or nicotine injections commenced. q, Circulating levels (mean ± s.e.m.) of glucagon in nicotine-naïve Tcf7l2WT (n=7) and Tcf7l2mut (n=7) rats. r, Circulating levels of insulin (mean ± s.e.m.) in nicotine-naïve Tcf7l2WT (n=7) and Tcf7l2mut (n=7) rats. s, Circulating glucagon levels (mean ± s.e.m.) in Tcf7l2WT (n=9 in total) and Tcf7l2mut (n=10 in total) rats measured before chronic saline or nicotine injections ended; F(1, 15) = 4.606), *p<0.0486, interaction effect of Genotype x Nicotine in two-way ANOVA.
Extended data 10. Proposed mechanism through which Tcf7l2 regulates the motivational properties of nicotine and its disruptive effects on blood glucose homeostasis.
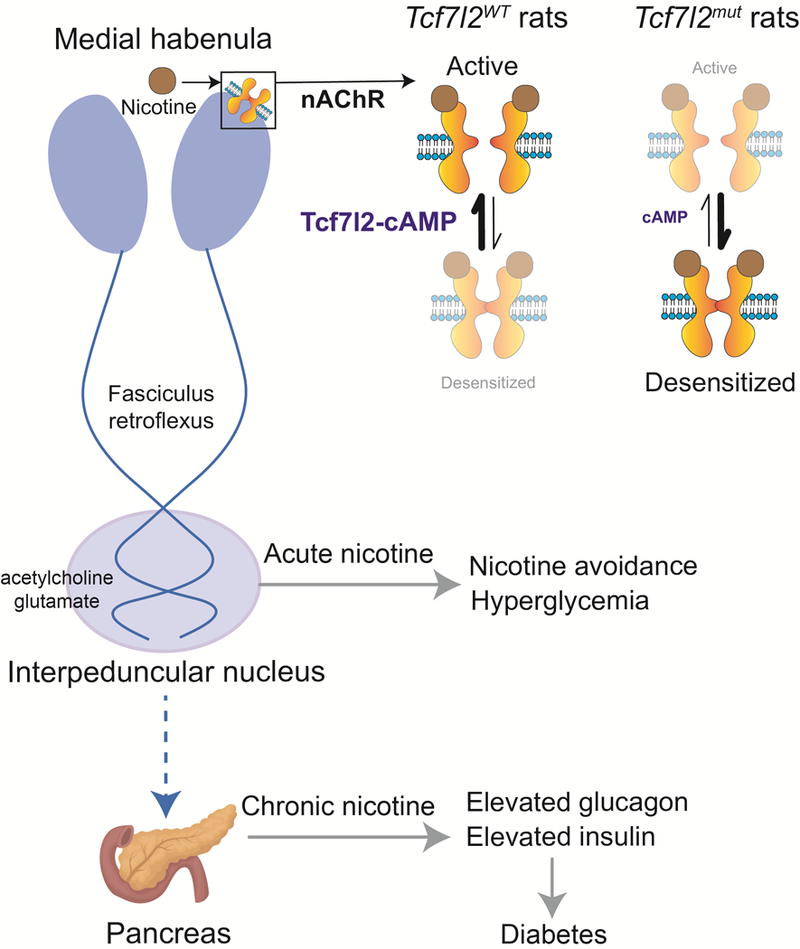
Shown is a representation of a mHb neuron projecting to the IPn (both in blue), via the fasciculus retroflexus, and to the pancreas via a polysynaptic pathway. The mHb neurons expresses nAChRs that are activated by nicotine and that undergo nicotine-induced desensitization. In Tcf7l2WT rats, nAChRs rapidly recover from desensitization by a process involving cAMP signaling. In Tcf7l2mut rats, cAMP signaling is compromised, resulting in persistently desensitized nAChRs and diminished sensitivity of mHb neurons to nicotine. When mHb neurons are activated by nicotine, IPn neurons are stimulated by mHb-derived acetylcholine and glutamate. This triggers nicotine avoidance and a hyperglycemic response, both of which are attenuated in Tcf7l2mut rats. After chronic exposure to the hyperglycemic actions of nicotine, circulating levels of the pancreas-derived hormones glucagon and insulin are elevated, resulting in a diabetes-like disruption of glucose homeostasis. This diabetes-promoting action of nicotine is also attenuated in Tcf7l2mut rats.
Supplementary Material
Acknowledgements
Supported by grants from the National Institute on Drug Abuse to P.J.K. (DA020686) and I.I-T. (DA035756). We thank Dr. Sarah Stanley for pRV-GFP virus, Dr. Jon Lindstrom for the α4β2α5 nAChR cell line, Dr. Michael Conkright for the EVX1-CREB-Luciferase-GFP reporter, and Dr. Andrew Stewart for INS-1 cells. The Lenti-7xTcf-FFluc-SV40-mCherry reporter (7TFC) and dominant-negative TCF7L2 construct (EdTc) were gifts from Roel Nusse (Addgene plasmids #24307 and #24310 respectively). Oxycodone and cocaine were supplied by the NIDA Drug Supply Program.
Footnotes
Competing interests statement
P.J.K. is co-founder of Eolas Therapeutics Inc., which has a incensing agreement with AstraZeneca to develop small molecule treatments for drug dependence. P.J.K. has research support from Eli Lilly and Takeda USA.
Data Availability
The RNA-seq data generated in this study are available at GEO under the accession code GSE137118. The other datasets that support the findings of this study are available as Extended Data, and include uncropped Western blot images.
CITED LITERATURE
- 1.Stolerman IP & Jarvis MJ The scientific case that nicotine is addictive. Psychopharmacology (Berl) 117, 2–10; discussion 14–20 (1995). [DOI] [PubMed] [Google Scholar]
- 2.Maskos U et al. Nicotine reinforcement and cognition restored by targeted expression of nicotinic receptors. Nature 436, 103–107, doi: 10.1038/nature03694 (2005). [DOI] [PubMed] [Google Scholar]
- 3.Fowler CD, Lu Q, Johnson PM, Marks MJ & Kenny PJ Habenular alpha5 nicotinic receptor subunit signalling controls nicotine intake. Nature 471, 597–601, doi: 10.1038/nature09797 (2011). [DOI] [PMC free article] [PubMed] [Google Scholar]
- 4.Fowler CD & Kenny PJ Nicotine aversion: Neurobiological mechanisms and relevance to tobacco dependence vulnerability. Neuropharmacology 76 Pt B, 533–544, doi: 10.1016/j.neuropharm.2013.09.008 (2014). [DOI] [PMC free article] [PubMed] [Google Scholar]
- 5.Tuesta LM et al. GLP-1 acts on habenular avoidance circuits to control nicotine intake. Nat Neurosci 20, 708–716, doi: 10.1038/nn.4540 (2017). [DOI] [PMC free article] [PubMed] [Google Scholar]
- 6.Liu Z & Habener JF Glucagon-like peptide-1 activation of TCF7L2-dependent Wnt signaling enhances pancreatic beta cell proliferation. J Biol Chem 283, 8723–8735, doi: 10.1074/jbc.M706105200 (2008). [DOI] [PMC free article] [PubMed] [Google Scholar]
- 7.Grant SF et al. Variant of transcription factor 7-like 2 (TCF7L2) gene confers risk of type 2 diabetes. Nat Genet 38, 320–323, doi: 10.1038/ng1732 (2006). [DOI] [PubMed] [Google Scholar]
- 8.Sladek R et al. A genome-wide association study identifies novel risk loci for type 2 diabetes. Nature 445, 881–885, doi: 10.1038/nature05616 (2007). [DOI] [PubMed] [Google Scholar]
- 9.Fuchsberger C et al. The genetic architecture of type 2 diabetes. Nature 536, 41–47, doi: 10.1038/nature18642 (2016). [DOI] [PMC free article] [PubMed] [Google Scholar]
- 10.Haggard HW & Greenberg LA The effects of cigarette smoking upon the blood sugar. Science 69, 165–166 (1934). [DOI] [PubMed] [Google Scholar]
- 11.Sandberg H, Roman L, Zavodnick J & Kupers N The effect of smoking on serum somatotropin, immunoreactive insulin and blood glucose levels of young adult males. J Pharmacol Exp Ther 184, 787–791 (1973). [PubMed] [Google Scholar]
- 12.Collaborators GBDT Smoking prevalence and attributable disease burden in 195 countries and territories, 1990–2015: a systematic analysis from the Global Burden of Disease Study 2015. Lancet 389, 1885–1906, doi: 10.1016/S0140-6736(17)30819-X (2017). [DOI] [PMC free article] [PubMed] [Google Scholar]
- 13.Willi C, Bodenmann P, Ghali WA, Faris PD & Cornuz J Active smoking and the risk of type 2 diabetes: a systematic review and meta-analysis. JAMA 298, 2654–2664, doi: 10.1001/jama.298.22.2654 (2007). [DOI] [PubMed] [Google Scholar]
- 14.Ren J et al. Habenula “cholinergic” neurons co-release glutamate and acetylcholine and activate postsynaptic neurons via distinct transmission modes. Neuron 69, 445–452, doi: 10.1016/j.neuron.2010.12.038 (2011). [DOI] [PubMed] [Google Scholar]
- 15.Gorlich A et al. Reexposure to nicotine during withdrawal increases the pacemaking activity of cholinergic habenular neurons. Proc Natl Acad Sci U S A 110, 17077–17082, doi: 10.1073/pnas.1313103110 (2013). [DOI] [PMC free article] [PubMed] [Google Scholar]
- 16.Dougherty JD, Schmidt EF, Nakajima M & Heintz N Analytical approaches to RNA profiling data for the identification of genes enriched in specific cells. Nucleic Acids Res 38, 4218–4230, doi: 10.1093/nar/gkq130 (2010). [DOI] [PMC free article] [PubMed] [Google Scholar]
- 17.Ables JL et al. Retrograde inhibition by a specific subset of interpeduncular alpha5 nicotinic neurons regulates nicotine preference. Proc Natl Acad Sci U S A 114, 13012–13017, doi: 10.1073/pnas.1717506114 (2017). [DOI] [PMC free article] [PubMed] [Google Scholar]
- 18.Boj SF et al. Diabetes risk gene and Wnt effector Tcf7l2/TCF4 controls hepatic response to perinatal and adult metabolic demand. Cell 151, 1595–1607, doi: 10.1016/j.cell.2012.10.053 (2012). [DOI] [PubMed] [Google Scholar]
- 19.Korinek V et al. Depletion of epithelial stem-cell compartments in the small intestine of mice lacking Tcf-4. Nat Genet 19, 379–383, doi: 10.1038/1270 (1998). [DOI] [PubMed] [Google Scholar]
- 20.Geurts AM et al. Knockout rats via embryo microinjection of zinc-finger nucleases. Science 325, 433, doi: 10.1126/science.1172447 (2009). [DOI] [PMC free article] [PubMed] [Google Scholar]
- 21.Graham TA, Ferkey DM, Mao F, Kimelman D & Xu W Tcf4 can specifically recognize beta-catenin using alternative conformations. Nat Struct Biol 8, 1048–1052, doi: 10.1038/nsb718 (2001). [DOI] [PubMed] [Google Scholar]
- 22.Molenaar M et al. XTcf-3 transcription factor mediates beta-catenin-induced axis formation in Xenopus embryos. Cell 86, 391–399 (1996). [DOI] [PubMed] [Google Scholar]
- 23.Ip W, Shao W, Chiang YT & Jin T The Wnt signaling pathway effector TCF7L2 is upregulated by insulin and represses hepatic gluconeogenesis. Am J Physiol Endocrinol Metab 303, E1166–1176, doi: 10.1152/ajpendo.00249.2012 10.1152/ajpheart.zh4–0578-corr.2012 (2012). [DOI] [PMC free article] [PubMed] [Google Scholar]
- 24.Huang SM et al. Tankyrase inhibition stabilizes axin and antagonizes Wnt signalling. Nature 461, 614–620, doi: 10.1038/nature08356 (2009). [DOI] [PubMed] [Google Scholar]
- 25.McGehee DS, Heath MJ, Gelber S, Devay P & Role LW Nicotine enhancement of fast excitatory synaptic transmission in CNS by presynaptic receptors. Science 269, 1692–1696 (1995). [DOI] [PubMed] [Google Scholar]
- 26.Zoli M, Lena C, Picciotto MR & Changeux JP Identification of four classes of brain nicotinic receptors using beta2 mutant mice. J Neurosci 18, 4461–4472 (1998). [DOI] [PMC free article] [PubMed] [Google Scholar]
- 27.Murray KD, Choudary PV & Jones EG Nucleus- and cell-specific gene expression in monkey thalamus. Proc Natl Acad Sci U S A 104, 1989–1994, doi: 10.1073/pnas.0610742104 (2007). [DOI] [PMC free article] [PubMed] [Google Scholar]
- 28.Skoglund G, Hussain MA & Holz GG Glucagon-like peptide 1 stimulates insulin gene promoter activity by protein kinase A-independent activation of the rat insulin I gene cAMP response element. Diabetes 49, 1156–1164 (2000). [DOI] [PMC free article] [PubMed] [Google Scholar]
- 29.Giniatullin R, Nistri A & Yakel JL Desensitization of nicotinic ACh receptors: shaping cholinergic signaling. Trends Neurosci 28, 371–378, doi: 10.1016/j.tins.2005.04.009 (2005). [DOI] [PubMed] [Google Scholar]
- 30.Paradiso K & Brehm P Long-term desensitization of nicotinic acetylcholine receptors is regulated via protein kinase A-mediated phosphorylation. J Neurosci 18, 9227–9237 (1998). [DOI] [PMC free article] [PubMed] [Google Scholar]
- 31.Huganir RL, Delcour AH, Greengard P & Hess GP Phosphorylation of the nicotinic acetylcholine receptor regulates its rate of desensitization. Nature 321, 774–776, doi: 10.1038/321774a0 (1986). [DOI] [PubMed] [Google Scholar]
- 32.Li YF et al. Antidepressant- and anxiolytic-like effects of the phosphodiesterase-4 inhibitor rolipram on behavior depend on cyclic AMP response element binding protein-mediated neurogenesis in the hippocampus. Neuropsychopharmacology 34, 2404–2419, doi: 10.1038/npp.2009.66 (2009). [DOI] [PMC free article] [PubMed] [Google Scholar]
- 33.Zhao TJ et al. Ghrelin secretion stimulated by {beta}1-adrenergic receptors in cultured ghrelinoma cells and in fasted mice. Proc Natl Acad Sci U S A 107, 15868–15873, doi: 10.1073/pnas.1011116107 (2010). [DOI] [PMC free article] [PubMed] [Google Scholar]
- 34.Neil-Dwyer G, Bartlett J, McAinsh J & Cruickshank JM Beta-adrenoceptor blockers and the blood-brian barrier. Br J Clin Pharmacol 11, 549–553 (1981). [DOI] [PMC free article] [PubMed] [Google Scholar]
- 35.O’Dell LE & Nazarian A Enhanced vulnerability to tobacco use in persons with diabetes: A behavioral and neurobiological framework. Prog Neuropsychopharmacol Biol Psychiatry 65, 288–296, doi: 10.1016/j.pnpbp.2015.06.005 (2016). [DOI] [PubMed] [Google Scholar]
- 36.Perkins KA, Epstein LH, Sexton JE & Pastor S Effects of smoking cessation on consumption of alcohol and sweet, high-fat foods. J Subst Abuse 2, 287–297 (1990). [DOI] [PubMed] [Google Scholar]
- 37.Yamaguchi T, Danjo T, Pastan I, Hikida T & Nakanishi S Distinct roles of segregated transmission of the septo-habenular pathway in anxiety and fear. Neuron 78, 537–544, doi: 10.1016/j.neuron.2013.02.035 (2013). [DOI] [PMC free article] [PubMed] [Google Scholar]
- 38.Soria-Gomez E et al. Habenular CB1 Receptors Control the Expression of Aversive Memories. Neuron 88, 306–313, doi: 10.1016/j.neuron.2015.08.035 (2015). [DOI] [PubMed] [Google Scholar]
- 39.Zhang J et al. Presynaptic Excitation via GABAB Receptors in Habenula Cholinergic Neurons Regulates Fear Memory Expression. Cell 166, 716–728, doi: 10.1016/j.cell.2016.06.026 (2016). [DOI] [PubMed] [Google Scholar]
- 40.Chou MY et al. Social conflict resolution regulated by two dorsal habenular subregions in zebrafish. Science 352, 87–90, doi: 10.1126/science.aac9508 (2016). [DOI] [PubMed] [Google Scholar]
- 41.Zhao Z et al. A Central Catecholaminergic Circuit Controls Blood Glucose Levels during Stress. Neuron 95, 138–152 e135, doi: 10.1016/j.neuron.2017.05.031 (2017). [DOI] [PubMed] [Google Scholar]
- 42.Wang Z & Ma’ayan A An open RNA-Seq data analysis pipeline tutorial with an example of reprocessing data from a recent Zika virus study [version 1; referees: 3 approved]. Vol. 5 (2016). [DOI] [PMC free article] [PubMed] [Google Scholar]
- 43.Dobin A et al. STAR: ultrafast universal RNA-seq aligner. Bioinformatics 29, 15–21, doi: 10.1093/bioinformatics/bts635 (2013). [DOI] [PMC free article] [PubMed] [Google Scholar]
- 44.Liao Y, Smyth GK & Shi W featureCounts: an efficient general purpose program for assigning sequence reads to genomic features. Bioinformatics 30, 923–930, doi: 10.1093/bioinformatics/btt656 (2014). [DOI] [PubMed] [Google Scholar]
- 45.Clark N et al. The characteristic direction: a geometrical approach to identify differentially expressed genes. BMC Bioinformatics 15, 79 (2014). [DOI] [PMC free article] [PubMed] [Google Scholar]
- 46.Chen E et al. Enrichr: interactive and collaborative HTML5 gene list enrichment analysis tool. BMC Bioinformatics 14, 128 (2013). [DOI] [PMC free article] [PubMed] [Google Scholar]
- 47.Kuleshov MV et al. Enrichr: a comprehensive gene set enrichment analysis web server 2016 update. Nucleic Acids Research, doi: 10.1093/nar/gkw377 (2016). [DOI] [PMC free article] [PubMed] [Google Scholar]
Associated Data
This section collects any data citations, data availability statements, or supplementary materials included in this article.