

Abstract
Background
Coronary artery disease (CAD) patterns play an essential role in the decision‐making process about revascularization. The pullback pressure gradient (PPG) quantifies CAD patterns as either focal or diffuse based on fractional flow reserve (FFR) pullbacks. The objective of this study was to evaluate the impact of CAD patterns on acute percutaneous coronary intervention (PCI) results considered surrogates of clinical outcomes.
Methods and Results
This was a prospective, multicenter study of patients with hemodynamically significant CAD undergoing PCI. Motorized FFR pullbacks and optical coherence tomography (OCT) were performed before and after PCI. Post‐PCI FFR >0.90 was considered an optimal result. Focal disease was defined as PPG >0.73 (highest PPG tertile). Overall, 113 patients (116 vessels) were included. Patients with focal disease were younger than those with diffuse CAD (61.4±9.9 versus 65.1±8.7 years, P=0.042). PCI in vessels with high PPG (focal CAD) resulted in higher post‐PCI FFR (0.91±0.07 in the focal group versus 0.86±0.05 in the diffuse group, P<0.001) and larger minimal stent area (6.3±2.3 mm2 in focal versus 5.3±1.8 mm2 in diffuse CAD, P=0.015) compared withvessels with low PPG (diffuse CAD). The PPG was associated with the change in FFR after PCI (R 2=0.51, P<0.001). The PPG significantly improved the capacity to predict optimal PCI results compared with an angiographic assessment of CAD patterns (area under the curvePPG 0.81 [95% CI, 0.73–0.88] versus area under the curveangio 0.51 [95% CI, 0.42–0.60]; P<0.001).
Conclusions
PCI in vessels with focal disease defined by the PPG resulted in greater improvement in epicardial conductance and larger minimal stent area compared with diffuse disease. PPG, but not angiographically defined CAD patterns, distinguished patients attaining superior procedural outcomes.
Registration
Keywords: CAD patterns, diffuse disease, percutaneous coronary interventions, pullback pressure gradient
Subject Categories: Revascularization, Percutaneous Coronary Intervention, Coronary Circulation
Nonstandard Abbreviations and Acronyms
- FFR
fractional flow reserve
- MSA
minimal stent area
- PPG
pullback pressure gradient
Clinical Perspective
What Is New?
Pullback pressure gradient (PPG) is a novel approach to quantify coronary artery disease (CAD) patterns as either focal or diffuse based on coronary physiology; PPG is a continuous metric with values approaching 0 representing diffuse CAD and close to 1 characterizing focal CAD.
Outcomes of percutaneous coronary interventions (PCI) are superior in vessels with high PPG (focal disease) demonstrated by a higher post‐PCI fractional flow reserve and larger minimal stent area, both markers of improved PCI durability.
In contrast, PCI in vessels with low PPG (diffuse disease) is associated with low post‐PCI fractional flow reserve and smaller MS; furthermore, the PPG, assessed as a continuous variable, is strongly associated with the change in FFR after PCI, a parameter predictive of angina relief after PCI.
What Are the Clinical Implications?
The PPG adds a novel dimension to the evaluation of patients with CAD and allows for risk stratification before stent implantation; this new differentiation of CAD into 2 endotypes paves the way for a more personalized clinical decision‐making process about revascularization.
Patients with high PPG (focal disease) are ideal candidates for PCI, whereas the best treatment strategy for patients with diffuse disease remains to be determined.
Future clinical trials will investigate the benefit of PCI compared with medical therapy stratified by CAD patterns (focal versus diffuse).
The success of percutaneous coronary intervention (PCI) is assessed immediately after stent implantation using angiography or intravascular imaging. Large stent luminal area with adequate stent expansion has been associated with improved prognosis. 1 , 2 Coronary physiology can also be used to assess PCI results by measuring post‐PCI fractional flow reserve (FFR). Improvement in FFR after PCI has been associated with angina relief. 3 , 4 Furthermore, both minimal stent area (MSA) and post‐PCI FFR have been identified as independent predictors of target vessel failure. 5 , 6
Characterizing coronary artery disease (CAD) patterns plays a central role in the management of patients with stable CAD, as treatment options may be more suited for a particular disease phenotype. The pattern of CAD, that is, focal or diffuse, has been shown to influence revascularization treatment decisions. Diffuse disease is considered a marker of poor prognosis with limited treatment options, and is one of the underlying mechanisms of persistent angina after PCI. 7 In contrast, PCI in patients with focal CAD improves myocardial perfusion and relieves angina. 8 Although results of PCI may logically be influenced by CAD patterns, the impact of diffuse or focal CAD on the efficacy and safety of PCI remains poorly understood. One of the reasons is the lack of a reproducible metric standardizing the diagnosis of focal and diffuse CAD.
Pathophysiological patterns of CAD can be distinguished as focal versus diffuse using hyperemic intracoronary pressure pullback recordings. The pullback pressure gradient (PPG) provides a novel index based on FFR pullback curves that quantify CAD patterns. PPG values close to 1 represent focal disease, whereas PPGs approaching 0 characterize diffuse disease. 9 PCI, a focal therapy for CAD, might be of greatest benefit in vessels with high PPG. We investigated the effect of PCI in patients with focal and diffuse CAD defined by the PPG, in terms of procedural outcomes considered surrogates of adverse events.
METHODS
The data that support the findings of this study are available from the corresponding author upon reasonable request.
Study Design
This substudy is a predefined analysis of the P3 (Precise PCI Plan), which study design and main results have been reported elsewhere. 10 , 11 Briefly, the P3 study was a prospective, investigator‐initiated, multicenter study of patients with stable CAD referred for PCI. Patients with a significant epicardial lesion based on an FFR ≤0.80 were considered for inclusion. Patients underwent an invasive protocol including motorized FFR pullbacks, and optical coherence tomography (OCT) assessment performed both before and after PCI for guidance and stent optomization. Patients with severely calcified vessels, bifurcation or ostial lesions, left main disease, severe vessel tortuosity, previous revascularization, or atrial fibrillation were excluded. 12 The study protocol was approved by the institutional review board or ethics committee at each participating center. All patients signed informed consent. Invasive anatomical and functional data were analyzed by a core laboratory (CoreAalst BV, Aalst, Belgium). The protocol was registered on ClinicalTrials.gov, identifier NCT03782688. The study was sponsored by the Cardiac Research Institute Aalst (Aalst, Belgium).
To test the hypothesis that PCI offers the greatest benefit to patients with focal CAD, we divided the population according to PPG tertiles. The highest tertile was considered to be focal disease, whereas the intermediate and lower PPG tertiles comprising patients with diffuse and combined (focal and diffuse) CAD were considered diffuse disease.
The study objective was to compare the success of PCI in focal and diffuse CAD defined functionally by measuring post‐PCI FFR and morphologically by assessing MSA using OC.
Fractional Flow Reserve Pullbacks
FFR measurements were performed in accordance with published standards, before and after PCI. 13 The pressure wire sensor was positioned in a distal coronary segment >2 mm in diameter by visual estimation. A continuous intravenous adenosine infusion was given at a dose of 140 mcg/kg per minute via a peripheral or central vein for at least 2 minutes. A pullback device (Volcano R 100, San Diego, CA), adapted to grip the coronary pressure wire (PressureWire X, Abbott Vascular, St. Paul, MN, USA), was set to pull back the pressure wire at a speed of 1 mm/s during continuous recording. If drift >0.03 was observed, the hyperemic pullback was repeated. To account for baseline disease severity, delta FFR was defined as the difference between post‐ and pre‐PCI FFR divided by 1 minus pre‐PCI FFR. Post‐PCI FFR >0.90 was considered an optimal result. 14
Characterization of CAD Patterns
The PPG calculation has been described in detail elsewhere. 9 In brief, PPG is calculated by combining 2 parameters extracted from FFR pullback curves: the maximal pressure gradient over 20% of the pullback duration, and the relative length of functional disease. PPG values close to 1 represent focal disease and values close to 0 characterize diffuse CAD. PPG was calculated offline from motorized FFR pullbacks using a commercially available console (Coroflow v3.5, Coroventis Research, Uppsala, Sweden).
In addition, coronary angiograms were analyzed, blinded to the clinical and physiological data, to determine the anatomical pattern of CAD, adjudicated visually as focal or diffuse by 2 independent observers (H.O. and K.S.). Based on angiography, focal disease was defined as lesions ≤20 mm in length. 9
Optical Coherence Tomography Analysis
OCT pullbacks of 75 mm were acquired using the Dragonfly OPTIS Imaging Catheter (Abbott Vascular, St. Paul, MN, USA). An automated algorithm defined minimal lumen area and MSA. Cases in which OCT was performed after predilatation were excluded from analyses necessitating minimal lumen area information. Stent expansion was defined as the ratio between MSA and average reference lumen area. OCT images were analyzed using CAAS Intravascular version 2.1 (Pie Medical Imaging, Maastricht, The Netherlands).
Procedure and Clinical Outcomes
PCI was guided by FFR and OCT, including both physiology and imaging for stent optimization. Optimal procedural results were defined as MSA >5.5 mm2 and post‐PCI FFR >0.90. Latest‐generation drug‐eluting stents were implanted. Cardiac biomarkers and an electrocardiogram were collected 6 to 24 hours after the procedure. To allow for comparison among different troponin assays, values were normalized to the assay‐specific 99th percentile upper reference limit. Clinical follow‐up was performed at 1 year. Prognostically relevant major periprocedural myocardial injury was defined as post‐PCI troponin >5×99th percentile upper reference limit. 15 Periprocedural myocardial infarction was defined according to the fourth universal definition of myocardial infarction (MI). 16 Target vessel failure was defined as cardiac death, target‐vessel myocardial infarction and ischemia‐driven target vessel revascularization, as independently adjudicated by a clinical events committee.
Statistical Analysis
Continuous variables with normal distribution are presented as mean±SD and nonnormally distributed variables as median [interquartile range]. Categorical variables are presented as counts and percentages. Mann–Whitney U tests or t tests were used to compare groups according to the distribution of the variables. Pearson correlation coefficients assessed the relationship between variables. The agreement between angiography and physiology regarding CAD patterns (focal versus diffuse) was assessed using Cohen's Kappa. The area under the receiving operating characteristic (AUC) curve quantified the predictive capacity of PPG for MSA (cutoff 5.5 mm2) and post‐PCI FFR (cutoff 0.90). The De Long method was used to compare AUC. Multiple linear regression models adjusted by vessel type, lesion length, FFR, and PPG were used to assess the independent predictors of post‐PCI FFR. Unadjusted logistic regression analysis examined the association between the PPG and target vessel failure. For the outcome analysis, patients with more than 1 treated vessel were classified according to the lowest PPG value. All analyses were performed using R statistical software (R Foundation for Statistical Computing, Vienna, Austria).
RESULTS
From February 2019 to December 2020, 113 patients (116 vessels) were included from 5 centers in 5 countries. The mean age was 63.9±9.2 years, 80% were men, and 23% had diabetes. Most patients (98%) presented with stable CAD. The study flow chart is shown in Figure 1. Patient characteristics in the overall population and stratified by CAD patterns are shown in Table 1. Mean PPG was 0.66±0.30 (median 0.66, interquartile range [0.55, 0.75]). Physiological pattern was dichotomized as focal and diffuse CAD based on the highest PPG tertiles (threshold 0.73). Patients with diffuse disease were older (61.4±9.9 years versus 65.1±8.7 years, P=0.042) and tended to have reduced renal function (creatinine clearance 85.5±27.6 mL/min versus 76.5±21.1 mL/min; P=0.066) compared with patients with focal CAD. Other baseline clinical characteristics were similar between patients with focal and diffuse CAD (Table 1).
Figure 1. Study flow chart.
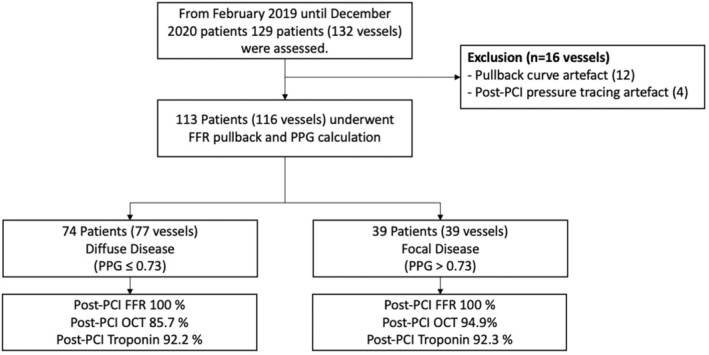
FFR indicates fractional flow reserve; OCT, optical coherence tomography; PCI, percutaneous coronary intervention; and PPG, pullback pressure gradient.
Table 1.
Patient Characteristics
| Variables | Overall | Diffuse CAD | Focal CAD | P value* |
|---|---|---|---|---|
| Number of patients | 113 | 74 | 39 | |
| Age, y, mean±SD | 63.9±9.2 | 65.1±8.7 | 61.4±9.9 | 0.042 |
| Sex, male, n (%) | 90 (79.6%) | 62 (81.6%) | 28 (75.7%) | 0.629 |
| Weight, kg, mean±SD | 80.7±13.2 | 79.6±13.0 | 83.0±13.3 | 0.207 |
| Height, cm, mean±SD | 172.8±9.2 | 172.5±9.8 | 173.3±7.7 | 0.661 |
| Body mass index, mean±SD | 27.0±3.4 | 26.7±3.2 | 27.5±3.7 | 0.203 |
| Dyslipidemia, n (%) | 88 (77.9%) | 60 (78.9%) | 28 (75.7%) | 0.879 |
| Hypertension, n (%) | 65 (57.5%) | 40 (52.6%) | 25 (67.6%) | 0.192 |
| Diabetes mellites, n (%) | 26 (23.0%) | 18 (23.7%) | 8 (21.6%) | 0.995 |
| Current smoker, n (%) | 24 (21.2%) | 16 (21.1%) | 8 (21.6%) | 1.000 |
| Prior percutaneous coronary intervention, n (%) | 6 (5.3%) | 4 (5.3%) | 2 (5.4%) | 1.000 |
| Peripheral artery disease, n (%) | 5 (4.4%) | 3 (3.9%) | 2 (5.4%) | 1.000 |
| Previous stroke, n (%) | 4 (3.5%) | 4 (5.3%) | 0 (0.0%) | 0.380 |
| Clinical presentation, n (%) | 0.144 | |||
| Silent ischemia | 27 (23.9%) | 22 (28.9%) | 5 (13.5%) | |
| Stable angina CCS I | 35 (31.0%) | 26 (34.2%) | 9 (24.3%) | |
| Stable angina CCS II | 41 (36.3%) | 23 (30.3%) | 18 (48.6%) | |
| Stable angina CCS III | 7 (6.2%) | 3 (3.9%) | 4 (10.8%) | |
| Stable angina CCS IV | 1 (0.9%) | 1 (1.3%) | 0 (0.0%) | |
| Unstable angina | 2 (1.8%) | 1 (1.3%) | 1 (2.7%) | |
| Creatinine, mg/dL, mean±SD | 0.94±0.20 | 0.94±0.19 | 0.94±0.22 | 0.975 |
| Creatinine clearance, mean±SD | 79.4±23.6 | 76.5±21.1 | 85.5±27.6 | 0.066 |
| Left ventricular ejection fraction (%), mean±SD | 60.1±6.1 | 60.3±6.5 | 59.8±5.3 | 0.735 |
CAD indicates coronary artery disease; and CCS, Canadian Cardiovascular Society.
For the comparison between focal and diffuse. Continuous variables were compared using t tests and categorical variables using chi square.
The left anterior descending artery was more frequently associated with the presence of diffuse disease (Table 2). Mean diameter stenosis was higher in focal compared with diffuse disease (59.9±11.2% versus 47.3±13.7%, P<0.001). Similarly, patients with focal CAD had more severe functional disease (FFR 0.58±0.15 versus 0.70±0.11, P<0.001). Baseline angiographic, OCT, and functional characteristics stratified by focal and diffuse CAD are shown in Table 2. On average, patients received 1.25±0.5 stents with no differences between disease phenotypes. Total stent length was longer for vessels with diffuse CAD (29.7±13.2 mm focal versus 37.2±15.8 mm diffuse, P=0.012), whereas mean stent diameter did not differ (3.25±0.95 mm focal versus 3.03±0.42 mm diffuse, P=0.081). There were no differences between groups in rates of pre‐or postdilatation (Table 3).
Table 2.
Baseline Angiographic, OCT, and Functional Characteristics Stratified by Disease Pattern
| Variables | Overall | Diffuse CAD | Focal CAD | P value* |
|---|---|---|---|---|
| Number of vessels | 116 | 77 | 39 | |
| Vessel (%) | <0.001 | |||
| Left anterior descending | 87 (75.0%) | 69 (89.6%) | 18 (46.2%) | |
| Left circumflex artery | 13 (11.2%) | 4 (5.2%) | 9 (23.1%) | |
| Right coronary artery | 16 (13.8%) | 4 (5.2%) | 12 (30.8%) | |
| Baseline quantitative coronary angiography | ||||
| Lesion length, mm, mean±SD | 23.7±12.9 | 25.6±13.4 | 19.9±11.3 | 0.026 |
| Reference lumen diameter, mm, mean±SD | 2.7±0.5 | 2.7±0.5 | 2.7±0.5 | 0.928 |
| Reference lumen area, mm2, mean±SD | 6.0±2.2 | 6.0±2.3 | 5.9±2.1 | 0.887 |
| Minimal lumen diameter, mm, mean±SD | 1.31±0.44 | 1.43±0.43 | 1.1±0.4 | <0.001 |
| Minimal lumen area, mm2, mean±SD | 1.5±1.0 | 1.7±1.06 | 1.0±0.7 | <0.001 |
| Diameter stenosis (%), mean±SD | 51.5±14.2 | 47.3±13.7 | 59.9±11.2 | <0.001 |
| Baseline OCT | ||||
| Number of vessels | 103 | 71 | 32 | |
| Distal reference lumen area, mm2, mean±SD | 5.6±2.4 | 5.4±2.4 | 6.1±2.5 | 0.182 |
| Proximal reference lumen area, mm2, mean±SD | 8.2±3.5 | 8.1±3.5 | 8.4±3.4 | 0.700 |
| Lesion length, mm | 30.8±3.9 | 32.4±14.1 | 27.2±12.9 | 0.084 |
| Minimal lumen area, mm2, mean±SD† | 1.7±0.7 | 1.9±0.8 | 1.4±0.6 | 0.020 |
| Baseline physiology | ||||
| Fractional flow reserve, mean±SD | 0.66±0.13 | 0.70±0.11 | 0.58±0.2 | <0.001 |
| Pullback pressure gradient, mean±SD | 0.66±0.13 | 0.58±0.09 | 0.80±0.06 | <0.001 |
CAD indicates coronary artery disease; and OCT, optical coherence tomography.
For the comparison between focal and diffuse. Continuous variables were compared using t tests and categorical variables using chi square.
Available for 67 vessels (55 diffuse and 12 focal) before predilation.
Table 3.
Procedural Characteristics Stratified by Disease Pattern
| Variables | Overall | Diffuse CAD | Focal CAD | P value* |
|---|---|---|---|---|
| Number of vessels | 116 | 77 | 39 | |
| Procedural characteristics | ||||
| Number of stents, mean±SD | 1.3±0.5 | 1.3±0.6 | 1.2±0.4 | 0.290 |
| Total stent length, mm, mean±SD | 34.7±15.4 | 37.2±159 | 29.7±13.2 | 0.012 |
| Stent diameter, mm, mean±SD | 3.1±0.7 | 3.03±0.42 | 3.25±0.95 | 0.081 |
| Predilatation, n (%) | 102 (87.9%) | 67 (87.0%) | 35 (89.7%) | 0.901 |
| Postdilatation, n (%) | 106 (91.4%) | 69 (89.6%) | 37 (94.9%) | 0.546 |
| Post‐PCI quantitative coronary angiography | ||||
| Reference lumen diameter, mm, mean±SD | 2.87±0.48 | 2.85±0.47 | 2.91±0.49 | 0.501 |
| Minimal stent diameter, mm, mean±SD | 2.79±0.46 | 2.74±0.42 | 2.87±0.52 | 0.160 |
| Residual diameter stenosis (%), mean±SD | 2.49±10.51 | 3.19±10.09 | 1.10±11.31 | 0.313 |
| Post‐PCI optical coherence tomography | ||||
| Number of vessels | 102 | 65 | 37 | |
| Minimal stent area, mm2, mean±SD | 5.64±2.04 | 5.27±1.79 | 6.29±2.30 | 0.015 |
| Distal reference lumen area, mm2, mean±SD | 5.70±2.30 | 5.33±2.21 | 6.35±2.34 | 0.030 |
| Proximal reference lumen area, mm2, mean±SD | 8.58±3.34 | 8.52±3.51 | 8.71±3.05 | 0.782 |
| Stent expansion, mean±SD | 0.81±0.17 | 0.79±0.19 | 0.84±0.13 | 0.254 |
| Edge dissection, n (%) | 12 (11.8%) | 10 (15.4%) | 2 (5.4%) | 0.236 |
| Number of vessels | 60 | 48 | 12 | |
| Acute lumen gain, mean±SD | 3.90±1.93 | 3.47±1.63 | 5.63±2.12 | <0.001 |
| Post‐PCI physiology | ||||
| Fractional flow reserve, mean±SD | 0.88±0.06 | 0.86±0.05 | 0.91±0.07 | <0.001 |
| Relative functional gain, %±SD | 0.61±0.24 | 0.52±0.22 | 0.79±0.16 | <0.001 |
CAD indicates coronary artery disease; and PCI, percutaneous coronary intervention.
For the comparison between focal and diffuse. Continuous variables were compared using t tests and categorical variables using chi‐square.
Post‐PCI Intravascular Imaging Findings by CAD Pattern
Overall, the mean MSA was 5.65±2.03 mm2 (Figure S1), but focal disease was associated with larger MSA compared with diffuse CAD (6.3±2.3 mm2 versus 5.3±1.8 mm2, P=0.015). Moreover, analyzing both as continuous variables, there was a significant and weak correlation between the PPG and MSA (r=0.25 [95% CI, 0.06–0.42], P=0.012). Likewise, acute lumen area gain was higher in patients with focal CAD (5.6±2.1 mm2 versus 3.5±1.6 mm2, P<0.001) and was significantly associated with PPG(r=0.46 [95% CI, 0.24–0.64], P<0.001; Figure 2). Stent expansion was similar between focal and diffuse disease (84±13% versus 79±19%, P=0.254). Post‐PCI stent edge dissections were more frequently observed in patients with diffuse disease (5.4% [2/37] focal versus 15.4% [10/65] diffuse, P=0.10); however, this finding did not reach the statistical threshold for significance.
Figure 2. Relationships between pullback pressure gradient and morphological lesions characteristics before and after PCI.
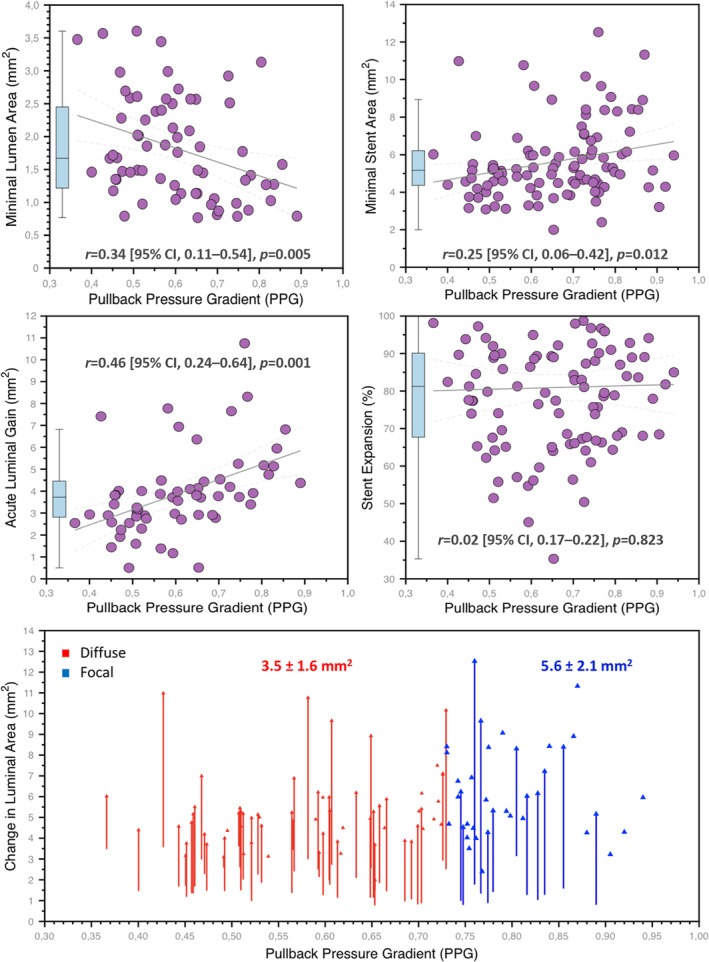
The top row shows the relationship between the PPG (x‐axes) and minimal lumen area (left), and minimal stent area (right). The mid‐row shows the relationship between PPG and acute luminal gain (minimal stent area minus minimal lumen area) on the left side and stent expansion on the right side. The bottom panel shows the lumen area change achieved by PCI stratified by PPG (x‐axis). The red arrows identify patients with diffuse disease, whereas the blue arrows focal disease with the corresponding mean acute lumen gain. PCI indicates percutaneous coronary intervention; and PPG, pullback pressure gradient.
Post‐PCI Physiologic Findings by CAD Pattern
Mean post‐PCI FFR was 0.88±0.06 (Figure S2), but significantly higher post‐PCI FFR was achieved in patients with focal disease than in cases with diffuse CAD (0.91±0.07 versus 0.86±0.05, P<0.001, Figure 3). There was a significant and modest correlation between the pre‐PCI PPG and post‐PCI FFR (r=0.51 [95% CI, 0.37–0.64], P<0.001). PPG predicted post‐PCI FFR >0.90 with an AUC of 0.81 (95% CI, 0.73–0.88, best PPG cutoff of 0.60). A higher proportion of patients with focal CAD achieved a post‐PCI FFR >0.90 compared with diffuse disease (57% focal versus 23% diffuse, P=0.001). In multivariable analysis, PPG and the left anterior descending artery emerged as independent predictors of post‐PCI FFR (Table S1). Delta FFR was also significantly higher in patients with focal versus diffuse disease (0.33±0.14 versus 0.17±0.12, P<0.001). The change in FFR with PCI was largely determined by the PPG (R 2=0.51, P<0.001). Changes in lumen area with PCI correlated with changes in FFR (r=0.39 [95% CI, 0.15–0.58], P=0.002). PCI in cases of diffuse CAD was associated with smaller improvements in both FFR and MSA. PCI in vessels with focal disease resulted in higher post‐PCI FFR and larger MSA. Patients with diffuse CAD had a higher rate of clustered morphological and functional suboptimal results (Figure 4).
Figure 3. Relationships between pullback pressure gradient, post‐PCI, and delta FFR.
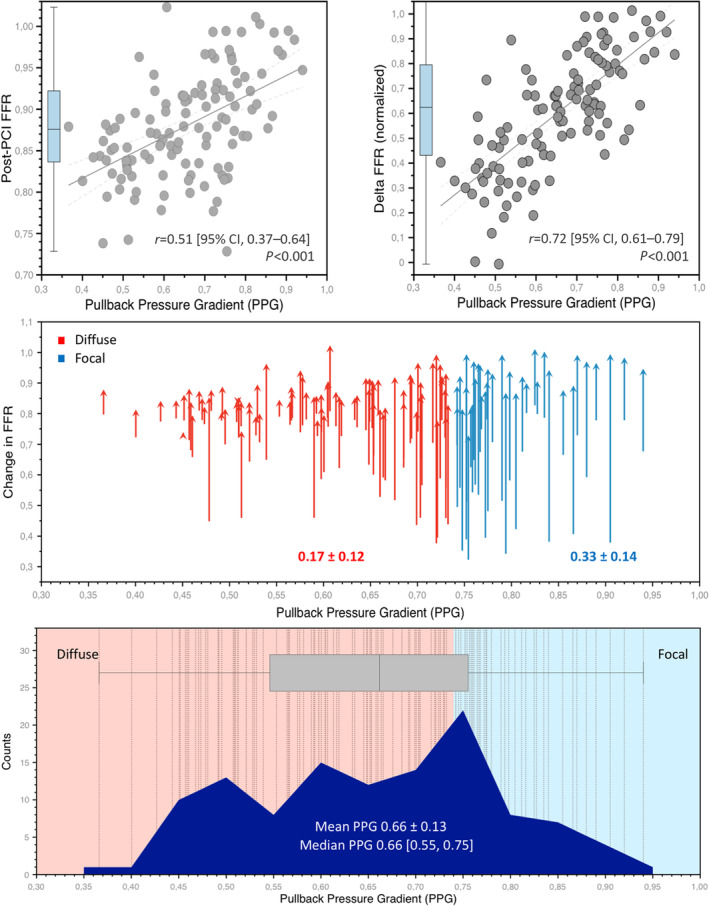
The top row shows the correlations between the PPG (x‐axes) and post‐PCI FFR (left), and delta FFR (right). In the mid panel, the changes in FFR stratified by the PPG are presented. The red arrows categorize patients with diffuse disease, whereas the blue arrows identify focal disease. The bottom panel shows the distribution of the PPG. The red shaded area points to PPG values considered diffuse CAD, whereas the blue shade is focal CAD. The dashed vertical lines show each vessel analyzed. CAD indicates coronary artery disease; FFR, fractional flow reserve; PCI, percutaneous coronary intervention; and PPG, pullback pressure gradient.
Figure 4. Proportions of patients attaining optimal anatomical and functional outcomes stratified by CAD patterns.
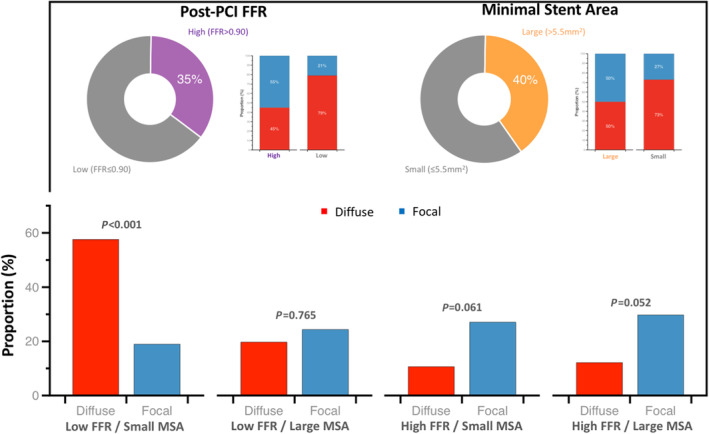
In the top panel, the pie charts show the proportion of patients achieving high post‐PCI FFR (defined as ≥0.90) and large MSA (>5.5 mm2). The stacked bars next to the pie charts show the proportion of patients with focal and diffuse CAD having high or low post‐PCI FFR (right) and large or small MSA (right). At the bottom, the proportion of patients with focal and diffuse CAD in the different morphological and functional PCI outcomes combination are shown. A significantly higher proportion of patients with diffuse disease had small MSA and low post‐PCI FFR. CAD indicates coronary artery disease; FFR, fractional flow reserve; MSA, minimal stent area; PCI, percutaneous coronary intervention; and PPG pullback pressure gradient.
Comparison Between Angiographic and Functional Patterns of CAD
Based on angiography, 67% (78/116) of the patients exhibited focal CAD. The agreement between anatomy and physiology for the CAD pattern was slight (Cohen's Kappa 0.15 [95% CI, 0.01–0.29]). Compared with the angiographic assessment of CAD patterns, the PPG significantly improved the capacity to predict optimal functional PCI results (AUCPPG 0.81 [95% CI, 0.73–0.88] versus AUCangio 0.51 [95% CI, 0.42–0.60]; P<0.001; Figure S3). Case examples of focal and diffuse disease are shown in Figure 5.
Figure 5. Case examples of focal and diffuse CAD.
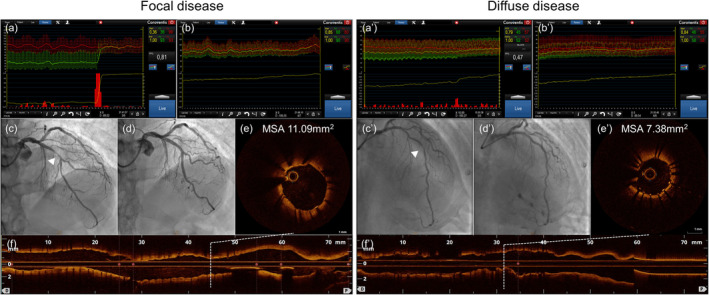
Left panel: Functional focal CAD, Right panel: Functional diffuse CAD. (a) and (a'): pre‐PCI FFR pullbacks. (b) and (b'): post‐PCI FFR and FFR pullbacks. (c) and (c'): pre‐PCI coronary angiography, white arrowheads show target lesions. (d) and (d'): post‐PCI angiographies. (e) and (e'): post‐PCI OCT with a cross‐sectional view at MSA. (f) and (f'): post‐PCI OCT longitudinal view indicating the position of the MSA. CAD indicates coronary artery disease; FFR, fractional flow reserve; MSA, minimum stent area; and OCT, optical coherence tomography; PCI, percutaneous coronary intervention; and PPG, pullback pressure gradient.
Clinical Outcomes in Patients With Focal and Diffuse CAD
After 12 months, the target vessel failure rate was 16.8% and did not differ between patients with focal and diffuse disease (odds ratio [OR] 0.85 [95% CI, 0.58–1.24]; Table 4). Postprocedural troponin values were higher in patients with diffuse compared with focal CAD (normalized post‐PCI troponin 0.99 [0.36, 3.66] in the focal group versus 2.59 [1.03, 11.46] in the diffuse group, P=0.037; Figure S4). The rate of periprocedural MI, according to the fourth universal definition, was comparable between patients with focal and diffuse CAD (10% in patients with focal CAD and 19% in patients with diffuse disease, P=0.35).
Table 4.
Clinical Outcomes at 1‐Year Follow‐Up
| Variables | Overall | Diffuse CAD | Focal CAD | P value* |
|---|---|---|---|---|
| Number of patients | 113 | 74 | 39 | |
| Target vessel failure | 19 (16.8%) | 14 (18.9%) | 5 (12.8%) | 0.576 |
| Cardiac death | 0 (0%) | 0 (0%) | 0 (0%) | NA |
| Myocardial infarction | 18 (15.9%) | 14 (18.9%) | 4 (10.3%) | 0.354 |
| Spontaneous myocardial infarction | 1 (0.9%) | 1 (1.4%) | 0 (0.0%) | 1.000 |
| Periprocedural myocardial infarction | 18 (15.9%) | 14 (18.9%) | 4 (10.3%) | 0.354 |
| Major periprocedural injury | 33 (29.2%) | 26 (35.1%) | 7 (17.9%) | 0.091 |
| Urgent target vessel revascularization | 1 (0.9%) | 0 (0.0%) | 1 (2.6%) | 0.744 |
| Stent thrombosis | 0 (0%) | 0 (0%) | 0 (0%) | NA |
CAD indicates coronary artery disease.
For comparing focal and diffuse using chi square.
DISCUSSION
The PPG—a novel metric that characterizes CAD patterns—identified patients in whom PCI resulted in superior procedural success. PCI in vessels with high PPG (focal disease) was associated with higher delta FFR, higher post‐PCI FFR, and larger MSA compared with vessels with low PPG (diffuse disease). The main determinant of functional improvement after PCI was the CAD pattern at baseline. Furthermore, CAD patterns based on coronary physiology increased the predictive capacity for optimal functional PCI results compared with the angiographic assessment alone.
Revascularization is considered appropriate when guided by the presence of ischemia. 17 Similarly important is the evaluation of CAD patterns (focal or diffuse). Coronary physiology with longitudinal vessel assessment can distinguish focal versus diffuse CAD. Pullback maneuvers can be performed during resting and hyperemic conditions to inform about the functional pattern of disease. The main added value of PPG over other pullback technologies (eg, instantaneous wave‐free ratio) is the quantification of the CAD pattern on a scale from 0 to 1, which may facilitate interpretation, and its use for clinical decision‐making. PPG is the first physiologic metric to quantify atherosclerosis distribution, and leverages intracoronary pressure gradients unmasked during hyperemic conditions. Characterizing disease patterns using coronary physiology reclassifies up to one third of patients compared with invasive angiography. 9 The presence of large, focal pressure gradients is the hallmark of focal CAD with high PPG values; conversely, their absence results in low PPG and typifies diffuse disease. In this way, PPG adds a second dimension to classical FFR measurements by providing information about the distribution of epicardial resistance. Thus, PPG appears useful after the hemodynamic significance of the total epicardial vessel has been established to further evaluate the appropriateness of PCI.
MSA and post‐PCI FFR carry prognostic information following PCI. 2 , 5 MSA is a strong predictor of drug‐eluting stent failure. Small MSA is associated with drug‐eluting stent restenosis, stent thrombosis, and target lesion revascularization. 2 , 6 , 18 Furthermore, MSA has been used as a surrogate endpoint in clinical trials. In practice, intravascular imaging has been recommended to safely achieve the largest stent lumen possible. 19 Likewise, low post‐PCI FFR has been associated with adverse clinical outcomes in several randomized and observational studies. 5 , 20 Low post‐PCI FFR has been associated with an increased risk of target vessel revascularization, MI, and cardiac death. 20 , 21 , 22 Similar to MSA, post‐PCI FFR has been proposed as a target for PCI optimization. 4 The present study provided a unique opportunity to assess changes in morphological and physiological parameters. Suboptimal PCI results based on intravascular imaging (MSA ≤5.5 mm2) and physiology (post‐PCI FFR ≤0.90) were observed in 60% and 65% of patients, respectively. Furthermore, the presence of both suboptimal imaging and functional findings were observed in 44% of the cases, and suboptimal PCI criteria were clustered in patients with diffuse CAD (58% diffuse versus 19% focal, P<0.001). Nonetheless, it should be highlighted that in the present study, there was no difference in clinical outcomes between patients with focal and diffuse disease defined by the PPG.
The associations among CAD patterns quantified by PPG, MSA, and post‐PCI FFR were observed when PPG was used as a continuous variable, suggesting that PPG should be interpreted as a continuous metric rather than using a dichotomous approach. The mechanisms underlying the association between low PPG and suboptimal PCI results relate to both the stented and nonstented segments. In diffusely diseased vessels, lumen reduction due to atherosclerosis leads to smaller MSA. 23 , 24 On the other hand, the main contributor to low post‐PCI FFR was the presence of pressure losses proximal and distal to treated lesions. 8 , 25 Of note, the rate of stent edge dissections was numerically higher in vessels with low PPG. This has been related to diffuse atherosclerosis present at stent edges. 7 OCT detection of stent edge dissections has also been identified as a major predictor of major adverse clinical outcomes at mid‐ and long‐term follow‐up. 6
Periprocedural MI is one of the shortcomings of PCI. In the ISCHEMIA (International Study of Comparative Health Effectiveness With Medical and Invasive Approaches) study, PCI‐related MI (ie, type 4a according to the fourth universal definition) significantly influenced the results of the study, offsetting the reduction in spontaneous MI observed with an invasive strategy. 26 , 27 Consequently, strategies aiming at reducing periprocedural PCI risk could translate into patient benefit. Compared with focal CAD, PCI in diffusely diseased vessels usually requires longer and more stents, thereby increasing the risk of side branch(es) occlusion and stent‐induced dissection. In the present study, patients with diffuse disease, defined by a PPG<0.60, had significantly higher troponin levels after PCI and had a trend toward higher rates of major periprocedural injury (35% versus 18%, P=0.09) that in turn have been associated with adverse long‐term outcomes. 15 However, there was no difference in the rate of periprocedural MI (defined by the fourth universal definition) between patients with focal and diffuse CAD. It can be hypothesized that a strategy of thoughtful PCI in vessels with high PPG while deferring PCI in vessels with diffuse disease may increase procedural safety by reducing PCI‐related myocardial injury.
Despite the long‐standing awareness of the adverse scenario that diffuse CAD poses for PCI, differentiation of CAD patterns in clinical practice remains suboptimal, partly related to the lack of standardized criteria. Coronary pressure pullbacks have been used since the early days of interventional cardiology because they help in depicting the distribution of epicardial resistance and select an optimal interventional strategy. 28 The PPG allows stratificatifyingpatients with hemodynamically significant lesions into focal or diffuse CAD using a scale from 0 to 1. PPG is an objective, operator‐independent method that can be obtained with high reproducibility after manual FFR pullback maneuvers. 29 This additional level of disease discrimination opens the door for personalized management of patients with CAD. Based on the results of the present study, patients with high PPG appear to derive the greatest benefit from PCI. Long‐term follow‐up in a larger population is required to assess whether patients with focal disease have an improved prognosis after PCI compared with those with diffuse CAD. This is currently being investigated in the PPG Global registry (NCT04789317), where approximately 1000 subjects undergoing PCI will be assessed by the PPG and will be followed clinically for 3 years.
Limitations
First, a relatively small number of patients was included; this resulted in limited statistical power to assess differences in clinical outcomes between focal and diffuse CAD. Nonetheless, we evaluated post‐PCI FFR and MSA, 2 surrogate markers of adverse events after PCI. Second, motorized FFR pullbacks were used for the PPG calculation which is unpractical for daily practice. However, the PPG can be similarly derived from manual FFR pullbacks with excellent reproducibility. 29 Third, the definition of focal CAD was based on the highest tertile of the PPG distribution rather than a threshold. . The investigation of a PPG cutoff and the clinical impact of focal and diffuse CAD in a larger population is currently ongoing in the PPG Global registry (NCT04789317).
CONCLUSIONS
PCI in patients with focal CAD defined by the PPG resulted in greater improvement in FFR and larger MSA compared with patients with diffuse disease. Optimal PCI results (high post‐PCI FFR and large MSA) were clustered in patients with focal disease. By identifying, before treatment, in which patients PCI will achieve superior results, the PPG may be useful in enhancing patients' selection for revascularization. Further randomized clinical trials are required to investigate the value of a PPG‐guided PCI strategy.
Sources of Funding
The study was sponsored by the Cardiac Research Institute Aalst with aunrestricted grants from HeartFlow and Cardiopath.
Disclosures
T.M. reports receiving consulting fees from Zeon Medical and HeartFlow and speaker fees from Abbott Vascular. B.K. reports receiving consulting fees from Canon Medical, Abbott, and Medtronic. M.M. reports receiving advisory board and lecture fees from Novo Nordics and research grants from Bayer. H.O. reports receiving research grants from Abbott Vascular, and speaker fees from HeartFlow and Abbott Vascular. B.K.K. reports receiving institutional research grants from HeartFlow. B.L.N. reports receiving unrestricted institutional research grants from Siemens and HeartFlow. J.L. is a consultant and reports holding stock options in Circle Cardiovascular Imaging and HeartFlow, receiving a research grant from GE Healthcare, and modest speaker fees from GE Healthcare and Philips. T.S. reports receiving research grants from Boston Scientific and Abbott Vascular. D.M. reports receiving research grants provided by the Cardiopath Ph.D. program. E.B. reports receiving speaker's fees from Boston Scientific, Abbott Vascular, GE Healthcare, and Insight Lifetech. N.P.J. received internal funding from the Weatherhead PET Center for Preventing and Reversing Atherosclerosis; received significant institutional research support from St. Jude Medical (CONTRAST, NCT02184117) and Philips/Volcano Corporation (DEFINE‐FLOW, NCT02328820) for studies using intracoronary pressure and flow sensors; has an institutional licensing agreement with Boston Scientific for the smart‐minimum FFR algorithm commercialized under 510(k) K191008; and has pending patents on diagnostic methods for quantifying aortic stenosis and transcatheter aortic valve implantation physiology, and also algorithms to correct pressure tracings from fluid‐filled catheters. B.D.B. reports receiving consultancy fees from Boston Scientific and Abbott Vascular, research grants from Coroventis Research, Pie Medical Imaging, CathWorks, Boston Scientific, Siemens, HeartFlow, and Abbott Vascular, and owning equity in Siemens, GE Healthcare, Philips, HeartFlow, Edwards Life Sciences, Bayer, Sanofi, Celyad. C.C. reports receiving institutional research grants from GE Healthcare, Siemens, Insight Lifetech, Coroventis Research, Medis Medical Imaging, Pie Medical Imaging, CathWorks, Boston Scientific, HeartFlow, Abbott Vascular, and consultancy fees from HeartFlow, Abbott Vascular, and Cryotherapeutics. The other authors have no further disclosures.
Supporting information
Table S1
Figures S1–S4
Acknowledgments
We appreciate the support of the coinvestigators participating in the Precise PCI Plan study.
T. Mizukami and J. Sonck contributed equally.
For Sources of Funding and Disclosures, see page 12.
References
- 1. Kang SJ, Ahn JM, Song H, Kim WJ, Lee JY, Park DW, Yun SC, Lee SW, Kim YH, Lee CW, et al. Comprehensive intravascular ultrasound assessment of stent area and its impact on restenosis and adverse cardiac events in 403 patients with unprotected left main disease. Circ Cardiovasc Interv. 2011;4:562–569. doi: 10.1161/circinterventions.111.964643 [DOI] [PubMed] [Google Scholar]
- 2. Song HG, Kang SJ, Ahn JM, Kim WJ, Lee JY, Park DW, Lee SW, Kim YH, Lee CW, Park SW, et al. Intravascular ultrasound assessment of optimal stent area to prevent in‐stent restenosis after zotarolimus‐, everolimus‐, and sirolimus‐eluting stent implantation. Catheter Cardiovasc Interv. 2014;83:873–878. doi: 10.1002/ccd.24560 [DOI] [PubMed] [Google Scholar]
- 3. Fournier S, Ciccarelli G, Toth GG, Milkas A, Xaplanteris P, Tonino PAL, Fearon WF, Pijls NHJ, Barbato E, De Bruyne B. Association of improvement in fractional flow reserve with outcomes, including symptomatic relief, after percutaneous coronary intervention. JAMA Cardiol. 2019;4:370–374. doi: 10.1001/jamacardio.2019.0175 [DOI] [PMC free article] [PubMed] [Google Scholar]
- 4. Collison D, Didagelos M, Aetesam‐Ur‐Rahman M, Copt S, McDade R, McCartney P, Ford TJ, McClure J, Lindsay M, Shaukat A, et al. Post‐stenting fractional flow reserve vs coronary angiography for optimisation of percutaneous coronary intervention: TARGET‐FFR trial. Eur Heart J. 2021;42:4656–4668. doi: 10.1093/eurheartj/ehab449 [DOI] [PMC free article] [PubMed] [Google Scholar]
- 5. Piroth Z, Toth GG, Tonino PAL, Barbato E, Aghlmandi S, Curzen N, Rioufol G, Pijls NHJ, Fearon WF, Jüni P, et al. Prognostic value of fractional flow reserve measured immediately after drug‐eluting stent implantation. Circ Cardiovasc Interv. 2017;10:10. doi: 10.1161/circinterventions.116.005233 [DOI] [PubMed] [Google Scholar]
- 6. Prati F, Romagnoli E, Burzotta F, Limbruno U, Gatto L, La Manna A, Versaci F, Marco V, Di Vito L, Imola F, et al. Clinical impact of OCT findings during PCI: the CLI‐OPCI II study. JACC Cardiovasc Imaging. 2015;8:1297–1305. doi: 10.1016/j.jcmg.2015.08.013 [DOI] [PubMed] [Google Scholar]
- 7. Crea F, Bairey Merz CN, Beltrame JF, Berry C, Camici PG, Kaski JC, Ong P, Pepine CJ, Sechtem U, Shimokawa H. Mechanisms and diagnostic evaluation of persistent or recurrent angina following percutaneous coronary revascularization. Eur Heart J. 2019;40:2455–2462. doi: 10.1093/eurheartj/ehy857 [DOI] [PubMed] [Google Scholar]
- 8. Ando H, Takashima H, Suzuki A, Sakurai S, Kumagai S, Kurita A, Waseda K, Amano T. Impact of lesion characteristics on the prediction of optimal poststent fractional flow reserve. Am Heart J. 2016;182:119–124. doi: 10.1016/j.ahj.2016.09.015 [DOI] [PubMed] [Google Scholar]
- 9. Collet C, Sonck J, Vandeloo B, Mizukami T, Roosens B, Lochy S, Argacha J‐F, Schoors D, Colaiori I, Di Gioia G, et al. Measurement of hyperemic pullback pressure gradients to characterize patterns of coronary atherosclerosis. J Am Coll Cardiol. 2019;74:1772–1784. doi: 10.1016/j.jacc.2019.07.072 [DOI] [PubMed] [Google Scholar]
- 10. Nagumo S, Collet C, Norgaard BL, Otake H, Ko B, Koo BK, Leipsic J, Andreini D, Heggermont W, Jensen JM, et al. Rationale and design of the precise percutaneous coronary intervention plan (P3) study: prospective evaluation of a virtual computed tomography‐based percutaneous intervention planner. Clin Cardiol. 2021;44:446–454. doi: 10.1002/clc.23551 [DOI] [PMC free article] [PubMed] [Google Scholar]
- 11. Sonck J, Nagumo S, Norgaard BL, Otake H, Ko B, Zhang J, Mizukami T, Maeng M, Andreini D, Takahashi Y, et al. Clinical Validation of a Virtual Planner for Coronary Interventions Based on Coronary CT Angiography. JACC Cardiovasc Imaging. 2022;15 :1242–1255. doi: 10.1016/j.jcmg.2022.02.003 [DOI] [PubMed] [Google Scholar]
- 12. Sianos G, Morel MA, Kappetein AP, Morice MC, Colombo A, Dawkins K, van den Brand M, Van Dyck N, Russell ME, Mohr FW, et al. The SYNTAX score: an angiographic tool grading the complexity of coronary artery disease. EuroIntervention. 2005;1:219–227. [PubMed] [Google Scholar]
- 13. Toth GG, Johnson NP, Jeremias A, Pellicano M, Vranckx P, Fearon WF, Barbato E, Kern MJ, Pijls NH, De Bruyne B. Standardization of fractional flow reserve measurements. J Am Coll Cardiol. 2016;68:742–753. doi: 10.1016/j.jacc.2016.05.067 [DOI] [PubMed] [Google Scholar]
- 14. Rimac G, Fearon WF, De Bruyne B, Ikeno F, Matsuo H, Piroth Z, Costerousse O, Bertrand OF. Clinical value of post‐percutaneous coronary intervention fractional flow reserve value: a systematic review and meta‐analysis. Am Heart J. 2017;183:1–9. doi: 10.1016/j.ahj.2016.10.005 [DOI] [PubMed] [Google Scholar]
- 15. Bulluck H, Paradies V, Barbato E, Baumbach A, Bøtker HE, Capodanno D, De Caterina R, Cavallini C, Davidson SM, Feldman DN, et al. Prognostically relevant periprocedural myocardial injury and infarction associated with percutaneous coronary interventions: a consensus document of the ESC working group on cellular biology of the heart and European Association of Percutaneous Cardiovascular Interventions (EAPCI). Eur Heart J. 2021;42:2630–2642. doi: 10.1093/eurheartj/ehab271 [DOI] [PMC free article] [PubMed] [Google Scholar]
- 16. Taylor CA, Fonte TA, Min JK. Computational fluid dynamics applied to cardiac computed tomography for noninvasive quantification of fractional flow reserve: scientific basis. J Am Coll Cardiol. 2013;61:2233–2241. doi: 10.1016/j.jacc.2012.11.083 [DOI] [PubMed] [Google Scholar]
- 17. Patel MR, Calhoon JH, Dehmer GJ, Grantham JA, Maddox TM, Maron DJ, Smith PK. ACC/AATS/AHA/ASE/ASNC/SCAI/SCCT/STS 2017 appropriate use criteria for coronary revascularization in patients with stable ischemic heart disease: a report of the American College of Cardiology appropriate use criteria task force, American Association for Thoracic Surgery, American Heart Association, American Society of Echocardiography, American Society of Nuclear Cardiology, Society for Cardiovascular Angiography and Interventions, Society of Cardiovascular Computed Tomography, and Society of Thoracic Surgeons. J Am Coll Cardiol. 2017;69:2212–2241. doi: 10.1016/j.jacc.2017.02.001 [DOI] [PubMed] [Google Scholar]
- 18. Soeda T, Uemura S, Park SJ, Jang Y, Lee S, Cho JM, Kim SJ, Vergallo R, Minami Y, Ong DS, et al. Incidence and clinical significance of poststent optical coherence tomography findings: one‐year follow‐up study from a multicenter registry. Circulation. 2015;132:1020–1029. doi: 10.1161/circulationaha.114.014704 [DOI] [PubMed] [Google Scholar]
- 19. Ali Z, Landmesser U, Karimi Galougahi K, Maehara A, Matsumura M, Shlofmitz RA, Guagliumi G, Price MJ, Hill JM, Akasaka T, et al. Optical coherence tomography‐guided coronary stent implantation compared to angiography: a multicentre randomised trial in PCI ‐ design and rationale of ILUMIEN IV: OPTIMAL PCI. EuroIntervention. 2021;16:1092–1099. doi: 10.4244/eij-d-20-00501 [DOI] [PMC free article] [PubMed] [Google Scholar]
- 20. Agarwal SK, Kasula S, Hacioglu Y, Ahmed Z, Uretsky BF, Hakeem A. Utilizing post‐intervention fractional flow reserve to optimize acute results and the relationship to long‐term outcomes. JACC Cardiovasc Interv. 2016;9:1022–1031. doi: 10.1016/j.jcin.2016.01.046 [DOI] [PubMed] [Google Scholar]
- 21. Diletti R, Masdjedi K, Daemen J, van Zandvoort LJC, Neleman T, Wilschut J, Den Dekker WK, van Bommel RJ, Lemmert M, Kardys I, et al. Impact of poststenting fractional flow reserve on long‐term clinical outcomes: the FFR‐SEARCH study. Circ Cardiovasc Interv. 2021;14:e009681. doi: 10.1161/circinterventions.120.009681 [DOI] [PMC free article] [PubMed] [Google Scholar]
- 22. Li SJ, Ge Z, Kan J, Zhang JJ, Ye F, Kwan TW, Santoso T, Yang S, Sheiban I, Qian XS, et al. Cutoff value and long‐term prediction of clinical events by FFR measured immediately after implantation of a drug‐eluting stent in patients with coronary artery disease: 1‐ to 3‐year results from the DKCRUSH VII registry study. JACC Cardiovasc Interv. 2017;10:986–995. doi: 10.1016/j.jcin.2017.02.012 [DOI] [PubMed] [Google Scholar]
- 23. Schoenhagen P, Ziada KM, Vince DG, Nissen SE, Tuzcu EM. Arterial remodeling and coronary artery disease: the concept of "dilated" versus "obstructive" coronary atherosclerosis. J Am Coll Cardiol. 2001;38:297–306. doi: 10.1016/s0735-1097(01)01374-2 [DOI] [PubMed] [Google Scholar]
- 24. Seiler C, Kirkeeide RL, Gould KL. Basic structure‐function relations of the epicardial coronary vascular tree. Basis of quantitative coronary arteriography for diffuse coronary artery disease. Circulation. 1992;85:1987–2003. doi: 10.1161/01.cir.85.6.1987 [DOI] [PubMed] [Google Scholar]
- 25. Wolfrum M, De Maria GL, Benenati S, Langrish J, Lucking AJ, Channon KM, Kharbanda RK, Banning AP. What are the causes of a suboptimal FFR after coronary stent deployment? Insights from a consecutive series using OCT imaging. EuroIntervention. 2018;14:e1324–e1331. doi: 10.4244/eij-d-18-00071 [DOI] [PubMed] [Google Scholar]
- 26. Maron DJ, Hochman JS, Reynolds HR, Bangalore S, O'Brien SM, Boden WE, Chaitman BR, Senior R, López‐Sendón J, Alexander KP, et al. Initial invasive or conservative strategy for stable coronary disease. N Engl J Med. 2020;382:1395–1407. doi: 10.1056/NEJMoa1915922 [DOI] [PMC free article] [PubMed] [Google Scholar]
- 27. Chaitman BR, Reynolds HR, Maron DJ, Hochman JS. Response by Chaitman et al to letter regarding article, "myocardial infarction in the ISCHEMIA trial: impact of different definitions on incidence, prognosis, and treatment comparisons". Circulation. 2021;144:e14–e15. doi: 10.1161/circulationaha.121.055296 [DOI] [PubMed] [Google Scholar]
- 28. Grüntzig AR, Senning A, Siegenthaler WE. Nonoperative dilatation of coronary‐artery stenosis: percutaneous transluminal coronary angioplasty. N Engl J Med. 1979;301:61–68. doi: 10.1056/nejm197907123010201 [DOI] [PubMed] [Google Scholar]
- 29. Sonck J, Mizukami T, Johnson NP, Nagumo S, Gallinoro E, Candreva A, Mileva N, Munhoz D, Shinke T, Svanerud J, et al. Development, validation, and reproducibility of the pullback pressure gradient (PPG) derived from manual fractional flow reserve pullbacks. Catheter Cardiovasc Interv. 2022;99:1518–1525. doi: 10.1002/ccd.30064 [DOI] [PubMed] [Google Scholar]
Associated Data
This section collects any data citations, data availability statements, or supplementary materials included in this article.
Supplementary Materials
Table S1
Figures S1–S4