

Abstract
Rationale
Cross-sectional analysis of mucus plugs in computed tomography (CT) lung scans in the Severe Asthma Research Program (SARP)-3 showed a high mucus plug phenotype.
Objectives
To determine if mucus plugs are a persistent asthma phenotype and if changes in mucus plugs over time associate with changes in lung function.
Methods
In a longitudinal analysis of baseline and Year 3 CT lung scans in SARP-3 participants, radiologists generated mucus plug scores to assess mucus plug persistence over time. Changes in mucus plug score were analyzed in relation to changes in lung function and CT air trapping measures.
Measurements and Main Results
In 164 participants, the mean (range) mucus plug score was similar at baseline and Year 3 (3.4 [0–20] vs. 3.8 [0–20]). Participants and bronchopulmonary segments with a baseline plug were more likely to have plugs at Year 3 than those without baseline plugs (risk ratio, 2.8; 95% confidence interval [CI], 2.0–4.1; P < 0.001; and risk ratio, 5.0; 95% CI, 4.5–5.6; P < 0.001, respectively). The change in mucus plug score from baseline to Year 3 was significantly negatively correlated with change in FEV1% predicted (rp = −0.35; P < 0.001) and with changes in CT air trapping measures (all P values < 0.05).
Conclusions
Mucus plugs identify a persistent asthma phenotype, and susceptibility to mucus plugs occurs at the subject and the bronchopulmonary segment level. The association between change in mucus plug score and change in airflow over time supports a causal role for mucus plugs in mechanisms of airflow obstruction in asthma.
Keywords: asthma, mucus plugs, eosinophils, computed tomography, air trapping
At a Glance Commentary
Scientific Knowledge on the Subject
Airway mucus plugs have previously been identified in patients with asthma but have not been evaluated longitudinally.
What This Study Adds to the Field
Airway mucus plugs persist in a subset of patients with asthma. Mucus plug scores correlate with changes in airflow over the 3-year time period, which suggests that airway mucus plugs are a mechanism of airflow obstruction that can be therapeutically targeted.
It has long been known that mucus plugs occlude the airways in acute severe asthma (1–7). More recently, mucus plugs have also been shown to occlude the airways in chronic severe asthma (8). Specifically, analysis of multidetector computed tomography (MDCT) lung scans taken at the baseline characterization phase of the Severe Asthma Research Program (SARP)-3 cohort showed that airway mucus plugs occlude segmental and subsegmental airways in a large subset of participants (8). Participants with high mucus plug scores were characterized by more severe airflow obstruction and increased numbers of eosinophils in sputum (8). Surprisingly, participants with high mucus plug scores did not have higher symptom scores for cough and sputum production than participants with low or absent airway mucus plugs (8).
The high percentage of airway mucus plugs previously reported in the SARP-3 cohort at baseline (58% of participants) together with preliminary data suggesting persistence of mucus plugs over time led us to hypothesize that mucus plugs identify a persistent asthma phenotype that occurs in a susceptible subset of patients with asthma. We also hypothesized that airway mucus plugs are a mechanism of airflow obstruction in asthma and that changes in airway mucus plug score over time would associate with parallel changes in airflow obstruction. SARP-3 is a longitudinal cohort study that includes sequential deep phenotyping in consecutive years (9). We took advantage of this design here to determine if mucus plugs are a persistent asthma phenotype and to explore if variability in airway mucus plugs over time is linked to variability in lung function. Because our prior study proposed a mechanism by which eosinophil peroxidase generates oxidant acids to cross-link mucin polymers and stiffen mucus gels (8), we also investigated whether changes in blood and sputum eosinophils over time correlate with changes in airway mucus plug scores. Our overarching aim was to assess whether longitudinal persistence of plugs supported a causative role of mucus plugs in airflow obstruction.
Methods
Participants
Healthy control subjects and participants with asthma were recruited as part of the NHLBI SARP-3, a multiyear longitudinal cohort study in children and adults (9). Among participants in SARP-3, 60% have severe asthma as defined by the American Thoracic Society/European Respiratory Society consensus (10). Study participants underwent detailed characterizations at regular intervals for 3–5 years (see Figure E1 in the online supplement). The characterization procedures included questionnaires, spirometry, biospecimen collection (induced sputum, exhaled breath, and venous blood), an optional MDCT scan of the lungs, and repeat characterization after an intramuscular injection of 40 mg triamcinolone acetonide (9). Data reported here are from adult participants who had MDCT lung scans at both baseline and Year 3 visits. The SARP-3 protocol was approved by the institutional review board at each participating institution, and all the participants provided written informed consent.
Study Overview
MDCT lung scans from adult SARP-3 participants at the baseline and Year 3 visits were analyzed to determine the longitudinal behavior of mucus plugs over time. Airway mucus plugs were identified and scored by visual inspection by experienced thoracic radiologists. The persistence of mucus plugs over time was assessed at the participant level and at the bronchopulmonary segment level, and time-related changes in mucus plugs were analyzed in relation to changes in airflow obstruction and sputum eosinophils. Airflow obstruction was assessed using measures from spirometry and multiple quantitative measures of air trapping in the MDCT lung scans.
MDCT Mucus Plug Score
Four radiologists with subspecialty training in thoracic radiology scored mucus plugs on the MDCT scans using a scoring system based on bronchopulmonary segment anatomy, as described previously (8). Each participant’s CT lung scan was randomly assigned to be independently scored by two of the four radiologists to ensure a relatively even representation of each radiologist pair in the analysis. For a given participant, the same two radiologists scored the baseline and Year 3 scans in random order. The radiologists analyzing the scans were blinded to clinical details of the participants and entered their data in real time into a secure online study survey instrument (Research Electronic Data Capture). We explored persistence of airway mucus plugs at the participant level and the bronchopulmonary segment level using methods detailed in the online supplement. The change in mucus plug score was calculated as the difference between the Year 3 mucus plug score and the baseline mucus plug score.
Chronic Mucus Hypersecretion
Chronic mucus hypersecretion was defined as cough and sputum production on most days for at least 3 months a year for at least 2 consecutive years (11)
Change in Lung Function Measures
Because the baseline CT scan could be obtained at different visits, we selected the baseline spirometry closest to the CT scan date (Figure E1). The change in lung function was calculated as the difference between the Year 3 and baseline lung function. Previous work in SARP has also examined longitudinal change in lung function by calculating the annualized rate of change (slope) (12). Additional analysis was done with the annualized rate of change in lung function using available lung function values from baseline, Year 1, Year 2, and Year 3.
Change in Air Trapping Measures
Quantitative measures of airway and lung morphology were generated using Apollo 2.0 software (VIDA Diagnostics, Inc.), as described previously (13–15). Air trapping measures included density-based measures of air trapping (percentage of voxels below −856Hounsfield units [HU] at functional residual capacity) (16), Jacobian measure of lung volume change (calculated as the ratio of lung volume at inspiration over the lung volume at expiration), and functional small airway disease (disease probability measure of gas trapping based on the distribution of HU between inspiration and expiration) (17–19). The change in air trapping measures was calculated as the difference between the Year 3 and baseline air trapping measure.
Change in Eosinophil Measures
Change in eosinophils was calculated as the difference between the Year 3 and baseline eosinophil measure. Previous work in SARP has also examined longitudinal change in sputum granulocytes into categorical subgroups (20). To compare with lung function analyses, the annualized rate of change (slope) in sputum eosinophils was calculated using available sputum eosinophil values from baseline, Year 1, Year 2, and Year 3. This was determined in participants with acceptable sputum differentials in at least three visits, which has been validated to identify inflammatory phenotypes (21). This was calculated in sputum eosinophils, which were obtained annually, and not in blood eosinophils, which were obtained at baseline and Year 3.
Statistics
Analyses were performed using R, and figures were created in GraphPad PRISM (22). Agreement between raters for mucus plug scores was quantified using the intraclass correlation coefficient calculated with a one-way random effects ANOVA model. Categorical variables were presented as frequency (percentage) and evaluated by chi-square analysis. Continuous variables that displayed roughly symmetric distributions were summarized by mean (SD) and evaluated by ANOVA. Continuous variables that displayed skewed distributions were summarized by median (quartiles) and evaluated by nonparametric methods, including the Kruskal-Wallis test. To examine the longitudinal change in mucus plugs, we used Sankey diagrams and state transition diagrams (23, 24). Pearson’s correlation coefficient was used to assess the relationship between continuous variables. Best-fit lines were constructed using least squares regression. Multivariable analyses were calculated using linear regression models. Linear regression analyses were performed to: 1) evaluate the effect of mucus plug score on spirometry and air trapping measures adjusting for age, baseline blood eosinophils, and site; and 2) evaluate the effect of eosinophil measures on mucus plug score adjusting for age and site. These adjustment covariates represent the minimal adjustments sets identified from directed acyclic graphs (Figure E2). Sensitivity analyses were performed excluding participants who had no change in mucus plug score. Poisson regression was used to analyze effects on cumulative exacerbations. Although all participants had CT mucus plug scores measured, not all participants had data for every study outcome, and analyses used available data (Table E1). In all instances, P values < 0.05 were taken as statistically significant.
Results
A total of 164 adult participants had MDCT lung scans at their baseline and Year 3 visits in SARP-3. Each scan was analyzed by two thoracic radiologists to generate a mucus plug score based on summing of the bronchopulmonary segment scores. The intraclass correlation coefficient for between-rater mucus plug score agreement was 0.80 (95% confidence interval [CI], 0.73–0.85) for the baseline visit scans and 0.84 (95% CI, 0.78–0.88) for the Year 3 visit scans.
Mucus Plugs Persist over 3 Years in the Same Participants and Bronchopulmonary Segments
Visual inspection of CT scans showed multiple examples where mucus plugs occluded the same airway at baseline and Year 3 (Figure 1 and Figure E3). More than half of the MDCT lung scans from the baseline and Year 3 visits had a mucus plug score of at least 1, and the mean (range) mucus plug score was 3.4 (0–20) at baseline and 3.8 (0–20) at Year 3 (Figures 2A and 2B). The distribution of scores was remarkably similar at both time points (Figures 2A and 2B). We noted that 53% of participants had the same mucus plug score at baseline and Year 3 and that similar numbers of participants increased or decreased their mucus plug score (Figure E4).
Figure 1.

Mucus plug identified in the same airway in baseline and Year 3 multidetector computed tomography lung scans. Yellow arrowheads indicate mucus plug, and orange arrowheads indicate blood vessel.
Figure 2.

Persistence of mucus plugs from baseline to Year 3: subject-level and segment-level susceptibility. (A) Mucus plug score in participants at baseline and Year 3. Horizontal lines indicate the mean mucus plug score. (B) Frequency distribution of mucus plug score in participants at baseline and Year 3. (C) Sankey plot showing the change in mucus plug status in participants from baseline to Year 3. (D) State transition diagram showing the transitions in mucus plug status in participants from baseline to Year 3. (E) Sankey plot showing the change in mucus plug status in bronchopulmonary segments from baseline to Year 3. (F) State transition diagram showing the transitions in mucus plug status in bronchopulmonary segments from baseline to Year 3.
We explored persistence of airway mucus plugs at the participant level and the bronchopulmonary segment level. To do this, we first generated a Sankey diagram, which showed that participants who had mucus plugs at baseline tended to have mucus plugs at Year 3, while those free of mucus plugs at baseline tended to remain free (Figure 2C). As a more quantitative analysis, we used a state transition diagram to demonstrate that 82% of participants with airway mucus plugs at baseline also had mucus plugs at Year 3, whereas 71% of participants without visible mucus plugs at baseline remained without mucus plugs at Year 3 (Figure 2D). Calculation of the risk ratio (RR) showed that participants with an airway mucus plug at baseline were much more likely to have a plug at Year 3 than participants without mucus plugs at baseline (RR, 2.8; 95% CI, 2.0–4.1; P < 0.001).
We next explored persistence of airway mucus plugs at the level of the bronchopulmonary segment. In an analysis of 3,280 bronchopulmonary segments (164 participants × 20 segments), a Sankey diagram showed qualitatively that segments with a mucus plug at baseline tended to remain mucus plugged at Year 3, whereas segments without visible mucus plugs at baseline tended to remain without mucus plugs at Year 3 (Figure 2E). Here, the state transition diagram showed that 65% of segments with airway mucus plugs at baseline also had mucus plugs at Year 3, whereas 87% of segments without mucus plugs at baseline remained without mucus plugs at Year 3 (Figure 2F). The risk ratio showed that a segment with an airway mucus plug at baseline was significantly more likely to have a plug at Year 3 than segments with no baseline mucus plugs (RR, 5.0; 95% CI, 4.5–5.6; P < 0.001).
Anatomic Distribution of Mucus Plugs
To explore if the persistence of airway mucus plugs varied with lung anatomy, we analyzed the anatomic distribution of persistent (plugs present at baseline and Year 3) and intermittent (plugs present only at baseline or Year 3) mucus plugs. We found that the frequency of persistent and intermittent airway mucus plugs was similar in the right and left lungs (Figure 3A) but that both persistent and intermittent mucus plugs were more frequent in the lower lobes (Figure 3B). The posterior segments in the right lower lobe and left lower lobe had a higher frequency of persistent and intermittent mucus plugs than other bronchopulmonary segments (chi-square = 56.7; P = 0.026) (Figure 3C).
Figure 3.
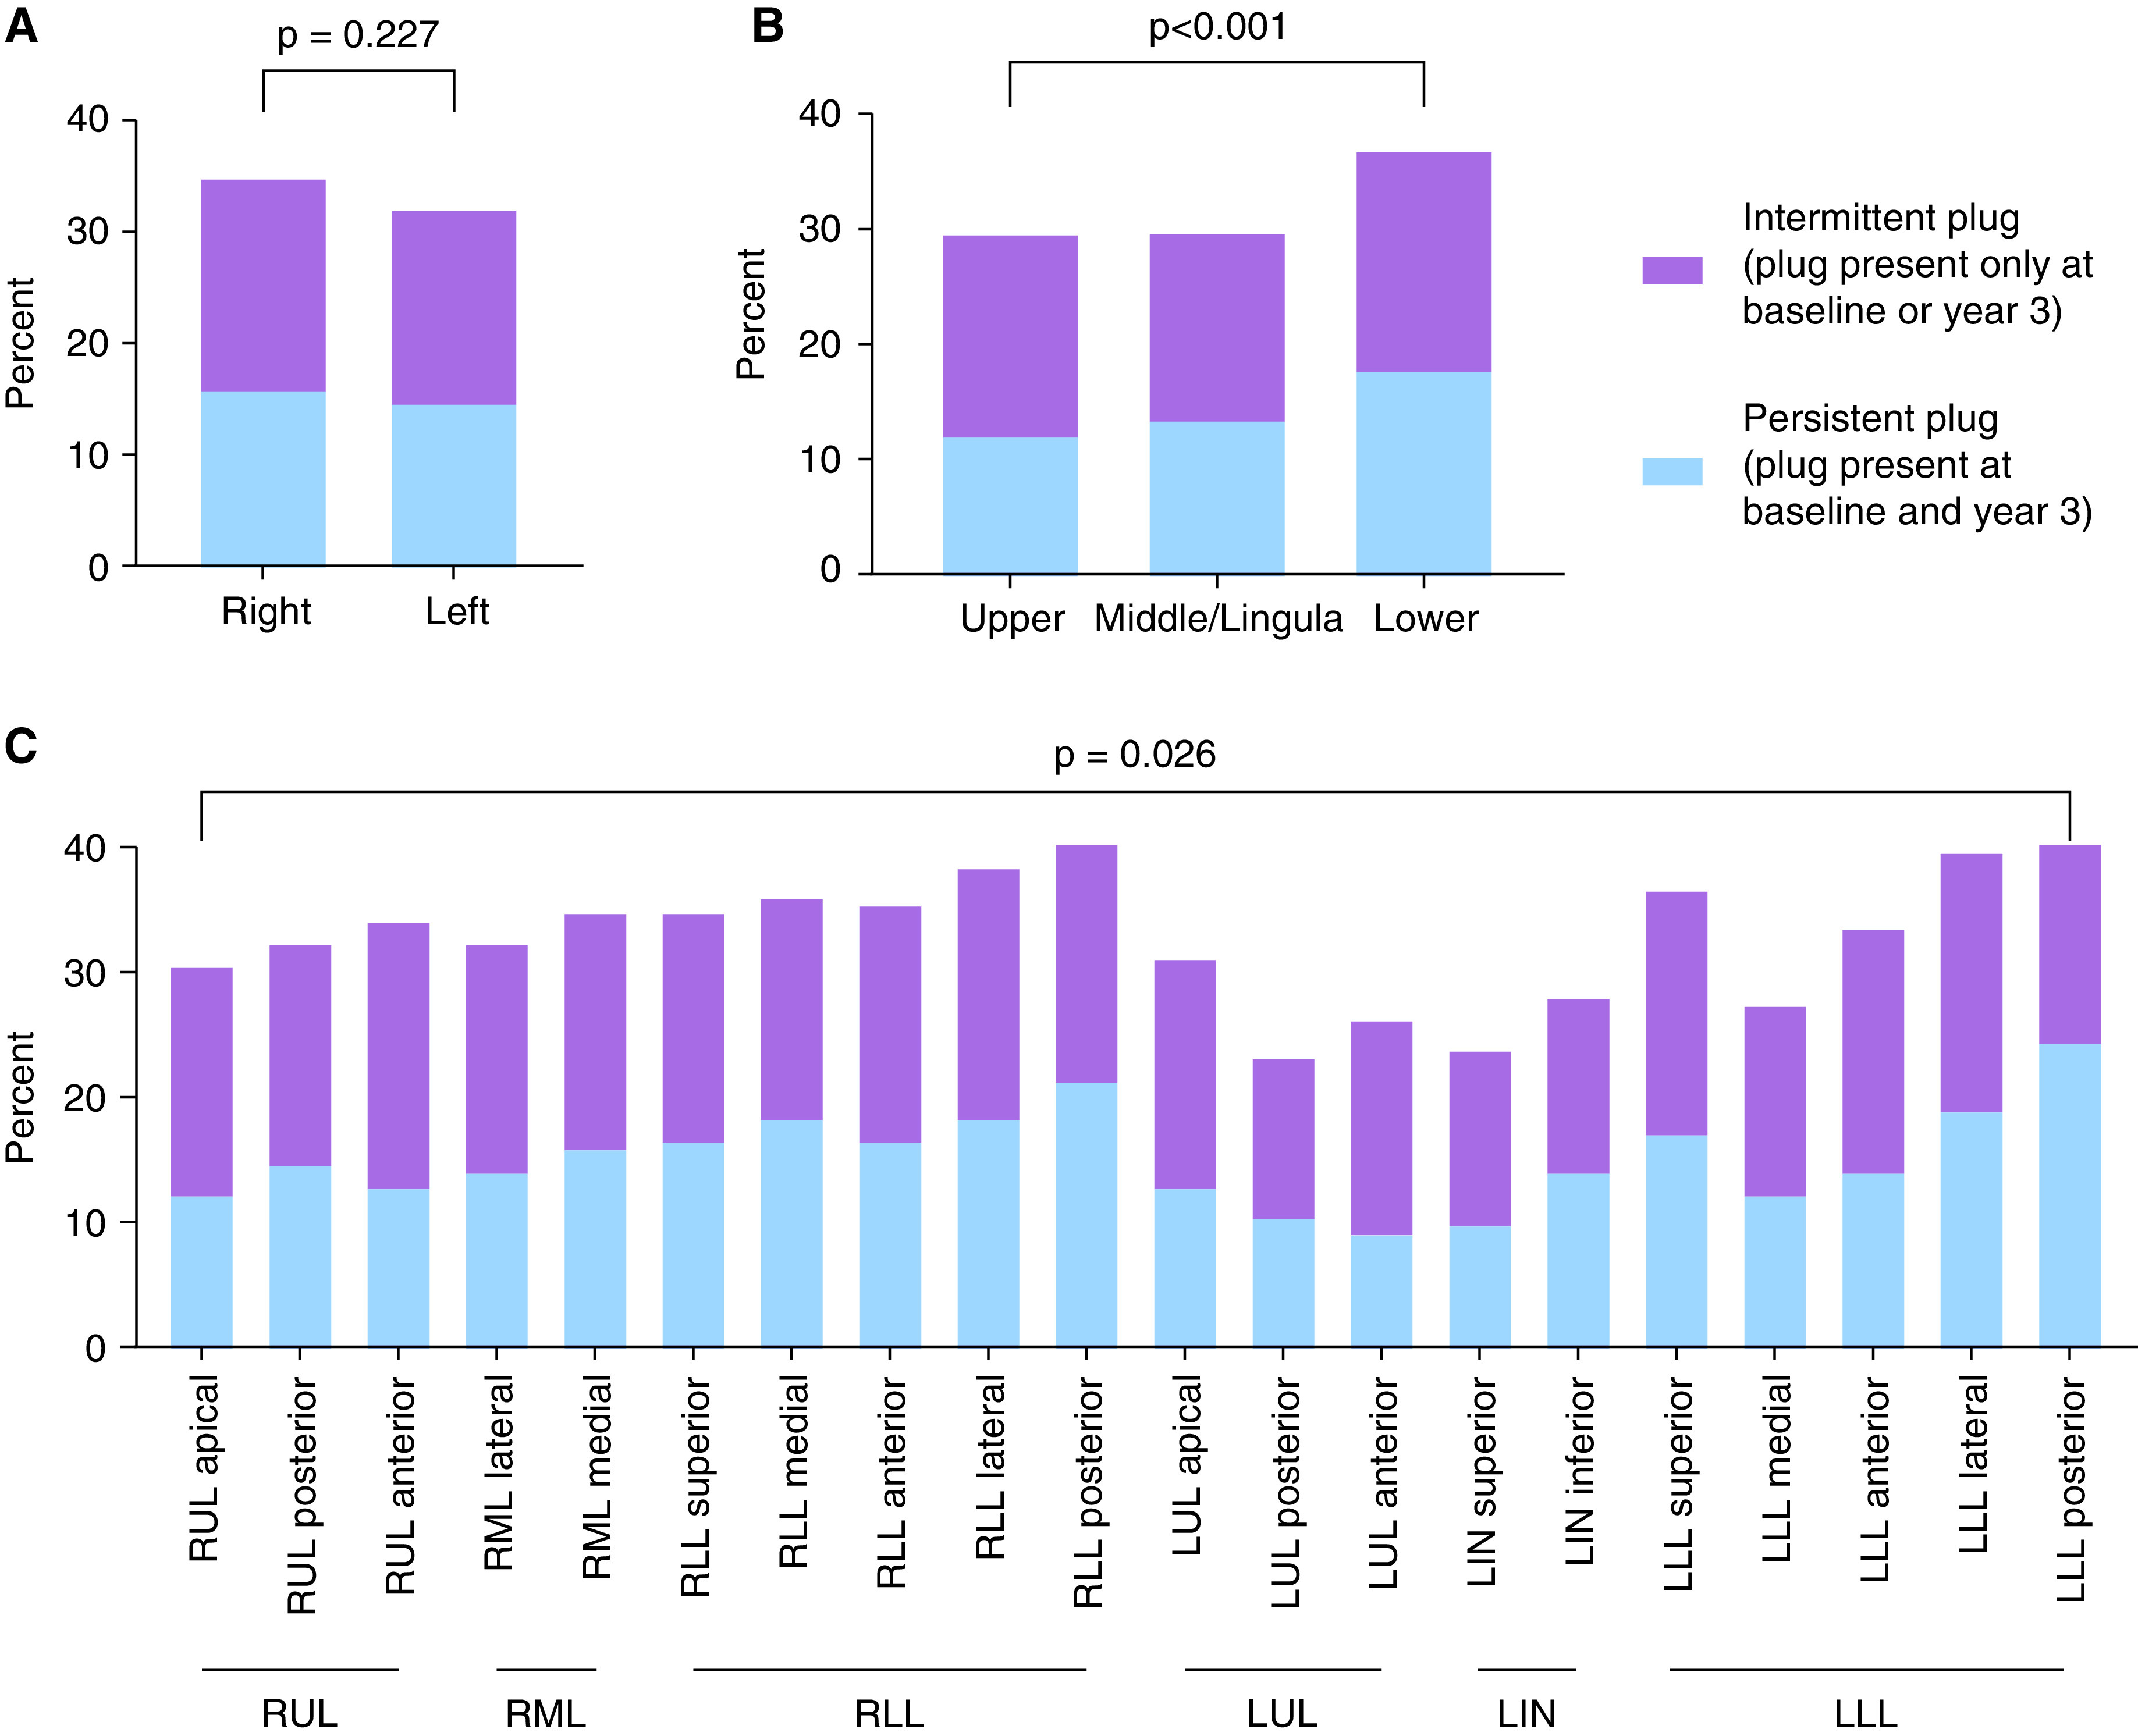
Regional differences in the frequency of persistent and intermittent mucus plugs at baseline and Year 3. (A) Frequency of persistent and intermittent mucus plugs in left and right lungs. (B) Frequency of persistent and intermittent mucus plugs in upper, middle/lingula, and lower lobes. (C) Frequency of persistent and intermittent mucus plugs in different bronchopulmonary segments. LIN = lingula; LLL = left lower lobe; LUL = left upper lobe; RLL = right lower lobe; RML = right middle lobe; RUL = right upper lobe.
Participants with Plugs Present at Baseline and Year 3 Have More Severe Asthma
We determined the clinical features of the persistent mucus plug subgroup (i.e., those who had airway mucus plugs on their MDCT lung scans at both baseline and Year 3 visits). Compared with the mucus plug–free subgroup (participants with no mucus plugs on their MDCT lung scans at baseline or Year 3), the persistent mucus plug subgroup was older and had more severe asthma but did not differ significantly in body mass index, history of gastroesophageal reflux disease, or chronic mucus hypersecretion (Table 1). The proportion of participants with an FEV1 < 60% predicted was 10-fold higher in the persistent mucus plug subgroup than in the mucus-free subgroup (46% vs. 4%; P < 0.001). Features of type 2 inflammation, including high sputum eosinophils, high fractional exhaled nitric oxide levels, and history of nasal polyps, were much more prominent in the persistent mucus plug subgroup (Table 1). Serum IgE concentrations, aeroallergen sensitivity (including to Aspergillus), and measures of non–type 2 inflammation (blood and sputum neutrophils, plasma IL-6) were not significantly different among mucus plug subgroups (Table 1). It was also notable that more than 20% of participants with persistent mucus plugs were taking oral corticosteroids on a chronic basis.
Table 1.
Clinical Characteristics of Participants with Asthma with and without Mucus Plugs at Baseline and Year 3
| Characteristic | Mucus Plug Free (n = 57) | Intermittent Plugs (n = 38) | Persistent Mucus Plugs (n = 69) | P Value* |
|---|---|---|---|---|
| Demographics | ||||
| Mucus plug score, median (quartiles) | ||||
| Baseline | 0 (0–0) | 0 (0–1) | 7 (3–12) | <0.001 |
| Year 3 | 0 (0–0) | 1 (0–1) | 8 (3–12) | <0.001 |
| Age, yr | 43.2 (14.7) | 47.7 (12.7) | 51.1 (12.8) | 0.005 |
| Female, n (%) | 42 (73.7) | 23 (60.5) | 45 (65.2) | 0.373 |
| Race, n (%) | 0.229 | |||
| White | 37 (64.9) | 24 (63.2) | 47 (68.1) | |
| Black | 15 (26.3) | 10 (26.3) | 9 (13.0) | |
| Asian | 1 (1.8) | 3 (7.9) | 6 (8.7) | |
| Other | 4 (7.0) | 1 (2.6) | 7 (10.1) | |
| Asthma characteristics | ||||
| ATS criteria severe asthma, n (%) | ||||
| Baseline | 29 (50.9) | 25 (65.8) | 58 (84.1) | <0.001 |
| Year 3 | 20 (35.1) | 19 (50.0) | 50 (72.5) | <0.001 |
| High-dose inhaled corticosteroid, n (%) | ||||
| Baseline | 34 (59.6) | 26 (68.4) | 59 (85.5) | 0.004 |
| Year 3 | 29 (50.9) | 21 (56.8) | 51 (73.9) | 0.023 |
| Daily oral corticosteroid, n (%) | ||||
| Baseline | 3 (5.3) | 6 (15.8) | 15 (21.7) | 0.033 |
| Year 3 | 3 (5.3) | 3 (7.9) | 16 (23.2) | 0.007 |
| ACT score,† median (quartiles) | ||||
| Baseline | 19 (14–21) | 18 (12–21) | 16 (13–20) | 0.213 |
| Year 3 | 21 (18–23) | 20 (14–22) | 19 (15–21) | 0.039 |
| Chronic mucus hypersecretion, n (%) | 13 (25.5) | 12 (38.7) | 23 (41.1) | 0.153 |
| Spirometry | ||||
| Pre-BD FEV1% predicted | ||||
| Baseline | 85.19 (15.80) | 69.75 (18.73) | 64.78 (19.01) | <0.001 |
| Year 3 | 87.07 (16.96) | 73.82 (16.46) | 64.45 (18.45) | <0.001 |
| Pre-BD FVC% predicted | ||||
| Baseline | 91.60 (15.68) | 81.51 (17.71) | 79.96 (17.22) | <0.001 |
| Year 3 | 92.57 (16.12) | 83.50 (15.08) | 80.25 (16.73) | <0.001 |
| Pre-BD FEV1/FVC, % | ||||
| Baseline | 76.17 (7.46) | 68.80 (8.73) | 64.31 (8.84) | <0.001 |
| Year 3 | 76.36 (7.12) | 70.63 (7.98) | 63.42 (9.07) | <0.001 |
| Post-BD FEV1% predicted | ||||
| Baseline | 92.89 (16.25) | 82.36 (16.71) | 76.62 (18.11) | <0.001 |
| Year 3 | 93.34 (17.35) | 82.84 (16.01) | 75.15 (18.92) | <0.001 |
| Post-BD FVC% predicted | ||||
| Baseline | 95.87 (15.64) | 90.20 (16.20) | 90.52 (14.99) | 0.103 |
| Year 3 | 95.77 (16.60) | 90.23 (14.64) | 89.11 (16.25) | 0.058 |
| Post-BD FEV1/FVC, % | ||||
| Baseline | 80.14 (7.83) | 74.77 (7.04) | 68.18 (8.99) | <0.001 |
| Year 3 | 79.97 (7.15) | 74.01 (8.03) | 67.42 (9.23) | <0.001 |
| Max-BD reversibility, % | ||||
| Baseline | 10.90 (7.31) | 17.40 (17.44) | 21.42 (17.25) | <0.001 |
| Year 3 | 7.51 (6.37) | 13.42 (9.31) | 18.74 (16.25) | <0.001 |
| Max-BD absolute change, % | ||||
| Baseline | 8.71 (5.29) | 10.87 (8.46) | 12.12 (7.47) | 0.027 |
| Year 3 | 6.28 (5.10) | 9.02 (5.26) | 10.70 (8.14) | 0.001 |
| Type 2 inflammation features | ||||
| Blood eosinophils, cells/μl, median (quartiles) | ||||
| Baseline | 160 (104–270) | 185 (114–372) | 308 (151–546) | <0.001 |
| Year 3 | 153 (102–248) | 212 (120–291) | 208 (96–405) | 0.19 |
| Sputum eosinophils, %, median (quartiles) | ||||
| Baseline | 0.2 (0.0–0.8) | 0.4 (0.0–2.0) | 3.5 (0.4–17.3) | <0.001 |
| Year 3 | 0.4 (0.0–0.9) | 1.3 (0.2–3.1) | 1.1 (0.2–6.7) | 0.016 |
| Baseline FeNO, ppb, median (quartiles) | 18 (10–28) | 20 (12–37) | 28 (15–43) | 0.017 |
| Baseline nasal polyps, n (%) | 2 (3.5) | 11 (28.9) | 21 (30.4) | 0.001 |
| Baseline IgE, kU/L, median (quartiles) | 142 (31–258) | 171 (36–519) | 154 (71–342) | 0.524 |
| IgE sensitization, n (%) | ||||
| Pollen | 27 (47.4) | 20 (54.1) | 34 (49.3) | 0.815 |
| Mold | 17 (29.8) | 12 (32.4) | 26 (37.7) | 0.638 |
| Aspergillus fumigatus | 8 (14.0) | 7 (18.9) | 20 (29.0) | 0.115 |
| Dust mite/cockroach | 26 (45.6) | 23 (62.2) | 34 (49.3) | 0.274 |
| Animal | 32 (56.1) | 21 (55.3) | 42 (60.9) | 0.806 |
| Non–type 2 inflammation features | ||||
| Blood neutrophils, cells/μl, median (quartiles) | ||||
| Baseline | 3,822 (2,928–5,106) | 3,869 (2,871–4,972) | 3,654 (2,943–4,680) | 0.788 |
| Year 3 | 3,876 (2,967–5,487) | 3,492 (2,609–4,940) | 4,067 (2,733–4,779) | 0.496 |
| Sputum neutrophils, %, median (quartiles) | ||||
| Baseline | 61.7 (40.3–76.9) | 63.9 (42.6–83.9) | 48.7 (37.2–71.7) | 0.29 |
| Year 3 | 63.7 (50.5–76.7) | 63.0 (50.6–81.2) | 64.6 (45.7–78.0) | 0.944 |
| BMI | 33.38 (9.09) | 33.29 (9.82) | 31.20 (6.36) | 0.261 |
| GERD, n (%) | 31 (54.4) | 15 (39.5) | 34 (49.3) | 0.283 |
| Baseline plasma IL-6 (pg/ml) | 2.40 (2.22) | 2.13 (1.80) | 2.10 (1.75) | 0.736 |
Definition of abbreviations: ACT = asthma control test; ATS = American Thoracic Society; BD = bronchodilator response; BMI = body mass index; FeNO = fractional exhaled nitric oxide; GERD = gastroesophageal reflux disease.
Data reported as mean (SD) unless otherwise indicated.
P values calculated as chi-square for categorical variables, ANOVA for continuous parametric variables, and Kruskal-Wallis for continuous nonparametric variables.
Scores on ACT range from 25 to 5, with lower scores indicating worse asthma control.
We also analyzed the relationship between airway mucus plugs and asthma exacerbations. Compared with the mucus plug–free subgroup, the persistent mucus plug subgroup had a significantly higher number of exacerbations over 3 years and a significantly higher annualized exacerbation rate (Table 2). In addition, the persistent mucus plug subgroup was significantly more likely to have an exacerbation-prone phenotype, defined as having at least one asthma exacerbation per year (25) (Table 2). Furthermore, the change in airway mucus plug score from baseline to Year 3 was negatively correlated and significantly associated in regression analysis with ACT (Figure E5).
Table 2.
Exacerbations in Participants with Asthma with and without Mucus Plugs at Baseline and Year 3
| Characteristic | Mucus Plug Free (n = 57) | Intermittent Mucus Plugs (n = 38) | Persistent Mucus Plugs (n = 69) | P Value |
|---|---|---|---|---|
| Cumulative exacerbations, median (quartiles) | 1.0 (0.0–3.0) | 1.0 (0.0–2.3) | 2.5 (0.8–6.0) | <0.001 |
| Annualized exacerbation rate, median (quartiles) | 0.3 (0.0–1.0) | 0.3 (0.0–0.8) | 0.8 (0.3–2.0) | 0.001 |
| Exacerbation phenotype, n (%) | 0.028 | |||
| Exacerbation resistant, 0/yr | 27 (50.0) | 17 (51.5) | 17 (25.4) | |
| Exacerbation intermittent | 19 (35.2) | 9 (27.3) | 31 (46.3) | |
| Exacerbation prone, ⩾1/yr | 8 (14.8) | 7 (21.2) | 19 (28.4) |
P values calculated with Poisson regression for cumulative exacerbations, Kruskal-Wallis test for annualized exacerbation rate, and chi-square test for exacerbation phenotype.
Changes in Mucus Plug Scores over Time Associate with Changes in Airflow Obstruction, Air Trapping, and Eosinophils
We compared changes in the airway mucus plug score from baseline to Year 3 to changes in spirometry outcomes and in CT measures of air trapping. We found that the change in mucus plug score was negatively and significantly correlated with changes in FEV1% predicted (Figure 4A), FVC% predicted (Figure 4B), and FEV1/FVC (Figure 4C). In addition, in regression analysis, increases in the mucus plug score were significantly associated with decreases in FEV1% predicted, FVC% predicted, and FEV1/FVC after controlling for age and baseline blood eosinophils (Table 3). Furthermore, using the annualized rate of change in spirometry outcomes as previously described (12), we found that the change in mucus plug score was negatively correlated and negatively associated in regression analysis with the annualized rate of change in FEV1% predicted, FVC% predicted, and FEV1/FVC (Figure E6). Finally, the change in mucus plug score was positively correlated with global measures of air trapping, including change in percentage of voxels below −856 HU, Jacobian mean, and disease probability measure of functional small airway disease (Figures 4D–4F and Table 3).
Figure 4.
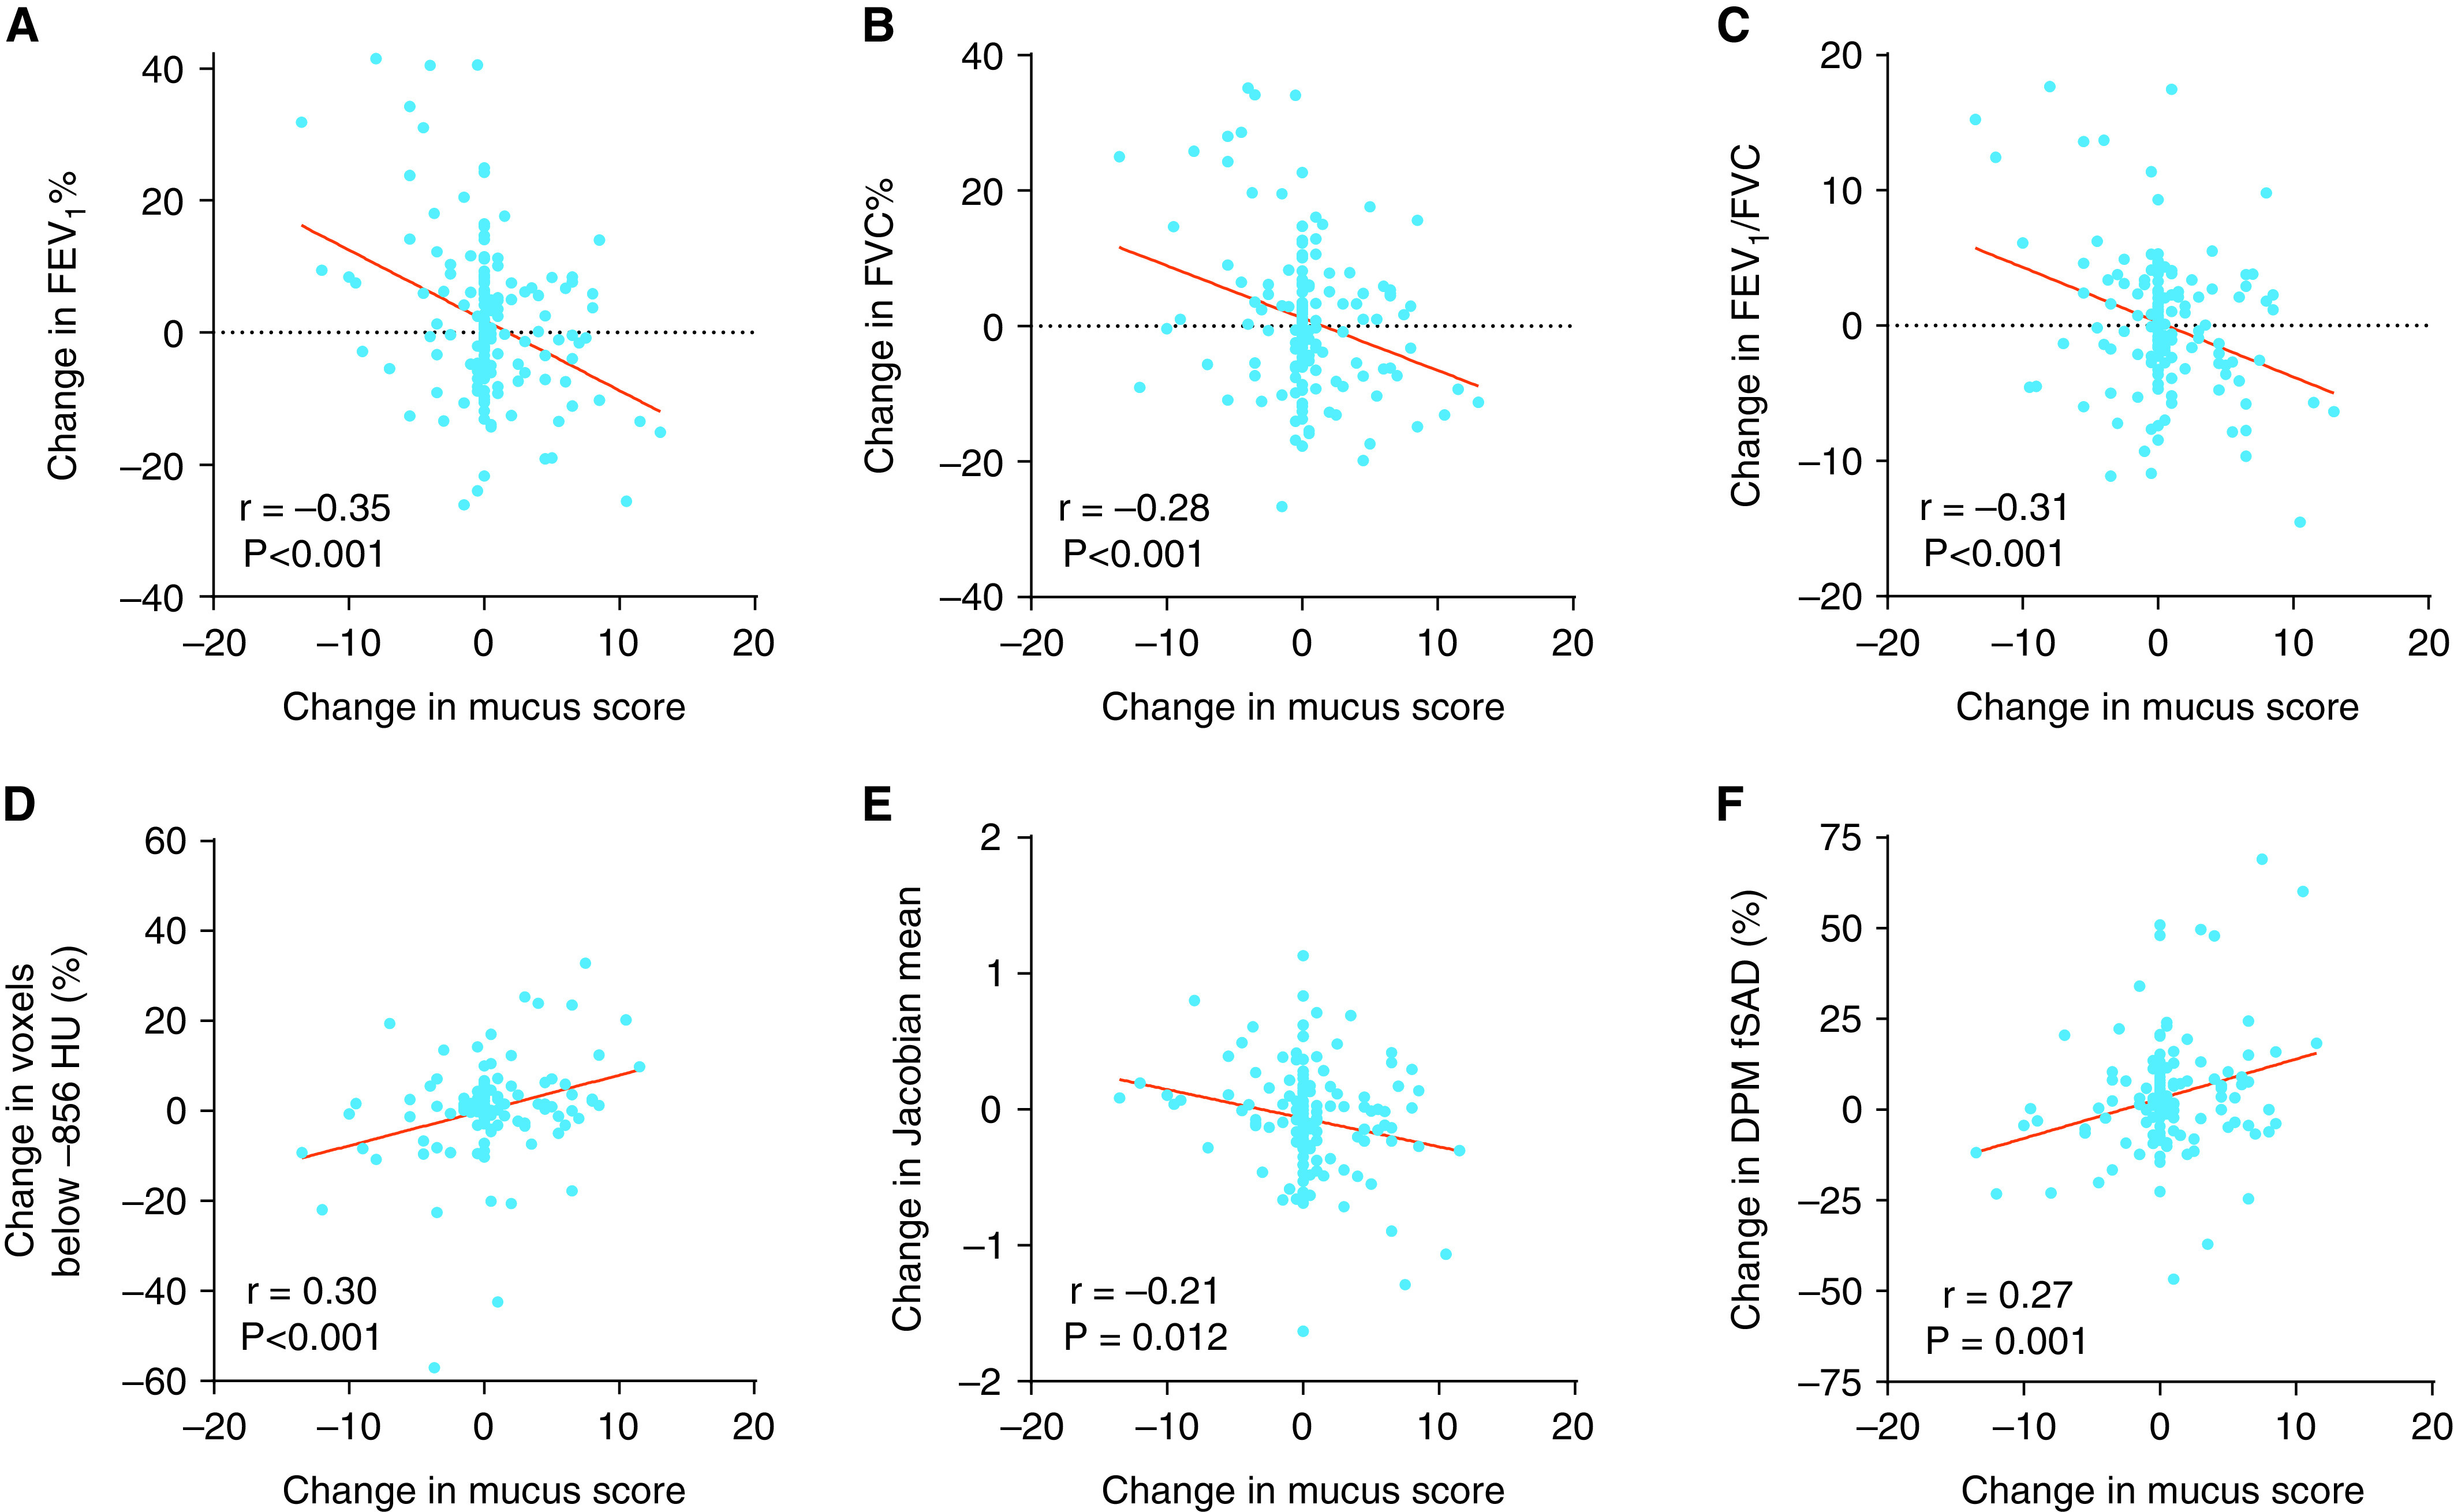
Relationship between change in mucus plug score and change in airflow. (A) The change in mucus plug score is significantly and negatively associated with the change in FEV1% predicted. (B) The change in mucus plug score is significantly and negatively associated with the change in FVC% predicted. (C) The change in mucus plug score is significantly and negatively associated with the change in FEV1/FVC. (D) The change in mucus plug score is significantly and positively associated with the change in percentage of voxels below −856 Hounsfield units (HU). (E) The change in mucus plug score is significantly and negatively associated with the change in Jacobian mean. (F) The change in mucus plug score is significantly and positively associated with the change in percentage of disease probability measure of functional small airway disease (DPM fSAD).
Table 3.
Relationship among Change in Mucus Plug Score and Change in Lung Function and Air Trapping Measures
| Asthma Outcome | Change in Mucus Plug Score |
|||
|---|---|---|---|---|
| Unadjusted | Adjusted for Age | Adjusted for Age and Blood Eosinophils | Adjusted for Age and Sputum Eosinophils and Site | |
| Change in FEV1% predicted | −1.1 (−1.5 to −0.6), P < 0.001 | −1.1 (−1.5 to −0.7), P < 0.001 | −1.0 (−1.5 to −0.6), P < 0.001 | −1.4 (−1.9 to −0.9), P < 0.001 |
| Change in FVC% predicted | −0.8 (−1.2 to −0.4), P < 0.001 | −0.8 (−1.2 to −0.4), P < 0.001 | −0.7 (−1.2 to −0.3), P < 0.001 | −1.0 (−1.5 to −0.5), P < 0.001 |
| Change in FEV1/FVC, % | −0.4 (−0.6 to −0.2), P < 0.001 | −0.4 (−0.6 to −0.2), P < 0.001 | −0.4 (−0.6 to −0.2), P < 0.001 | −0.5 (−0.8 to −0.3), P < 0.001 |
| Change in voxels below −856 HU, % | 0.8 (0.4 to 1.2), P < 0.001 | 0.8 (0.4 to 1.2), P < 0.001 | 0.7 (0.3 to 1.1), P = 0.001 | 0.9 (0.4 to 1.4), P < 0.001 |
| Change in Jacobian mean | −0.03 (−0.04 to −0.00), P = 0.012 | −0.02 (−0.04 to −0.00), P = 0.012 | −0.02 (−0.04 to −0.00), P = 0.028 | −0.03 (−0.05 to −0.01), P = 0.003 |
| Change in DPM fSAD, % | 1.1 (0.4 to 1.7), P = 0.001 | 1.1 (0.4 to 1.8), P = 0.001 | 1.0 (0.3 to 1.7), P = 0.004 | 1.3 (0.5 to 2.1), P = 0.002 |
Definition of abbreviations: DPM fSAD = disease probability measure of functional small airway disease; HU = Hounsfield units.
Linear regression model reports β coefficient (95% confidence interval). The predictor variable is change in mucus plug score.
To examine the relationship between airway inflammation and airway mucus plugs, we compared changes in blood and sputum eosinophils with changes in mucus plug score. The change in blood eosinophils and sputum eosinophils was positively correlated with changes in mucus plug score (Figures 5A and 5B). In regression analysis, increases in eosinophil measures were associated with increases in mucus plug score after controlling for age (Figure 5C). In addition, the annualized rate of change in sputum eosinophils was also positively correlated and positively associated in regression analysis with the change in mucus plug score (Figure E7). Sensitivity analyses excluding participants with no change in mucus plug score demonstrated similar findings. We were not able to determine the effect of therapeutic proteins targeting IL-5 or the IL-4 receptor on the airway mucus plug score, because few participants in the cohort had been prescribed these medicines by their healthcare providers during the study time period. Twenty-one patients were taking biologics targeting type 2 cytokines during Year 3 (n = 18 on mepolizumab, n = 3 on reslizumab). The treatment duration for these biologics ranged from 3 to 21 months.
Figure 5.
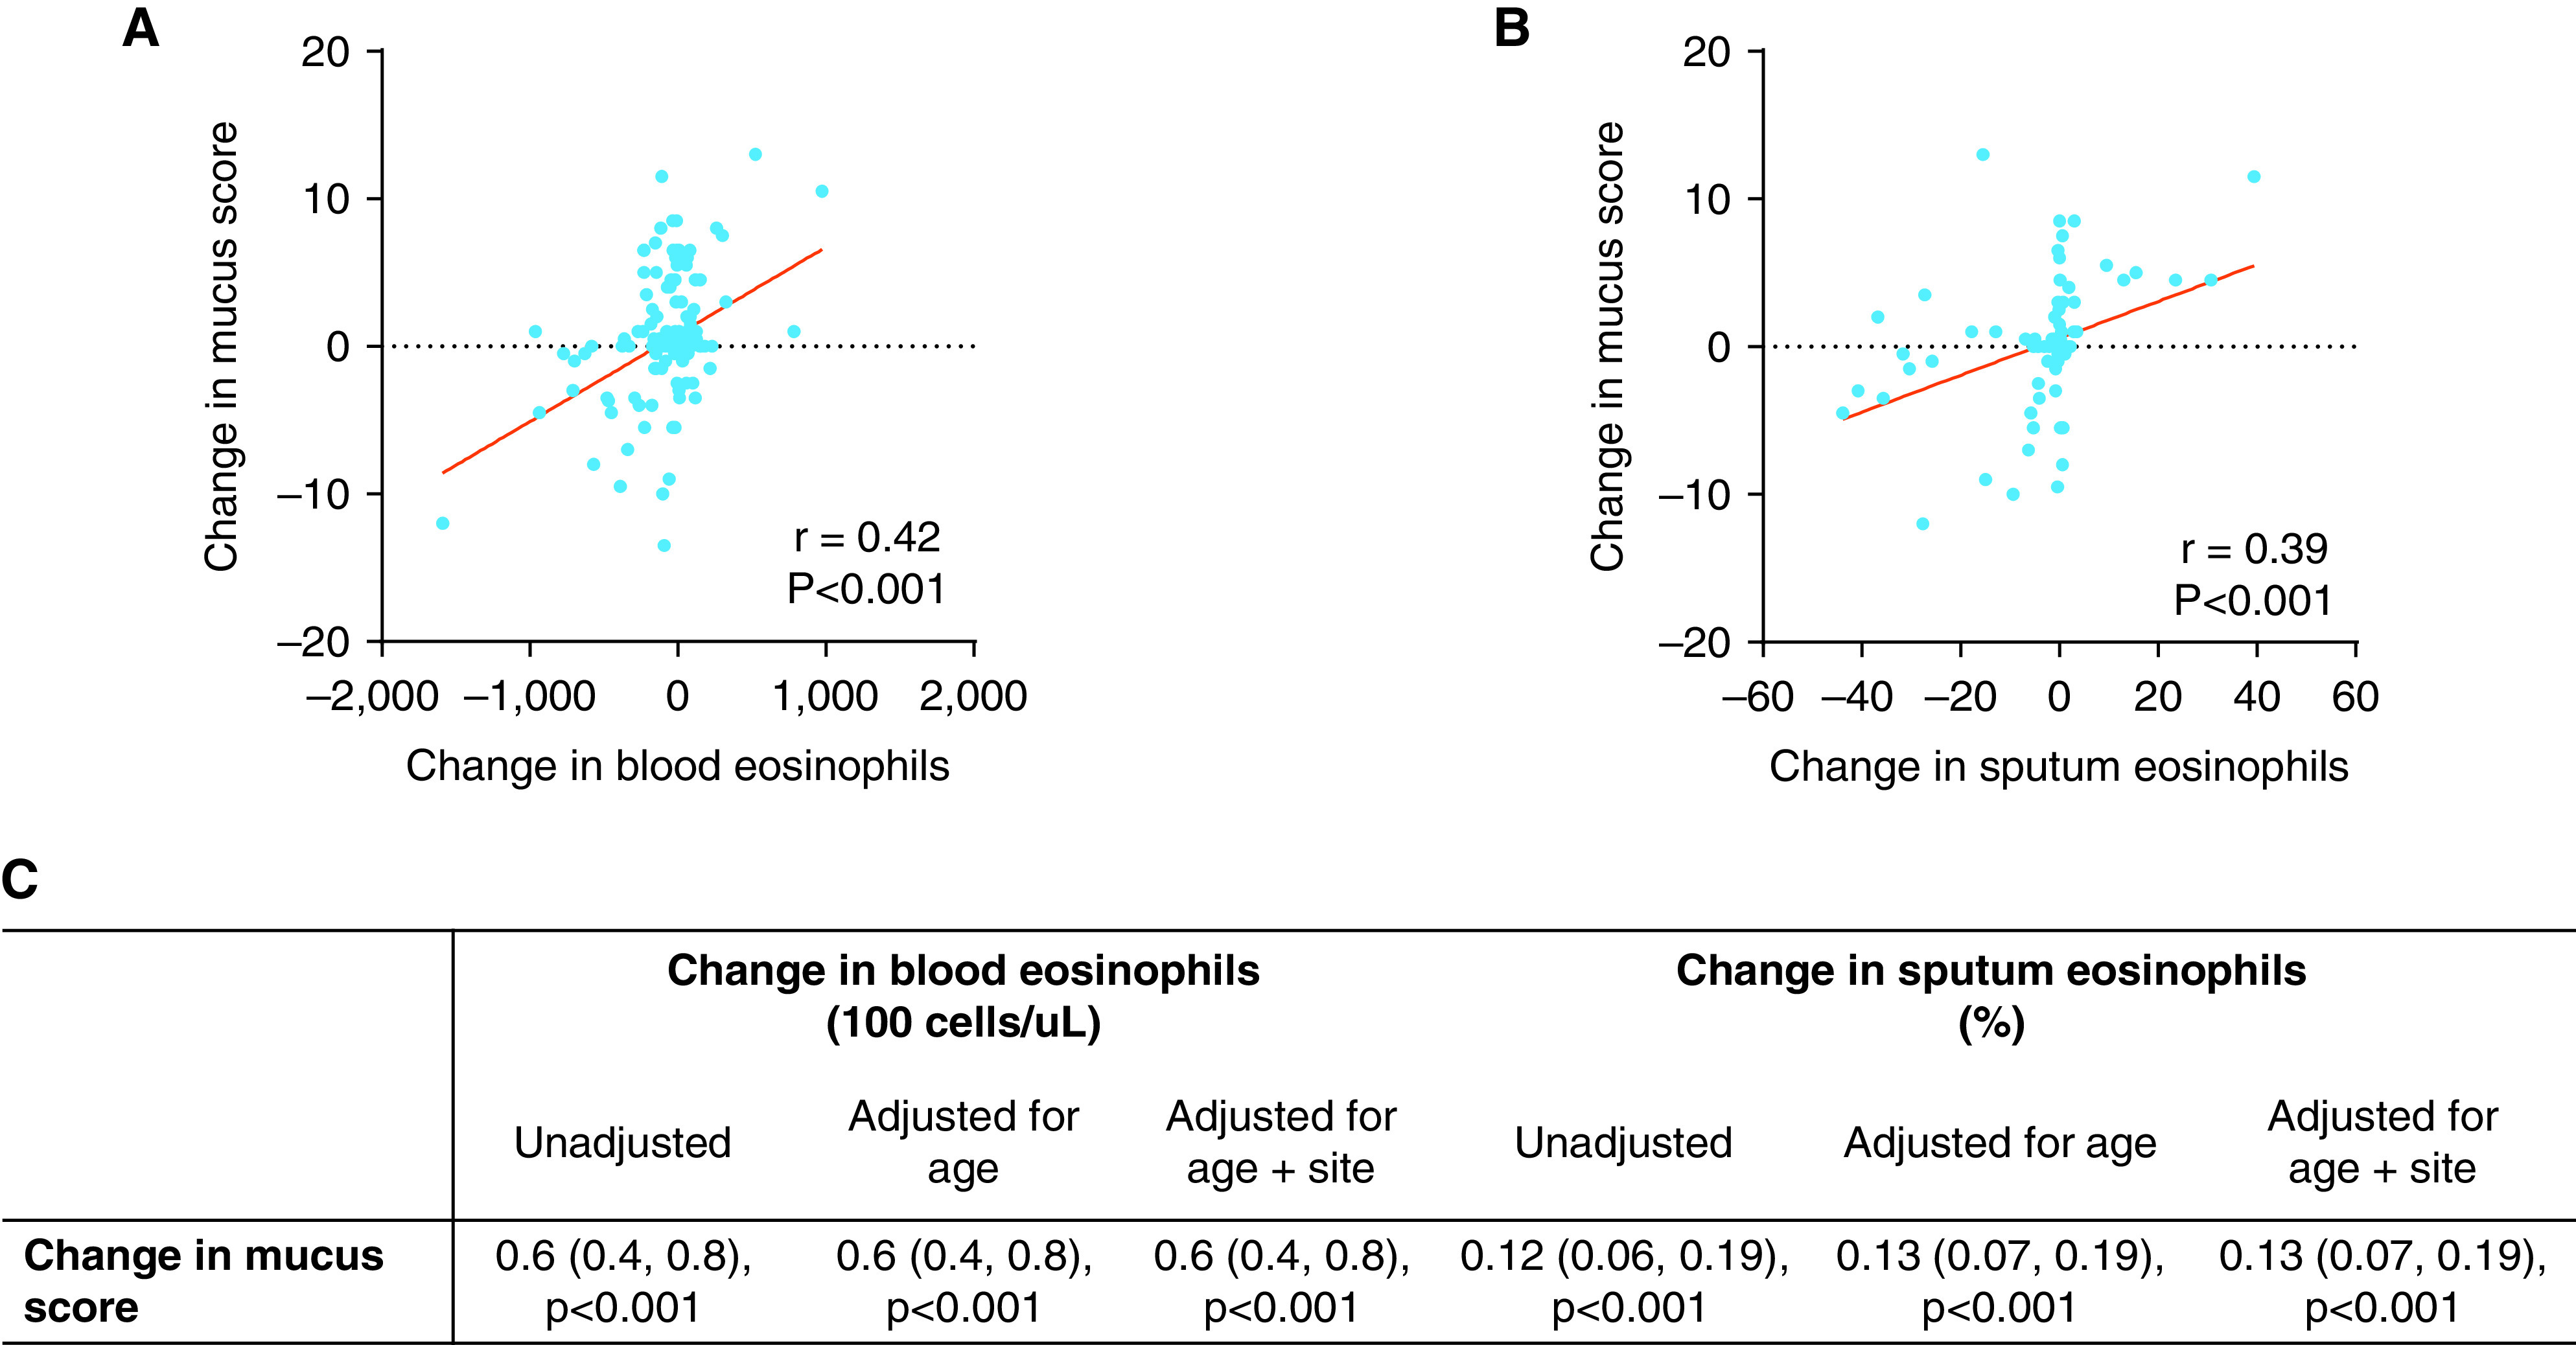
Relationship between change in eosinophils (blood and sputum) and change in mucus plug score. (A) The change in blood eosinophils is significantly and positively associated with the change in mucus plug score. (B) The change in sputum eosinophils is significantly and positively associated with the change in mucus plug score. (C) Relationship between mucus plug score and eosinophilia adjusted for covariates. Linear regression model reports β coefficients (95% confidence interval).
Discussion
In this study we show that airway mucus plugs persist in a subset of participants in the SARP-3 cohort for at least 3 years. Mucus plugs are therefore a stable asthma phenotype. Our finding that changes in mucus plug scores correlated with changes in FEV1% over the 3-year time period suggests that airway mucus plugs are a mechanism of airflow obstruction in asthma.
Our study took advantage of the longitudinal cohort design of SARP-3 and protocol features that included MDCT lung scans at the baseline and Year 3 visits. This protocol design allowed us to apply the mucus plug scoring system recently described to quantify mucus plugs at both time points and to explore longitudinal relationships between mucus plug scores and lung function (8). Our data show that participants with mucus plugs at baseline are highly likely to have mucus plugs 3 years later, and this participant level susceptibility to mucus plugs is accompanied by bronchopulmonary segment level susceptibility as well. The biologic factors that govern susceptibility to persistent airway mucus plugs at the participant level likely relate to ageing and type 2 inflammation, because we show that a typical participant with mucus plug–high asthma is older and has systemic and airway eosinophilia and nasal polyps. We can only speculate on the biologic factors that explain the finding that bronchopulmonary segments with a mucus plug at baseline visit are highly likely to have a mucus plug 3 years later. We did not find any evidence of an association with obesity, gastroesophageal reflux disease, or aeroallergen sensitization, including Aspergillus mold. It may be that segment-level susceptibility is explained by prior infectious or inflammatory injury in the segment. Normally, environmental insults that initiate type 2 inflammation in the airway prompt homeostatic mechanisms that mediate resolution and repair, but homeostatic mechanisms may fail in severe forms of asthma to prevent proper repair. Instead, reprogramming of epithelial cells and immune cells at a transcriptional and epigenetic level may engage in cross-talk to create a type 2 airway niche that has airway luminal mucus plugging as its hallmark.
A key finding of our study is that changes in airway mucus plug score over time correlate with changes in multiple measures of airflow obstruction and air trapping. We previously reported a strong association between airway mucus plug score and FEV1 in cross-sectional analyses in SARP-3, and we speculated that this relationship could be causal (8). But the finding here that longitudinal changes in mucus plugs track with longitudinal changes in lung function significantly strengthens the possibility that mucus plugs cause persistent airflow obstruction and air trapping in asthma. Proving such a causal relationship will require clinical trials of mucoactive drugs, and our data provide a strong rationale for such trials in mucus-high asthma. Relevant here is that our data show that conventional asthma treatment does not eliminate airway mucus plugs. We report that mucus plugs persist despite ongoing use of bronchodilators, inhaled and/or oral steroids, and an intramuscular triamcinolone challenge included in the SARP study design. Few participants were on therapeutic proteins targeting type 2 cytokines, and future studies are needed to evaluate whether improvement in baseline lung function with biologics while retaining short-acting beta-agonist reversibility may be due to their effects on eosinophilic mucous plugs.
In summary, mucus plugs are a persistent asthma phenotype that can rationally be targeted with mucoactive drugs with a goal to improve airflow and asthma control.
Acknowledgments
Acknowledgment
The authors thank the volunteers who participated in these studies and Patricia Noel, NHLBI, for her support and leadership of the SARP-3. They also thank the investigators and coordinators in the SARP who contributed to this manuscript by recruiting and characterizing participants, collecting biospecimens, developing systems for lung imaging and analysis, and coordinating data collection and analysis.
Footnotes
Supported by National Institutes of Health/National Heart, Lung, and Blood Institute sponsored network, grant R01 HL080414, P01 HL107202, U01 HL146002, U10 HL109172, U10 HL109168, U10 HL109152, U10 HL109257, U10 HL109146, U10 HL109250, U10 HL109164, and U10 109086. The following companies provided financial support for study activities at the Coordinating and Clinical Centers beyond the third year of patient follow-up: AstraZeneca, Boehringer-Ingelheim, Genentech, GlaxoSmithKline, Sanofi–Genzyme–Regeneron, and TEVA. These companies had no role in study design or data analysis, and the only restriction on the funds was that they be used to support the SARP initiative.
Author Contributions: M.T., J.V.F., and E.M.D. conceived and designed the study, conducted the data analysis, and prepared the first draft of the manuscript. B.M.E., T.H., D.S.G., and M.L.S. scored the CT scans in the study. B.K.H., M.C.P., M.C., E.A.H, S.B.F., S.Y.A., J.C., C.H., B.R.P., D.T.M., L.C.D., N.N.J., E.I., W.P., B.D.L., S.E.W., E.R.B., and P.G.W. made substantial contributions to the design and analysis of the study. All authors revised the draft critically for intellectual content.
This article has an online supplement, which is accessible from this issue’s table of contents at www.atsjournals.org.
Originally Published in Press as DOI: 10.1164/rccm.202110-2265OC on February 1, 2022
Author disclosures are available with the text of this article at www.atsjournals.org.
References
- 1. Huber HL, Koessler KK. The pathology of bronchial asthma. Arch Intern Med . 1922;30:689–760. [Google Scholar]
- 2. Cardell BS, Pearson RSB. Death in asthmatics. Thorax . 1959;14:341–352. [Google Scholar]
- 3. Dunnill MS. The pathology of asthma, with special reference to changes in the bronchial mucosa. J Clin Pathol . 1960;13:27–33. doi: 10.1136/jcp.13.1.27. [DOI] [PMC free article] [PubMed] [Google Scholar]
- 4. Reid LM. The presence or absence of bronchial mucus in fatal asthma. J Allergy Clin Immunol . 1987;80:415–416. doi: 10.1016/0091-6749(87)90064-9. [DOI] [PubMed] [Google Scholar]
- 5. Lang DM, Simon RA, Mathison DA, Timms RM, Stevenson DD. Safety and possible efficacy of fiberoptic bronchoscopy with lavage in the management of refractory asthma with mucous impaction. Ann Allergy . 1991;67:324–330. [PubMed] [Google Scholar]
- 6. Kuyper LM, Paré PD, Hogg JC, Lambert RK, Ionescu D, Woods R, et al. Characterization of airway plugging in fatal asthma. Am J Med . 2003;115:6–11. doi: 10.1016/s0002-9343(03)00241-9. [DOI] [PubMed] [Google Scholar]
- 7. Boser SR, Park H, Perry SF, Ménache MG, Green FHY. Fractal geometry of airway remodeling in human asthma. Am J Respir Crit Care Med . 2005;172:817–823. doi: 10.1164/rccm.200411-1463OC. [DOI] [PubMed] [Google Scholar]
- 8. Dunican EM, Elicker BM, Gierada DS, Nagle SK, Schiebler ML, Newell JD, et al. National Heart Lung and Blood Institute (NHLBI) Severe Asthma Research Program (SARP) Mucus plugs in patients with asthma linked to eosinophilia and airflow obstruction. J Clin Invest . 2018;128:997–1009. doi: 10.1172/JCI95693. [DOI] [PMC free article] [PubMed] [Google Scholar]
- 9. Teague WG, Phillips BR, Fahy JV, Wenzel SE, Fitzpatrick AM, Moore WC, et al. Baseline features of the Severe Asthma Research Program (SARP III) cohort: differences with age. J Allergy Clin Immunol Pract . 2018;6:545–554.e4. doi: 10.1016/j.jaip.2017.05.032. [DOI] [PMC free article] [PubMed] [Google Scholar]
- 10. Chung KF, Wenzel SE, Brozek JL, Bush A, Castro M, Sterk PJ, et al. International ERS/ATS guidelines on definition, evaluation and treatment of severe asthma. Eur Respir J . 2014;43:343–373. doi: 10.1183/09031936.00202013. [DOI] [PubMed] [Google Scholar]
- 11. Fletcher CM, Pride NB. Definitions of emphysema, chronic bronchitis, asthma, and airflow obstruction: 25 years on from the Ciba symposium. Thorax . 1984;39:81–85. doi: 10.1136/thx.39.2.81. [DOI] [PMC free article] [PubMed] [Google Scholar]
- 12. Denlinger LC, Phillips BR, Sorkness RL, Bleecker ER, Castro M, DeBoer MD, et al. Responsiveness to parenteral corticosteroids and lung function trajectory in adults with moderate-to-severe asthma. Am J Respir Crit Care Med . 2021;203:841–852. doi: 10.1164/rccm.202002-0454OC. [DOI] [PMC free article] [PubMed] [Google Scholar]
- 13. Niimi A, Matsumoto H, Amitani R, Nakano Y, Mishima M, Minakuchi M, et al. Airway wall thickness in asthma assessed by computed tomography: relation to clinical indices. Am J Respir Crit Care Med . 2000;162:1518–1523. doi: 10.1164/ajrccm.162.4.9909044. [DOI] [PubMed] [Google Scholar]
- 14. Nakano Y, Muro S, Sakai H, Hirai T, Chin K, Tsukino M, et al. Computed tomographic measurements of airway dimensions and emphysema in smokers: correlation with lung function. Am J Respir Crit Care Med . 2000;162:1102–1108. doi: 10.1164/ajrccm.162.3.9907120. [DOI] [PubMed] [Google Scholar]
- 15. Castro M, Fain SB, Hoffman EA, Gierada DS, Erzurum SC, Wenzel S, National Heart, Lung, and Blood Institute’s Severe Asthma Research Program Lung imaging in asthmatic patients: the picture is clearer. J Allergy Clin Immunol . 2011;128:467–478. doi: 10.1016/j.jaci.2011.04.051. [DOI] [PMC free article] [PubMed] [Google Scholar]
- 16. Galbán CJ, Han MK, Boes JL, Chughtai KA, Meyer CR, Johnson TD, et al. Computed tomography-based biomarker provides unique signature for diagnosis of COPD phenotypes and disease progression. Nat Med . 2012;18:1711–1715. doi: 10.1038/nm.2971. [DOI] [PMC free article] [PubMed] [Google Scholar]
- 17. Ostridge K, Gove K, Paas KHW, Burke H, Freeman A, Harden S, et al. Using novel computed tomography analysis to describe the contribution and distribution of emphysema and small airways disease in chronic obstructive pulmonary disease. Ann Am Thorac Soc . 2019;16:990–997. doi: 10.1513/AnnalsATS.201810-669OC. [DOI] [PubMed] [Google Scholar]
- 18. Kirby M, Yin Y, Tschirren J, Tan WC, Leipsic J, Hague CJ, et al. CanCOLD Collaborative Research Group and the Canadian Respiratory Research Network A novel method of estimating small airway disease using inspiratory-to-expiratory computed tomography. Respiration . 2017;94:336–345. doi: 10.1159/000478865. [DOI] [PubMed] [Google Scholar]
- 19. Amelon R, Cao K, Ding K, Christensen GE, Reinhardt JM, Raghavan ML. Three-dimensional characterization of regional lung deformation. J Biomech . 2011;44:2489–2495. doi: 10.1016/j.jbiomech.2011.06.009. [DOI] [PMC free article] [PubMed] [Google Scholar]
- 20. Hastie AT, Mauger DT, Denlinger LC, Coverstone A, Castro M, Erzurum S, et al. Mixed sputum granulocyte longitudinal impact on lung function in the severe asthma research program. Am J Respir Crit Care Med . 2021;203:882–892. doi: 10.1164/rccm.202009-3713OC. [DOI] [PMC free article] [PubMed] [Google Scholar]
- 21. Simpson JL, McElduff P, Gibson PG. Assessment and reproducibility of non-eosinophilic asthma using induced sputum. Respiration . 2010;79:147–151. doi: 10.1159/000245899. [DOI] [PubMed] [Google Scholar]
- 22.R Core Team. 2020.
- 23.Murphy KP. Machine learning: a probabilistic perspective. Cambridge, MA: MIT Press; 2012. [Google Scholar]
- 24. Kennedy ABW, Sankey HR. The thermal efficiency of steam engines: report of the committee appointed to the council upon the subject of the definition of a standard or standards of thermal efficiency for steam engines: with an introductory note. (Including appendixes and plate at back of volume) Minutes of the Proceedings of the Institution of Civil Engineers . 2015;134:278–312. [Google Scholar]
- 25.Peters MC, Mauger D, Ross KR, Phillips B, Gaston B, Cardet JC, et al. Evidence for exacerbation-prone asthma and predictive biomarkers of exacerbation frequency. Am J Respir Crit Care Med. 2020;202:973–982. doi: 10.1164/rccm.201909-1813OC. [DOI] [PMC free article] [PubMed] [Google Scholar]