

Abstract
Healthy Summer Learners (HSL), a novel, 6-week summer program for 2–4th grade children from low-income families in the Southeastern United States, aimed to prevent accelerated summer BMI gain and academic learning loss by providing healthy meals and snacks, 15 min of nutrition education, 3 h of physical activity opportunities and 3.5 h of reading instruction daily. This three-armed pilot quasi-experimental study used a repeated measure within- and between-participant design to compare HSL, to an active comparator—21st Century Summer Learning Program (21 C), and no-treatment control. A mixed-methods process evaluation was employed to evaluate program implementation and provide insight for future program development. Though the program was well received, student attendance was lower than anticipated and full program fidelity was not achieved. During interviews, both parents and teachers noted that the bussing schedule was inconsistent, making attendance difficult for some families. These process evaluation findings may help explain why no statistically significant group-by-time interactions at 3- or 12-month follow up were found for the primary outcomes of zBMI or MAP reading score. Future iterations of HSL should seek to extend program hours, lengthen program duration, and explore ways to lower projected cost of attendance.
Keywords: Structure, Process evaluation, Physical activity, Diet, Academics
1. Introduction
Recent evidence suggests that summer may present a “double jeopardy” of risk for children from low-income households. During summer, children from low-income households gain body mass index (BMI) at an accelerated rate (Carrel, Clark, Peterson, Eickhoff & Allen, 2007; Gillis, McDowell, & Bar-Or, 2005; J. P. Moreno, Johnston, & Woehler, 2013; Tanskey, Goldberg, Chui, Must & Sacheck, 2019; von Hippel, Powell, Downey & Rowland, 2007). Additionally, these children also experience summer declines in reading proficiency at higher rates than their higher-income peers (Cooper, Nye, Charlton, Lindsay & Greathouse, 1996; Downey, von Hippel, & Broh, 2004) and decreases in cardiovascular fitness (Collins, Murphy, & Bierman, 2004; Fu et al., 2017). Summer programing has shown promise for mitigating accelerated BMI gain, particularly for children already at risk for overweight/obesity (Reesor, Moreno, Johnston & Hernandez, 2019), as well as academic and cardiovascular fitness declines over the summer (Borman, Goetz, & Dowling, 2009; Park & Lee, 2015).
Partnerships between schools and community organizations to provide affordable summer programing are currently recommended (Bohnert et al., 2017) and preliminary evidence suggests that engagement in health focused summer programing may be effective for preventing accelerated summer BMI gain in children and adolescents (Evans, Wing, Pierre, Howie, Brinker & Jelalian, 2020; Hopkins et al., 2019; Hunt, Whitfield, Brazendale, Beets & Weaver, 2019). The Structured Days Hypothesis may explain accelerated summer BMI gain. Based on the filled time perspective, posits that time filled with favorable activities cannot be filled with unfavorable activities (Brazendale et al., 2017; Caldwell & Smith, 2006). This viewpoint suggests that children engage in more negative health behaviors that lead to increased BMI gain on less-structured days (e.g., summer days) than on more structured days (e.g., school weekdays). A robust literature base also demonstrates that summer declines in academic performance can be mitigated by providing structured academic programming delivered by certified teachers during the summer (Borman & Dowling, 2006; Borman et al., 2009; Kim & Quinn, 2013; Mariano & Martorell, 2013; McCombs, Pane, Augustine, Schwartz, Martorell & Zakaras, 2014). Given the wide-spread presence of summer day camps across the United States, summer programing designed to improve academic and health outcomes represent a unique opportunity to capitalize on existing resources and infrastructure (Jago & Baranowski, 2004).
Recently, our research team along with a local school district designed Healthy Summer Learners (HSL) to address both declines in academic proficiency and accelerated BMI gain in one summer program. To our knowledge, Healthy Summer Learners (HSL) was the first program designed with a dual focus on addressing both summer BMI gains and academic learning loss for children from low-income households by providing healthy meals and snacks, nutrition education, physical activity opportunities and reading instruction daily. In a previous publication HSL was shown to positively impact children’s sedentary behaviors, physical activity, and sleep on days that they attended (Dugger et al., 2020). Thus, it was hypothesized that children attending the HSL program would not experience slides in reading, accelerated summer BMI gain, or fitness loss. Further, children attending the active comparator, which focused exclusively on reading instruction, would not experience slides in reading but would experience accelerated summer BMI gain and fitness loss; while children in the control group would experience slides in reading, accelerated summer BMI gain, or fitness loss.
This manuscript reports the preliminary effects of the pilot HSL program on summer reading loss, accelerated summer BMI gain, and fitness loss, compared to an active comparison group, and a no-treatment control. Additionally, the present manuscript presents a process evaluation of HSL with the object of evaluating the reach, cost, fidelity, dose received, completeness, and participant satisfaction with the HSL intervention.
2. Methods
2.1. Design and settings
This three-armed pilot quasi-experimental study used a repeated measure within- and between-participant design to compare HSL, to an active comparator—21st Century Summer Learning Program (21 C), and no-treatment control. An active comparator group in intervention studies is a type of control group where participants receive a commonly used treatment (National Center for Advancing Translational Sciences, 2021). The design, conduct, and reporting of this trial adhere to the Consolidated Standards of Reporting Trials (CONSORT) statement: extension to randomized pilot and feasibility trials (Eldridge et al., 2016). The CONSORT seeks to promote adequate reporting of research trials through the use of standardized reporting checklists and diagrams (Moher et al., 2010). All procedures were approved by the first author’s institutional review board (registration number Pro00065094) prior to enrollment of the first participant and were consistent with the ethical standards outlined by the Helsinki Declaration of 1975, as revised in 2000 (World Medical Association, 2001).
The goal of HSL was twofold: (1) to address declines in reading achievement in 2–4th grade students and (2) to mitigate accelerated BMI gains during the summer in children from low-income households. These outcomes were targeted because research has shown that children from low-income households are at risk for declines in reading achievement and accelerated BMI gain during the summer (Cooper et al., 1996; Downey et al., 2004; Park & Lee, 2015). Consistent with the principles of complex and adaptive preventative interventions (Collins et al., 2004; Hawe, Shiell, & Riley, 2004), HSL was designed as a set of interchangeable intervention components that together create a structured health and academic focused summer program.
2.2. Participants
Schools were selected because they served children from low-income households (100% free and reduced priced lunch) and operated a 21 C summer program. Inclusion criteria were that children were in the 2nd, 3rd, or 4th grade and their standardized reading score on the Measures of Academic Progress was between the 25th and the 75th percentile to be consistent with current criteria of the 21st Century Learning Center. Exclusion criteria was the presence of a severe intellectual disability (e. g., fragile X syndrome, severe autism). See Fig. 1 for a flow of participants through the study. All eligible children were recruited to participate in the study via informational fliers and consent forms sent home from school. Signed consent forms were returned to classroom teachers and collected by trained research assistants. Children provided verbal assent prior to participating in each measurement occasion.
Fig. 1.
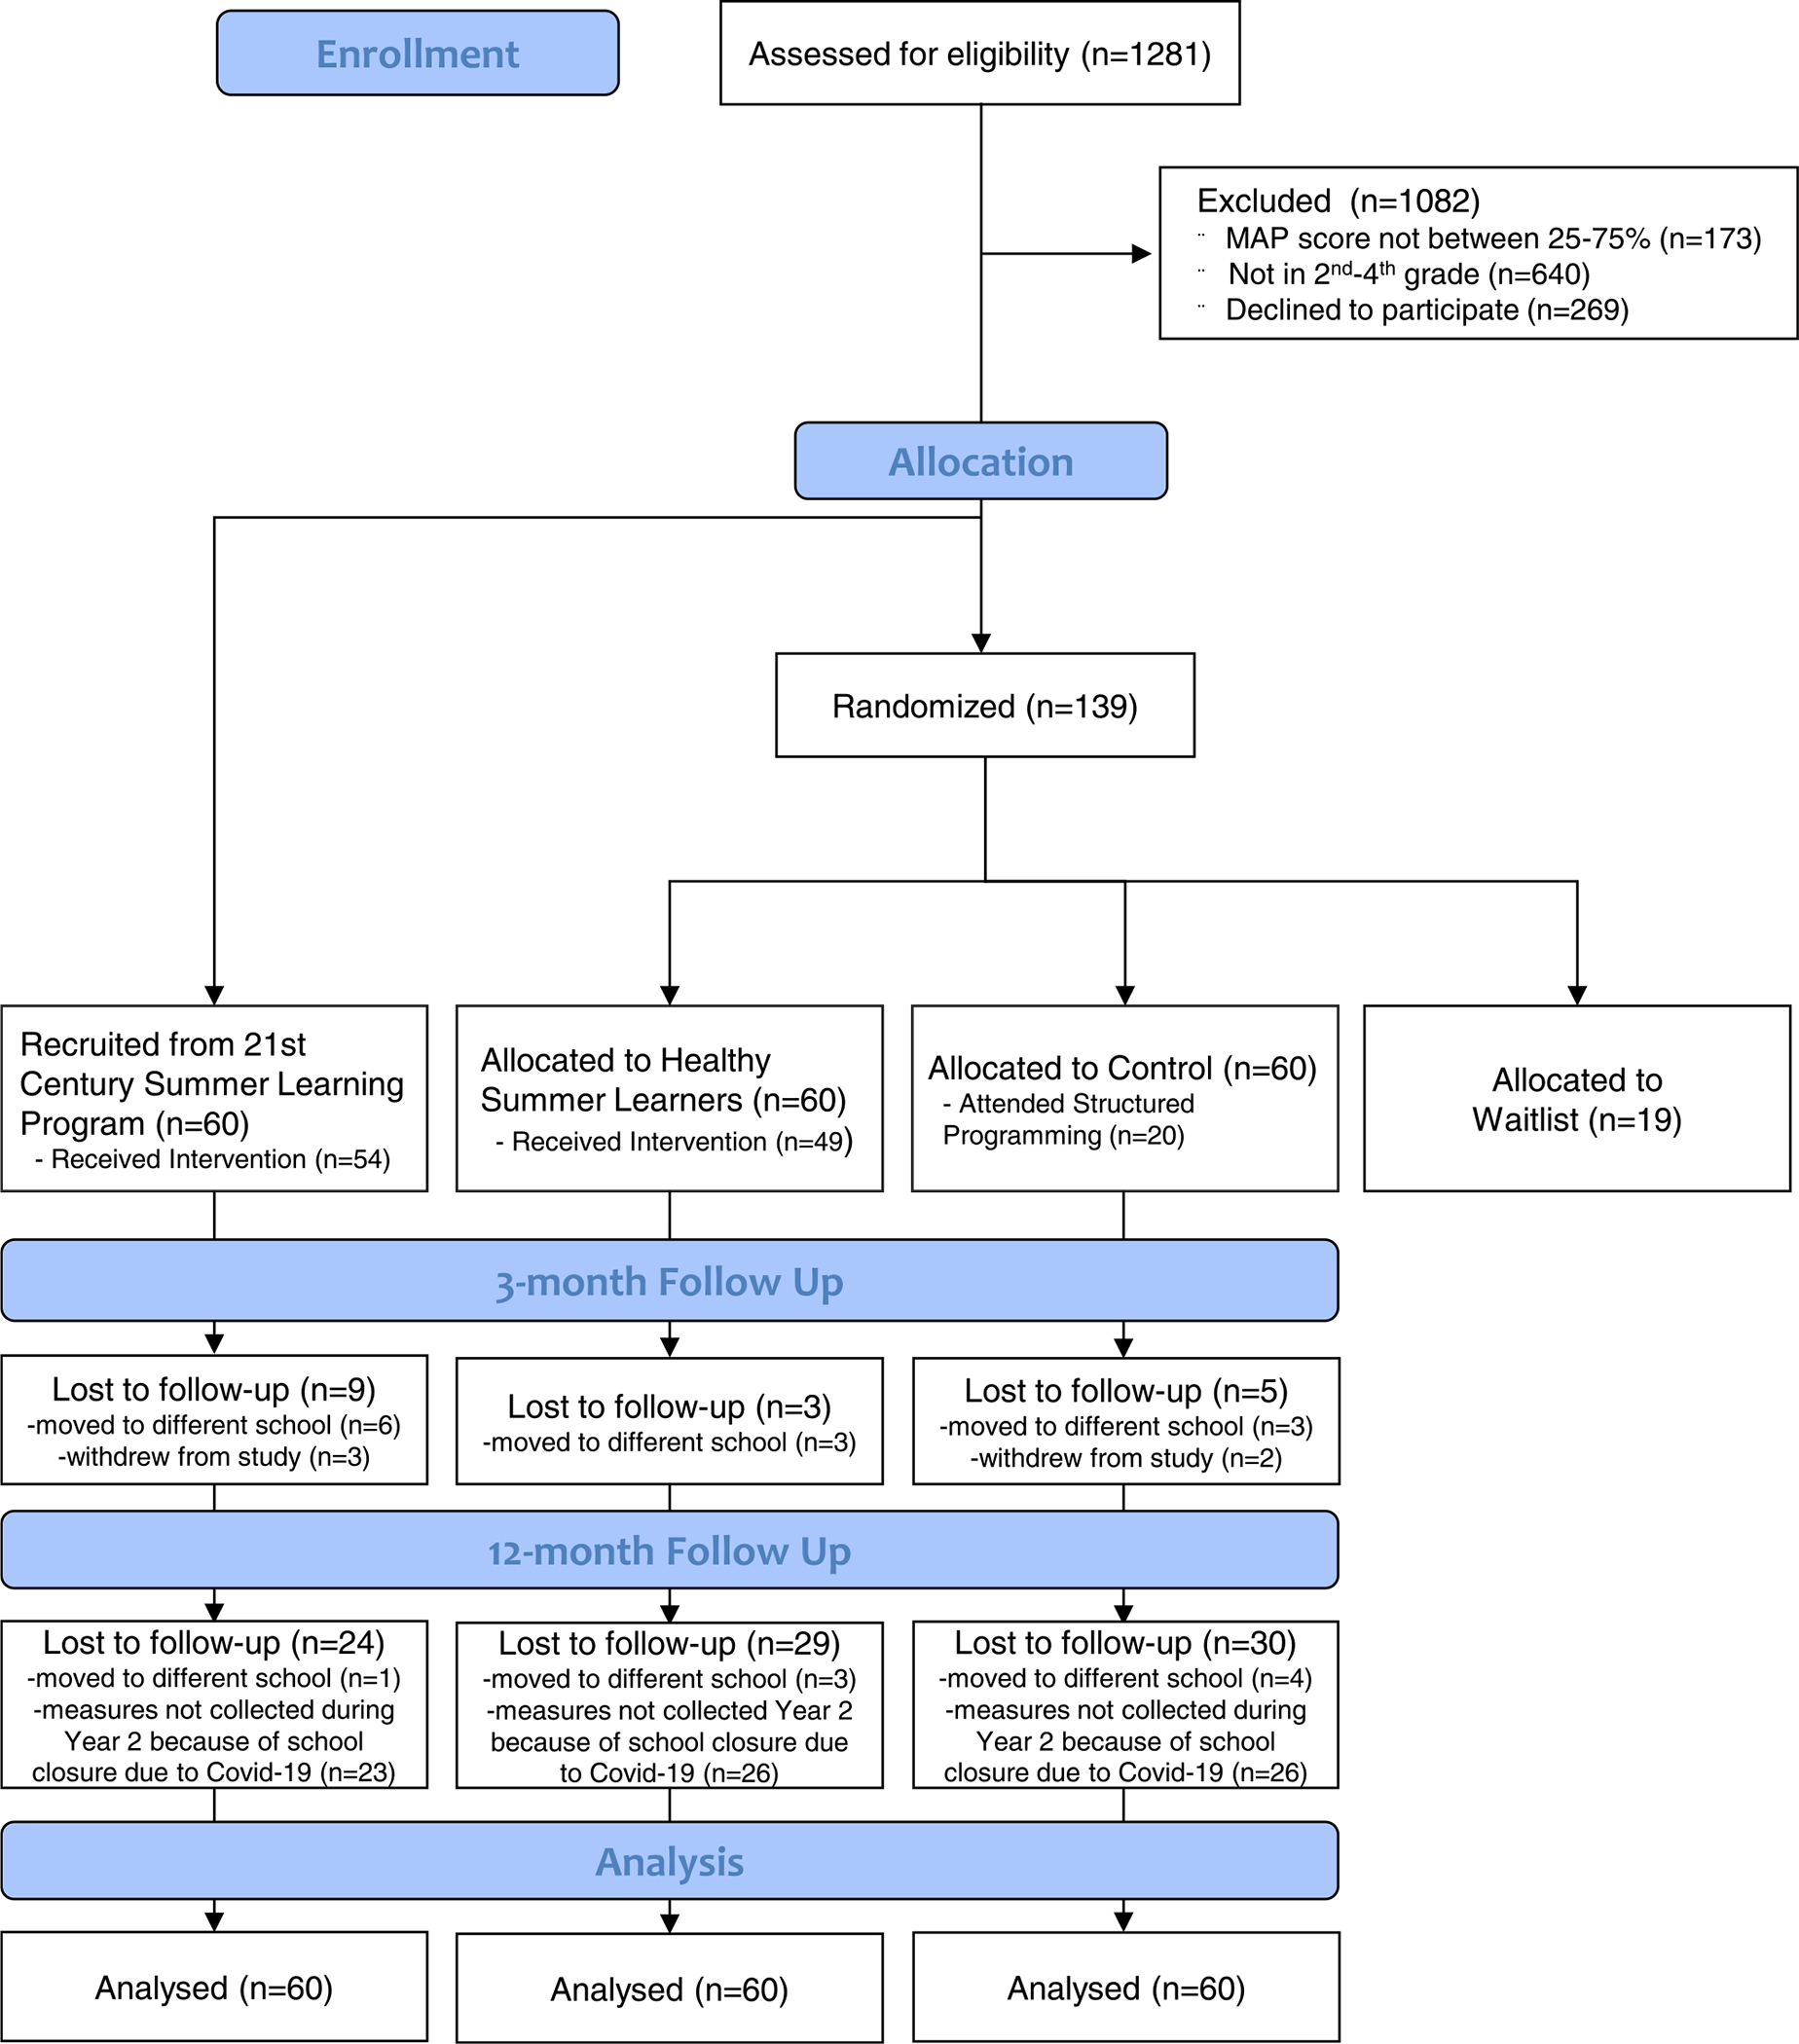
Consort diagram for the flow of participants through the study
2.3. Randomization
Schools assigned 60 children (e.g., 30 each summer) between the 25th-75th percentile on the Measures of Academic Progress and who were in 2nd, 3rd, or 4th grade to attend the 21 C. Thus, these children were not randomized. Children not assigned to 21 C, were randomly assigned to HSL or control group by the first author (RGW) who was not involved in data collection and was completed each summer after participants enrolled in the study, using the runiform command in Stata (v14.2, College Station, TX). Once implemented randomization could not be changed.
2.4. Intervention
Designed to mimic a regular school day, HSL operated daily (Monday-Thursday, 8:00 am-3:30 pm) for six weeks during the summer. A typical program day consisted of alternating periods of physical activity opportunities, reading instruction delivered by the certified teachers and meals (e.g., breakfast, lunch). All attendees were provided a USDA Summer Feeding Program compliant breakfast (8:00–8:30), lunch (12:30–13:00), and snack. A 15-minute nutrition education session, based on the USDA Team Nutrition Curriculum (United States Department of Agriculture Food and Nutrition Service), was delivered by one of the teachers each day during lunch (see Table 1). Academic and physical activity components were filled with a variety of different activity opportunities or instructional approaches that could be locally tailored in order to build on existing infrastructure within schools and school districts and allow for flexible adaptation and replication in other schools and districts.
Table 1.
Healthy summer learner program schedule.
| Time | Planned activity |
|---|---|
|
| |
| 8:00–8:30 AM | Arrival & USDA Compliant Breakfast |
| 8:30–9:45 AM | Reading Instruction, reading and writing with licensed teacher |
| 9:45–10:45 AM | Physical Activity – 100% free play |
| 10:45–12:45 PM | Reading Instruction, reading and writing with licensed teacher |
| 12:45 PM-1:15 PM | USDA Compliant Lunch and 15 min of Nutrition Education |
| 1:15–3:15 PM | Physical Activity – 50% structured, 50% free play |
| 3:15–3:30 PM | Student Dismissal |
To distribute costs across the project timeline HSL took place in two cohorts of children. The first cohort participated in the summer of 2018, while the second cohort consisted of different children at a different school that participated in the summer of 2019. Both schools were located in suburban South Carolina. HSL operated at the participating schools and was delivered by certified teachers employed at those schools. The program and bus transportation to and from the program were provided free of charge to the children enrolled.
2.4.1. Physical activity intervention
HSL was designed to deliver 3 h of physical activity opportunities each day the program operated. Consistent with the principles of complex and adaptive interventions (Collins et al., 2004; Hawe et al., 2004), there was no prescribed physical activity curriculum. Rather the intervention was based on the Theory of Expanded, Extended and Enhanced Opportunities (Beets et al., 2016; Brazendale et al., 2015), which posits the primary mechanism for increasing children’s accumulation of physical activity is through the provision of opportunities to be physically active. Physical activity was supervised and directed by certified physical education teachers employed by the school. Teachers were encouraged to provide children with a variety of structured and free play activities. Teachers were provided with the LET US Play physical activity training for maximizing children’s physical activity during activity opportunities (see Healthy Summer Learners Training below). Activity opportunities occurred either in an air-conditioned gym with equipment provided by the school, or outdoors on the school playground where free-play equipment (e.g., balls, jump rope) was also available to students.
2.4.2. Healthy eating intervention
The healthy eating intervention included the provision of breakfast, lunch, and a snack each day. The participating schools were USDA Summer Feeding Program Sites and thus mandated to serve foods aligned with program guidelines. For breakfast, this included provision of fruits or vegetables, and whole grain options daily and excludes sugar-sweetened milk beverages. In addition, breakfasts could not exceed 500 kcal, 10% kcal from saturated fat, and 430 mg of sodium and lunches cannot exceed 650 kcal, 10% kcal from saturated fat, and 640 mg of sodium. USDA guidelines required four components; milk, fruits and/or vegetables, a grain, and a meat or meat alternative. Snacks could include two of the four lunch components.
Additionally, HSL was designed to deliver nutrition education daily during lunch. While there was no mandated curriculum, teachers were provided with the USDA’s Team Nutrition curriculum (United States Department of Agriculture Food and Nutrition Service), materials as example activities. These materials included activity sheets, bookmarks, comics, stickers, and posters.
2.4.3. Reading intervention
Consistent with the principles of complex and adaptive preventative interventions (Collins et al., 2004; Hawe et al., 2004), and because a variety of approaches have successfully mitigated the summer decline in reading achievement (Borman & Dowling, 2006; Borman et al., 2009; Kim & Quinn, 2013; Lauer, Akiba, Wilkerson, Apthorp, Snow & Martin-Glenn, 2006; Mariano & Martorell, 2013; McCombs et al., 2014), teachers were not required to deliver a specific reading curriculum. Rather, the focus of the HSL program was to provide children with 3.25 h of reading instruction at the program daily. Teachers were encouraged to use the curricula and teaching strategies that they were familiar with and that were typically used during the school year. The majority of teachers chose to use portions of LitCamp™, a reading and writing curriculum designed for summer camps, as a framework for instruction as the participating district had access to this curriculum. Reading instruction was distributed throughout the day and not delivered consecutively. In total, students attending all days would have received 72 h of reading instruction. This duration was chosen based on meta-analyses which indicate 44–76 h of instructional time is beneficial (Lauer et al., 2006).
2.4.4. Healthy Summer Learners training
Prior to the conclusion of each school year (i.e., late May), a 90-minute HSL training was conducted for HSL administrators, teachers, and staff. The HSL training focused on healthy eating and physical activity promotion exclusively. The training did not include reading instruction as a component as certified teachers delivered all reading instruction components of HSL. The training was founded on the 5Ms—Mission, Manage, Motivate, Monitor, Maximize (Weaver, Beets, Webster, Beighle & Huberty, 2012) training model— and was designed to develop competencies related to increasing child engagement in healthy eating and physical activity. During trainings, HSL administrators, teachers, and staff participated in and led healthy eating exercises and physical activities. Competencies in the healthy eating training included role modeling and promoting healthy eating, and safe food handling. The physical activity component of the professional development training utilized the LET US Play principles (R Glenn Weaver, Webster, & Beets, 2013). These principles were introduced as a reflective tool for the identification of barriers that limit children’s activity during physical activity opportunities. Attending the staff training was mandatory for teachers, however some teachers were not present on the day of the training. Teachers who did not attend the group training were provided with one-on-one overviews over the phone. The trainings were led by the last author, a recognized expert in healthy eating and physical activity promotion.
2.5. Active comparator 21st century
The 21 C is a federally funded program providing academic opportunities for students attending low-performing schools. 21 C differed from HSL in three distinct ways; HSL included 3 h of PA programing each day while 21 C students only participated in one hour. The 21 C had a longer daily duration (21 C 8:30 – 14:00; HSL 8:30–13:00) and it ran for 4 weeks in 2018 and 6 weeks in 2019, while HSL ran for 6 weeks both summers.
2.6. Effectiveness outcomes
Baseline data collection was conducted prior to the beginning of summer programing during the last month of the school year prior to the intervention summer. Follow-up assessments were conducted 3- and 12-months following baseline. 3-month follow-up was the immediate post-intervention measure conducted at the end of the summer (post-summer) while 12-month follow-up was conducted at the end of the following school year (post-school) and was considered long-term follow-up. Participants were provided with $100 for completion of study assessments.
2.6.1. Body Mass Index – primary outcome
Following standardized protocols two trained research assistants collected children’s heights (nearest 0.1 cm) and weights (nearest 0.01 lbs.) without shoes in light clothing using a portable stadiometer (Model S100, Ayrton Corp., Prior Lake, Minn.) and digital scale (Healthometer model 500KL, Health o meter, McCook, Ill.). BMI was calculated (BMI=kg/m2) and transformed into age and sex specific z-scores (zBMI) according to the Centers for Disease Control growth charts (Kuczmarski et al., 2002).
2.6.2. Measures of academic progress reading scores – primary outcome
Children’s reading achievement was assessed via the MAP reading assessment. Created by the Northwest Evaluation Association (http://www.nwea.org), MAP results are widely accepted and used extensively in school-aged children (Thum and Hauser, 2015). Scores are reported using the Rasch Unit Scale, a curriculum scale developed using Item Response Theory that estimates student achievement. The Rasch Unit Scale ranges from 140 to 300 and are norm referenced based on grade (Thum and Hauser, 2015). MAP reading assessment were administered as part of typical curriculum in the fall (first month of school) and end of the spring (last month of school) of each year.
2.6.3. Cardiorespiratory fitness – secondary outcome
The Progressive Aerobic Cardiovascular Endurance Run (PACER) was administered during regularly scheduled PE. This test produces valid estimates of elementary school-aged children’s cardiorespiratory fitness (Fu et al., 2017; Tomkinson, Léger, Olds & Cazorla, 2003; Welk & Meredith, 2010). The PACER was carried out by a trained research assistant and the PE teacher following standardized protocols on a marked outdoor green space.
2.7. Process evaluation
The process evaluation for HSL was based upon best practice for developing an implementation monitoring plan (Pinnock et al., 2017; Saunders, 2015). Quantitative data were collected first to describe the reach, dose received, implementation fidelity, completeness, and participant satisfaction with the HSL program (see Table 2), after which interviews were conducted with parents and HSL administrators, teachers, and staff to explain the quantitative results (Wu, Deatrick, McQuaid & Thompson, 2019). Adaptive interventions emphasize delivery of the components of the program, not necessarily the content delivered within any given component.
Table 2.
Process evaluation components and corresponding measures.
| Evaluation Components | Data collection Instruments | Construct | Source | Measurement Frequency |
|---|---|---|---|---|
|
| ||||
| Reach | Review of Attendance Records at Healthy Summer Learners Training | Percent of administration, teachers, and staff attending | Document Review | Annual training prior to HSL program delivery |
| Healthy Summer Learners Attendance Records | Mean number of HSL program days attended | Document Review | Daily | |
| Cost | Review of Healthy Summer Learners Budget | Weekly cost per child | Document Review | Annual review following HSL program delivery |
| Fidelity, Dose Received, Completeness | System for observing staff promotion of physical activity and nutrition (SOSPAN) | Daily time allocated to physical activity and reading instruction. Daily delivery of nutrition education | Researcher Observation | Bi-weekly unannounced visit to HSL program |
| Interviews | Teacher perceptions of time allocated to physical activity and reading instruction & barriers to and facilitators of program implementation. | Administration, Teachers, and Staff | Annual following HSL program delivery | |
| System for observing staff promotion of physical activity and nutrition (SOSPAN) | Implementation of LET US Play principles | Researcher Observation | Bi-weekly unannounced visit to HSL program | |
| Interviews | Benefits of and barriers to program delivery and attendance | Parents, Administration, Teachers, and Staff | Annual following HSL program delivery | |
| Satisfaction | Interviews | Parents satisfaction with HSL program and willingness to pay for HSL program in the future | Parents | Annual review following HSL program delivery |
| Healthy Summer Learners Enjoyment Survey | Mean rating of program enjoyment | Children | Annual during the last week of the HSL program | |
2.7.1. Reach
Aligning with adaptive intervention delivery and implementation monitoring and process evaluations (Saunders, 2015), reach was operationalized as percent of HSL administrators, teachers, and staff attending the HSL program training and the mean number of days children attended HSL or 21 C. Reach was measured in two ways. First, teacher attendance at the staff training was kept via an attendance log each year. Second, student attendance was recorded at the HSL and 21 C program every morning of operation by teachers. Attendance records were collected from teachers by research staff on a weekly basis and children were categorized by median split (M=19 days) with students attending more than 19 of the 24 days classified as having high attendance.
2.7.2. Cost
For this study cost was operationalized as weekly cost per child. Cost was collected to compare actual costs with costs that parents were willing to pay in order to better understand the potential per-person cost of executing a HSL All resource use associated with operating the HSL program was compiled by research staff in collaboration with the HSL program administrators (Ritzwoller, Sukhanova, Gaglio & Glasgow, 2009). Costs were documented prospectively in real-time diaries over the duration of the two intervention years. Costs were separated into four broad categories: salaries and stipends, employee benefits, purchased services, and supplies and materials. All hourly salaries were set by the school district and were consistent with district pay scales. Salaries and stipends included hourly pay for one project administrator and three certified teachers at $30/hour. As well as pay for three substitute teachers to cover the certified teachers’ classrooms during HSL training, pay for a nurse to be present at the HSL program at $30/hour, pay for two teaching assistants at $15/hour. Purchased services included: a weekly charge of $500 for cleaning services, salary support for a bus driver at $20 per hour, and the district mandated $1.30 per mile charge for bus travel. Supplies and materials included: costs for a HSL family orientation night at the participating school, books & backpacks provided to the participating children, printing, and supply costs for teachers and staff.
2.7.3. Fidelity, dose received
For this study fidelity and dose received were operationalized as daily delivery of nutrition education, daily time allocated to physical activity (3 h), and reading instruction (3.25 h). Additionally, physical activity opportunities were assessed for their compliance with the LET US Play principles. A description of the LET US Play principles can be found elsewhere (Weaver, Beets, & Webster, 2013). LET US is an acronym for lines, elimination, team size, uninvolved children, and space, equipment and rules. LET US Play was used as a reflective tool for staff to identify and modify components of physical activity opportunities that limit children’s accumulation of physical activity. A modified version of the System for Observing Staff Promotion of Activity and Nutrition (Weaver, Beets, Webster & Huberty, 2014) was used to measure fidelity and dose received. Trained research assistants observed program implementation of each HSL teacher on three randomly selected, non-consecutive days separated by at least one week each summer. Research assistants were trained on systematic observation for an intensive one-hour period to learn procedures. Training included role-playing mock scenarios, practice scans and discussions about operationalized terms (i.e. free play vs. organized physical activity). On observation days, a research assistant arrived unannounced at the HSL site prior to the start of the program day. The research assistant followed a single teacher’s class for the entirety of the program day. Time dedicated to meals/snacks, physical activity opportunities, reading instruction, enrichment, transition between activities, and drop off/pickup times were cataloged. Classroom time was coded as enrichment if it had no observable connection to academic standards (e.g. coloring, board games). Each physical activity opportunity was also coded for observed applications of LET US Play principals (Brazendale et al., 2015; Weaver et al., 2013).
2.7.4. Satisfaction
Satisfaction with the HSL program was collected from parents and students. Parent satisfaction indicators were collected via semi-structured phone interviews with parents (see below). Parents were asked about their willingness to pay for HSL in the future, “Would you be willing to pay for this program next year? Why/Why not?” If parents indicated they were willing to pay, a follow-up question was used to gauge “How much would you be willing to pay per week for this program?”. Student satisfaction was measured through an age-appropriate stem-and-leaf survey that was adapted from the Physical Activity Enjoyment Scale (Moore, Yin, Hanes, Duda, Gutin & Barbeau, 2009) and that drew upon constructs of self-determination theory (e.g. autonomy, competence & relatedness) (Deci & Ryan, 2000). The survey was administered in the HSL classrooms via pen and paper, during the final week of the HSL program each summer. Prior to administration of the survey the teacher left the classroom. Each survey question was read aloud by one research assistant while a second research assistant circulated throughout the room to answer any student questions. Students were asked to circle one of two possible answers for each question, a “smiley-face” or a “sad-face.” Student’s perceived autonomy was measured by questions such as “ [Stem Question]When I am at the Healthy Summer Learner’s Summer Program… [Leaf] I get to decide what I am going to do in the classroom” or “[Leaf] I get to decide what I am going to do in the gym and outside.” Relatedness was measured using items such as “[Stem Question] When I am at the Healthy Summer Learner’s Summer Program… [Leaf] I am included by others in the gym and outside.” Competence was measured by items asking “[Stem Question] I attend class during Healthy Summer Learner’s because… [Leaf] I am good at the things that we do in the classroom.” Student satisfaction was operationalized as mean rating of HSL program enjoyment by students on a standardized survey.
2.7.5. Fidelity and completeness
All HSL program administrators, teachers, and staff completed a 20 min in-person interview facilitated by trained research assistants. Interviews were completed at the participating school in a private office during the last week of the HSL program. The interview followed a semi structured guide based on intervention implementation frameworks (Durlak & DuPre, 2008) and were designed to identify program administrator, teacher, and staff perceptions of fidelity and completeness of HSL program delivery. Program administrators, teachers, and staff were asked how well they were able to implement the components of the HSL program. They were also asked about facilitators of and barriers to delivering the HSL program as intended (Appendix A).
2.7.6. Satisfaction, fidelity, and completeness
All children’s parent/caregivers were contacted following the conclusion of the HSL program in order to complete phone interviews. Contact with parents was attempted a total of three times. If the parent was not reached by the third attempt, the data were considered missing. All interviews were facilitated and transcribed verbatim by two graduate research assistants. A semi-structured guide was developed by the research team and utilized during the interview to assess parental perceptions of the benefits of and barriers to program attendance and the satisfaction with the HSL program (Appendix).
2.8. Sample size
The above selection criteria yielded 60 children in each arm of the study. Previous studies have shown that samples of 60–100 participants provide reliable estimates of statistical and recruitment parameters upon which subsequent large-scale trials can be based (Teare, Dimairo, Shephard, Hayman, Whitehead & Walters, 2014). Even though a priori power analyses are not typical in pilot studies (Thabane et al., 2010), achieved power was calculated in order to better inform future large-scale evaluations of HSL. According to the statistical software G*power 3.1.9.7, the study was powered to detect a difference in the primary outcomes between intervention groups of d= 0.18 with a power= 80% and α = 0.05.
2.9. Analysis
For the effectiveness outcomes all inferential analyses were completed in April of 2020 using Stata (v14.2, College Station, TX) with α levels set to P < 0.05. Data were assessed for normality and descriptive statistics of programs, child characteristics, and outcome variables were examined at baseline. The analyses were estimated using an intent-to-treat approach (McCoy, 2017; White, Carpenter, & Horton, 2012). Post-hoc as-treated analyses were also completed. This decision was made because, based on the process outcomes, 20 of the 60 children in the control group attended structured summer programming of some kind while, 11 of 60 children in HSL and 4 of 60 the children in 21 C never attended their respective programs. For the intent-to-treat analyses, multilevel mixed effects linear regressions with measures nested within children were estimated. Separate models were estimated for each dependent variable (i.e., BMI z-score, MAP reading score, and PACER Laps completed) and included dummied group (control, HSL, 21 C), time (baseline, post-summer, post schoolyear), and all group-x-time interactions. For the as-treated analyses, the group variable was dichotomized into attenders vs. non-attenders. Attenders were those children from the control, HSL, or 21 C groups that attended a structured summer program of any kind for at least 1 day while non-attenders were those children that did not attend a structured summer program. All analyses included baseline scores on the dependent variable, age, gender, race, and year of participation (i.e., 2018 or 2019) as covariates in the models. Missing data were handled using full information maximum likelihood estimates (Royston, 2004; White et al., 2011). The Benjamini-Hochenberg procedure with a false discovery rate of 10% was utilized to account for multiple comparisons (Benjamini & Hochberg, 1995).
For the process outcomes means, standard deviations, and percentages were computed for all relevant variables for reach, cost, fidelity, dose received, completeness, and satisfaction. Cost per child/week was estimated by dividing the total cost of the program by the number of children enrolled (i.e., cost per child) and then dividing cost per child by the number of weeks the program operated. Administrator, teacher, and staff interviews were uploaded into a single file in QSR NVIVO Version 12 (Sage Publications Software). Two coders independently coded the data using a three-step latent coding technique (Bernard, Wutich, & Ryan, 2016) guided by grounded theory (Anselm Strauss & Juliet Corbin, 1998) and an immersion crystallization approach (Borkan, 1999). First, coders independently read and generated codes for a single transcript by grouping recurring words, phrases, and themes. Second, coders and a third reviewer met in order to review codes, integrate/add codes to a running list of codes generated from each transcript (i.e., coding guide), and to arbitrate any disagreements between coders. There were several minor disagreements between coders that were resolved via discussion. Third, transcripts were revisited by the coders to determine if additional codes were needed and if the coding guide had reached saturation (A Strauss & J Corbin, 1998). This iterative process was repeated until all transcripts were read and a comprehensive coding guide was created. Codes were classified into broad level themes with each theme having several subthemes. The two independent coders and third reviewer combined and classified codes into sub-themes through discussion. Themes were developed using inductive analysis. Several steps have been taken to ensure the trustworthiness of the study findings. These include triangulation of quantitative and qualitative data, iterative questioning, frequent peer debriefing between coders and a third reviewer, and negative case analysis in the development of themes (Shenton, 2004).
3. Results
3.1. Effectiveness outcomes
The flow of participants through the study is presented in Fig. 1. A total of 1281 students at two schools were assessed for eligibility with 843 children not eligible because they were not in 2nd-4th grade (n = 640) or did not have a MAP reading score between the 25th and 75th percentile (n = 173). A total of 408 students were invited to participate with 269 students declining to participate. Thus, 199 students were included in the study with 60 assigned to 21 C by the participating school and 139 students were randomized to HSL (n = 60), control (n = 60), or a waitlist group (n = 19). At 3-month follow up, 163 students completed assessments (90.6% retention rate) and at 12-month follow up 79 students completed assessments (43.9% retention rate). In the second year 12-month follow up assessments were not completed because schools closed early due to the COVID-19 pandemic. A total of 90 students participated in the first cohort in summer 2018, and 90 students participated in a second cohort in 2019. There was no overlap in participants between the first and second summer because HSL operated at a different school each summer. There were no significant differences between those who did and did not complete assessments in zBMI, MAP reading score, or PACER Laps completed. Demographics of participants at baseline are presented in Table 3.
Table 3.
Baseline demographics of participants by program.
| P-value for differences |
||||||
|---|---|---|---|---|---|---|
| No Program | HSL | 21 C | HSL vs. No Program | 21 C vs. No Program | 21 C vs. HSL | |
|
| ||||||
| Number of Participants | 60 | 60 | 60 | |||
| Mean Age in Years (SD) | 7.9 (1.0) | 7.9 (1.0) | 8.0 (1.0) | 0.682 | 0.264 | 0.503 |
| Male (%) | 45.3 | 48.5 | 27.4 | 0.590 | 0.023 | 0.006 |
| Participants by Race (%) | ||||||
| Non-Hispanic Black | 93.8 | 92.4 | 93.5 | 0.389 | 0.729 | 0.588 |
| Other | 6.2 | 7.6 | 6.5 | 0.389 | 0.729 | 0.588 |
| Body Composition | ||||||
| Mean BMI (SD) | 20.9 (6.1) | 20.5 (4.9) | 20.5 (4.9) | 0.729 | 0.378 | 0.612 |
| Mean BMI z-score (SD) | 0.95 (1.1) | 0.99 (1.1) | 0.99 (1.1) | 0.817 | 0.611 | 0.468 |
| Mean BMI Percentile (SD) | 72.7 (27.5) | 74.6 (27.6) | 74.5 (27.6) | 0.707 | 0.818 | 0.548 |
| Percent Overweight or Obese | 47.7 | 51.7 | 51.7 | 0.655 | 0.308 | 0.151 |
| Mean MAP Reading Score (SD) | 194 (11.6) | 190.8 (12.0) | 192.6 (12.4) | 0.076 | 0.609 | 0.192 |
| Mean PACER Laps Completed (SD) | 11.6 (6.9) | 13.5 (7.4) | 13.5 (7.4) | 0.129 | 0.368 | 0.506 |
Abbreviations: ”HSL” Healthy Summer Learners, “21 C” 21st Century Learning Center, “SD” Standard deviation, “BMI” Body Mass Index, “MAP” Measures of Academic Progress, “PACER” Progressive Aerobic Cardiovascular Endurance Run.
P-value for comparison between groups at baseline. Continuous variables compared using linear regression; categorical variables compared using logistic regression.
During the second summer the 21st Century Learning Center extend the program from 16 to 24 days and the median attendance was 20 days.
3.1.1. Intent-to-treat analyses
Changes for all effectiveness outcomes are reported in Table 4. No statistically significant group-by-time interactions at 3- or 12-month follow up were found for the primary outcomes of zBMI or MAP reading score or the secondary outcome of PACER Laps. However, control participants experienced a statistically significant increase in zBMI of 0.06 (95CI=0.01, 0.12) over the summer (i.e., 3-month follow-up) while HSL (Δ=0.03, 95CI=−0.03, 0.10) and 21 C (Δ=0.02, 95CI=−0.03, 0.08) did not. After the following school year (i.e., 12-month follow-up) control participants had gained 0.09 (95CI=0.01, 0.12) in zBMI while HSL and 21 C had only gained 0.04 in zBMI (95CIs=−0.02, 0.14, and −0.03, 0.12, respectively). Control, HSL, and 21 C experienced statistically significant gains in MAP reading score of 12.2 (95CI=9.1, 15.2), 12.4 (95CI=9.5, 15.3), and 14.9 (95CI=12.1, 17.7), respectively at 12-month follow-up. HSL and 21 C experienced statistically significant gains in PACER laps accumulated of 3.9 (95CI=1.2, 6.5) and 3.2 (95CI=0.2, 6.2), respectively.
Table 4.
Model implied estimates for intent-to-treat and as-treated analyses.
| Post-Summer Change From Baseline (3-month follow-up) | Post-School Change From Baselinea (12-month follow-up) | |||||||||||
|---|---|---|---|---|---|---|---|---|---|---|---|---|
|
|
|
|||||||||||
| Pre summer | Post-summer | Post-School | Δ | 95CI | Difference in Δ | 95CI | Δ | 95CI | Difference in Δ | 95CI | ||
|
| ||||||||||||
| Intent-to-treat | ||||||||||||
| BMI z-score | Control | 0.83 | 0.89 | 0.91 | 0.06 | (0.01, 0.12) | 0.09 | (0.01, 0.17) | ||||
| HSL | 0.83 | 0.86 | 0.86 | 0.03 | (−0.03, 0.09) | −0.03b | (−0.11, 0.06) | 0.04 | (−0.02, 0.14) | −0.05b | (−0.14, 0.08) | |
| 21 C | 0.83 | 0.85 | 0.87 | 0.02 | (−0.03, 0.08) | −0.04c | (−0.12, 0.04) | 0.04 | (−0.03, 0.12) | −0.04c | (−0.15, 0.07) | |
| MAP Reading Score | Control | 192.7 | 193.6 | 204.8 | 0.9 | (−1.4, 3.2) | 12.2 | (9.1, 15.2) | ||||
| HSL | 192.4 | 194.2 | 204.7 | 1.8 | (−0.5, 4.2) | 0.9b | (−2.4, 4.2) | 12.4 | (9.5, 15.3) | 0.2b | (−4.0, 4.4) | |
| 21 C | 192.3 | 193.0 | 207.2 | 0.7 | (−1.5, 2.8) | −0.2c | (−3.4, 2.9) | 14.9 | (12.1, 17.7) | 2.7c | (−1.4, 6.9) | |
| PACER Laps | Control | 12.2 | 12.1 | 15.6 | −0.1 | (−1.7, 1.5) | 3.4 | (−1.7, 1.5) | ||||
| HSL | 12.5 | 12.3 | 16.3 | −0.1 | (−1.8, 1.5) | 0.0b | (−2.4, 2.3) | 3.9 | (1.2, 6.5) | 0.5b | (−3.1, 4.0) | |
| 21 C | 12.4 | 13.7 | 15.7 | 1.3 | (0.3, 2.9) | 1.4c | (−0.9, 3.6) | 3.2 | (0.2, 6.2) | −0.2c | (−4.0, 3.6) | |
| As-treated | ||||||||||||
| BMI z-score | Non-attender | 0.83 | 0.91 | 0.91 | 0.08 | (0.02, 0.14) | 0.08 | (0.01, 0.16) | ||||
| Attender | 0.83 | 0.85 | 0.88 | 0.02 | (−0.02, 0.06) | −0.07 | (−0.14, 0.01) | 0.05 | (−0.01, 0.11) | −0.03 | (−0.12, 0.06) | |
| MAP Reading Score | Non-attender | 192.3 | 192.7 | 205.3 | 0.4 | (−2.1, 1.9) | 13.0 | (10.6, 16.4) | ||||
| Attender | 192.4 | 194.9 | 205.9 | 2.5 | (0.2, 4.8) | 2.1 | (−4.9, 0.7) | 13.5 | (11.0, 15.1) | 0.5 | (−6.1, 8.0) | |
| PACER Laps | Non-attender | 12.7 | 13.0 | 16.9 | 0.3 | (−1.4, 1.9) | 4.2 | (1.3, 6.5) | ||||
| Attender | 12.9 | 13.3 | 17.2 | 0.5 | (−0.7, 1.7) | 0.2 | (−1.8, 2.2) | 4.3 | (2.3, 6.4) | 0.2 | (−3.0, 3.3) | |
Bolded numbers are statistically significant at p < 0.05.
Abbreviations: “95CI” 95% Confidence Interval, “HSL” Healthy Summer Learners, “21 C” 21st Century Summer Learning Program, “BMI” Body mass index, “MAP” Measures of Academic Progress, “PACER” Progressive Aerobic Cardiovascular Endurance Run.
Not collected on the second cohort due to Covid-19 school closures.
HSL vs. Control.
21 C vs. Control.
3.1.2. As-treated analyses
Post-hoc as-treated analyses are also reported in Table 4. No statistically significant group-by-time interactions at 3- or 12-month follow up were found for the primary outcomes of zBMI or MAP reading score or the secondary outcome of PACER laps. Children that did not attend structured summer programming experienced a statistically significant increase of 0.08 (95CI=0.02, 0.14) in zBMI while attenders experienced an increase of 0.02 (95CI=−0.02, 0.06). Children who attended structured programming also experienced a statistically significant increase in MAP reading scores over the summer (i.e., 3-month follow-up) of 2.5 (95CI=0.2, 4.8) while children who did not attend structured programming did not (Δ=0.4 95CI=−2.1, 1.9). After the following school year (i.e., 12-month follow-up) children who did not attend a structured program experienced a statistically significant increase of 0.08 (95CI=0.01, 0.16) in zBMI while attenders experienced an increase of 0.05 (95CI=−0.01, 0.11). Both children who did and did not attend structured programming experienced statistically significant increases in MAP reading scores of 11.7 (95CI=6.7, 14.7) and 10.7 (95CI=5.9, 17.5) and PACER laps completed of 4.3 (95CI=2.3, 6.4) and 4.2 (95CI=1.3, 6.5), respectively.
3.2. Process evaluation: reach
3.2.1. HSL training attendance
In both 2018 and 2019 a total of six staff (teacher=3, teaching assistants=2, program administrator=1) were employed by the HSL program. Attendance sheets collected at the training in 2018 indicated that all six staff attended the HSL training while in 2019 only three staff attended the HSL training (two teachers and the program administrator).
3.2.2. Child attendance at HSL
For children, the mean number of program days attended was 15 (SD=9) of the possible 24 days of operation across both years. Attendance was higher in 2018 (i.e., 17; SD=8) and declined in 2019 (i.e., 13; SD=10). A total of 28 children attended ≥ 19 days and were classified as high attenders (Table 5). In 2018, 23 children were identified as high attenders of HSL while only 15 were high attenders in 2019. Across both years, a total of 11 children were enrolled but never attended the HSL (i. e., 4 in 2018, and 7 in 2019).
Table 5.
Summer programing attendance.
| Summer 2018 |
Summer 2019 |
Combined Years | ||||
|---|---|---|---|---|---|---|
|
|
|
|
||||
| HSL | 21 C | HSL | 21 C | HSL | 21 C | |
|
| ||||||
| Number of children attending 24 days | 8 | 0 | 3 | 8 | 11 | 8 |
| Number of children enrolled | 30 | 30 | 29 | 36 | 59 | 66 |
| Percent of children attending all 24 days | 27 | 0 | 10 | 22 | 19 | 12 |
| Mean Days attended | 16.8 | 12.8 | 12.6 | 17.5 | 14.7 | 15.3 |
| Median Days Attended | 20.5 | 15.0 | 15.0 | 20.0 | 19.0 | 16.0 |
| Number of children never attending | 4 | 2 | 7 | 2 | 9.0 | 4.0 |
| Percent of children never attending | 13 | 7 | 24 | 6 | 15 | 6 |
| SD of Days attended | 8.4 | 4.9 | 9.6 | 7.4 | 9.2 | 6.7 |
In the control group, 13 children in 2019, and 7 children in 2018 reported attending structured summer programming for at least one day.
3.2.3. Cost
Overall operating costs for HSL were $95,000 (i.e., $47,500 per year). A breakdown of the cost categories is presented in Table 6. With 60 children (i.e., 30/year) enrolled for 12 total weeks (6 weeks/year) the cost per/week for each child was $263.89. Salaries for the project administrator, certified teachers totaled $28,800 while salary for the support staff totaled $16,600. Employee benefits covering FICA and district-required retirement benefits totaled $12,126. Service solutions to clean the schools cost $6000 across both summers, as did operating the school bus (mileage and salary). Supplies for students and teachers cost $9250 each summer while special events (e.g., parent orientation night, field trip to library) cost $2728.
Table 6.
Healthy summer learners program costs.
| Budget Category | Yearly Costs | Overall Costs |
|---|---|---|
|
| ||
| Salaries/Stipends | $22,700 | $45,400 |
| Employee Benefits | $6063 | $12,126 |
| Purchased Services | $6000 | $12,000 |
| Supplies and Materials | $11,978 | $23,956 |
| Total Costs | $47,500 | $95,000 |
3.3. Process evaluation: fidelity, dose received, completeness
3.3.1. Systematic observations
Table 7 presents the markers of HSL fidelity. Overall across both years HSL consisted of 2.3 (SD=0.6) hours of PA opportunities (2018 =2.6, SD=0.2; 2019 =2.1, SD=0.7), 1.8 (SD=0.9) hours of reading instruction (2018 =1.9, SD=0.8; 2019 =1.7, SD=0.3), 1.4 (SD=1.2) hours of meal/snack time (2018 =1.1, SD=0.4; 2019 =1.6, SD=1.6), and 1.4 (SD=1.4) hours of other activities (e.g., enrichment, transitions, drop-off pick-up) on average. Healthy eating education was observed on all three observation days in 2018 and no observation days in 2019.
Table 7.
Markers of fidelity for Healthy Summer Learners.
| Summer 2018 |
Summer 2019 |
Overall | |
|---|---|---|---|
|
| |||
| Time Allocated for Physical Activity (Hours, SD)a | 2.6 (0.2) | 2.1 (0.7) | 2.3 (0.6) |
| Time Allocated for Reading Instruction (Hours, SD)b | 1.9 (0.8) | 1.7 (0.3) | 1.8 (0.9) |
| Time Allocated for Meals/Snacks (Hours, SD) | 1.1 (0.4) | 1.6 (1.6) | 1.4 (1.2) |
| Time Allocated for other activities (e.g., enrichment, transitions, drop-off pick-up) (Hours, SD) | 1.8 (1.3) | 1.1 (0.7) | 1.4 (1.1) |
| Number of Days Healthy Eating Education Delivered | 3 | 0 | 3 |
| Percent of Days Healthy Eating Education Delivered | 100 | 0 | 50 |
| Number of Days USDA Compliant Meals Served | 3 | 3 | 6 |
| Percent of Days USDA Compliant Meals Served | 100 | 100 | 100 |
Total of 3 h intended to be delivered daily.
Total of 3.5 h intended to be delivered daily.
All meals during both summers were compliant with the USDA Summer Feeding Program as evidence by reimbursement from the USDA. The common meal pattern observed was one protein, one fruit or vegetable, one grain and one drink. Example observed proteins included sausage patty, chicken nuggets, and hot dogs. Fruits and vegetables observed included ¾ cup of mixed canned fruit, ¼ cup of cooked peas, or a small apple. Drinks offered included one 8 oz container of 1% plain milk and 4 oz cup of orange juice. Examples of grains include hamburger buns and whole wheat dinner rolls. One oz condiment packets were commonly observed often including honey mustard and Italian salad dressing, ketchup, and mustard.
Table 8 presents the observation of LET US Play principles during PA opportunities. Over the course of six observed days (i.e., 3 per year), an average of 22.5 PA opportunities were observed across each grade level (2018 =11.3 opportunities, 2019 =11.6 opportunities) with an average duration of 36.9 min (2018 =41.3 min, 2019 =32.6 min). A total of 11% of PA opportunities included children waiting in lines (2018 =6%, 2019 =14%), while 6% of PA opportunities were large team activities (2018 =20%, 2019 =0%), and 9% eliminated children from PA opportunities (2018 =0%, 2019 =14%). Staff members were engaged in the activity with children in 55% (2018 =81%, 2019 =39%) and encouraged physical activity in 82% (2018 =94%, 2019 =75%) of the observed PA opportunities.
Table 8.
Application of the LET US Play principles during physical activity opportunities.
| 2018 | 2019 | Overall | |
|---|---|---|---|
|
| |||
| PA Opportunities | |||
| Mean number of opportunities observed per grade (SD) | 11.3 (1.2) | 11.6 (2.1) | 22.5 (1.5) |
| Mean Minutes per opportunity (SD) | 41.3 (19.0) | 32.6 (21.4) | 36.9 (20.2) |
| Percent of indoor physical activity opportunities | 50% | 93% | 77% |
| Percent of free play physical activity opportunities | 44% | 20% | 29% |
| LET US Play Principals | |||
| Children waiting in lines | 6% | 14% | 11% |
| Large team size (e.g., games larger than 10 students) | 20% | 0% | 6% |
| Children eliminated from physical activity opportunities | 0% | 14% | 9% |
| Staff members engaged with children in physical activity opportunities | 81% | 39% | 55% |
| Staff encouraging physical activity | 94% | 75% | 82% |
Organized and Free Play were coded simultaneously in 2 instances in 2018 and 2019 (e.g. half of students participated in organized PA.
3.3.2. Parent interviews
A total of 54 parents were contacted for phone interviews (accounting for four sibling-pairs and two parents that were not contacted because of missing phone number information). Of the 54 parents, 12 did not participate in an interview with 5 not participating due to disconnected phone numbers and 7 not responding to calls. Across both years, parents of 5 of the 11 never-attending parents were interviewed. The 42 parent interviews each lasted between 10 and 15 min. Parents of low-attending children were among the 20 parents interviewed in 2018, the main barriers to HSL participation were family events (i.e. funerals, vacations; n = 3), child illness (n = 3), and changes in, or conflicts with, parental work schedules (n = 2). Greater barriers to attendance were reported in 2019 by the 20 parents interviewed with inconsistent bussing schedule being the primary reported barrier (n = 5) followed by changes or conflict with parental work schedules (n = 3) and voluntary non-attendance due to dissatisfaction or confusion with program (n = 3). Of note, 9 of the 13 parents of low-attending children were interviewed in 2019. 5 of the 9 parents interviewed from the low-attending group mentioned transportation difficulties as a barrier to attendance. A total of eight parents indicated they were not willing to pay for HSL, while nine parents indicated they were willing to pay < $50, 21 indicated they would pay $50-$99, and two indicated they were willing to pay > $100 per week for their child to attend HSL. All parents interviewed reported that there was a need in their community for summer programing like HSL. Parents indicated that programs like HSL were needed because summer day camps were too expensive (n = 4), kids need a place to go during the summer (n = 14), summer programs help kids stay out of trouble (n = 22), and summer programs help kids continue to learn (n = 9). Benefits of the program attendance reported by parents included providing children with “something to do” during the summer, providing health promotion, providing continued learning and improved academic skills, and allowing students to socialize with other students (Appendix C).
3.3.3. Administration, teachers, and staff
Interviews were completed with all administrators, teachers, and staff at HSL. During these interviews, administrators, teachers, and staff indicated that student attendance was one of the primary challenges to program delivery. Administrators, teachers, and staff indicated that the main reason for low attendance was that buses were frequently late. This was perceived to be a key barrier to student attendance during both summers. Administrators, teachers, and staff speculated that inconsistent bus arrival times made the free transportation inconvenient for some parents.
Administrators, teachers, and staff also identified lack of student engagement with academic content as a significant challenge to program implementation. Some children were described as being “worn-out” with school and in need of a break from learning. Thus, the daily reading instruction may have resulted in decreased enthusiasm and subsequent low attendance among some students.
Teachers found it difficult to balance time spent in reading instruction with the required time for physical activity. Teachers indicated that reading instruction was prioritized over physical activity, and teachers released children later than scheduled for physical activity time. Teachers also recognized the value of both physical activity and reading instruction; however, a tension existed between the necessity for continued instruction and adherence to scheduled physical activity opportunities.
Some teachers indicated that physical activity and learning were complimentary to one another. Teachers perceived that the frequent physical activity breaks allowed students to release energy and regain focus in the classroom. As indicated above, HSL administrators, teachers, and staff acknowledged that summer learning can be burdensome to students. Physical activity was considered a release for children that could benefit learning.
The detailed schedule of activities was perceived to assist in delivering program components. Administrators, teachers, and staff perceived that if a component was on the schedule (e.g. three hours of PA) it was implemented. According to administrators the schedule ensured that teachers and staff implemented the program as planned. However, some teachers noted that the schedule did not include an allotment for transition time. This created difficulty in maintaining accurate timing for the start of program activities (e.g. physical activity breaks, reading instruction, nutrition education, meals).
3.4. Process evaluation: satisfaction
3.4.1. Child surveys
All students in attendance on the day of the survey participated in the survey, this included approximately two-thirds of students completed the HSL survey in 2018 with about one-third completing the survey in 2019. Results from the survey are presented in Table 9. A total of 91.2% of children reported that they enjoyed HSL (2018 =86.4%, 2019 =100%). Specifically, 70.6% reported enjoying the classroom lessons (2018 =75.0%, 2019 =62.5%). Further, 82.4% reported that they enjoyed playing outside (2018 =86.4%, 2019 =75.0%) while 95.6% enjoyed playing inside in the gym (2018 =95.5%, 2019 =95.8%). Breakfast was enjoyed by 72.1% (2018 =72.7%, 2019 =70.8%), lunch was enjoyed by 82.4% (2018 =72.7%, 2019 =100%), and snacks were enjoyed by 91.2% (2018 =90.9%, 2019 =91.7%) of children.
Table 9.
Student report of satisfaction with Healthy Summer Learners.
| Q1: When I am in the HSL Summer Program: | 2018 | 2019 | Overall |
|---|---|---|---|
|
| |||
| I enjoy it | 86.4 | 100.0 | 91.2 |
| I feel bored | 22.7 | 12.5 | 17.6 |
| It’s fun | 93.2 | 100.0 | 95.6 |
| It gives me energy | 77.3 | 83.3 | 79.4 |
| It makes me sad | 13.6 | 8.3 | 11.8 |
| My body feels good | 77.3 | 100.0 | 85.3 |
| It’s very exciting | 88.6 | 75.0 | 83.8 |
| It feels good | 68.2 | 100.0 | 79.4 |
| I want to be doing something else | 63.6 | 33.3 | 52.9 |
| I enjoy the classroom lessons | 75.0 | 62.5 | 70.6 |
| I am good at things we do in the classroom | 86.4 | 66.7 | 79.4 |
| I am good at the games we play in the gym and outside | 81.8 | 66.7 | 76.5 |
| I am included by others in the classroom | 72.7 | 75.0 | 73.5 |
| I enjoy playing outside on the playground | 86.4 | 75.0 | 82.4 |
| I enjoy playing inside in the gym | 95.5 | 95.8 | 95.6 |
| I enjoy eating breakfast | 72.7 | 70.8 | 72.1 |
| I enjoy eating lunch | 72.7 | 100.0 | 82.4 |
| I enjoy eating snack | 90.9 | 91.7 | 91.2 |
| I enjoy the teachers and staff | 86.4 | 83.3 | 85.3 |
| I like coming because I made friends | 81.8 | 91.7 | 85.3 |
| I feel tired | 54.5 | 45.8 | 51.5 |
| I like the amount of time we spend playing everyday | 72.7 | 91.7 | 79.4 |
| I like the amount of time spent in the class everyday | 50.0 | 79.2 | 60.3 |
| I get to decide what I am going to do in the classroom | 27.3 | 58.3 | 38.2 |
| I get to decide what I am going to do in the gym and outside | 81.8 | 75.0 | 79.4 |
| I am included by others in the gym and outside | 93.2 | 75.0 | 86.8 |
| Q2: I play outside and/or in the gym during the HSL summer program because: | |||
| Being active is fun | 86.4 | 100.0 | 91.2 |
| I feel bad if I’m not active | 45.5 | 66.7 | 52.9 |
| Doing active things is important to me | 72.7 | 91.7 | 79.4 |
| Other people say I should be active | 22.7 | 41.7 | 29.4 |
| Q3: I eat breakfast, lunch, and dinner during the HSL summer program because: | |||
| I like to eat healthy food | 63.6 | 83.3 | 70.6 |
| I want to fuel my body with good nutrients | 95.5 | 75.0 | 88.2 |
| I feel bad for the rest of the day if I do not eat | 40.9 | 29.2 | 36.8 |
| Other people say I need to eat | 45.5 | 33.3 | 41.2 |
| Q4: I attend class during the HSL summer program because: | |||
| I enjoy class | 86.4 | 83.3 | 85.3 |
| I like learning | 81.8 | 95.8 | 86.8 |
| I feel bad if I don’t know as much as other kids | 27.3 | 50.0 | 35.3 |
| Other people tell me I have to go | 31.8 | 33.3 | 32.4 |
Note: reported percentages indicate affirmative response to individual items.
4. Discussion
Given evidence that summer is a time when children from low-income households experience academic loss and accelerated BMI gain (Cooper et al., 1996; von Hippel et al., 2007) strategies to mitigate summer academic loss and accelerated BMI gain are needed. HSL was designed to address these two outcomes simultaneously. While HSL successfully impacted children’s obesogenic behaviors (Dugger et al., 2020) there was no statistically significant difference in academic learning or BMI gain over the summer for children attending HSL when compared to control. Consistent with the principles of de-implementation (Montini & Graham, 2015; van Bodegom-Vos, Davidoff, & Marang-van de Mheen, 2017) the detailed process evaluation offers insight into why this may have been the case by reporting the reach, cost, fidelity, dose received, completeness, and satisfaction with HSL.
First, given that the behavioral evaluation of HSL showed that on days children attended they engaged in higher levels of physical activity, less screen time, and displayed more healthy sleep behaviors (Dugger et al., 2020), HSL may not have provided a sufficient dose of structured programming and academic instruction to impact children’s zBMI and MAP reading scores. HSL operated for a total of 24 days during the summer (i.e., 6 weeks for 4 days per week). The typical summer vacation lasts for approximately 84 days (i.e., 12 weeks). Thus, if children attended HSL every day they still were experiencing 60 relatively unstructured days during the summer. HSL may need to operate for more days/weeks during the summer to have a greater impact. Second, our process evaluation indicated that 11 of the 60 (~18%) children randomized to the HSL intervention arm never attended the program. This may have dampened the estimated impact of the program. Third, 33% of control children attended some form of structured summer programming for at least one day during summer. This may explain why control children experienced less accelerated summer BMI gain (i.e., increase of 0.06 only) and no academic slide (i.e., increase in MAP Reading Score of 0.9) despite consistent evidence of these phenomenon in the literature shown that children experience increases of up to 0.20 in zBMI over the summer (Jennette P Moreno et al., 2015; J. P. Moreno et al., 2013) and losses in standardized reading test scores over the summer (Alexander, Entwisle, & Olson, 2007; Borman et al., 2009; Cooper et al., 1996; Downey et al., 2004; Vanneman, Hamilton, Anderson & Rahman, 2009).
While differences in change between program attenders and non-attenders were not statistically significant, the magnitude of the difference in change was greater in the as-treated analyses. This is consistent with a previous study that examined an 8-week multicomponent, theory-based summer program designed to mitigate accelerated summer BMI gain of 87 elementary-aged children (Hopkins et al., 2019). This study found that all children that attended summer programming of any kind did not experience accelerated summer BMI gain. Thus, attending structured programming of any kind may be sufficient for slowing or eliminating accelerated summer BMI gain. In a prior study of a summer program focused on academic slide that informed HSL, the average attendance was 18.6 of 24 days (Hunt et al., 2019), almost 4 days more than HSL. Like HSL, this program ran four days a week for six weeks, so the four-day difference represents an additional week of program exposure. In a 39-day summer program to promote healthy eating and physical activity, attendance averaged 25.6 ± 8.9 days (Evans, Bond, Pierre, Howie, Wing & Jelalian, 2018), this could be due to the programs focus on physical activity or it’s shorter duration (9 am-1 pm). Thus, increasing attendance in future iterations of HSL is critical and low attendance may explain the minimal impact of HSL on BMI and academics.
Relatively low attendance at HSL may be due to the challenges with transportation and scheduling. Transportation has been identified as a potential barrier to access to resources during the summer for children from low-income families (Gordon et al., 2003; Wauchope & Stracuzzi, 2010; Wilkerson, Khalfe, & Krey, 2015). In the current study parents who provided transportation for their child, indicated the program’s schedule proved challenging because it did not allow them to drop-off/pick-up children at convenient times (i.e. before 8:30 am and after 5 pm). For families utilizing program-provided transportation, inconsistent bussing schedules made parents reluctant to rely on the provided transportation causing them to forgo the program or utilize personal transportation. Parents also identified the four-day schedule as a source of conflict, citing difficulty finding childcare for a single weekday. Schedule and transportation difficulties provide a possible explanation for the variability in student attendance. Due in part to this variability, the program may not have been able to provide a sufficient dose of HSL to produce differences in BMI and academic progress. Moving forward, offering five days of programing with more flexibility in drop-off/pick up times may increase attendance and impact changes in health-related outcomes.
Lower than expected impact may also be due, in part, to lack of intervention fidelity. While teachers expressed that both reading instruction and health were important, they reported difficulty balancing the delivery of academic content and physical activity opportunities and neither component was fully implemented. Teachers expressed that the daily schedule was useful but difficult to follow because no time was allotted for transitions between activities (i.e. walking from the classroom to lunch). Similar to classroom-based physical activity interventions, teachers felt they had to prioritize the delivery of academic material even if it meant children spent less time in physical activity (Jaimie, Pamela, & Donetta, 2014). Although direct observation yielded conflicting results, administrators, teachers, and staff perceived that if a component was on the schedule (e.g. three hours of PA), it was implemented. Though the program schedule was developed de novo by the research team in consultation with the school sites and aligned with a typical school day, lack of program fidelity and teacher feedback indicate a longer daily duration could help alleviate scheduling conflicts and support staff in providing the full three hours of physical activity and 3.5 h of reading instruction.
Across both summers, three parents reported voluntarily choosing to forgo the program due to dissatisfaction or confusion with the program, but the majority of the parents perceived the program favorably. Additionally, reported satisfaction among those who attended was high, and teachers, administrators, students, and most parents reported being satisfied with HSL possibly indicating that low of attendance is unlikely to have stemmed from low satisfaction. Generally, parents expressed appreciation for their children having an opportunity to socialize and stay engaged in schoolwork. Some parents also mentioned that the program opened avenues of conversation with their children to discuss physical activity indicating that they felt the program supported personal values. Student responses to the HSL satisfactions survey were consistently positive across both years. The primary physical activity components of structured indoor physical activity (i.e. gym time) and free play (i.e. outdoor recess) were rated as very enjoyable. Interestingly, the majority of children reported attending HSL because they enjoyed class and learning despite teachers’ reported observations that children were worn out and had decreased enthusiasm due to the continued academic engagement in the summer. This enjoyment may be due, in part, to the frequent activity opportunities provided by the HSL program to balance students’ energy and help them refocus. It should be noted that data derived from student surveys may be more representative of students who enjoyed the program or whose parents supported their attendance. To a lesser extent, parent interviews may also be subject to selection bias because 23% of parents could not be reached (n = 12). Overall, perceptions of the program triangulated between parents, school staff and students, signaling that the program was satisfactory, but program cost and reliable transportation were two areas for potential improvement.
Parents consistently identified a need for summer programing in their community but indicated that cost is barrier to attending summer programing in the future. The weekly cost of summer programing was $263.89 per child, a cost exceeding what parents reported they would be willing to pay for the program. While this is lower than the typical $288 per week to attend a summer camp nationally (Wilson, 2017), most parents expressed willingness to pay between $50-$99 per week for their child to attend a similar summer program, though 20% (n = 8) were not willing to pay for HSL. This could indicate that parents are unable to afford additional expenses. HSL was designed to be implemented in low-income settings and both schools were 100% eligible for free and reduced price lunch. Sending one child to HSL for four weeks would cost $1055; which is 48% of estimated monthly household income for a family of four at the U.S. Poverty Threshold (2019, $25,926/year) (Semega et al., 2016). Cost is a critical consideration for the scalability of this intervention and future implementations of HSL should explore ways to lower the weekly per-child cost of programing including subsidized vouchers for summer programming (R. Glenn Weaver, Beets, Brazendale & Brusseau, 2018).
5. Study strengths and limitations
This study has several strengths. First, the study used a variety of measures and methods including quantitative data and open-ended interviews though. Second, an active comparator group was used (i.e., 21 C). Third, this study provides additional evidence on structured summer programming as an intervention strategy for mitigating of accelerated summer BMI gain and reading loss prevention. This study must also be interpreted in light of its limitations. These limitations include a relatively small sample, the fact that children were not randomly assigned to the 21 C group, and contamination in the control group with children attending summer programming, and the lack of a 12-month follow-up in the second year due to the COVID-19 pandemic. Further, the included intervention did not include physical activity instruction and there is relationship between fundamental movement skills and physical activity participation (Jones, Innerd, Giles & Azevedo, 2020). Thus, should the intervention have included instruction it could have impacted engagement in physical activity to a greater degree. However, this is unlikely given that children in the current study engaged in approximately twice as much MVPA on days that they attended the program compared to days they did not. Further, longitudinal observational studies suggest that engagement in physical activity leads to higher fundamental motor skills in childhood, not the opposite (Jones et al., 2020).
6. Lessons learned
The goal of this pilot study was to test the preliminary effectiveness of a combined academic and health focused summer program. HSL did not impact summer learning loss or accelerated summer BMI gain and a detailed process evaluation of HSL was essential to understanding which components of the intervention did and did not work (Montini & Graham, 2015; van Bodegom-Vos et al., 2017). Overall, this study suggests that programing integrated into the school setting during summer was well-received and met community needs though daily implementation and attendance varied. Analysis of evaluation measures indicate that student attendance might be improved by increasing the program duration to five days a week, expanding program hours to improve convenience for families, providing more consistent transportation, and bounding the cost of attendance at $50 USD a week per child. Taken together, this evaluation indicates HSL is a promising intervention for addressing academic slide and accelerated gains in zBMI during summer though future studies should explore strategies for increasing attendance at healthy structured summer programming.
Supplementary Material
Acknowledgments
The authors would like to thank the children, families, and schools involved in this research.
Funding
This work was supported by the Eunice Kennedy Shriver National Institute of Child Health and Human Development of the National Institutes of Health under Award Number R21HD090647 (Weaver). Additional funding was provided by the National Institutes of Health grant numbers R21HD090647 (Weaver) and R21HD095164 (Weaver) as well as by the Institutional Development Award (IDeA) from the National Institute of General Medical Sciences of the National Institutes of Health under award number P20GM130420 for the Research Center for Child Well-Being. The National Heart, Lung, and Blood Institute of the National Institutes of Health under award number F31HL158016 (von Klinggraeff). The content is solely the responsibility of the authors and does not necessarily represent the official views of the National Institutes of Health.
Abbreviations:
- HSL
Healthy Summer Learners
- USDA
United States Department of Agriculture
Biographies
Lauren von Klinggraeff, M.P.H. is a doctoral research assistant at the Arnold School of Public Health at the University of South.
Roddrick Dugger, M.P.H. is a doctoral research assistant at the Arnold School of Public Health at the University of South.
Keith Brazendale, Ph.D., is an Assistant Professor in the Department of Health Sciences at the University of Central Florida. He was previously an Assistant Professor at the Arnold School of Public Health at the University of South.
Ethan T. Hunt, M.P.H. is a doctoral research assistant at the Arnold School of Public Health at the University of South.
Justin B. Moore, Ph.D., is and Associate Professor at the Wake Forest School of Medicine and co-investigator of the Health Summer Learners program.
Gabrielle Turner-McGrievy, Ph.D., R.D., is an Associate Professor at the Arnold School of Public Health at the University of South and co-investigator of the Health Summer Learners program.
Kenneth Vogler, Ed.D., is an Associate Professor in the Department of Instruction and Teacher Education at the University of South and co-investigator of the Health Summer Learners program.
Michael W. Beets, M.Ed., M.P.H., Ph.D., is a Distinguished Professor at the Arnold School of Public Health at the University of South and co-investigator of the Health Summer Learners program.
Bridget Armstrong, Ph.D., is an Assistant Professor at the Arnold School of Public Health at the University of South.
R. Glenn Weaver, M.Ed., Ph.D., is an Assistant Professor at the Arnold School of Public Health at the University of South and Principal Investigator of the Health Summer Learners program.
Footnotes
Declarations of interest
none.
Trail Registration: NIH-NCT03321071.
CRediT authorship contribution statement
Lauren von Klinggraeff: Investigation, Validation, Formal analysis, Data curation, Writing – original draft, Writing – review & editing, Visualization. Roddrick Dugger: Validation, Formal analysis, Investigation, Writing – original draft. Keith Brazendale: Conceptualization, Methodology, Supervision, Writing – review & editing. Ethan T. Hunt: Project administration, Supervision, Investigation, Writing – review & editing. Justin B. Moore: Methodology, Writing – review & editing. Gabrielle Turner-McGrievy: Methodology, Writing – review & editing. Kenneth Vogler: Methodology, Writing – review & editing. Michael W. Beets: Conceptualization, Methodology, Writing – review & editing. Bridget Armstrong: Writing – review & editing. R. Glenn Weaver: Conceptualization, Methodology, Funding acquisition. Formal analysis, Writing – original draft, Writing – review & editing, Visualization, Project administration, Supervision.
Appendix A. Supporting information
Supplementary data associated with this article can be found in the online version at doi:10.1016/j.evalprogplan.2022.102070.
References
- Alexander KL, Entwisle DR, & Olson LS (2007). Lasting consequences of the summer learning gap. American Sociological Review, 72(2), 167–180. [Google Scholar]
- Beets MW, Okely A, Weaver RG, Webster C, Lubans D, Brusseau T, & Cliff DP (2016). The theory of expanded, extended, and enhanced opportunities for youth physical activity promotion. International Journal of Behavioral Nutrition and Physical Activity, 13(1), 120. 10.1186/s12966-016-0442-2 [DOI] [PMC free article] [PubMed] [Google Scholar]
- Benjamini Y, & Hochberg Y (1995). Controlling the false discovery rate: a practical and powerful approach to multiple testing. Journal of the Royal statistical society: series B ((Methodological)), 57(1), 289–300. [Google Scholar]
- Bernard HR, Wutich A, & Ryan GW (2016). Analyzing Qualitative Data: Systematic Approaches. SAGE Publications. [Google Scholar]
- Bohnert A, Zarrett N, Beets MW, Hall G, Buscemi J, Heard A, & Pate R (2017). Society of Behavioral Medicine (SBM) position statement: SBM supports curbing summertime weight gain among America’s youth. Translational Behavioral Medicine, 7(4), 912–914. 10.1007/s13142-017-0512-2 [DOI] [PMC free article] [PubMed] [Google Scholar]
- Borkan J (1999). Immersion/Crystallization. Doing Qualitative Research. BF Crabtree and WL Miller. London: Sage,. [Google Scholar]
- Borman GD, & Dowling NM (2006). Longitudinal achievement effects of multiyear summer school: Evidence from the Teach Baltimore randomized field trial. Educational Evaluation and Policy Analysis, 28(1), 25–48. [Google Scholar]
- Borman GD, Goetz ME, & Dowling NM (2009). Halting the summer achievement slide: A randomized field trial of the KindergARTen Summer Camp. Journal of Education for Students Placed at Risk, 14(2), 133–147. [Google Scholar]
- Brazendale K, Beets M, Pate RR, Turner-McGrievy B, Kaczynski AT, Weaver RG,. Bohnert A (2017). Understanding differences between summer vs. school obesogenic behaviors of children: The Structured Days Hypothesis. International Journal of Behavioral Nutrition and Physical Activity, 14(1). [DOI] [PMC free article] [PubMed] [Google Scholar]
- Brazendale K, Chandler JL, Beets MW, Weaver RG, Beighle A, Huberty JL, & Moore JB (2015). Maximizing children’s physical activity using the LET US Play principles. Prev Med, 76, 14–19. 10.1016/j.ypmed.2015.03.012 [DOI] [PMC free article] [PubMed] [Google Scholar]
- Caldwell LL, & Smith EA (2006). Leisure as a context for youth development and delinquency prevention. Australian & New Zealand Journal of Criminology, 39(3), 398–418. [Google Scholar]
- Carrel AL, Clark RR, Peterson S, Eickhoff J, & Allen DB (2007). School-based fitness changes are lost during the summer vacation. Arch Pediatr Adolesc Med, 161 (6), 561–564. 10.1001/archpedi.161.6.561 [DOI] [PubMed] [Google Scholar]
- Collins LM, Murphy SA, & Bierman KL (2004). A conceptual framework for adaptive preventive interventions. Prev Sci, 5(3), 185–196. [DOI] [PMC free article] [PubMed] [Google Scholar]
- Cooper H, Nye B, Charlton K, Lindsay J, & Greathouse S (1996). The effects of summer vacation on achievement test scores: A narrative and meta-analytic review. Review of Educational Research, 66(3), 227–268. [Google Scholar]
- Deci EL, & Ryan RM (2000). The “what” and “why” of goal pursuits: Human needs and the self-determination of behavior. Psychological Inquiry, 11(4), 227–268. 10.1207/S15327965PLI1104_01 [DOI] [Google Scholar]
- Downey DB, von Hippel PT, & Broh BA (2004). Are schools the great equalizer? Cognitive inequality during the summer months and the school year. American Sociological Review, 69(5), 613–635. [Google Scholar]
- Dugger R, Brazendale K, Hunt ET, Moore JB, Turner-Mcgrievy G, Vogler K,. Weaver RG (2020). The impact of summer programming on the obesogenic behaviors of children: Behavioral outcomes from a quasi-experimental pilot trial. Pilot and Feasibility Studies, 6(1). doi: 10.1186/s40814-020-00617-x. [DOI] [PMC free article] [PubMed] [Google Scholar]
- Durlak JA, & DuPre EP (2008). Implementation matters: A review of research on the influence of implementation on program outcomes and the factors affecting implementation. American Journal of Community Psychology, 41(3), 327–350. [DOI] [PubMed] [Google Scholar]
- Eldridge SM, Chan CL, Campbell MJ, Bond CM, Hopewell S, Thabane L, & Lancaster GA (2016). CONSORT 2010 statement: extension to randomised pilot and feasibility trials. BMJ, 355, i5239. [DOI] [PMC free article] [PubMed] [Google Scholar]
- Evans EW, Bond DS, Pierre DF, Howie WC, Wing RR, & Jelalian E (2018). Promoting health and activity in the summer trial: Implementation and outcomes of a pilot study. Preventive Medicine Reports, 10, 87–92. 10.1016/j.pmedr.2018.02.008 [DOI] [PMC free article] [PubMed] [Google Scholar]
- Evans EW, Wing RR, Pierre DF, Howie WC, Brinker M, & Jelalian E (2020). Testing the effect of summer camp on excess summer weight gain in youth from low-income households: a randomized controlled trial. BMC Public Health, 20(1), 1732. 10.1186/s12889-020-09806-y [DOI] [PMC free article] [PubMed] [Google Scholar]
- Fu Y, Brusseau TA, Hannon JC, & Burns RD (2017). Effect of a 12-Week Summer Break on School Day Physical Activity and Health-Related Fitness in Low-Income Children from CSPAP Schools. International Journal of Environmental Research and Public Health, 2017, Article 9760817. 10.1155/2017/9760817 [DOI] [PMC free article] [PubMed] [Google Scholar]
- Gillis L, McDowell M, & Bar-Or O (2005). Relationship between summer vacation weight gain and lack of success in a pediatric weight control program. Eat Behav, 6 (2), 137–143. 10.1016/j.eatbeh.2004.08.002 [DOI] [PubMed] [Google Scholar]
- Gordon A, Briefel R, Needels K, Wemmerus N, Zavitsky T, Rosso R,. Creel D (2003). Feeding Low-Income Children When School Is Out: The Summer Food Service Program. Final Report. [Google Scholar]
- Hawe P, Shiell A, & Riley T (2004). Complex interventions: how “out of control” can a randomised controlled trial be? Bmj, 328(7455), 1561–1563. [DOI] [PMC free article] [PubMed] [Google Scholar]
- Hopkins LC, Holloman C, Melnyk B, Fristad M, Goodway JD, Kennel JA, & Gunther C (2019). Participation in structured programming may prevent unhealthy weight gain during the summer in school-aged children from low-income neighbourhoods: feasibility, fidelity and preliminary efficacy findings from the Camp NERF study. Public Health Nutrition, 22(6), 1100–1112. [DOI] [PMC free article] [PubMed] [Google Scholar]
- Hunt ET, Whitfield ML, Brazendale K, Beets MW, & Weaver RG (2019). Examining the impact of a summer learning program on children’s weight status and cardiorespiratory fitness: A natural experiment. Evaluation and Program Planning, 74, 84–90. 10.1016/j.evalprogplan.2019.02.009 [DOI] [PMC free article] [PubMed] [Google Scholar]
- Jago R, & Baranowski T (2004). Non-curricular approaches for increasing physical activity in youth: a review. Preventive medicine, 39(1), 157–163. 10.1016/j.ypmed.2004.01.014 [DOI] [PubMed] [Google Scholar]
- Jaimie M, Pamela K, & Donetta C (2014). Chapter 5 Physical Activity Opportunities During the School Day: Classroom Teachers’ Perceptions of Using Activity Breaks in the Classroom. Journal of Teaching in Physical Education, 33(4), 511–527. 10.1123/jtpe.2014-0062 [DOI] [Google Scholar]
- Jones D, Innerd A, Giles EL, & Azevedo LB (2020). Association between fundamental motor skills and physical activity in the early years: A systematic review and meta-analysis. J Sport Health Sci, 9(6), 542–552. 10.1016/j.jshs.2020.03.001 [DOI] [PMC free article] [PubMed] [Google Scholar]
- Kim JS, & Quinn DM (2013). The effects of summer reading on low-income children’s literacy achievement from kindergarten to grade 8: A meta-analysis of classroom and home interventions. Review of Educational Research, 83(3), 386–431. [Google Scholar]
- Kuczmarski R, Ogden C, Guo S, Grummer-Strawn L, Flegal K, Mei Z, & Johnson C (2002). CDC growth charts for the US: methods and development. Vital Health Stat, 11(246), 1–190. [PubMed] [Google Scholar]
- Lauer PA, Akiba M, Wilkerson SB, Apthorp HS, Snow D, & Martin-Glenn ML (2006). Out-of-school-time programs: A meta-analysis of effects for at-risk students. Review of Educational Research, 76(2), 275–313. [Google Scholar]
- Mariano LT, & Martorell P (2013). The academic effects of summer instruction and retention in New York City. Educational Evaluation and Policy Analysis, 35(1), 96–117. [Google Scholar]
- McCombs JS, Pane JF, Augustine CH, Schwartz HL, Martorell P, & Zakaras L (2014). Ready for Fall? Near-Term Effects of Voluntary Summer Learning Programs on Low-Income Students’ Learning Opportunities and Outcomes. Rand Corporation,. [Google Scholar]
- McCoy CE (2017). Understanding the intention-to-treat principle in randomized controlled trials. Western Journal of Emergency Medicine, 18(6), 1075. [DOI] [PMC free article] [PubMed] [Google Scholar]
- Moher D, Hopewell S, Schulz KF, Montori V, Gøtzsche PC, Devereaux PJ, & Altman DG (2010). CONSORT 2010 Explanation and Elaboration: updated guidelines for reporting parallel group randomised trials. BMJ (Clinical research ed.), 340, c869. 10.1136/bmj.c869 [DOI] [PMC free article] [PubMed] [Google Scholar]
- Montini T, & Graham ID (2015). “Entrenched practices and other biases”: unpacking the historical, economic, professional, and social resistance to de-implementation. Implement Sci, 10, 24. 10.1186/s13012-015-0211-7 [DOI] [PMC free article] [PubMed] [Google Scholar]
- Moore JB, Yin Z, Hanes J, Duda J, Gutin B, & Barbeau P (2009). Measuring enjoyment of physical activity in children: validation of the Physical Activity Enjoyment Scale. Journal of Applied Sport Psychology, 21(S1), S116–S129. [DOI] [PMC free article] [PubMed] [Google Scholar]
- Moreno JP, Johnston CA, Chen TA, O’Connor TA, Hughes SO, Baranowski J, & Baranowski T (2015). Seasonal variability in weight change during elementary school. Obesity, 23(2), 422–428. [DOI] [PubMed] [Google Scholar]
- Moreno JP, Johnston CA, & Woehler D (2013). Changes in weight over the school year and summer vacation: results of a 5-year longitudinal study. J Sch Health, 83(7), 473–477. 10.1111/josh.12054 [DOI] [PubMed] [Google Scholar]
- National Center for Advancing Translational Sciences, 2021, ClinicalTrials.gov Glossary of Common Site Terms. Retrieved from 〈https://toolkit.ncats.nih.gov/glossary/active-comparator-arm/〉. [Google Scholar]
- Park K-S, & Lee M-G (2015). Effects of summer school participation and psychosocial outcomes on changes in body composition and physical fitness during summer break. Journal of Exercise Nutrition & Biochemistry, 19(2), 81. [DOI] [PMC free article] [PubMed] [Google Scholar]
- Pinnock H, Barwick M, Carpenter CR, Eldridge S, Grandes G, Griffiths CJ, & Patel A (2017). Standards for reporting implementation studies (StaRI) statement. Bmj, 356. [DOI] [PMC free article] [PubMed] [Google Scholar]
- Reesor L, Moreno JP, Johnston CA, & Hernandez DC (2019). School-Based Weight Management Program Curbs Summer Weight Gain Among Low-Income Hispanic Middle School Students. Journal of School Health, 89(1), 59–67. 10.1111/josh.12713 [DOI] [PMC free article] [PubMed] [Google Scholar]
- Ritzwoller DP, Sukhanova A, Gaglio B, & Glasgow RE (2009). Costing behavioral interventions: a practical guide to enhance translation. Ann Behav Med, 37(2), 218–227. 10.1007/s12160-009-9088-5 [DOI] [PubMed] [Google Scholar]
- Royston P (2004). Multiple imputations of missing values. The Stata Journal, 4(3), 227–241. [Google Scholar]
- Saunders RP (2015). Implementation Monitoring and Process Evaluation. SAGE Publications,. [Google Scholar]
- Semega JL, F K, & Kollar MA (2016). Income and poverty in the United States. Washington DC: U.S.: Census Bureau,. [Google Scholar]
- Strauss A, & Corbin J (1998). Basics of qualitative research techniques. CA: Sage publications; Thousand Oaks,. [Google Scholar]
- Tanskey LA, Goldberg JP, Chui K, Must A, & Sacheck JM (2019). Accelerated Summer Weight Gain in a Low-Income, Ethnically Diverse Sample of Elementary School Children in Massachusetts. Childhood Obesity, 15(4), 244–253. 10.1089/chi.2017.0228 [DOI] [PMC free article] [PubMed] [Google Scholar]
- Teare MD, Dimairo M, Shephard N, Hayman A, Whitehead A, & Walters SJ (2014). Sample size requirements to estimate key design parameters from external pilot randomised controlled trials: a simulation study. Trials, 15(1), 264. [DOI] [PMC free article] [PubMed] [Google Scholar]
- Thabane L, Ma J, Chu R, Cheng J, Ismaila A, Rios LP, & Goldsmith CH (2010). A tutorial on pilot studies: the what, why and how. BMC Medical Research Methodology,, 10(1), 1. [DOI] [PMC free article] [PubMed] [Google Scholar]
- Thum YM, & Hauser CH (2015). NWEA 2015 MAP Norms for Student and School Achievement Status and Growth. OR: Retrieved from Portland,. [Google Scholar]
- Tomkinson GR, Léger LA, Olds TS, & Cazorla G (2003). Secular trends in the performance of children and adolescents (1980–2000). Sports Medicine, 33(4), 285–300. [DOI] [PubMed] [Google Scholar]
- United States Department of Agriculture Food and Nutrition Service. Fueling Children’s Healthy Growth, Learning, and Play.
- van Bodegom-Vos L, Davidoff F, & Marang-van de Mheen PJ (2017). Implementation and de-implementation: two sides of the same coin. BMJ Qual Saf, 26(6), 495–501. 10.1136/bmjqs-2016-005473 [DOI] [PubMed] [Google Scholar]
- Vanneman A, Hamilton L, Anderson JB, & Rahman T (2009). Achievement Gaps: How Black and White Students in Public Schools Perform in Mathematics and Reading on the National Assessment of Educational Progress. Statistical Analysis Report. NCES 2009–455. National Center for Education Statistics. [Google Scholar]
- von Hippel PT, Powell B, Downey DB, & Rowland NJ (2007). The effect of school on overweight in childhood: gain in body mass index during the school year and during summer vacation. American Journal of Public Health, 97(4), 696–702. 10.2105/AJPH.2005.080754 [DOI] [PMC free article] [PubMed] [Google Scholar]
- Wauchope B, & Stracuzzi NF (2010). Challenges in serving rural American children through the Summer Food Service Program.
- Weaver R, Beets MW, Webster C, Beighle A, & Huberty J (2012). A Conceptual Model for Training After-School Program Staffers to Promote Physical Activity and Nutrition. Journal of School Health, 82(4), 186–195. 10.1111/j.1746-1561.2011.00685.x [DOI] [PubMed] [Google Scholar]
- Weaver RG, Beets MW, Brazendale K, & Brusseau TA (2018). Summer Weight Gain and Fitness Loss: Causes and Potential Solutions. American Journal of Lifestyle Medicine, 13(2), 116–128. 10.1177/1559827617750576 [DOI] [PMC free article] [PubMed] [Google Scholar]
- Weaver RG, Beets MW, & Webster C, 2013, LET US Play: Maximizing Children’s Physical Activity in Physical Education. Strategies: A Journal for Physical and Sport Educators. [Google Scholar]
- Weaver RG, Beets MW, Webster C, & Huberty J (2014). System for Observing Staff Promotion of Activity and Nutrition (SOSPAN). J Phys Act Health, 11(1), 173–185. 10.1123/jpah.2012-0007 [DOI] [PubMed] [Google Scholar]
- Weaver RG, Webster C, & Beets MW (2013). Let us play: maximizing physical activity in physical education. Strategies, 26(6), 33–37. [Google Scholar]
- Welk G, & Meredith MD (2010). Fitnessgram and Activitygram Test Administration Manual-Updated (4th edition.,). Human Kinetics,. [Google Scholar]
- White IR, Carpenter J, & Horton NJ (2012). Including all individuals is not enough: lessons for intention-to-treat analysis. Clinical trials, 9(4), 396–407. [DOI] [PMC free article] [PubMed] [Google Scholar]
- White IR, Royston P, & Wood AM (2011). Multiple imputation using chained equations: Issues and guidance for practice. Stat Med, 30(4), 377–399. 10.1002/sim.4067 [DOI] [PubMed] [Google Scholar]
- Wilkerson RL, Khalfe D, & Krey K (2015). Associations between neighborhoods and summer meals sites: measuring access to Federal Summer Meals Programs. Journal of Applied Research on Children: Informing Policy for Children at Risk, 6(2), 9. [Google Scholar]
- Wilson C, 2017, 2016 Camp Enrollment and Staff Recruitment Survey. Retrieved from 〈https://www.acacamps.org/sites/default/files/resource_library/2016Enrollment_summary_camper_enrollment.pdf〉.
- World Medical Association. (2001). World Medical Association Declaration of Helsinki. Ethical principles for medical research involving human subjects. Bulletin of the World Health Organization, 79(4), 373. [PMC free article] [PubMed] [Google Scholar]
- Wu YP, Deatrick JA, McQuaid EL, & Thompson D (2019). A Primer on Mixed Methods for Pediatric Researchers. Journal of pediatric psychology, 44(8), 905–913. [DOI] [PMC free article] [PubMed] [Google Scholar]
- Shenton AK (2004). Strategies for Ensuring Trustworthiness in Qualitative Research Projects. Education for Information, 22, 63–75. 10.3233/EFI-2004-22201. [DOI] [Google Scholar]
Associated Data
This section collects any data citations, data availability statements, or supplementary materials included in this article.