

Abstract
Objective:
Alcohol use disorder (AUD) is an etiologically heterogenous psychiatric disorder defined by a collection of commonly observed co-occurring symptoms. It is useful to contextualize AUD within theoretical frameworks to identify potential prevention, intervention, and treatment approaches that target personalized mechanisms of behavior change. One theoretical framework, behavioral economics, suggests that AUD is a temporally extended pattern of cost/benefit analyses favoring drinking decisions. The distribution of costs and benefits across choice outcomes are often unequally distributed over time and have different probabilities of receipt, such that delay and probability become critical variables. The current study examines the relations between different forms of economic discounting (delayed reward, delayed cost, and probabilistic reward) and individual symptoms of AUD to inform etiological models.
Method:
Participants (N=732; 41% female, 4.2% Black, 88.1% White, 8% Hispanic) completed an online survey with measures of alcohol use disorder symptoms and economic discounting. We examined relations between economic discounting and AUD symptoms with zero-order correlations, in separate models (factor models), and in models controlling for an AUD factor (factor-controlled models).
Results:
Delayed reward discounting was positively associated with the give up AUD criteria across all three levels of analysis. Probability discounting was associated with social/interpersonal problems across two out of three, sets of analyses. Consistent with the broad discounting literature, effect sizes were small (range=−.15 to .13).
Conclusions:
These results support the idea that AUD criteria are etiologically distinct, resulting in varying AUD profiles between persons that are differentially associated with behavioral economic discounting.
Keywords: alcohol use disorder, behavioral economics, delayed reward discounting, heterogeneity
Introduction
Alcohol use is common among adults, with roughly 70% reporting past-month alcohol use and one fourth reporting drinking five or more drinks in one occasion during the past two weeks (Schulenberg et al., 2018). Although many maintain nonharmful drinking, a significant percentage (National Survey on Drug Use and Health, 2018) develop a pattern of use that causes harm. In the DSM-5, this is conceptualized as Alcohol Use Disorder (AUD) (American Psychiatric Association, 2013). Alcohol Use Disorder is intended to represent a unitary construct that consists of 11 conceivably independent symptoms (Hasin et al., 2013). However, more recent work suggests that AUD might not actually be a unitary construct (Watts et al., 2021) and that there are distinct genetic factors associated with different symptom clusters (Kendler et al., 2012). The DSM-5 is atheoretical and symptom-based, which means that acknowledged psychiatric disorders within the DSM-5 are collections of commonly co-occurring symptoms. Although these diagnostic criteria may be useful clinically and provide a consistent definition across clinical practice and research studies, they provide little guidance in the etiology, course, or prognosis of AUD, limiting the diagnostic utility in guiding intervention and treatment development. Further, a great deal of research has demonstrated high rates of comorbidity with other psychiatric disorders, both internalizing and externalizing (Hasin & Grant, 2015), suggesting common mechanisms underlying different psychiatric phenomena across the current categorical model of psychopathology (see Boness et al., 2021 for an overview). Despite these lines of research, existing treatments tend to target “syndromes” rather than specific symptoms or related symptom clusters, ignoring clinically relevant heterogeneity (Witkiewitz et al., 2019). It would be valuable to characterize this heterogeneity as arising from multiple, distinct, homogeneous symptom clusters each characterized by theoretically distinct mechanisms and processes. This would facilitate symptom/subsyndromal-specific prevention and treatment approaches, especially as precision medicine continues to become a research priority (Litten et al., 2016; Witkiewitz et al., 2019).
Most AUD symptoms attempt to capture behavioral patterns that extend over long temporal windows. This is consistent with behavioral economics, a contextual choice model of addiction suggesting that decisions to drink are the result of cost/benefit analyses, with outcomes favoring choices with greater benefits and fewer costs (Bickel et al., 2014; Rachlin et al., 1981). Costs and benefits are not necessarily calculated in a conscious or a “rational” manner, can occur in many domains (e.g., financial, social, health), and are not always equally distributed over time (Herrnstein, 1974; Vuchinich & Tucker, 1983). From this perspective, AUD is not an internal state but a temporally extended pattern of behavior in which utility is maximized in the immediate rather than over a longer temporal span. For example, imagine a choice between a night out drinking with friends or completing your federal tax return. Alcohol is a potent and immediate reinforcer that will generally result in rewarding effects that are experienced shortly after drinking (e.g., euphoria, anxiety reduction, social facilitation). However, completing your tax return will generally provide less immediate reward, and the return you receive (if any) may not arrive for several weeks (or months, based on the 2021 IRS timeline).
As in the example described above, rewards are often unequally distributed over time, such that some choice options provide immediate reward whereas others provide delayed reward. Humans and other animals generally prefer immediate relative to delayed rewards, and the current subjective value of the delayed rewards typically decreased as a function of the length of the delay until receipt. The temporal distribution of reward across choice options has emerged as a critical variable in understanding choice behavior (Ainslie & Herrnstein, 1981), and particularly choices to use substances (which are immediately rewarding) over alternatives (which often have delayed rewards). The probability of receiving the reward also has an impact on the choice outcome, such that the value of an uncertain reward decreases as the probability of receiving the reward decreases (Mazur, 1993). Although these two processes appear similar and intimately connected, research suggests that temporal and probability discounting are likely different processes (Green et al., 2014; Green & Myerson, 2010). Of course, delayed rewards are inherently more uncertain compared to immediate rewards (Rachlin et al., 1991; Takahashi et al., 2007), and the discounting of delayed rewards becomes steeper as the uncertainty escalates (Vanderveldt et al., 2015). However, the two processes demonstrate opposite magnitude effects, such that larger delayed rewards are discounted less steeply than smaller delayed rewards, whereas larger probabilistic rewards are discounted more steeply than smaller probabilistic rewards (Myerson et al., 2011). Nevertheless, both processes are well described by a hyperbolic discounting function suggesting that delayed rewards (and uncertain rewards) may be preferred when both the larger delayed (uncertain) and smaller immediate (certain) rewards are far away in time, but that preference will shift in favor of the immediate (certain) reward as receipt of the immediate (certain) reward becomes imminent (Mazur, 1987).
Although delayed and uncertain rewards are universally discounted among humans, there are individual differences in the degree of discounting, and variability in these discounting parameters is associated with harmful alcohol use. Across all forms of economic discounting, delayed reward discounting (DRD) is the more studied and robust predictor of alcohol use (Amlung & MacKillop, 2011). Those who use substances report higher rates of DRD compared to controls (MacKillop et al., 2011), and discounting of delayed rewards becomes greater as substance use becomes more severe (Amlung et al., 2017). Probability discounting (PD) has been comparatively studied less and generally bears a less consistent relationship with risky behavior (see Bickel et al., 2014 for a review). However, some animal research suggests that the discounting of both delayed and uncertain rewards may serve as markers of high-risk alcohol use, as rats bred for heavy alcohol drinking are more sensitive to both delayed and probabilistic rewards (Wilhelm & Mitchell, 2008). Alcohol is a highly reliable (certain) immediate reward, whereas, following the previous example, the result of submitting your tax return is, in addition to delayed, also uncertain and may result in an audit.
In the example above, there is another set of variables influencing choice outcomes. In addition to the potential immediate and delayed costs for either drinking alcohol or completing your tax return, there are potential immediate and delayed costs or losses associated with each outcome. Drinking a large amount of alcohol may provide immediate benefits, but also may result in delayed costs: you may wake up with a hangover, it may cause conflict with loved ones, and you will still have to complete your tax return later. On the other hand, completing the tax return may have delayed benefits (a tax refund), but immediate costs (finding the necessary documents, completing a mundane, bureaucratic, and often confusing set of forms). Relative to the study of the delay discounting of rewards (which has a substantive literature), delay discounting of costs, sometimes referred to as delayed loss discounting (DLD), has been largely ignored. Murphy et al. (2001) examined loss discounting in a study where participants to choose between a smaller monetary loss now or greater monetary loss later. They found that (1) like discounting of delayed rewards, discounting of delayed costs fit a hyperbolic, rather than exponential equation; and (2) that there was a tendency to discount delayed costs. Despite this basic behavioral tendency having been confirmed in other studies (Bailey et al., 2018), very little research has explored the relation between loss discounting and AUD. One study combined the results of four crowdsourcing studies and found no relation between loss discounting and AUD (Halkjelsvik, 2021).. Interestingly, some research has noted what is called the sign effect, in which delayed gains are discounted to a greater degree than delayed losses (Furrebøe, 2020). However, studies of individual differences in both loss and reward discounting in the context of alcohol use are limited and may illuminate novel findings about the etiology of harmful alcohol use.
Studies examining the relationship between discounting and AUD have primarily used the Alcohol Use Disorder Identification Test (AUDIT). The AUDIT does not measure the full DSM-5 criteria set consisting of 11 criteria (Lange et al., 2019), limiting the range of generalizations concerning the relation between forms of discounting and specific criteria. A priori, it seems likely that some behavioral AUD criteria are more likely to be associated with choice impulsivity manifested in discounting (e.g., those criteria related to interpersonal problems, hazardous use, and difficulty controlling use) than with more physiological criteria such as tolerance and withdrawal. Yet, it is standard practice to aggregate symptoms of AUD into a symptom count. This ignores the heterogeneity in symptoms and, as a result, the opportunity to study risk factors and treatments for specific symptoms or symptom domains (e.g., pharmacological symptoms).
Current Study
The current secondary analysis explores unique relations among three forms of behavioral economic discounting (delayed reward, delayed loss, and probabilistic reward) and the 11 AUD criteria, each measured with multiple items of varying severity to more adequately resolve variation in the severities of the DSM-5. symptoms Due to the lack of research on the association between discounting and specific AUD symptoms, we examined the relations in three increasingly complex models: These include: (1) zero-order correlations between discounting measures and AUD criteria to estimate the overall association between this two domains.; (2) path models controlling for all other AUD symptoms in order to establish whether there is specificity/uniqueness in an observed association; and (3) models examining relations between discounting and AUD symptoms after controlling for an AUD latent factor to further establish specificity/uniqueness assuming there is an underlying latent variable that “causes” the associations among criteria. Based on previous literature, we hypothesized that delayed reward discounting and probability reward discounting would be positively associated with AUD symptoms, while delayed loss discounting would be negatively associated with AUD symptoms. Identifying symptom-specific risk factors may help elucidate treatment targets for use in personalized medicine approaches, rather than assuming homogeneity in the key mechanism underlying different AUD phenomena. Such an approach can also aid in the identification of AUD symptoms that might be transdiagnostic across other forms of psychopathology given discounting, specifically DRD, may be a transdiagnostic process (Amlung et al., 2019).
Method
Participants and Procedure
Participants were recruited through Prolific, an online subject pool for scientific research, between May and June 2020 as part of a larger study on diagnostic measures of alcohol use disorder. All Prolific workers complete a pre-screening survey when they join Prolific, which is used to determine if they might be eligible for subsequent research studies. Participants who reported on the pre-screening survey that they were at least 18 years of age, United States residents, and consumed an average of 10 or more units of alcohol1 per week were invited to participate in the current study. Our full sample was restricted only to those participants who reported drinking at least once in the past year on the study survey (rather than the pre-screening survey because this variable was not available) because (a) there was no way to know the recency of the pre-screening survey responses and (b) we were interested in the full range of drinking behavior.
A total of 833 individuals completed survey. However, 101 participants were excluded because they denied alcohol use in the past year (n = 5), failed to complete the whole survey (n = 78), failed to respond accurately to at least 8 of the 10 forced choice attention checks (n = 10), demonstrated implausible response time (n = 1), or provided illogical responses (e.g., reporting age first drunk prior to age of first drink; n = 7). This resulted in a final sample size of 732. Participants were 41% female, 4.2% Black, 88.1% White, and 6.7% identified with a race other than Black or White. The sample was 8% Hispanic and averaged 36 years of age (SD = 12.25, range = 18–80). Participants were relatively heavy drinkers with an average AUDIT score of 12 (SD = 7.38), suggesting a moderate risk of alcohol-related harm on average. See Supplemental Table 1 for a full description of the sample. Participants provided informed consent prior to participating in the online survey and all procedures were approved by the University of Missouri’s IRB (#1203637).
Measures
Alcohol Use Disorder.
For each of the 11 DSM-5 AUD symptoms, we used three items each that inquire about increasingly severe representations of each symptom (see Boness et al., 2019). This resulted in a total of 33 items. Participants indicated how many times in the past 12 months they had experienced a given item on a 5-point scale from Never to 4+ times. Each item was then dichotomized in order to achieve convergence in factor models, with 3 or more times in the last year considered endorsement of the symptom.
Delayed Reward Discounting.
To assess DRD, we used the 27-item Monetary Choice Questionnaire (Kirby et al., 1999). For each item, participants choose between smaller, immediate rewards or larger, delayed rewards (e.g., “Would you prefer to have $11 today, or $30 in seven days?”). Each choice contributes to the calculation of the participant’s overall discounting parameter (k), or the rate at which rewards are discounted as a function of delay in reward receipt. Outcome data for delay discounting was calculated using the 27-item macro (Kaplan et al., 2016), which provides k values for small, medium and large magnitudes. Higher k values are indicative of greater discounting of delayed rewards, or greater impulsivity.
Probability Reward Discounting.
To assess probability reward discounting, we used the 30-item Probability Discounting Questionnaire (Madden et al., 2009). For each item, participants choose between smaller, certain rewards or larger, uncertain rewards (e.g., “Would you prefer $20 for sure [100% chance] or a 1-in-10 chance of winning $80 [10% chance?]”). Each choice contributes to the calculation of the participant’s overall discounting parameter (h), or the rate at which rewards are discounted as a function of uncertainty in reward receipt. Outcome data for PD was calculated using the 30-item macro (Gray et al., 2016). Higher h values are indicative of greater discounting of uncertain rewards.
Delayed Loss Discounting.
DLD was assessed with a modified version of the MCQ. In each item, participants choose between a smaller, immediate loss and a larger delayed loss (e.g., “Would you prefer to lose $11 today, or $30 in seven days?”). The monetary values and delays for all items are identical to the MCQ for delayed rewards; the only modification was to change the items to reflect a loss rather than a gain. Outcome data for delay discounting was calculated using the 27-item macro (Kaplan et al., 2016), which provides k values for small, medium and large magnitudes. Higher k values are indicative of greater discounting of delayed losses.
Data Analysis
All analyses were conducted in Mplus v8 (Muthén & Muthén, 2017). Outliers for delay discounting were identified as any values greater than 3.29 standard deviations from the mean and winsorized to one unit above the next highest nonoutlying value (Tabachnick & Fidell, 2013).2 No more than 4% of data points across all delay discounting items were winsorized. All discounting variables were log transformed. Next, we used item-level data to extract factor loadings of our primary study variables: DRD, probability reward discounting, DLD, and for each of the 11 separate AUD symptoms. For the discounting variables, latent factors were constructed using the small, medium, and large magnitude k or h values. We created latent factors for each AUD symptom using three items each that inquire about increasingly more severe representations of each symptom (Boness et al., 2019).
We ran increasingly stringent analyses assessing the relation between discounting variables and each of the 11 AUD symptoms. First, we examined zero-order correlations between discounting variables and each AUD symptom. Next, we created separate factor models with each discounting factor predicting the 11 AUD criteria factors, resulting in a total of three sets of models. All factor models controlled for age, race, and sex. Finally, we used Multiple Indicators Multiple Causes (MIMIC) models to examine unique discounting effects on AUD symptom endorsement after consideration of indirect effects modeled through a latent AUD factor. Visualization of the factor and MIMIC models can be found in Figure 1. We created a single latent AUD factor by setting the largest factor loading to 1, which in our case was the giving up important activities because of alcohol use criterion across all MIMIC models. Next, we regressed the AUD latent factor and each AUD symptom onto each discounting variable in separate models. To obtain path estimates, submodels were estimated for each MIMIC model, with each model removing one of the pathways from an AUD criterion to the discounting variable to be statistically identified, resulting in 11 models. Median estimates across submodel sets are reported as MIMIC model estimates. After considering multiple test occasions by 10 separate criteria, the probability of observing 4 or more paths with a p-value below .10, or 3 or more with a p-value below .05, would result in a probability of significance at .01. Therefore, median residual estimates with 4 or more (out of 10) paths at a p-value of at least .10 within submodel sets are considered “significant”. Positive “significant” paths from discounting variables to AUD symptoms suggest the given discounting construct maybe uniquely associated with endorsing that criterion. Negative “significant” (and “nonsignificant”) paths may suggest decreased likelihood of endorsing a given criterion, or suppression effects. We suspect suppression effects in some cases given the number of paths estimated in the factor-controlled models and high variable correlations among discounting variables and AUD (Table 1). Redaction, or removal of highly correlated pathways between discounting variables and AUD criteria in FC submodels, could result in a suppression effect of DRD, DLD, and PD paths to AUD criteria.
Figure 1. Factor and Factor-controlled Structural Regression Models: Relationships between AUD symptom and Delayed Reward Discounting.
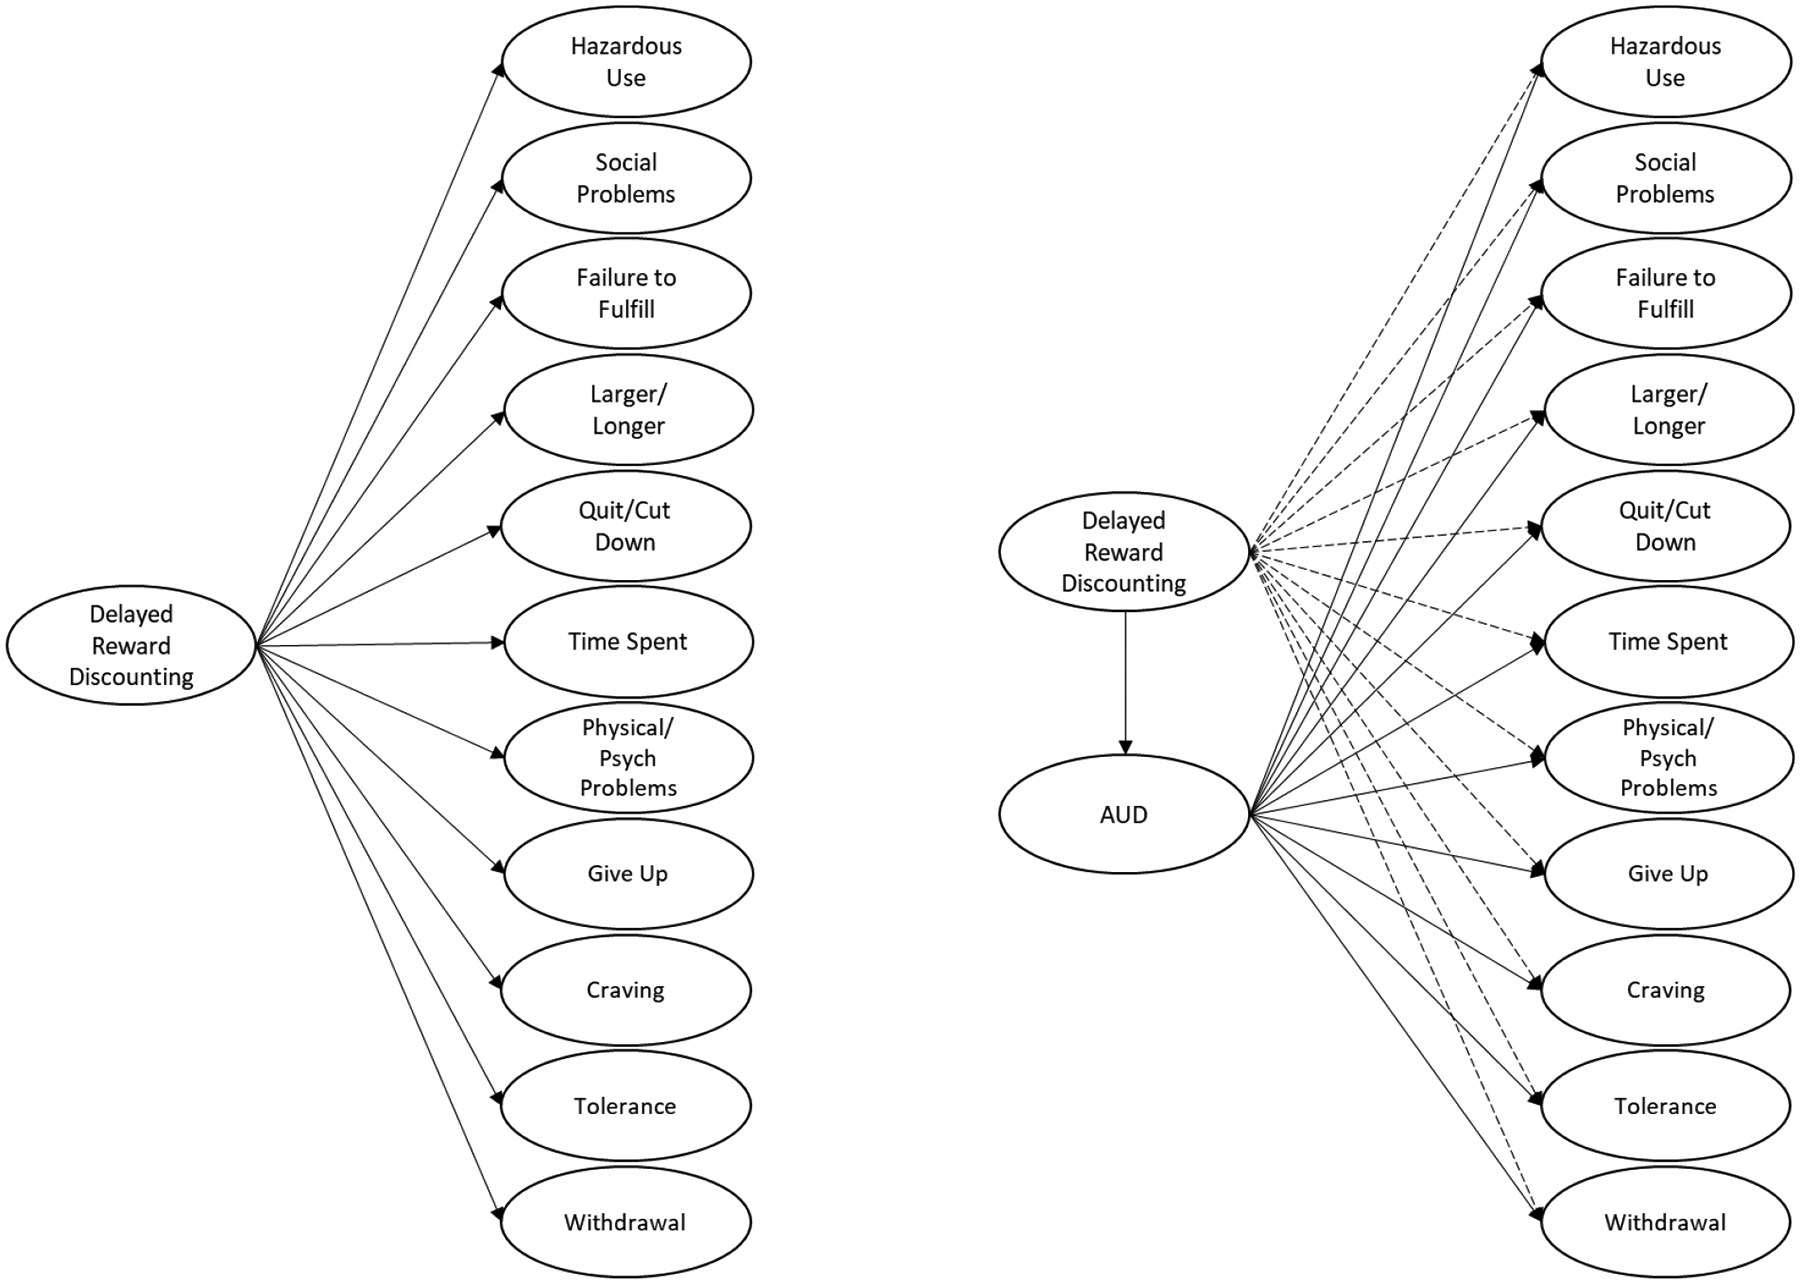
Note. Conceptual model demonstrating (A) a factor model and (B) an AUD factor-controlled model. (A) Each AUD symptom is regressed onto delay discounting. (B) Each AUD symptom is used to create a latent variable of AUD, and then each symptom is regressed onto delay discounting. Further, delay discounting is regressed onto the AUD latent variable. Age, sex and race paths are not pictured. AUD criterion factors were created and extracted from separate analyses from three items reflecting different levels of severity for each symptom (Boness et al., 2019). Each set of discounting models emulate this figure, replacing delayed reward discounting with probability discounting or delayed loss discounting. For clarity, dashed lines represent relations after controlling for the AUD factor. Larger/Longer = “Alcohol is taken in larger amounts or over longer periods than was intended”; Time spent = “A great deal of time is spent in activities necessary to obtain alcohol, use alcohol, or recover from its effects”; Quit/Cut down = “There is a persistent desire or unsuccessful efforts to cut down or control alcohol use”; Craving = “Craving, or a strong desire or urge to use alcohol”; Failure to fulfill = “Recurrent alcohol use resulting in a failure to fulfill major role obligations at work, school, or home”; Give up = “Important social, occupational, or recreational activities given up or reduced because of alcohol use”; Hazardous use = “Recurrent alcohol use in situations in which it is physically hazardous”; Physical/Psychological = “Alcohol use is continued despite knowledge of having a persistent or recurrent physical or psychological problem that is likely to have been caused or exacerbated by alcohol”; Tolerance = “Tolerance, as defined by either of the following: (a) a need for markedly increased amounts of alcohol to achieve intoxication or desired effect or (b) a markedly diminished effect with continued use of the same amount of alcohol”; Withdrawal = “Withdrawal, as manifested by either of the following: (a) the characteristic withdrawal syndrome for alcohol or (b) alcohol (or a closely related substance, such as benzodiazepine) is taken to relieve or avoid withdrawal symptoms”; Social/Interpersonal = “Continued alcohol use despite having persistent or recurrent social or interpersonal problems caused or exacerbated by the effects of alcohol”.
Table 1.
Correlations among Indices of Behavioral Economic Discounting and Symptoms of Alcohol Use Disorder
| 1 | 2 | 3 | 4 | 5 | 6 | 7 | 8 | 9 | 10 | 11 | 12 | 13 | ||
|---|---|---|---|---|---|---|---|---|---|---|---|---|---|---|
| 1 | Delayed Reward Discounting | - | ||||||||||||
| 2 | Delayed Loss Discounting | −.15** | - | |||||||||||
| 3 | Probability Discounting | .15** | −.04 | - | ||||||||||
| 4 | Quit/Cut Down | .05 | −.09* | −.00 | - | |||||||||
| 5 | Failure to Fulfil | .12** | −.14** | .02 | .48** | - | ||||||||
| 6 | Give Up | .17** | −.10* | .07 | .49** | .53** | - | |||||||
| 7 | Hazardous Use | .062 | −.07 | −.04 | .30** | .38** | .31** | - | ||||||
| 8 | Larger/Longer | .003 | −.01 | −.01 | .41** | .42** | .39** | .37** | - | |||||
| 9 | Physical/Psychological | .067 | −.09* | .04 | .50** | .51** | .53** | .36** | .39** | - | ||||
| 10 | Time Spent | .10** | −.12** | .04 | .52** | .58** | .55** | .33** | .48** | .54** | - | |||
| 11 | Tolerance | .10** | −.12** | .01 | .51** | .45** | .51** | .30** | .40** | .49** | .58** | - | ||
| 12 | Withdrawal | .11** | −.09* | .01 | .49** | .47** | .52** | .31** | .33** | .53** | .53** | .51** | - | |
| 13 | Craving | .09* | −.07 | .02 | .43** | .48** | .56** | .29** | .33** | .44** | .43** | .44** | .46** | - |
| 14 | Social/Interpersonal | .09* | −.11** | .09* | .04 | .51** | .42** | .39** | .45** | .46** | .53** | .43** | .47** | .36** |
Note. Larger/Longer = “Alcohol is taken in larger amounts or over longer periods than was intended”; Time spent = “A great deal of time is spent in activities necessary to obtain alcohol, use alcohol, or recover from its effects”; Quit/Cut down = “There is a persistent desire or unsuccessful efforts to cut down or control alcohol use”; Craving = “Craving, or a strong desire or urge to use alcohol”; Failure to fulfill = “Recurrent alcohol use resulting in a failure to fulfill major role obligations at work, school, or home”; Give up = “Important social, occupational, or recreational activities given up or reduced because of alcohol use”; Hazardous use = “Recurrent alcohol use in situations in which it is physically hazardous”; Physical/Psychological = “Alcohol use is continued despite knowledge of having a persistent or recurrent physical or psychological problem that is likely to have been caused or exacerbated by alcohol”; Tolerance = “Tolerance, as defined by either of the following: (a) a need for markedly increased amounts of alcohol to achieve intoxication or desired effect or (b) a markedly diminished effect with continued use of the same amount of alcohol”; Withdrawal = “Withdrawal, as manifested by either of the following: (a) the characteristic withdrawal syndrome for alcohol or (b) alcohol (or a closely related substance, such as benzodiazepine) is taken to relieve or avoid withdrawal symptoms”; Social/Interpersonal = “Continued alcohol use despite having persistent or recurrent social or interpersonal problems caused or exacerbated by the effects of alcohol”.
We report four indices to aid in the evaluation of overall model fit: the model χ2 (nonsignificant values indicative of good model fit), the Comparative Fit Index (CFI; acceptable fit > 0.90), Standardized Root Mean Square Residual (SRMR; acceptable fit < .08), and Root Mean Square Error of Approximation (RMSEA; acceptable fit < .08). Data and syntax for models available upon reasonable request to authors. This work was not preregistered. We report all data exclusions and all manipulations. This study is a secondary analysis. The sample size was determined based on anticipated confirmatory factor analysis for the primary study.
Results
Discounting and AUD Descriptives
Means and standard deviations for discounting variables can be found in Supplemental Table 1. Frequencies for AUD symptoms across the three levels of symptom severity can be found in Supplemental Table 2. At least one mild AUD criteria was endorsed by 87.3% of the sample, whereas only 64.3% and 50.8% endorsed at least one moderate and severe symptom, respectively. The most commonly endorsed symptom across severity levels was larger/longer, whereas the least commonly endorsed was social/interpersonal problems.
Zero Order Correlations
Correlations are reported in Table 1. DRD was positively correlated with PD and negatively correlated with DLD; DLD was not associated with PD. Higher discounting of delayed rewards was positively associated (in the expected direction) with failure to fulfill major obligations (failure to fulfill), giving up important activities because of alcohol use (give up), time spent obtaining, using, or recovering from alcohol (time spent), tolerance, symptoms of withdrawal, a strong desire to use alcohol (craving), and increased social or interpersonal problems (social/interpersonal). No other associations between DRD and AUD criterion were significant. Lower discounting of delayed losses was associated (in the expected direction) with eight of 11 criteria, specifically, unsuccessful attempts to cut down drinking (quit/cut down), failure to fulfill major obligations (failure to fulfill), giving up important activities because of alcohol use (give up), persistent alcohol use despite interference with physical or psychological problems (physical psychological), time spent obtaining, using, or recovering from alcohol (time spent), tolerance, symptoms of withdrawal, and increased social or interpersonal problems (social/interpersonal). No other associations between DRD and AUD criterion were significant. The primary difference in associations between AUD criterion and both DRD and DLD is that DRD was associated with craving, but not physical/psychological problems, whereas DLD was associated with quit/cutdown and physical/psychological problems, but not craving. PD was positively associated (in the expected direction) with the social/interpersonal AUD symptom, but no other relationship was significant.
Factor Models
Model fit for all three factor models are reported in Table 2. All factor models were fully saturated. Table 3 reports results for factor models that include each discounting variable separately. In the DRD model, results were generally consistent with those found in zero-order correlations. However, the relationship between DRD and physical/psychological problems was significant in this model. Similarly, in the DLD model, results were also consistent with zero-order correlations, and the relationship between DLD and craving was also significant. In the probability discounting model, no relations were significant.
Table 2.
Model Fit Indices
| X2 (df), p-value | RMSEA (90% CI) | CFI | SRMR | |
|---|---|---|---|---|
| DRD factor model | .00 (0), <.001 | .00 (.00, .00) | 1.00 | .00 |
| DLD factor model | .00 (0), <.001 | .00 (.00, .00) | 1.00 | .00 |
| PD factor model | .00 (0), <.001 | .00 (.00, .00) | 1.00 | .00 |
| DRD MIMIC | 107.47 (44), <.001 | .05 (.03, .06) | .98 | .02 |
| DLD MIMIC | 105.54 (44), <.001 | .04 (.03, .06) | .98 | .02 |
| PD MIMIC | 109.09 (44), <.001 | .05, (.04, .06) | .98 | .02 |
Note. All model fit indices were the same across each set of MIMIC models. DRD = Delayed Reward Discounting; DLD = Delayed Loss Discounting; PD = Probability Discounting; Df = degrees of freedom; RMSEA = Root Mean Square Error of Approximation; CFI = Comparative Fit Index; SRMR = Standardized Root Mean Squared Residual.
Table 3.
Separate factor models for each discounting variables predicting alcohol use disorder symptoms.
| Delayed Reward Discounting | Delayed Loss Discounting | Probability Discounting | |
|---|---|---|---|
| Alcohol Use Disorder Symptoms | Estimates (SE) | Estimates (SE) | Estimates (SE) |
| Quit/Cut Down | .06 (.04) | −.10 (.04)** | .001 (.04) |
| Failure to Fulfil | .12 (.04)** | −.15 (.04)*** | .01 (.04) |
| Give Up | .17 (.04)*** | −.11 (.04)** | .06 (.04) |
| Hazardous use | .06 (.04) | −.07 (.04) | −.05 (.04) |
| Larger/Longer | .01 (.04) | −.03 (.04) | −.03 (.04) |
| Physical/Psychological | .08 (.04)* | −.11 (.04)** | .03 (.04) |
| Time Spent | .09 (.04)* | −.13 (.04)** | .03 (.04) |
| Tolerance | .10 (.04)** | −.12 (.04)** | .00 (.04) |
| Withdrawal | .11 (.04)** | −.09 (.04)* | .01 (.04) |
| Craving | .09 (.04)* | −.08 (.04)* | .01 (.04) |
| Social/Interpersonal | .09 (.04)* | −.12 (04)** | .07 (.04) |
Note. Estimates are standardized. SE = Standard Error; Larger/Longer = “Alcohol is taken in larger amounts or over longer periods than was intended”; Time spent = “A great deal of time is spent in activities necessary to obtain alcohol, use alcohol, or recover from its effects”; Quit/Cut down = “There is a persistent desire or unsuccessful efforts to cut down or control alcohol use”; Craving = “Craving, or a strong desire or urge to use alcohol”; Failure to fulfill = “Recurrent alcohol use resulting in a failure to fulfill major role obligations at work, school, or home”; Give up = “Important social, occupational, or recreational activities given up or reduced because of alcohol use”; Hazardous use = “Recurrent alcohol use in situations in which it is physically hazardous”; Physical/Psychological = “Alcohol use is continued despite knowledge of having a persistent or recurrent physical or psychological problem that is likely to have been caused or exacerbated by alcohol”; Tolerance = “Tolerance, as defined by either of the following: (a) a need for markedly increased amounts of alcohol to achieve intoxication or desired effect or (b) a markedly diminished effect with continued use of the same amount of alcohol”; Withdrawal = “Withdrawal, as manifested by either of the following: (a) the characteristic withdrawal syndrome for alcohol or (b) alcohol (or a closely related substance, such as benzodiazepine) is taken to relieve or avoid withdrawal symptoms”; Social/Interpersonal = “Continued alcohol use despite having persistent or recurrent social or interpersonal problems caused or exacerbated by the effects of alcohol”.
Factor Controlled Models
Model fit for all three factor-controlled MIMIC models was acceptable (Table 2). Table 4 reports results for factor controlled MIMIC models. DRD was significantly associated with the AUD factor. Higher DRD was also associated with higher factor scores on the give up symptom. In contrast, lower DRD was associated with higher factor scores on the larger/longer symptom. The relationship between DRD and all other AUD symptoms did not reach significance. DLD was significantly associated with the AUD factor. Higher DLD was also associated with higher factor scores on the larger/longer symptom. The relationship between DLD and all other AUD symptoms did not reach significance. PD was not significantly associated with the AUD factor. However, higher PD was associated with higher factor scores on the social/interpersonal and give up symptoms. The relationship between PD and all other AUD symptoms was not statistically significant.
Table 4.
Factor-controlled Model Median Factor Loadings and Parameter Estimate
| Alcohol Use Disorder | Delayed Reward Discounting | Delayed Loss Discounting | Probability Discounting | |||||
|---|---|---|---|---|---|---|---|---|
| Median λ | Range | Median Estimate | Range | Median Estimate | Range | Median Estimate | Range | |
| AUD Symptoms | ||||||||
| Quit/Cut Down | .70 | 0.69 to 0.75 | −.04 | −0.10 to 0.05 | .01 | −0.07 to 0.05 | −.01 | −0.08 to 0.07 |
| Failure to Fulfil | .72 | 0.70 to 0.77 | .03 | −0.05 to 0.11 | −.05 | −0.12 to −0.02 | −.01 | −0.08 to 0.08 |
| Give Up | .74 | 0.71 to 0.79 | .09* | 0.05 to 0.16 | .01 | −0.07 to 0.05 | .06* | −0.02 to 0.14 |
| Hazardous Use | .47 | 0.46 to 0.51 | −.01 | −0.06 to 0.05 | .00 | −0.05 to 0.03 | −.06 | −0.10 to −0.02 |
| Larger/Longer | .56 | 0.55 to 0.60 | −.07* | −0.13 to −0.04 | .06* | 0.04 to 0.09 | −.04 | −0.09 to 0.03 |
| Physical/Psychological | .72 | 0.70 to 0.77 | −.02 | −0.09 to 0.07 | −.01 | −0.08 to 0.04 | .03 | −0.05 to 0.10 |
| Time Spent | .77 | 0.75 to 0.83 | −.02 | −0.09 to 3.00 | −.02 | −0.09 to 0.04 | .02 | −0.06 to 0.10 |
| Tolerance | .71 | 0.69 to 0.76 | .01 | −0.07 to 0.09 | −.02 | −0.08 to 0.04 | −.01 | −0.08 to 0.07 |
| Withdrawal | .71 | 0.69 to 0.76 | .03 | −0.05 to 0.10 | .02 | −0.06 to 0.06 | .00 | −0.07 to 0.08 |
| Craving | .64 | 0.63 to 0.69 | .02 | −0.06 to 0.08 | .03 | −0.05 to 0.06 | .01 | −0.06 to 0.08 |
| Social/Interpersonal | .64 | 0.63 to 0.69 | .00 | −0.07 to 0.08 | −.03 | −0.09 to 0.02 | .07* | 0.02 to 0.13 |
| AUD Factor | .13* | 0.02 to 0.24 | −.15* | −0.21 to −0.05 | .01 | −0.10 to 0.11 | ||
Note. Estimates are standardized. AUD = alcohol use disorder; Larger/Longer = “Alcohol is taken in larger amounts or over longer periods than was intended”; Time spent = “A great deal of time is spent in activities necessary to obtain alcohol, use alcohol, or recover from its effects”; Quit/Cut down = “There is a persistent desire or unsuccessful efforts to cut down or control alcohol use”; Craving = “Craving, or a strong desire or urge to use alcohol”; Failure to fulfill = “Recurrent alcohol use resulting in a failure to fulfill major role obligations at work, school, or home”; Give up = “Important social, occupational, or recreational activities given up or reduced because of alcohol use”; Hazardous use = “Recurrent alcohol use in situations in which it is physically hazardous”; Physical/Psychological = “Alcohol use is continued despite knowledge of having a persistent or recurrent physical or psychological problem that is likely to have been caused or exacerbated by alcohol”; Tolerance = “Tolerance, as defined by either of the following: (a) a need for markedly increased amounts of alcohol to achieve intoxication or desired effect or (b) a markedly diminished effect with continued use of the same amount of alcohol”; Withdrawal = “Withdrawal, as manifested by either of the following: (a) the characteristic withdrawal syndrome for alcohol or (b) alcohol (or a closely related substance, such as benzodiazepine) is taken to relieve or avoid withdrawal symptoms”; Social/Interpersonal = “Continued alcohol use despite having persistent or recurrent social or interpersonal problems caused or exacerbated by the effects of alcohol”.
Results for all models after controlling for a heaviness of consumption latent variable are reported in supplemental Tables 4 and 5. Although there were some variations in results model to model, results were consistent across the three models. Steeper DRD was associated with higher factor scores on the give up symptom for both factor models and the MIMIC models, and steeper probability discounting was associated with higher factor scores on the give up symptom for only the MIMIC models. The larger/longer results were not significant across any model, and the discounting variables no longer were associated with AUD in the MIMIC models after accounting for heaviness of consumption.
Discussion
Meta-analytic research highlights a small magnitude effect size (r = .14) for linear relationships between delay discounting and AUD (Amlung et al., 2017). While AUD is often conceptualized as a unitary, graded construct based on a sum score of criteria met, recent work suggests that AUD has significant heterogeneity (even within criteria). Behavioral economics suggests that some symptoms of AUD may not be internal states but rather are temporally extended patterns of behavior in which utility is maximized in the immediate rather than over a longer temporal span (Rachlin, 1995; Rachlin et al., 1991; Tucker, Cheong, et al., 2021; Tucker, Lindstrom, et al., 2021; Vuchinich & Tucker, 1983). endophenotypic, criterion-specific risk factors. This study quantifies relationships between individual AUD symptoms and behavioral economic discounting to inform nuanced and accurate etiological models accounting for specific risk factors for distinct elements of AUD.
Our results indicate variability in the relationship between discounting variables and individual AUD symptoms, suggesting that discounting variables may serve as criterion-specific risk factors that illuminate the underlying nature of the symptom under consideration. The results also lend further support for heterogeneity in AUD symptoms. Across all models, DRD was positively associated with the “give up” AUD symptom. The give up symptom (“Given up or cut back on activities that were important or interesting to you, or gave you pleasure, in order to drink”) refers to a pattern of disengagement from alternative, alcohol-free activities which often provide delayed rewards that are accompanied by some immediate costs (e.g., reading a book, exercising). One post hoc interpretation of these findings is that this tendency may be related to the preference reversals predicted by hyperbolic delayed reward discounting models of delayed rewards (Ainslie & Herrnstein, 1981; Bickel et al., 2014; Bickel & Marsch, 2001). When both the alcohol (smaller immediate reward) and alcohol-free choice options (potentially larger, delayed reward) are distal in time, the larger alcohol-free option is preferred. However, as the opportunity to drink approaches, a preference reversal occurs as the more immediate reward increases rapidly in value. It should be noted that, consistent with discounting research more generally, the associations across all models were small. This may be due to issues in measurement of AUD or of discounting. Alternatively, the mechanistic role of delayed reward discounting may in fact be minor, on average across individuals, because of the multiple determinants of each symptom. Such a perspective does not preclude the possibility that these discounting variables may be more important in symptom formation for some individuals than others. Moreover, as noted by Rosenthal et al. (2000) and others (Dick et al., 2021) small effects can be “meaningful” from practical and public health perspectives, especially when emerging in the context of focused investigations.
Behavioral economics posits that decisions generally maximize utility by favoring options in which the benefits outweigh the costs. However, the vast majority of discounting research has focused on understanding the effects of delay on rewards, or benefits, while largely ignoring the other side of the ratio, namely, costs (e.g., the potential immediate and long-term consequences of heavy drinking). In zero-order correlations and path models, DLD was robustly associated with the failure to fulfill role obligations AUD symptom (“Have you found that drinking — or being sick from drinking — often interfered with taking care of your home or family? Or caused job troubles? Or school problems?”). However, in factor-controlled models, DLD showed a non-significant trend level association with the failure to fulfill symptom. Altogether, the results suggest that DLD may serve as a contributing factor for the failure to fulfill symptom, although this relationship may be relatively weak. DLD refers to the degree to which a utility loss is discounted as it moves further away in time (Murphy et al., 2001). It is possible that individuals who demonstrate steep DLD are more willing to forego an immediate loss (i.e., drinking with a friend) and instead absorb a greater one later (e.g., a hangover). However, it is important to note that, like delayed reward discounting, associations between delayed loss discounting and AUD symptoms across all models were small.
PD was associated with the social/interpersonal symptom in zero-order correlations and the factor-controlled models, although the zero-order relation was small and was nonsignificant in the path models. PD was also associated with the give up symptom in factor-controlled models. These results provide some evidence that, although PD may generally demonstrate less consistent relations with AUD total scores compared to DRD, PD may have unique utility as a phenotype for specific AUD symptoms, namely the social/interpersonal symptom when compared to other discounting indices. One post hoc explanation for this is perhaps a tendency to devalue larger uncertain rewards in favor of smaller certain rewards may manifest in a tendency to value the smaller certain reward associated with having another drink over the larger but uncertain impact of that heavy drinking episode on the individual’s social relationships. Consistent with the DRD and DLD findings, in addition to the broader PD literature, these associations were quite small.
In factor-controlled models, both DRD and DLD demonstrated associated with larger/longer in directions that were contrary to what is typical for relationships with AUD. However, these results are a deviation from results found in the zero-order correlations and in the path analyses. We suspect that these findings likely represent suppression effects that may arise given the number of paths estimated in the factor-controlled models. Perhaps what this pattern of associations with larger/longer most represents is that, the bivariate association with larger/longer is not very specific to the symptom beyond a general association with the syndrome.
These results may have implications for personalized medicine approaches. Personalized medicine acknowledges individual heterogeneity in the etiology and maintenance of psychopathology and targets varying mechanisms specific to the experience of the individual. The finding that each of the behavioral economic indices were most related to the AUD symptoms thought to index dysregulated reward processes is, although perhaps unsurprising (see Boness et al., 2021), useful for understanding treatment targets. DRD is a transdiagnostic phenomenon implicated in other forms of psychopathology such as major depressive disorder, schizophrenia, bipolar disorder, and borderline personality disorder, among others (Amlung et al., 2019). Thus, in individuals who exhibit DRD, focusing on modifying DRD through interventions such as contingency management, which is known to reduce discounting (Rung & Madden, 2018) possibly by creating concrete, consistent, and immediate contingencies for drinking, may be one way to modify risk for AUD and other forms of psychopathology (Petry et al., 2012). An alternative brief, albeit less studied, approach to reducing DRD is through the use of episodic future thinking interventions (Atance & O’Neill, 2001; Snider et al., 2016). Episodic future thinking is a mental stimulation of future events intended to increase the temporal window in which utility is maximized, with the overall goal of reducing DRD and unhealthy behaviors. These interventions have been shown to reduce DRD and alcohol demand (Bulley & Gullo, 2017; Patel & Amlung, 2020; Snider et al., 2016; Sze et al., 2017), and preliminary evidence suggests there may be a small, short-term effect on reducing health behaviors like cigarette smoking (Chiou & Wu, 2017) and alcohol consumption (Voss et al., 2021). Accumulating evidence, including that presented here, highlights the heterogeneity of AUD and supports the idea of interventions targeting specific endophenotypes underlying specific AUD symptoms. Episodic future thinking interventions have been incorporated into brief interventions, which are already designed to contain various modules intended to reduce drinking (Meshesha et al., 2020). Perhaps future research could identify other endophenotypes to inform an intervention with specific modules designed to target each symptom of AUD. There has been no research that has attempted to manipulate DLD, although this form of discounting is likely amenable to similar manipulations as those used to change DRD and should be the topic of future study.
More generally, these results highlight the limitations of syndrome-level analyses. Syndrome-level (AUD) analyses likely obscure the more specific symptom-level associations observed in the current study. As suggested elsewhere (Boness et al., 2021), these results support the idea that AUD symptoms are etiologically distinct and represent different profiles of risk between persons, with equally distinct endophenotypes undergirding symptom presentation. Indeed, the results may partially explain the small effect size relation between DRD and AUD (Amlung et al., 2017). Although few DRD interventions have explicitly targeted AUD, it may also explain why the effect sizes on changing addictive behaviors have often been small (Chiou & Wu, 2017). It may be the case that these interventions may be most likely to reduce occurrence of specific AUD symptoms and thus they could be included as a module in a more comprehensive intervention targeting other endophenotypes.
Limitations and Future Directions
There are several limitations of these analyses that point toward specific goals for future research in this area. First, because the study design was cross-sectional we were unable to examine the role of human development (which may be important given that discounting generally decreases across the lifespan and may show differential associations with AUD at different developmental periods) and over the course of AUD (e.g., incipient AUD vs. chronic; Sher et al., 2004). Second, the sample was relatively homogenous with respect to race and ethnicity. It is therefore imperative to critically examine the role of discounting over the course of AUD (and the degree of “recovery” that occurs following prolonged abstinence) and characterize the generalizability of these findings across diverse samples. Third, the sample was restricted in regard to AUD symptom severity, and samples with more severe AUD presentations may result in differential findings. Fourth, all measurement was based on self-report methods, and the results should be examined using clinical interviews. Fifth, measures of both discounting and AUD criterion provide retrospective snapshots that presumably approximate behavioral patterns occurring over an extended period of time that are influenced by a variety of contextual factors which were not measured in this study (e.g., the availability and price of alcohol and alternative rewards). This measurement limitation may partially account for the overall small effect sizes observed. Future molar behavioral research approaches could measure decision making process and drinking patterns and consequences over a more extended temporal period and attempt to connect both with contextual factors to increase our understanding of the determinants of both discounting processes and drinking. Sixth, although our study extended research on sign effects by exploring delayed loss discounting, our study did not include a measure of probability loss discounting, which should be included in future studies. Further, some research suggests that probability discounting may interact with delay, or other, discounting variables to predict relevant outcomes (Vanderveldt et al., 2015), and future work might explore how such an interaction is associated with AUD symptoms. Seventh, our findings were exploratory in nature, and we recommend that future studies determine whether our results are replicable.
Conclusion
Behavioral economics is one useful theoretical framework for contextualize AUD diagnosis to structure prevention, intervention, and treatment approaches that target personalized mechanisms of behavior change. Other work suggests that AUD symptoms are distinct, and our findings suggest that delayed reward discounting, delayed loss discounting, and probability discounting may be useful endophenotypes for three AUD symptoms in particular: giving up, failure to fulfill, and social/interpersonal problems, which may reflect reward dysregulation more generally. These associations were relatively small in nature and indicate that there are likely many other variables that may show important associations with AUD symptoms. Future research should identify predictors of other AUD symptoms to more adequately capture profiles of risk and better inform etiological models and potential precision medicine approaches to treating AUD.
Supplementary Material
Public Health Significance.
AUD diagnoses, though common, are highly heterogenous collections of commonly co-occurring symptoms that do not necessarily share common phenotypic variance. Behavioral economics suggests that discounting of losses and rewards across time and over different probabilities may account for some of the variance in specific AUD symptoms. The results of the current study support the notion that AUD diagnosis reflect heterogeneous symptoms, and that delayed reward discounting, delayed loss discounting, and probability discounting may be useful endophenotypes for three AUD symptoms in particular: giving up, failure to fulfill, and social/interpersonal problems, providing potential treatment targets for these symptoms.
Acknowledgments
SFA, CLB, and JGM are supported by the National Institute on Alcohol Abuse and Alcoholism (R01 AA024930-01, Multiple-PIs: James MacKillop and JGM; F31 AA027140, PI: SFA; F31AA026177, PI: CLB).
Footnotes
Prolific is a United Kingdom-based company. Thus, alcohol consumption is measured in units rather than standard drinks. The exact screening item Prolific uses is: “How many units of alcohol do you drink on average per week? (1 unit of alcohol = 1 small glass of wine; half pint of beer; pub measure of spirits)”.
At the suggestion of a reviewer, we tested models that were not corrected for outliers to determine if winsorizing the data was responsible for altering any conclusions of this research. The results were identical. Thus, the winsorized analyses were retained. We thank the reviewer for this comment.
The authors declare no conflict of interest.
References
- Ainslie G, & Herrnstein RJ (1981). Preference reversal and delayed reinforcement. Animal Learning & Behavior, 9(4), 476–482. 10.3758/BF03209777 [DOI] [Google Scholar]
- Amlung MT, & MacKillop J (2011). Delayed reward discounting and alcohol misuse: The roles of response consistency and reward magnitude. Journal of Experimental Psychopathology, 2(3), 418–431. 10.1055/s-0029-1237430.Imprinting [DOI] [PMC free article] [PubMed] [Google Scholar]
- Amlung MT, Marsden E, Holshausen K, Morris V, Patel H, Vedelago L, Naish KR, Reed DD, & McCabe RE (2019). Delay Discounting as a Transdiagnostic Process in Psychiatric Disorders: A Meta-analysis. JAMA Psychiatry, 76(11), 1176–1186. 10.1001/jamapsychiatry.2019.2102 [DOI] [PMC free article] [PubMed] [Google Scholar]
- Amlung MT, Vedelago L, Acker JD, Balodis I, & MacKillop J (2017). Steep delay discounting and addictive behavior: A meta-analysis of continuous associations. Addiction, 112, 51–62. 10.1111/add.13535 [DOI] [PMC free article] [PubMed] [Google Scholar]
- Atance CM, & O’Neill DK (2001). Episodic future thinking. Trends in Cognitive Sciences, 5(12), 533–539. 10.1016/S1364-6613(00)01804-0 [DOI] [PubMed] [Google Scholar]
- Bailey AJ, Gerst K, & Finn PR (2018). Delay discounting of losses and rewards in Alcohol Use Disorder: The effect of working memory load. Psychology of Addictive Behaviors, 32(2), 197–204. 10.1037/adb0000341.Delay [DOI] [PMC free article] [PubMed] [Google Scholar]
- Bickel WK, Johnson MW, Koffarnus MN, MacKillop J, & Murphy JG (2014). The behavioral economics of substance use disorders: Reinforcement pathologies and their repair. Annual Review of Clinical Psychology, 10, 641–677. 10.1146/annurev-clinpsy-032813-153724 [DOI] [PMC free article] [PubMed] [Google Scholar]
- Bickel WK, & Marsch LA (2001). Toward a behavioral economic understanding of drug dependence: Delay discounting processes. Addiction, 96(1), 73–86. 10.1080/09652140020016978 [DOI] [PubMed] [Google Scholar]
- Boness CL, Lane SP, & Sher KJ (2019). Not all alcohol use disorder criteria are equally severe: Toward severity grading of individual criteria in college drinkers. Physiology & Behavior, 33(1), 35–49. 10.1037/adb0000443.Not [DOI] [PMC free article] [PubMed] [Google Scholar]
- Boness CL, Watts AL, Moeller KN, & Sher KJ (2021). The etiologic, theory-based, ontogenetic hierarchical framework of Alcohol Use Disorder: A translational systematic review of reviews. Psychological Bulletin. [DOI] [PMC free article] [PubMed] [Google Scholar]
- Bulley A, & Gullo MJ (2017). The influence of episodic foresight on delay discounting and demand for alcohol. Addictive Behaviors, 66, 1–6. 10.1016/j.addbeh.2016.11.003 [DOI] [PubMed] [Google Scholar]
- Chiou W-B, & Wu W-H (2017). Episodic future thinking involving the nonsmoking self can induce lower discounting and cigarette consumption. Journal of Studies on Alcohol and Drugs, 78(1), 106–112. http://www.ncbi.nlm.nih.gov/pubmed/27936370 [DOI] [PubMed] [Google Scholar]
- Dick AS, Lopez DA, Watts AL, Heeringa S, Reuter C, Bartsch H, Fan CC, Kennedy DN, Palmer C, Marshall A, Haist F, Hawes S, Nichols TE, Barch DM, Jernigan TL, Garavan H, Grant S, Pariyadath V, Hoffman E, … Thompson WK (2021). Meaningful associations in the adolescent brain cognitive development study. NeuroImage, 239, 1–29. 10.1016/j.neuroimage.2021.118262 [DOI] [PMC free article] [PubMed] [Google Scholar]
- Furrebøe EF (2020). The sign effect, systematic devaluations and zero discounting. Journal of the Experimental Analysis of Behavior, 113(3), 626–643. 10.1002/jeab.598 [DOI] [PubMed] [Google Scholar]
- Gray JC, Amlung MT, Palmer AA, & MacKillop J (2016). Syntax for calculation of discounting indices from the monetary choice questionnaire and probability discounting questionnaire. Journal of Experimental Analysis of Behavior, 106(2), 156–163. 10.1002/jeab.221.SYNTAX [DOI] [PMC free article] [PubMed] [Google Scholar]
- Green L, & Myerson J (2010). Experimental and correlational analyses of delay and probability discounting. In Madden GJ & Bickel WK (Eds.), Impulsivity: The Behavioral and Neurological Science of Discounting (pp. 67–92). American Psychological Association. [Google Scholar]
- Green L, Myerson J, & Vanderveldt A (2014). Delay and Probabiltiy Discounting. In McSweeney FK & Murphy ES (Eds.), The Wiley Blackwell Handbook of Operant and Classical Conditioning (pp. 307–338). John Wiley & Sons, Ltd. [Google Scholar]
- Halkjelsvik T (2021). Smoking, hazardous drinking and individual differences in cost and gain discounting. Nordic Studies on Alcohol and Drugs, 145507252098597. 10.1177/1455072520985971 [DOI] [PMC free article] [PubMed] [Google Scholar]
- Hasin DS, & Grant BF (2015). The National Epidemiologic Survey on Alcohol and Related Conditions (NESARC) Waves 1 and 2: review and summary of findings. Social Psychiatry and Psychiatric Epidemiology, 50(11), 1609–1640. 10.1007/s00127-015-1088-0 [DOI] [PMC free article] [PubMed] [Google Scholar]
- Hasin DS, O’Brien CP, Auriacombe M, Borges G, Bucholz KK, Budney AJ, Compton WM, Crowley DJ, Ling W, Petry NM, Schuckit MA, & Grant BF (2013). DSM-5 criteria for substance use disorders: Recommendations and rationale. American Journal of Psychiatry, 170(8), 834–851. 10.1176/appi.ajp.2013.12060782.DSM-5 [DOI] [PMC free article] [PubMed] [Google Scholar]
- Herrnstein RJ (1974). Formal properties of the matching law. Journal of the Experimental Analysis of Behavior, 21(I), 159–164. 10.1901/jeab.1974.21-159 [DOI] [PMC free article] [PubMed] [Google Scholar]
- Kaplan BA, Amlung MT, Reed DD, Jarmolowicz DP, McKerchar TL, & Lemley SM (2016). Automating scoring of delay discounting for the 21- and 27-item Monetary Choice Questionnaires. The Behavior Analyst, 1–12. 10.1007/s40614-016-0070-9 [DOI] [PMC free article] [PubMed] [Google Scholar]
- Kendler KS, Aggen SH, Prescott CA, Crabbe J, & Neale MC (2012). Evidence for multiple genetic factors underlying the DSM-IV criteria for alcohol dependence. Molecular Psychiatry, 17(12), 1306–1315. 10.1038/mp.2011.153 [DOI] [PMC free article] [PubMed] [Google Scholar]
- Lange S, Shield K, Monteiro M, & Rehm J (2019). Facilitating Screening and Brief Interventions in Primary Care: A Systematic Review and Meta-Analysis of the AUDIT as an Indicator of Alcohol Use Disorders. In Alcoholism: Clinical and Experimental Research. 10.1111/acer.14171 [DOI] [PMC free article] [PubMed] [Google Scholar]
- Litten RZ, Falk DE, Ryan ML, & Fertig JB (2016). Discovery, Development, and Adoption of Medications to Treat Alcohol Use Disorder: Goals for the Phases of Medications Development. Alcoholism: Clinical and Experimental Research, 40(7), 1368–1379. 10.1111/acer.13093 [DOI] [PMC free article] [PubMed] [Google Scholar]
- MacKillop J, Amlung MT, Few LR, Ray LA, Sweet LH, & Munafò MR (2011). Delayed reward discounting and addictive behavior: A meta-analysis. Psychopharmacology, 216(3), 305–321. 10.1007/s00213-011-2229-0 [DOI] [PMC free article] [PubMed] [Google Scholar]
- Madden GJ, Petry NM, & Johnson PS (2009). Pathological gamblers discount probablistic rewards less steeply than matched controls. Experimental & Clinical Psychopharmacology, 17(5), 283–290. 10.1037/a0016806.Pathological [DOI] [PMC free article] [PubMed] [Google Scholar]
- Mazur JE (1987). An adjusting procedure for studying delayed reinforcement. In Commons ML, Mazur JE, Nevin JA, & Rachlin H (Eds.), The effect of delay and of intervening events on reinforcement value (pp. 55–73). Lawrence Erlbaum Associates, Inc. [Google Scholar]
- Mazur JE (1993). Predicting the strength of a conditioned reinforcer: effects of delay and uncertainty. Current Directions in Psychological Science, 2(3), 70–74. 10.1111/1467-8721.ep10770907 [DOI] [Google Scholar]
- Meshesha LZ, Soltis KE, Wise EA, Rohsenow DJ, Witkiewitz K, & Murphy JG (2020). Pilot trial investigating a brief behavioral economic intervention as an adjunctive treatment for alcohol use disorder. Journal of Substance Abuse Treatment, 113, 108002. 10.1016/j.jsat.2020.108002 [DOI] [PMC free article] [PubMed] [Google Scholar]
- Murphy JG, Vuchinich RE, & Simpson CA (2001). Delayed reward and cost discounting. The Psychological Record, 51, 571–588. [Google Scholar]
- Muthén LK, & Muthén BO (2017). Mplus User’s Guide. Eighth Edition. Los Angeles, CA: Muthén & Muthén. 10.1111/j.1600-0447.2011.01711.x [DOI] [Google Scholar]
- Myerson J, Green L, & Morris J (2011). Modeling the Effect of Reward Amount on Probability Discounting. Journal of the Experimental Analysis of Behavior, 95(2), 175–187. 10.1901/jeab.2011.95-175 [DOI] [PMC free article] [PubMed] [Google Scholar]
- National Survey on Drug Use and Health. (2018). 2018 NSDUH Annual National Report | CBHSQ. Annual Report. [Google Scholar]
- Patel H, & Amlung M (2020). Acute and extended exposure to episodic future thinking in a treatment seeking addiction sample: A pilot study. Journal of Substance Abuse Treatment, 116(December 2019), 108046. 10.1016/j.jsat.2020.108046 [DOI] [PubMed] [Google Scholar]
- Petry NM, Barry D, Alessi SM, Rounsaville BJ, & Carroll KM (2012). A randomized trial adapting contingency management targets based on initial abstinence status of cocaine-dependent patients. Journal of Consulting and Clinical Psychology. 10.1037/a0026883 [DOI] [PMC free article] [PubMed] [Google Scholar]
- Rachlin H (1995). Self-control: Beyond commitment. Behavioral and Brain Sciences, 18, 109–121. 10.1017/s0140525x00037602 [DOI] [Google Scholar]
- Rachlin H, Battalio R, Kagel J, & Green L (1981). Maximization theory in behavioral psychology. Behavioral and Brain Sciences, 4(3), 371–388. 10.1017/S0140525X00009407 [DOI] [Google Scholar]
- Rachlin H, Raineri A, & Cross D (1991). Subjective Probability and Delay. Journal of the Experimental Analysis of Behavior, 55(2), 233–244. 10.1901/jeab.1991.55-233 [DOI] [PMC free article] [PubMed] [Google Scholar]
- Rosenthal R, Rubin DB, & Rosnow RL (2000). Contrasts and effect sizes in behavioral research: A correlational approach. Cambridge University Press. [Google Scholar]
- Rung JM, & Madden GJ (2018). Experimental reductions of delay discounting and impulsive choice: A systematic review and meta-analysis. Journal of Experimental Psychology: General, 147(9), 1349–13831. 10.1037/xge0000462 [DOI] [PMC free article] [PubMed] [Google Scholar]
- Schulenberg JE, Johnston LD, O’Malley PM, Bachman JG, Miech RA, Patrick ME, Schulenberg JE, & Miech RA (2018). Monitoring the Future national survey results on drug use, 1975–2018: Volume II, College students and adults ages 19–60. http://monitoringthefuture.org/pubs.html#monographs
- Sher KJ, Gotham HJ, & Watson AL (2004). Trajectories of dynamic predictors of disorder: Their meanings and implications. Development and Psychopathology, 16(4), 825–856. https://doi.org/ 10.1017/S0954579404040039 [DOI] [PubMed] [Google Scholar]
- Snider SE, LaConte SM, & Bickel WK (2016). Episodic future thinking: Expansion of the temporal window in individuals with alcohol dependence. Alcoholism: Clinical & Experimental Research, 40(7), 1558–1566. 10.1111/acer.13112 [DOI] [PMC free article] [PubMed] [Google Scholar]
- Sze YY, Stein JS, Bickel WK, Paluch RA, & Epstein LH (2017). Bleak Present, Bright Future: Online Episodic Future Thinking, Scarcity, Delay Discounting, and Food Demand. Clinical Psychological Science, 5(4), 683–697. 10.1177/2167702617696511 [DOI] [PMC free article] [PubMed] [Google Scholar]
- Tabachnick BG, & Fidell LS (2013). Using multivariate statistics (6th ed.). Pearson. [Google Scholar]
- Takahashi T, Ikeda K, & Hasegawa T (2007). A hyperbolic decay of subjective probability of obtaining delayed rewards. Behavioral and Brain Functions, 3(ii), 1–11. 10.1186/1744-9081-3-52 [DOI] [PMC free article] [PubMed] [Google Scholar]
- Tucker JA, Cheong JW, & Chandler SD (2021). Shifts in behavioral allocation patterns as a natural recovery mechanism: Postresolution expenditure patterns. Alcoholism: Clinical and Experimental Research, 45(6), 1304–1316. 10.1111/acer.14620 [DOI] [PMC free article] [PubMed] [Google Scholar]
- Tucker JA, Lindstrom K, Chandler SD, Bacon JP, & Cheong JW (2021). Behavioral economic indicators of risky drinking among community-dwelling emerging adults. Psychology of Addictive Behaviors, 35(4), 415–423. 10.1037/adb0000686 [DOI] [PMC free article] [PubMed] [Google Scholar]
- Vanderveldt A, Green L, & Myerson J (2015). Discounting of monetary rewards that are both delayed and probablistic: Delay and probability combine multiplicatively, not additively. Journal of Experimental Psychology: Learning, Memory, and Cognition, 41(1), 148–162. 10.1038/jid.2014.371 [DOI] [PMC free article] [PubMed] [Google Scholar]
- Vuchinich RE, & Tucker JA (1983). Behavioral theories of choice as a framework for studying drinking behavior. Journal of Abnormal Psychology, 92(4), 408–416. 10.1037/0021-843X.92.4.408 [DOI] [PubMed] [Google Scholar]
- Watts AL, Boness CL, Loeffelman JE, Steinley D, & Sher KJ (2021). Does Crude Measurement Contribute to Observed Unidimensionality of Psychological Constructs? A Demonstration With DSM–5 Alcohol Use Disorder. Journal of Abnormal Psychology, 130(5), 512–524. 10.1037/abn0000678.supp [DOI] [PMC free article] [PubMed] [Google Scholar]
- Wilhelm CJ, & Mitchell SH (2008). Rats bred for high alcohol drinking are more sensitive to delayed and probabilistic outcomes. Genes, Brain and Behavior, 7(7), 705–713. 10.1111/j.1601-183X.2008.00406.x [DOI] [PMC free article] [PubMed] [Google Scholar]
- Witkiewitz K, Roos CR, Mann K, & Kranzler HR (2019). Advancing Precision Medicine for Alcohol Use Disorder: Replication and Extension of Reward Drinking as a Predictor of Naltrexone Response. Alcoholism: Clinical and Experimental Research, 43(11), 2395–2405. 10.1111/acer.14183 [DOI] [PMC free article] [PubMed] [Google Scholar]
Associated Data
This section collects any data citations, data availability statements, or supplementary materials included in this article.