

Abstract
Obstructive sleep apnea (OSA) patients show autonomic, mood, cognitive, and breathing dysfunctions that are linked to increased morbidity and mortality, which can be improved with early screening and intervention. The gold standard and other available methods for OSA diagnosis are complex, require whole-night data, and have significant wait periods that potentially delay intervention. Our aim was to examine whether using faster and less complicated machine learning models, including support vector machine (SVM) and random forest (RF), with brain diffusion tensor imaging (DTI) data can classify OSA from healthy controls. We collected two DTI series from 59 OSA [age: 50.2±9.9 years; body-mass-index (BMI): 31.5±5.6 kg/m2; apnea-hypopnea-index (AHI): 34.1±21.2 events/hour 23 female] and 96 controls (age: 51.8±9.7 years; BMI: 26.2±4.1 kg/m2; 51 female) using a 3.0-Tesla magnetic resonance imaging scanner. Using DTI data, mean diffusivity maps were calculated from each series, realigned and averaged, normalized to a common space, and used to conduct cross-validation for model training and selection and to predict OSA. The RF model showed 0.73 OSA and controls classification accuracy and 0.85 area under the curve (AUC) value on the receiver-operator curve. Cross-validation showed the RF model with comparable fitting over SVM for OSA and control data (SVM; accuracy, 0.77; AUC, 0.84). The RF ML model performs similar to SVM, indicating the comparable statistical fitness to DTI data. The findings indicate that RF model has similar AUC and accuracy over SVM, and either model can be used as a faster OSA screening tool for subjects having brain DTI data.
Keywords: Random forest, Support vector machine, Brain, Mean diffusivity, Sleep disordered breathing
INTRODUCTION
Obstructive sleep apnea (OSA) is a serious health issue, affecting ~10% of the adults in the nation (Lee, Nagubadi, Kryger, & Mokhlesi, 2008). OSA subjects show a high presence of affected autonomic, mood, cognitive, and breathing functions that are linked to increased morbidity and mortality, as well as decreased quality of life (Asghari, Mohammadi, Kamrava, Jalessi, & Farhadi, 2013; Marshall et al., 2008). The gold standard for OSA diagnosis is overnight polysomnography (PSG), which requires overnight evaluation with complex data collection. The procedure requires dedicated systems, at least a 7–10 hours stay in a specialized sleep laboratory, and attending personnel that add significant costs (R. D. Kim et al., 2015) and long wait periods for an appointment, often taking up to 6 months (Bennett & Kinnear, 1999; Collop et al., 2007; Flemons, Douglas, Kuna, Rodenstein, & Wheatley, 2004; Flemons et al., 2003). In addition, overnight PSG evaluation requires extensive time and effort for OSA diagnosis and sleep assessment.
Other OSA diagnostic methods include either single overnight O2 pulse oximeter, cardiorespiratory, or acoustic snore signals along with artificial intelligence approaches that simplify the identification of OSA diagnosis (Collop et al., 2011; Del Campo et al., 2018; Hang et al., 2015). These less complicated alternatives also require patients to wear diagnostic devices overnight, and the low availability of required equipment may lead to long waiting periods that further delay intervention. However, as the number of subjects with suspected OSA are increasing, the need for simple, quick, accurate, and more cost effective diagnostic OSA methods are compelling.
One OSA diagnostic method, which has not been explored, is artificial intelligence-guided evaluation of the brain images. Multiple studies have reported brain changes in autonomic, mood, and cognition regulatory areas in OSA patients (Kumar et al., 2012; Tummala et al., 2016; Tummala et al., 2017), and may include acute tissue changes in recently-diagnosed, treatment-naïve OSA (Kumar et al., 2012; Tummala et al., 2016; Tummala et al., 2017), and chronic changes with a history of prolonged OSA condition (Chen et al., 2020; Xiong et al., 2017; Zhang et al., 2019). Partial or full recovery of OSA symptoms, with brain functions and tissue changes have been reported (Castronovo et al., 2014; H. Kim et al., 2016; O’Donoghue et al., 2012), likely resulting due to variable disease duration, since acute tissue changes can be reversed (Lecouvet, Duprez, Raymackers, Peeters, & Cosnard, 1999), and thus, restore functions, over chronic tissue changes, indicating the need for an innovative, timely, and relatively inexpensive method for early OSA diagnosis and prompt intervention.
Artificial intelligence methods include both deep learning and machine learning (ML) approaches, which are increasingly being used recently in neuroimaging data (Vieira, Pinaya, & Mechelli, 2017; Zhu et al., 2019). Deep learning methods require large data sets for better performance over ML techniques (Rachmadi et al., 2020); large neuroimaging data are lacking in most diseases, including OSA, which makes ML in neuroimaging data more common. ML algorithms learn prediction rules with features collected from the labeled training data and predict the tested data based on the learned rules. However, given the variability in the performance of ML models, including random forest (RF) and support vector machine (SVM) (Breiman, 2001; Scholkopf & Smola, 2001), it is unclear whether RF or SVM has the most efficacy in neuroimaging data to accurately identify OSA patients.
Magnetic resonance imaging (MRI) is a commonly-used method for neuroimaging, with significantly lower costs, less burden on patients, less wait time for an appointment, and a shorter examination than OSA diagnostic methods (Papanicolas, Woskie, & Jha, 2018). Among brain MRI methods, diffusion tensor imaging (DTI) is a sensitive procedure that can show microstructural tissue changes (Le Bihan, 2003). Since the OSA disease signature shows up through brain changes, reflected as microstructural tissue diffusion changes on DTI (Kumar et al., 2012), brain imaging can be used to predict OSA diagnosis using ML models, which have been used in other conditions (Hu et al., 2019; Schnyer, Clasen, Gonzalez, & Beevers, 2017), but not in OSA.
Our aims were to examine whether RF or SVM have the best efficacy in DTI based data, and whether the ML model with better efficacy can classify OSA and healthy control subjects.
METHODS
Participants
Fifty-nine adult OSA patients (age: 50.2±9.9 years; body-mass-index: 31.5±5.6 kg/m2; 36 male; apnea-hypopnea-index: 34.1±21.2 events/hour) and 96 adult healthy control subjects (age: 51.8±9.7 years; body-mass-index, 26.2±4.1 kg/m2; 45 male) were studied. All OSA subjects were recently-diagnosed through overnight polysomnography (PSG), and included patients with at-least moderate disease severity (apnea-hypopnea-index ≥ 15), without any treatment-naive, and who were recruited from the University of California Los Angeles (UCLA) Medical Center. OSA subjects were without any cardiovascular-altering medications (e.g., β-blockers, α-agonists, angiotensin-converting enzyme inhibitors, and vasodilators) or mood changing drugs, including serotonin reuptake inhibitors. In addition, OSA subjects with a prior history of stroke, heart failure, metallic implants, any diagnosed condition affecting the brain, or any contraindication with MRI scanner environment were excluded. All control subjects were healthy, without any sign of neurological or other conditions that may affect the brain, without any medications that might alter brain tissue, and without any sign of sleep disordered breathing, which was verified by interviewing the control subjects and their sleep partners, if available. In addition, the Epworth Sleepiness Scale (ESS) and the Pittsburgh Sleep Quality Index (PSQI) questionnaires were also administered on control subjects to evaluate the presence of any sleep disturbances. Control subjects were recruited through advertisement flyers posted at the UCLA campus and the neighboring community. All subjects, who participated in this study, provided informed and written consent, and study protocols were approved by the Institutional Review Board of the UCLA.
Magnetic Resonance Imaging
Brain MRI studies were performed using a 3.0-Tesla MRI scanner (Siemens; Magnetom Prisma Fit, Erlangen, Germany). High-resolution T1-weighted images were acquired using a magnetization-prepared rapid acquisition gradient echo pulse sequence in the sagittal plane [repetition time (TR) = 2200 ms; echo time (TE) = 2.41 ms; inversion-time = 900 ms; flip-angle (FA) = 9°; matrix-size = 320×320; field of view (FOV) = 230×230 mm; slice-thickness = 0.9 mm; slices = 192]. Proton-density and T2-weighted images were collected using a dual-echo turbo spin-echo pulse sequence in the axial plane (TR = 10,000 ms; TE1, 2 = 12, 124 ms; FA = 130°; matrix-size = 256×256; FOV = 230×230 mm; slice-thickness = 3.5 mm). Diffusion tensor imaging data were acquired using an echo planar imaging with twice-refocused spin echo pulse sequence in the axial plane (TR = 12,200 ms; TE = 87 ms; FA = 90°; bandwidth = 1,345 Hz/pixel; matrix-size = 128×128; FOV = 230×230 mm; slice-thickness = 1.7 mm; 92 slices; no interslice-gap; diffusion directions = 30; b values = 0 and 800 s/mm2), and two separate series were collected for subsequent averaging.
MRI Data Processing and Analysis
Proton density-, T2-, and high-resolution T1-weighted images were visually-examined before data processing by a neuroradiologist for any gross brain tissue pathology, including cystic lesions, infarcts, or tumors. All DTI data were also examined for any motion or other imaging artifacts before deriving whole-brain MD maps. All OSA and control subjects with any gross brain pathology or motion artifacts were excluded.
Calculation of MD maps
Using the diffusion (b=800 s/mm2)-weighted images, collected from 30 diffusion directions, and non-diffusion (b=0 s/mm2) images, diffusion tensor matrices were calculated from each series. The diffusion tensor matrices were diagonalized, and principal eigenvalues (λ1, λ2, and λ3) were calculated at each voxel (Pierpaoli, Jezzard, Basser, Barnett, & Di Chiro, 1996). Mean diffusivity [MD = (λ1+λ2+λ3)/3] values were determined at each voxel using principal eigenvalues (Le Bihan et al., 2001; Pierpaoli et al., 1996), and whole brain MD maps were derived.
Realignment, averaging, and normalization
Both MD maps, calculated from each DTI series, were realigned to remove any potential differences in two MD maps, and averaged to increase signal to noise ratio. Similarly, b0 images were realigned and averaged. The averaged MD maps were normalized to Montreal Neurological Institute (MNI) space using modified unified segmentation approach. For normalization, averaged b0 images were partitioned into gray matter, white matter, and cerebrospinal fluid tissue types (Ashburner & Friston, 2005), and the resulting normalization parameters were applied to corresponding MD maps. The normalized MD maps were used for ML models’ training, cross-validation, and OSA diagnosis prediction.
Statistical Analysis
We used the IBM statistical package for the social sciences software (IBM SPSS, v27) for demographic and biophysical data analyses. Numerical data were examined with independent samples t-tests and categorical data with Chi-square. A value of p < 0.05 was used to establish statistical significance.
ML models, training, and selection
We used one classical ML model, the SVM, and one modern ML model, the RF. Both ML models were trained and used for selection and OSA diagnosis. The MD values from each pixel from normalized whole-brain MD maps from 41 OSA and 67 control subjects were used to conduct cross-validation for model training and selection. In addition, 18 OSA and 29 control subjects, which were not part of the training data, were used for prediction. For cross-validation, the training data were divided into 5 folds randomly, and then each fold was taken as the validation data, while the other four folds were used for training the model (Figure 1). To select optimal hyper-parameters for each model and compare both algorithms, classification accuracy was chosen as model selection criterion. For each set of hyper-parameters given a model, the classification accuracy averaged over the 5 folds validation data and was considered the model performance. The model selection procedure aims to select the model and hyper-parameter with the highest classification accuracy. A popular kernel function, radial basis function kernel, was used for SVM. Two hyper-parameters are considered for SVM: C (1, 10, 100, 1000), which is inversely proportional to the strength, gamma (0.01, 0.001, 0.0001) that was the kernel coefficient. The hyper-parameters for RF search included number of trees in the forest (grid; 10, 100, 1000, 2000, 5000), and the maximum depth of the tree (grid; 1, 2, 3, 4, 5, 10, 100, 200, 500). The cross-validation and grid-search over the hyper-parameters were implemented with scikit-learn, a popular ML toolkit. For OSA disease diagnosis, accuracy, sensitivity, specificity, and receiver operating characteristic (ROC) curves were reported.
Figure 1:
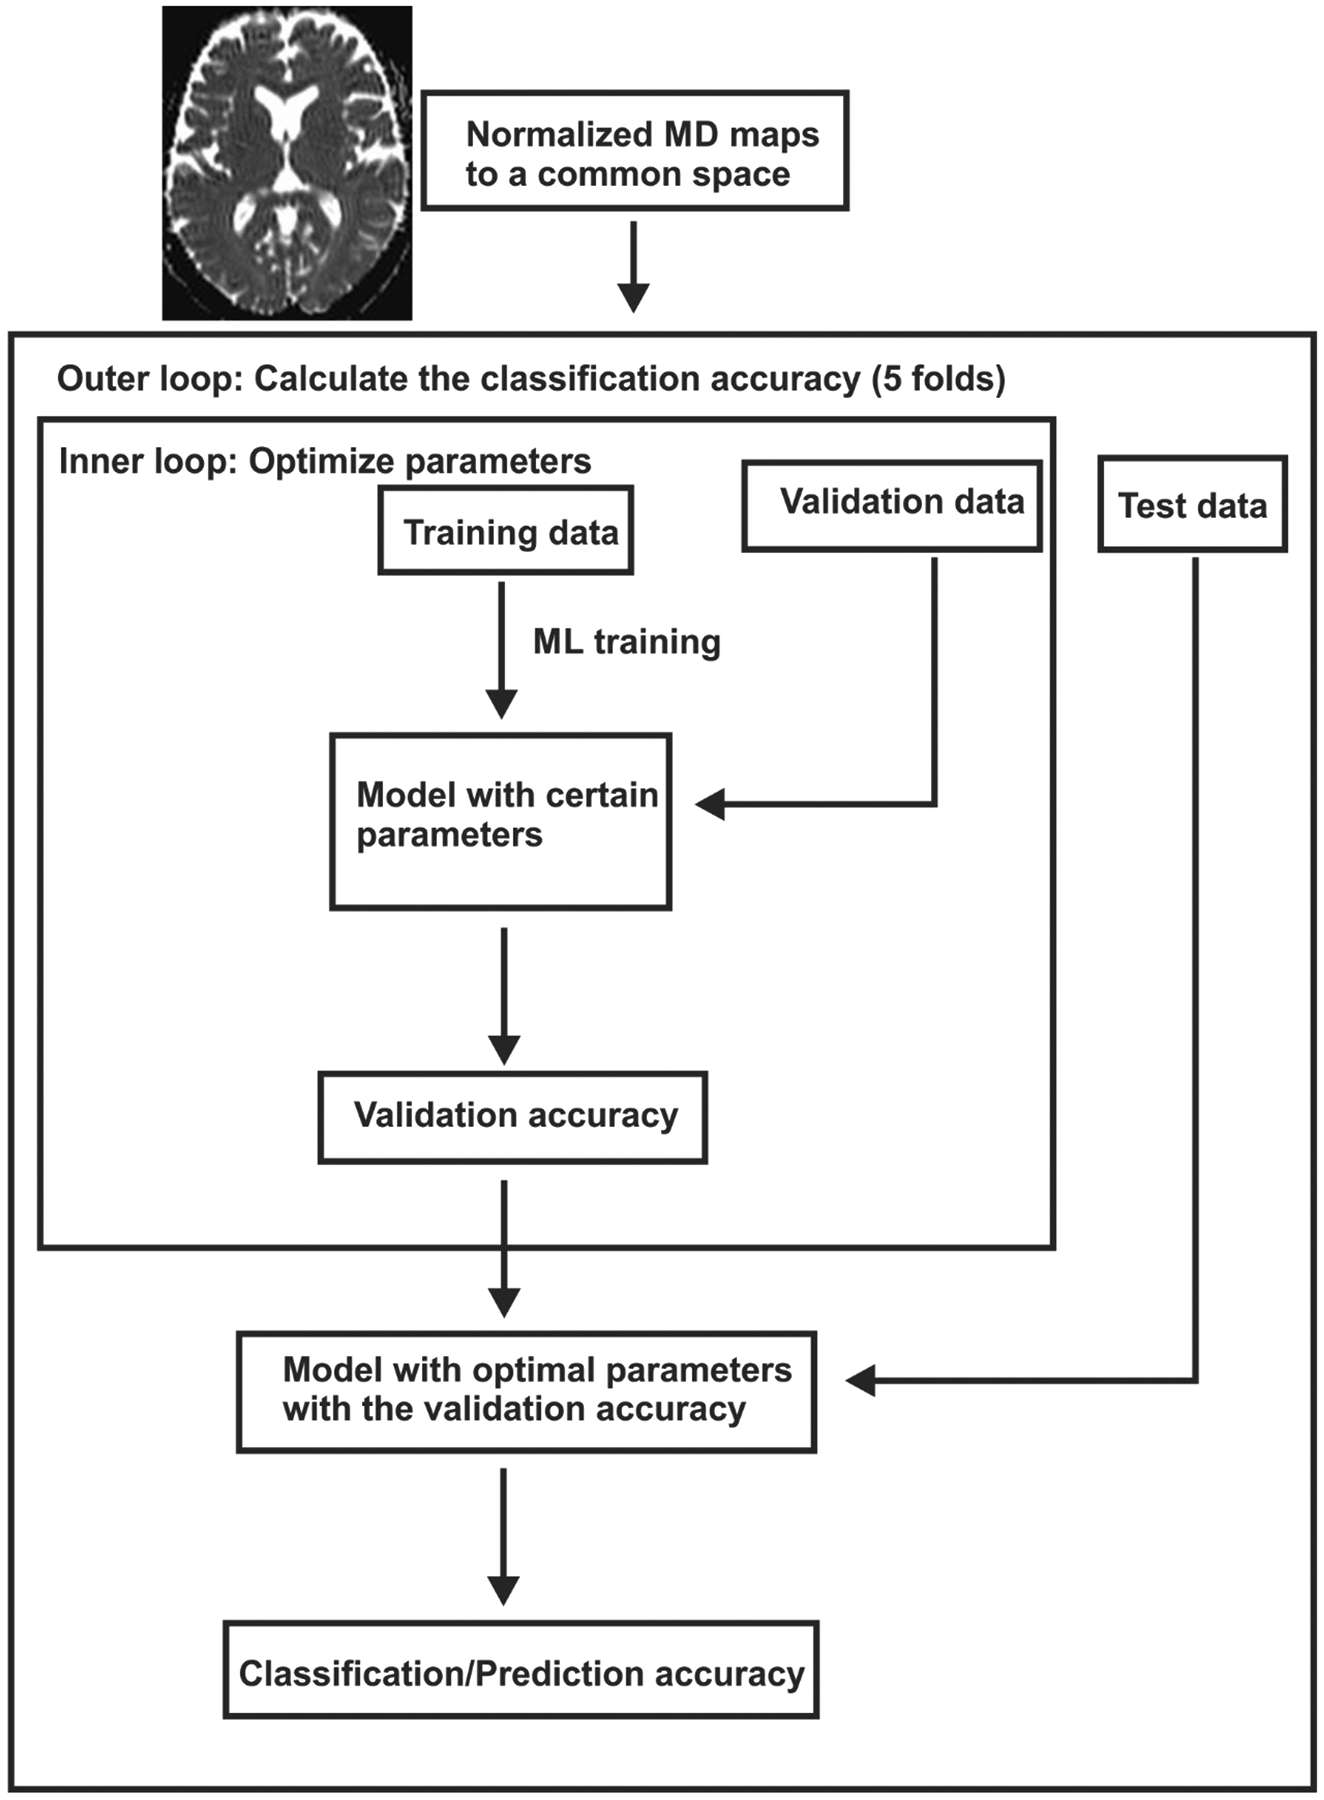
Steps for ML models for training, cross-validation, and testing.
RESULTS
Demographic and physical variables are summarized in Table 1. A total of 59 adult OSA (age: 50.2±9.9 years; body-mass-index: 31.5±5.6 kg/m2; 36 male; apnea-hypopnea-index: 34.1±21.2 events/hour) and 96 healthy control subjects (age: 51.8±9.7 years; body-mass-index: 26.2±4.1 kg/m2; 45 male) were included in the analysis. No significant differences in age or sex appeared between OSA and control groups. However, body mass index was significantly higher in OSA compared to control subjects.
Table 1:
Demographic, biophysical, and clinical variables of OSA and controls.
| Variables | OSA (n = 59) | Controls (n = 96) | p-value |
|---|---|---|---|
| Age (mean±SD, years) | 50.2±9.89 | 51.75±10 | 0.35 |
| Age range (years) | 29.5–66.2 | 26.4–65.9 | - |
| Gender (Male: Female) | 36:23 | 45:51 | 0.09 |
| BMI (mean±SD, kg/m2) | 31.5±5.6 | 26.2±4.2 | <0.001 |
| AHI (mean±SD, events/hour | 34.1±21.2 | - | - |
OSA, Obstructive sleep apnea; SD, Standard deviation; BMI, Body mass index; AHI, Apnea hypopnea index.
The cross-validation results for both SVM and RF models with the best hyper-parameters (accuracy) were 0.73±0.27 for RF and 0.77±0.20 for SVM. Basically, the RF model showed similar fitting accuracy over SVM for OSA and control data. Several parameters, including classification accuracy, precision, recall, and F1 scores for RF and SVM model to classify OSA and controls are displayed in Table 2. The receiver-operator curve for RF and SVM model showed 0.85 and 0.84 (Figure 2) area under the curve.
Table 2:
Prediction of OSA diagnosis with random forest and support vector machine ML models.
| Model | Accuracy | Precision | Recall | F1 | AUC |
|---|---|---|---|---|---|
| Random forest | 0.73 | 0.78 | 0.73 | 0.69 | 0.85 |
| Support Vector Machine | 0.77 | 0.77 | 0.77 | 0.76 | 0.84 |
OSA, Obstructive sleep apnea; ML, Machine learning; AUC, Area under the curve.
Figure 2:
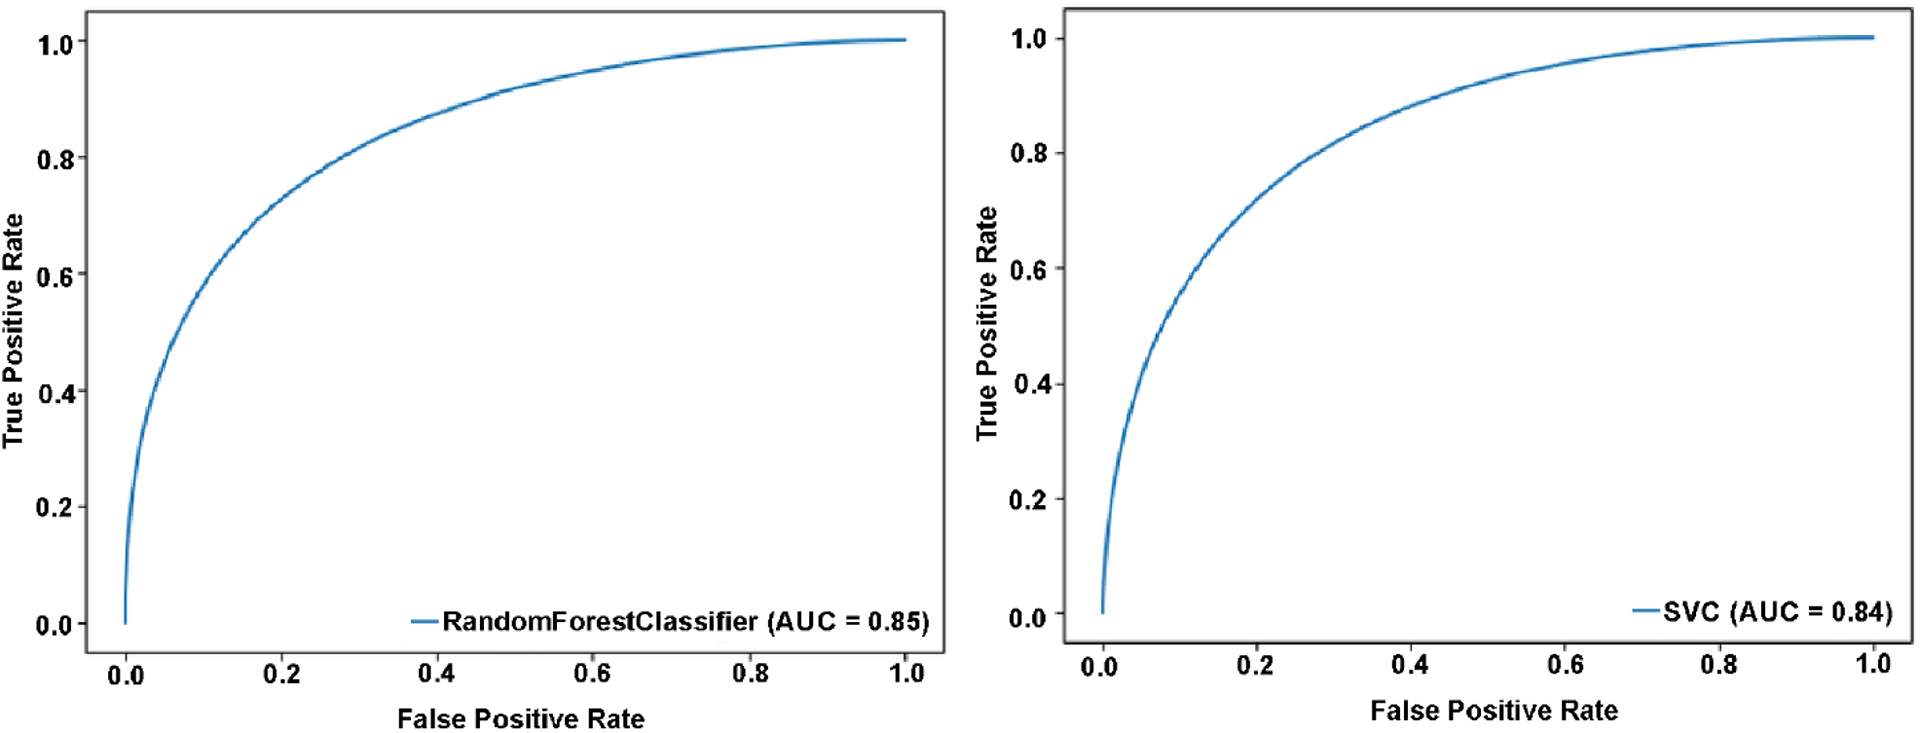
True positive and false-positive rates for random forest (A) and support vector machine (B) models for OSA diagnosis.
DISCUSSION
ML models, the RF performed similar to SVM and showed comparable model fit statistics to OSA and control DTI data. In addition, RF and SVM models showed similar predictive accuracy for OSA diagnosis from control subjects. The findings indicate that whole-brain imaging data can be used along with either ML model (RF or SVM) to accurately screen/diagnose OSA that might lead to earlier intervention, contributing to reduced morbidity and mortality, and increased life quality in the condition.
In this study, we have used pre-defined exclusion criteria to obtain a homogeneous OSA patients to avoid influence from any other factors for the classification of OSA and healthy controls. In the clinical or general population, patients with OSA might have multiple comorbid conditions, and the classification will still hold true while providing large effect sizes between OSA and control groups due to acute tissue changes in newly and untreated OSA patients.
Brain tissue changes and OSA
Intermittent hypoxia episodes are common characteristics of OSA that can contribute to brain tissue changes, reflected as gray (Yaouhi et al., 2009) and white matter injury (Kumar et al., 2012) and metabolite deficits in multiple regions (Tonon et al., 2007; Yadav et al., 2014). The targeted neural and axonal sites play major roles in control of hallmark OSA symptoms, including sympathetic and parasympathetic deficits (Oppenheimer, Kedem, & Martin, 1996), memory loss, executive decision making abnormalities, depression (Bremner et al., 2000), and breathing deficits (Grasso, Lubich, Guidi, Rinnenburger, & Paolucci, 2000). Recently-diagnosed, treatment-naïve OSA subjects show lower tissue diffusion values, indicating acute changes with axonal and neuronal inflammation (Kumar et al., 2012), and other studies show either increased tissue diffusion (Chen et al., 2020; Xiong et al., 2017; Zhang et al., 2019) or gray matter loss, suggesting chronic changes with axonal, neuronal, and cellular loss. These findings suggest that OSA patients with early and long-lasting conditions have different types of brain tissue changes.
OSA treatment and functional brain tissue recovery
The most common and effective way to treat OSA is with the use of continuous positive airway pressure (CPAP), and compliance is necessary for the significant benefits of CPAP (CPAP use at-least 4 hours/night for at least 5 nights/week) (Bhatia & Singh, 2019; Wolkove, Baltzan, Kamel, Dabrusin, & Palayew, 2008). Other alternatives to CPAP, such as uvulectomy and dental jaw devices, are either invasive or have less efficacy in most OSA subjects. Multiple OSA studies with CPAP treatment report either full or partial recovery in brain functions, including the autonomic, cognition, and mood (Engleman, Cheshire, Deary, & Douglas, 1993; Narkiewicz et al., 1999). Also, MRI studies before and after CPAP use show partial or complete brain tissue recovery (Castronovo et al., 2014; H. Kim et al., 2016; O’Donoghue et al., 2012). Early diagnosed, treatment-naïve OSA subjects show acute brain changes, reflected as reduced tissue water diffusion (Kumar et al., 2012; Tummala et al., 2017), and other studies show chronic tissue changes (Chen et al., 2020; Xiong et al., 2017; Zhang et al., 2019). The differential findings of partial or full recovery in brain functions and tissue changes after CPAP use likely result from variable OSA disease duration in those studies, with recent OSA onset showing acute tissue changes, and chronic tissue changes indicating long-lasting OSA. Since acute brain tissue changes can be reversed in OSA as in other conditions (Kidwell et al., 1999; Lecouvet et al., 1999), and thus, brain functional deficits can be restored with early diagnosis and prompt intervention.
Gold standard and other alternative methods for OSA diagnosis
The gold standard for OSA diagnosis is overnight PSG, which has a significant wait period (Flemons et al., 2004) due to the need for a dedicated sleep laboratory and equipment with trained personnel and has higher procedure costs (R. D. Kim et al., 2015), leading to undiagnosed OSA (Singh et al., 2013). The overnight PSG consists of recording 7–10 hour complex data, and evaluation requires labor intensive effort from a sleep medicine physician for interpretation and sleep diagnosis. Complexity of PSG data recording and higher cost lead to a majority of OSA patients undiagnosed (Singh et al., 2013).
Other less complicated methods are also explored in OSA patients for diagnosis. Such methods include single data recording, including overnight O2 pulse oximeter, cardiorespiratory, or acoustic snore signals, which are combined with ML models (Collop et al., 2011; Del Campo et al., 2018; Hang et al., 2015). Although these procedures help simplify OSA diagnosis and have less cost and analysis time, they also require patients to wear whole-night diagnostic devices. Their low availability of required devices lead to long waiting periods and delay intervention. However, as the number of people with suspected OSA are increasing, the need for simple, quick, accurate, and more cost-effective diagnostic methods are required, and ML modeling in neuroimaging data can play a crucial role.
ML modeling in neuroimaging
Since deep learning methods require extensive training data sets for better performance (Rachmadi et al., 2020), ML models are frequently used in neuroimaging. Also, ML models perform better with limited training data over deep learning models (Rachmadi et al., 2020). ML models learn prediction rules with features collected from the labeled training data sets, and predict the tested data based on learned rules. RF and SVM models are commonly used in neuroimaging (Breiman, 2001; Scholkopf & Smola, 2001), which show variable overall efficacy data-to-data.
MRI is a common procedure for brain imaging, which is available in most medical institutions, private places, and commercial settings. The average MRI examination costs range from several hundred to thousand dollars in various institutes (Papanicolas et al., 2018), with average imaging time less than one hour (in case of DTI, ~15 minutes only), and the approximate wait period for examination vary from same day to four weeks. Compared to routine MRI procedures, DTI methods are sensitive to examine microstructural tissue changes (Le Bihan, 2003). Several indices, including mean diffusivity (MD), can be calculated using DTI data, and less than a minute is required for disease diagnosis using processed data with optimized ML models.
DTI, ML, and OSA diagnosis
Cross-validation of ML models with DTI-based MD data showed similar fitting with comparable accuracy for the RF and SVM models. Several types of neuroimaging data, including DTI, high-resolution T1-weighted, and functional MRI along with ML models have been used for assessment of disease diagnosis, disease progression, and treatment responses in several disease conditions, including mild cognitive impairment, Alzheimer’s disease, predictive response for cognitive behavioral therapy, brain tumors, and temporal lobe epilepsy. However, such MRI-based neuroimaging data has been used for the first time in OSA for disease screening/diagnosis prediction.
Although DTI requires special data acquisition protocols, assessment of artifacts in the obtained data for quality control, dedicated tools for data visualization, and subsequent mathematical analyses for DTI indices calculations. However, recently DTI data collection and data processing technologies have been improved significantly, and most of the clinical scanners now have access to multiple direction DTI acquisition protocol and analyses capabilities. DTI data collected for this study had 30 diffusion directions with scan time 7:33 min, but lower diffusion directions can also be used that will take ~3–6 min acquisition. Since clinical scanners are now equipped with generation of DTI maps, optimized ML algorithms can be implemented in the scanner for fast OSA screening.
Limitations
Several study limitations should be outlined, including limited inclusion of ML models for examining fitting to the data and small sample size for both the training and the validation data. We examined only two ML models, including the SVM and RF for DTI based neuroimaging data fitting, and more models should be tested for best fitting in the future. Also, statistical analyses, such as Kappa coefficient and Bland Altman analysis, were not performed to compare the ML models performance. A subset of subjects, which were not part of the cross-validation, were used for prediction here. However, OSA and control subjects from different sites/institutes should also have been used for OSA diagnosis prediction for generalizability. Another limitation of the study is that the healthy control subjects did not undergo overnight PSG studies. However, the potential for sleep apnea syndrome or sleep disturbances in healthy controls were assessed by interviewing control subjects and their sleep partners, if available, as well as with sleep symptoms questionnaires, including the ESS and the PSQI.
CONCLUSIONS
ML models performance between the RF and SVM demonstrated comparable model fit statistics of RF and SVM to the OSA and control data, and show that either ML model can be used as a screening tool for patients that have DTI data. The findings have important implications for developing a new, fast, less complicated, and widely-available OSA screening tool, which can help with early identification, and thus, early intervention for breathing conditions. Earlier diagnosis would in turn be of great benefit in restoring brain tissue changes and functions, which could improve the morbidity, mortality, and quality of life in OSA patients.
Statement of Significance.
In this manuscript, we demonstrate that obstructive sleep apnea (OSA) screening can be faster and less complicated by using brain diffusion tensor imaging data and machine learning. Such use of neuroimaging data and machine learning will allow for early OSA screening and intervention that can ultimately help restore brain tissue changes and functions, thereby reducing morbidity and mortality and improving quality of life in OSA patients.
ACKOWLEDGEMENTS:
Authors would like to thank Mrs. Karen A. Harada and Ms. Madeline Townsley for assistance with data collection.
Grant Support:
This research work was supported by National Institutes of Health R01 NR-015038 (RK, BR, ML, LE, and DK) and R21HD102544 (RK and BR). Dr. Vacas was supported by K23GM132795.
Footnotes
Conflict of Interest: All authors have no conflict of interest to disclose.
Data Availability Statement:
The data underlying this article will be shared on reasonable request to the corresponding author.
REFERENCES
- Asghari A, Mohammadi F, Kamrava SK, Jalessi M, & Farhadi M (2013). Evaluation of quality of life in patients with obstructive sleep apnea. Eur Arch Otorhinolaryngol, 270(3), 1131–1136. doi: 10.1007/s00405-012-2157-6 [DOI] [PubMed] [Google Scholar]
- Ashburner J, & Friston KJ (2005). Unified segmentation. Neuroimage, 26(3), 839–851. Retrieved from http://www.ncbi.nlm.nih.gov/entrez/query.fcgi?cmd=Retrieve&db=PubMed&dopt=Citation&list_uids=15955494 [DOI] [PubMed] [Google Scholar]
- Bennett JA, & Kinnear WJ (1999). Sleep on the cheap: the role of overnight oximetry in the diagnosis of sleep apnoea hypopnoea syndrome. Thorax, 54(11), 958–959. doi: 10.1136/thx.54.11.958 [DOI] [PMC free article] [PubMed] [Google Scholar]
- Bhatia M, & Singh Y (2019). CPAP Compliance in Obstructive Sleep Apnea. Sleep and Vigilance, 3(2), 113–118. doi: 10.1007/s41782-019-00070-8 [DOI] [Google Scholar]
- Breiman L (2001). Random Forests. Machine Learning, 45(1), 5–32. doi: 10.1023/a:1010933404324 [DOI] [Google Scholar]
- Bremner JD, Narayan M, Anderson ER, Staib LH, Miller HL, & Charney DS (2000). Hippocampal volume reduction in major depression. Am J Psychiatry, 157(1), 115–118. Retrieved from http://www.ncbi.nlm.nih.gov/pubmed/10618023 [DOI] [PubMed] [Google Scholar]
- Castronovo V, Scifo P, Castellano A, Aloia MS, Iadanza A, Marelli S, … Falini A (2014). White matter integrity in obstructive sleep apnea before and after treatment. Sleep, 37(9), 1465–1475. doi: 10.5665/sleep.3994 [DOI] [PMC free article] [PubMed] [Google Scholar]
- Chen H-L, Huang C-C, Lin H-C, Lu C-H, Chen P-C, Chou K-H, … Lin W-C (2020). White matter alteration and autonomic impairment in obstructive sleep apnea. J Clin Sleep Med, 16(2). [DOI] [PMC free article] [PubMed] [Google Scholar]
- Collop NA, Anderson WM, Boehlecke B, Claman D, Goldberg R, Gottlieb DJ, … Portable Monitoring Task Force of the American Academy of Sleep, M. (2007). Clinical guidelines for the use of unattended portable monitors in the diagnosis of obstructive sleep apnea in adult patients. Portable Monitoring Task Force of the American Academy of Sleep Medicine. J Clin Sleep Med, 3(7), 737–747. Retrieved from https://www.ncbi.nlm.nih.gov/pubmed/18198809 [PMC free article] [PubMed] [Google Scholar]
- Collop NA, Tracy SL, Kapur V, Mehra R, Kuhlmann D, Fleishman SA, & Ojile JM (2011). Obstructive sleep apnea devices for out-of-center (OOC) testing: technology evaluation. J Clin Sleep Med, 7(5), 531–548. doi: 10.5664/JCSM.1328 [DOI] [PMC free article] [PubMed] [Google Scholar]
- Del Campo F, Crespo A, Cerezo-Hernandez A, Gutierrez-Tobal GC, Hornero R, & Alvarez D (2018). Oximetry use in obstructive sleep apnea. Expert Rev Respir Med, 12(8), 665–681. doi: 10.1080/17476348.2018.1495563 [DOI] [PubMed] [Google Scholar]
- Engleman HM, Cheshire KE, Deary IJ, & Douglas NJ (1993). Daytime sleepiness, cognitive performance and mood after continuous positive airway pressure for the sleep apnoea/hypopnoea syndrome. Thorax, 48(9), 911–914. doi: 10.1136/thx.48.9.911 [DOI] [PMC free article] [PubMed] [Google Scholar]
- Flemons WW, Douglas NJ, Kuna ST, Rodenstein DO, & Wheatley J (2004). Access to diagnosis and treatment of patients with suspected sleep apnea. Am J Respir Crit Care Med, 169(6), 668–672. doi: 10.1164/rccm.200308-1124PP [DOI] [PubMed] [Google Scholar]
- Flemons WW, Littner MR, Rowley JA, Gay P, Anderson WM, Hudgel DW, … Loube DI (2003). Home diagnosis of sleep apnea: a systematic review of the literature. An evidence review cosponsored by the American Academy of Sleep Medicine, the American College of Chest Physicians, and the American Thoracic Society. Chest, 124(4), 1543–1579. doi: 10.1378/chest.124.4.1543 [DOI] [PubMed] [Google Scholar]
- Gami AS, Pressman G, Caples SM, Kanagala R, Gard JJ, Davison DE, … Somers VK (2004). Association of atrial fibrillation and obstructive sleep apnea. Circulation, 110(4), 364–367. doi: 10.1161/01.CIR.0000136587.68725.8E 01.CIR.0000136587.68725.8E [pii] [DOI] [PubMed] [Google Scholar]
- Grasso MG, Lubich S, Guidi L, Rinnenburger D, & Paolucci S (2000). Cerebellar deficit and respiratory impairment: a strong association in multiple sclerosis? Acta Neurol Scand, 101(2), 98–103. Retrieved from http://www.ncbi.nlm.nih.gov/pubmed/10685856 [DOI] [PubMed] [Google Scholar]
- Hang LW, Wang HL, Chen JH, Hsu JC, Lin HH, Chung WS, & Chen YF (2015). Validation of overnight oximetry to diagnose patients with moderate to severe obstructive sleep apnea. BMC Pulm Med, 15, 24. doi: 10.1186/s12890-015-0017-z [DOI] [PMC free article] [PubMed] [Google Scholar]
- Hu LS, Yoon H, Eschbacher JM, Baxter LC, Dueck AC, Nespodzany A, … Li J (2019). Accurate Patient-Specific Machine Learning Models of Glioblastoma Invasion Using Transfer Learning. AJNR Am J Neuroradiol, 40(3), 418–425. doi: 10.3174/ajnr.A5981 [DOI] [PMC free article] [PubMed] [Google Scholar]
- Kidwell CS, Alger JR, Di Salle F, Starkman S, Villablanca P, Bentson J, & Saver JL (1999). Diffusion MRI in patients with transient ischemic attacks. Stroke, 30(6), 1174–1180. doi: 10.1161/01.str.30.6.1174 [DOI] [PubMed] [Google Scholar]
- Kim H, Joo E, Suh S, Kim JH, Kim ST, & Hong SB (2016). Effects of long-term treatment on brain volume in patients with obstructive sleep apnea syndrome. Hum Brain Mapp, 37(1), 395–409. doi: 10.1002/hbm.23038 [DOI] [PMC free article] [PubMed] [Google Scholar]
- Kim HC, Young T, Matthews CG, Weber SM, Woodward AR, & Palta M (1997). Sleep-disordered breathing and neuropsychological deficits. A population-based study. Am J Respir Crit Care Med, 156(6), 1813–1819. doi: 10.1164/ajrccm.156.6.9610026 [DOI] [PubMed] [Google Scholar]
- Kim RD, Kapur VK, Redline-Bruch J, Rueschman M, Auckley DH, Benca RM, … Ramsey SD (2015). An Economic Evaluation of Home Versus Laboratory-Based Diagnosis of Obstructive Sleep Apnea. Sleep, 38(7), 1027–1037. doi: 10.5665/sleep.4804 [DOI] [PMC free article] [PubMed] [Google Scholar]
- Kumar R, Chavez AS, Macey PM, Woo MA, Yan-Go FL, & Harper RM (2012). Altered global and regional brain mean diffusivity in patients with obstructive sleep apnea. J Neurosci Res, 90(10), 2043–2052. doi: 10.1002/jnr.23083 [DOI] [PMC free article] [PubMed] [Google Scholar]
- Le Bihan D (2003). Looking into the functional architecture of the brain with diffusion MRI. Nat Rev Neurosci, 4(6), 469–480. doi: 10.1038/nrn1119 [DOI] [PubMed] [Google Scholar]
- Le Bihan D, Mangin JF, Poupon C, Clark CA, Pappata S, Molko N, & Chabriat H (2001). Diffusion tensor imaging: concepts and applications. J Magn Reson Imaging, 13(4), 534–546. doi: 10.1002/jmri.1076 [pii] [DOI] [PubMed] [Google Scholar]
- Lecouvet FE, Duprez TP, Raymackers JM, Peeters A, & Cosnard G (1999). Resolution of early diffusion-weighted and FLAIR MRI abnormalities in a patient with TIA. Neurology, 52(5), 1085–1087. doi: 10.1212/wnl.52.5.1085 [DOI] [PubMed] [Google Scholar]
- Lee W, Nagubadi S, Kryger MH, & Mokhlesi B (2008). Epidemiology of Obstructive Sleep Apnea: a Population-based Perspective. Expert Rev Respir Med, 2(3), 349–364. doi: 10.1586/17476348.2.3.349 [DOI] [PMC free article] [PubMed] [Google Scholar]
- Marshall NS, Wong KK, Liu PY, Cullen SR, Knuiman MW, & Grunstein RR (2008). Sleep apnea as an independent risk factor for all-cause mortality: the Busselton Health Study. Sleep, 31(8), 1079–1085. Retrieved from http://www.ncbi.nlm.nih.gov/pubmed/18714779 [PMC free article] [PubMed] [Google Scholar]
- Naegele B, Pepin JL, Levy P, Bonnet C, Pellat J, & Feuerstein C (1998). Cognitive executive dysfunction in patients with obstructive sleep apnea syndrome (OSAS) after CPAP treatment. Sleep, 21(4), 392–397. Retrieved from http://www.ncbi.nlm.nih.gov/entrez/query.fcgi?cmd=Retrieve&db=PubMed&dopt=Citation&list_uids=9646384 [DOI] [PubMed] [Google Scholar]
- Narkiewicz K, Kato M, Phillips BG, Pesek CA, Davison DE, & Somers VK (1999). Nocturnal continuous positive airway pressure decreases daytime sympathetic traffic in obstructive sleep apnea. Circulation, 100(23), 2332–2335. doi: 10.1161/01.cir.100.23.2332 [DOI] [PubMed] [Google Scholar]
- Nicolini P, Ciulla MM, Malfatto G, Abbate C, Mari D, Rossi PD, … Lombardi F (2014). Autonomic dysfunction in mild cognitive impairment: evidence from power spectral analysis of heart rate variability in a cross-sectional case-control study. PLoS One, 9(5), e96656. doi: 10.1371/journal.pone.0096656 [DOI] [PMC free article] [PubMed] [Google Scholar]
- O’Donoghue FJ, Wellard RM, Rochford PD, Dawson A, Barnes M, Ruehland WR, … Jackson GD (2012). Magnetic resonance spectroscopy and neurocognitive dysfunction in obstructive sleep apnea before and after CPAP treatment. Sleep, 35(1), 41–48. doi: 10.5665/sleep.1582 [DOI] [PMC free article] [PubMed] [Google Scholar]
- Oppenheimer SM, Kedem G, & Martin WM (1996). Left-insular cortex lesions perturb cardiac autonomic tone in humans. Clin Auton Res, 6(3), 131–140. Retrieved from http://www.ncbi.nlm.nih.gov/pubmed/8832121 [DOI] [PubMed] [Google Scholar]
- Papanicolas I, Woskie LR, & Jha AK (2018). Health Care Spending in the United States and Other High-Income Countries. JAMA, 319(10), 1024–1039. doi: 10.1001/jama.2018.1150 [DOI] [PubMed] [Google Scholar]
- Peppard PE, Young T, Palta M, & Skatrud J (2000). Prospective study of the association between sleep-disordered breathing and hypertension. N Engl J Med, 342(19), 1378–1384. doi:MJBA-421901 [pii] 10.1056/NEJM200005113421901 [DOI] [PubMed] [Google Scholar]
- Pierpaoli C, Jezzard P, Basser PJ, Barnett A, & Di Chiro G (1996). Diffusion tensor MR imaging of the human brain. Radiology, 201(3), 637–648. Retrieved from http://www.ncbi.nlm.nih.gov/pubmed/8939209 [DOI] [PubMed] [Google Scholar]
- Rachmadi MF, Valdes-Hernandez MDC, Li H, Guerrero R, Meijboom R, Wiseman S, … Komura T (2020). Limited One-time Sampling Irregularity Map (LOTS-IM) for Automatic Unsupervised Assessment of White Matter Hyperintensities and Multiple Sclerosis Lesions in Structural Brain Magnetic Resonance Images. Comput Med Imaging Graph, 79, 101685. doi: 10.1016/j.compmedimag.2019.101685 [DOI] [PubMed] [Google Scholar]
- Schnyer DM, Clasen PC, Gonzalez C, & Beevers CG (2017). Evaluating the diagnostic utility of applying a machine learning algorithm to diffusion tensor MRI measures in individuals with major depressive disorder. Psychiatry Res Neuroimaging, 264, 1–9. doi: 10.1016/j.pscychresns.2017.03.003 [DOI] [PMC free article] [PubMed] [Google Scholar]
- Scholkopf B, & Smola AJ (2001). Learning with Kernels: Support Vector Machines, Regularization, Optimization, and Beyond: MIT Press. [Google Scholar]
- Singh M, Liao P, Kobah S, Wijeysundera DN, Shapiro C, & Chung F (2013). Proportion of surgical patients with undiagnosed obstructive sleep apnoea. Br J Anaesth, 110(4), 629–636. doi: 10.1093/bja/aes465 [DOI] [PubMed] [Google Scholar]
- Tonon C, Vetrugno R, Lodi R, Gallassi R, Provini F, Iotti S, … Barbiroli B (2007). Proton magnetic resonance spectroscopy study of brain metabolism in obstructive sleep apnoea syndrome before and after continuous positive airway pressure treatment. Sleep, 30(3), 305–311. Retrieved from http://www.ncbi.nlm.nih.gov/entrez/query.fcgi?cmd=Retrieve&db=PubMed&dopt=Citation&list_uids=17425226 [DOI] [PubMed] [Google Scholar]
- Tummala S, Roy B, Park B, Kang DW, Woo MA, Harper RM, & Kumar R (2016). Associations between brain white matter integrity and disease severity in obstructive sleep apnea. J Neurosci Res, 94(10), 915–923. doi: 10.1002/jnr.23788 [DOI] [PMC free article] [PubMed] [Google Scholar]
- Tummala S, Roy B, Vig R, Park B, Kang DW, Woo MA, … Kumar R (2017). Non-Gaussian Diffusion Imaging Shows Brain Myelin and Axonal Changes in Obstructive Sleep Apnea. J Comput Assist Tomogr, 41(2), 181–189. doi: 10.1097/RCT.0000000000000537 [DOI] [PMC free article] [PubMed] [Google Scholar]
- Vieira S, Pinaya WH, & Mechelli A (2017). Using deep learning to investigate the neuroimaging correlates of psychiatric and neurological disorders: Methods and applications. Neurosci Biobehav Rev, 74(Pt A), 58–75. doi: 10.1016/j.neubiorev.2017.01.002 [DOI] [PubMed] [Google Scholar]
- Wolkove N, Baltzan M, Kamel H, Dabrusin R, & Palayew M (2008). Long-term compliance with continuous positive airway pressure in patients with obstructive sleep apnea. Can Respir J, 15(7), 365–369. doi: 10.1155/2008/534372 [DOI] [PMC free article] [PubMed] [Google Scholar]
- Xiong Y, Zhou XJ, Nisi RA, Martin KR, Karaman MM, Cai K, & Weaver TE (2017). Brain white matter changes in CPAP-treated obstructive sleep apnea patients with residual sleepiness. J Magn Reson Imaging, 45(5), 1371–1378. doi: 10.1002/jmri.25463 [DOI] [PMC free article] [PubMed] [Google Scholar]
- Yadav SK, Kumar R, Macey PM, Woo MA, Yan-Go FL, & Harper RM (2014). Insular cortex metabolite changes in obstructive sleep apnea. Sleep, 37(5), 951–958. doi: 10.5665/sleep.3668 [DOI] [PMC free article] [PubMed] [Google Scholar]
- Yaouhi K, Bertran F, Clochon P, Mezenge F, Denise P, Foret J, … Desgranges B (2009). A combined neuropsychological and brain imaging study of obstructive sleep apnea. J Sleep Res, 18(1), 36–48. doi:JSR705 [pii] 10.1111/j.1365-2869.2008.00705.x [DOI] [PubMed] [Google Scholar]
- Zhang B, Zhu DM, Zhao W, Zhang Y, Yang Y, Zhang C, … Yu Y (2019). Selective microstructural integrity impairments of the anterior corpus callosum are associated with cognitive deficits in obstructive sleep apnea. Brain Behav, 9(12), e01482. doi: 10.1002/brb3.1482 [DOI] [PMC free article] [PubMed] [Google Scholar]
- Zhu G, Jiang B, Tong L, Xie Y, Zaharchuk G, & Wintermark M (2019). Applications of Deep Learning to Neuro-Imaging Techniques. Front Neurol, 10, 869. doi: 10.3389/fneur.2019.00869 [DOI] [PMC free article] [PubMed] [Google Scholar]
Associated Data
This section collects any data citations, data availability statements, or supplementary materials included in this article.
Data Availability Statement
The data underlying this article will be shared on reasonable request to the corresponding author.