

Abstract
Background:
Juvenile-Onset Huntington’s Disease (JOHD) is a rare form of Huntington’s Disease (HD) characterized by symptom onset before the age of 21 years. Observational data in this cohort is lacking.
Objectives:
Quantify measures of disease progression for use in clinical trials of patients with JOHD.
Methods:
Participants who received a motor diagnosis of HD before the age of 21 were included in the Kids-JOHD study. The comparator group consisted of children and young adults who were at-risk for inheriting the genetic mutation that causes HD, but who were found to have a CAG repeat in the non-expanded range (Gene Non-Expanded [GNE]).
Results:
Data were obtained between March 17th, 2006, and February 13th, 2020. There were 26 JOHD participants and 78 GNE participants who were comparable on age (16.03 vs 14.43, respectively) and sex (53.8% female vs 57.7% female, respectively). The mean annualized decrease in striatal volume in the JOHD group was −3·99% compared to −0·06% in the GNE (Mean Difference [MD] = −3·93%, 95% CI [−4·98 – −2·80], FDR<0·0001). The mean increase in the Unified Huntington’s Disease Rating Scale Total Motor Score per year in the JOHD group was 7·29 points compared to a mean decrease of −0·21 point in the GNE (MD = 7·5, 95% CI [5·71 – 9·28], FDR<0·0001).
Conclusions:
These findings demonstrate that structural brain imaging and clinical measures in JOHD may be potential biomarkers of disease progression for use in clinical trials. Collaborative efforts are required to validate these results in a larger cohort of patients with JOHD.
Keywords: Juvenile-Onset Huntington Disease, neuroimaging, longitudinal, prospective
Graphical Abstract
Patients with Juvenile-Onset Huntington’s Disease (JOHD) experience rapid neurodegeneration over time that contributes to clinical progression of motor and cognitive symptoms. These longitudinal findings in JOHD may provide the framework for future clinical trials in this rare group of patients.
INTRODUCTION
Huntington’s disease (HD) is a genetic neurodegenerative disorder caused by an abnormal expansion of a trinucleotide CAG repeat region of the huntingtin gene (HTT).1 Typically, patients do not present with symptoms until the age of 40 or older2 and are referred to as adult-onset HD (AOHD).3 A smaller percentage of patients with HD receive a motor diagnosis prior to the age of 21, which is referred to as Juvenile-Onset HD (JOHD).4 Although patients with JOHD have the same core triad of cognitive, behavior, and motor symptoms, there are unique clinical characteristics that are distinct from AOHD.5 Specifically, patients with JOHD have less chorea and present with prominent rigidity and bradykinesia.5
Observational studies of patients with AOHD have provided the framework for the design and implementation of clinical trials in AOHD.6-8 Unfortunately, the same cannot be said for patients with JOHD.9 Cross-sectional analyses have demonstrated that patients with JOHD have significant neurodegeneration in cortical and subcortical brain regions shortly after receiving a diagnosis of JOHD.10, 11 However, quantifying clear measures of longitudinal disease progression in JOHD is an imperative step in the planning and conduct of clinical trials in this population. This study aimed to evaluate longitudinal clinical and neuroimaging changes in a relatively large cohort of JOHD patients. First, clinical and biological measures were compared between patients with JOHD and the GNE group at baseline and longitudinally. Second, the relationship between brain imaging measures and clinical measures was evaluated. Finally, we compared the longitudinal rate of change of key clinical and imaging measures over time between patients with JOHD and those with motor-manifest AOHD taken from the PREDICT-HD study.
METHODS
JOHD Sample Description
The Kids-JOHD study is the only prospective, longitudinal, observational, neuroimaging study evaluating patients with JOHD. This study enrolled participants between the ages of 5-26 who had a confirmed and documented diagnosis of JOHD (significant motor symptoms present as defined by a clinician prior to the age of 21 years old and genetic confirmation of CAG expansion). Subjects were recruited from across the United States to the University of Iowa. Recruitment efforts were supported via partnerships with multiple patient advocacy groups, including Help4HD International, WeHaveaFace, Huntington’s Disease Youth Organization (HDYO), and the Huntington’s Disease Society of America (HDSA). Exclusion criteria included a history of brain surgery or major head trauma. JOHD subjects participated between August 28th, 2012 and February 13th, 2020. Participants were assessed at baseline and returned for annual assessments, if possible. The comparator group consisted of a unique sample from the Kid-HD study12, which was conducted in parallel to the Kids-JOHD study at the University of Iowa. The Kids-HD study recruited children age 5-26 years who had a parent (or grandparent) with HD and were at risk for HD. Participants underwent genetic testing for research purposes only to determine if they had an expanded CAG repeat length using DNA from blood or saliva. Genetic testing was done in a double-blinded manner, meaning results were not disclosed to participants or their family members, and all study personnel with direct contact with study participants were blinded to their genetic status. Much like a double-blind clinical trial where randomization tables are maintained by a single entity, the genetic results were sent to a single member of the research team who did not interact with participants or their family members at any time. This research team member deidentified all clinical assessments and genetic results in preparation for deidentified data processing and analysis. The results remained completely anonymized. All participants and guardians (if under 18) signed informed consent prior to study enrollment, which was approved by the Institutional Review Board (IRB). Further details regarding the safety and ethics of this pipeline have been described previously.13 For comparison purposes, only Kids-HD participants who were gene-non-expanded (GNE) were included (CAG repeat <36). For every JOHD participant, we identified three GNE participants with comparable sex and baseline ages using nearest neighbor methods. Participants from the Kids-HD study were assessed between March 17th, 2006 and January 19th, 2018.
The Kids-JOHD study enrolled participants who had previously undergone genetic testing for clinical purposes as these participants were already manifesting clinical symptoms of disease. Therefore, they and their family members were aware of their genetic status and had received genetic counseling independent of their participation in the Kids-JOHD study.
Clinical Outcome Measures
Global motor function was assessed using the Unified Huntington’s Disease Rating Scale (UHDRS) Total Motor Score (TMS).14 In order to evaluate the unique clinical features of JOHD, we calculated a hypokinesia score. The hypokinesia score was the sum of the bradykinesia, rigidity, and dystonia subscales from the UHDRS. Lastly, we assessed the JOHD-TMS motor scale that has been previously described.15 This modified motor scale contains four items aimed to better assess the unique motor features of JOHD and includes a Global Chorea score, a repetitive hand-tapping task, the time required to drink 120 mL of water, and a maximal tremor score. To assess function, we utilized the JOHD Functional Assessment (FA) score).16
Cognitive Measures
Cognition was measured using the Wechsler Intelligence Scale for Children (for participants aged 5-16 years old)17 or the Wechsler Adult Intelligence Scale (for participants aged ≥ 17 years).18 The scales include the general ability index (GAI), processing speed index (PSI), perceptual reasoning index (PRI), and the verbal comprehension index (VCI).
Imaging
Magnetic Resonance Imaging (MRI) scans were collected on a research-dedicated 3T scanner. Importantly, clinical assessments were performed at each study visit; however, neuroimaging studies may not have been performed at each visit if the participant opted out of the MRI scan or was unable to tolerate the scan. Anatomical T1-weighted images were acquired and processed using the BRAINSAutoworkup19 framework, which produces robust, accurate labelling of cortical and subcortical brain regions derived from the Desikan-Killiany atlas.20 Further information is available in the Supplemental Material.
AOHD Sample Description
We used the PREDICT-HD database8 to compare longitudinal changes of motor and imaging measures between the JOHD group and a group of patients with AOHD. Subject selection was aimed at identifying an AOHD sample that was comparable to the JOHD sample in length of time since receiving a motor diagnosis of HD. During the PREDICT-HD study, nearly 250 participants received a motor diagnosis of HD. Of those, we identified participants who had longitudinal neuroimaging data available at least two years after their initial motor diagnosis and a CAG repeat length of at least 40. The identified PREDICT-HD participants were compared to the JOHD participants who had longitudinal clinical and neuroimaging data available.
Statistical Analysis
Due to lack of previous data and the rarity of the disease, the JOHD sample size could not be based on statistical power estimates for hypothesized effect sizes. We considered the resultant analyses exploratory and assessed the multiple statistical comparisons by false discovery rate (FDR).21
First, we performed a baseline cross-sectional analysis to compare the first available clinical measures and brain volumes between the GNE and JOHD groups using Analysis of Covariance (ANCOVA) models that controlled for age and sex. Baseline brain volumes were presented as the percentage of the baseline intracranial volume (ICV). We then compared the difference in the trajectory of clinical variables between the JOHD and GNE groups using linear mixed effects regression (LMER) models. The models included age and sex as covariates, as well as random slopes and intercepts for each participant. For all clinical analyses, we report the coefficient of the interaction term between time (years) on study and group.
Next, we constructed LMER models to compare the percent change of brain volumes from baseline over time between the JOHD and GNE groups. The unadjusted brain volumes were used to calculate the percent change from the volume at the first-available scan. The models included age, sex, and scanner as covariates and a random slope for each participant.
For these primary analyses, we included only participants with more than one clinical assessment or neuroimaging study (percent volume loss is only meaningful with repeated brain scans). To ensure that we were not inducing a selection bias by excluding participants lacking longitudinal data, we compared these results to group-by-follow-up time interactions in models of longitudinal brain volumes (rather than volume loss) as percent of ICV. These models also include baseline data from all participants, including those with only a baseline.
Our secondary analyses investigated the relationship between the structural brain atrophy observed in the JOHD group with the clinical outcome measures. LMER models included CAG, age, the interaction between age and CAG, and sex as predictors in the models with a random intercept for each participant. The ICV-corrected brain volumes were utilized for the secondary structure-function analyses.
Comparison of JOHD to AOHD
In parallel with the JOHD vs GNE longitudinal analysis, we constructed LMER models to compare the annualized percent change from baseline of the striatum, thalamus, and globus pallidus between patients with JOHD and those with AOHD from the PREDICT-HD study. Again, we included only participants with more than one neuroimaging assessment. The LMER models assessing longitudinal changes in brain volumes between groups included baseline age, sex, CAG repeat length, and the interaction between CAG and baseline age. These models included a random slope for each participant.
Similar models that included the same participants as above (participants with more than one clinical and neuroimaging assessment) were then constructed to compare the absolute change in the TMS and hypokinesia scores between the JOHD and AOHD groups. The same covariates as above were included in these models, except a random slope and intercept were included for each participant in the models assessing changes in clinical outcomes.
Comparisons of baseline demographics between groups were assessed by t-test. For all other analyses, we accounted for multiple comparisons using the false discovery rate (FDR) correction.21 We highlight findings with an estimated false discovery rate (q) of 5% or less. All analyses were performed in RStudio version 1·3·159.
Data Sharing
Deidentified participant data, processed brain volumes, and clinical assessments will be made available upon reasonable request. Requests may be made to the corresponding author and approval from the sponsoring institution (University of Iowa) is required.
RESULTS
Participants
There were 26 participants with JOHD who provided 61 observations and 78 GNE participants who provided 149 observations. Longitudinal data was available from 18 JOHD participants and 42 GNE controls (Figure S1). At baseline, there were no significant group differences in age and sex (including all participants) (Table 1). A significantly higher percentage of JOHD participants reported a seizure disorder (42.31%) compared to the GNE group (1.28%). The maximum follow-up time in the JOHD group was 4·08 years compared to 6·17 years in the GNE group. The mean duration of disease at baseline for the JOHD participants was 3.51 years. The AOHD participants from the PREDICT-HD study had a mean disease duration at baseline of 2.76 years.
Table 1:
Baseline Demographics
| JOHD | GNE | P-value | |
|---|---|---|---|
| N (Visits) | 26 (61) | 78 (149) | |
| Age (yrs), mean ± S.D. [range] | 16.03 ± 6.14 [5.08 – 25.3] | 14.43 ± 3.19 [6.08 – 22.4] | 0.0900 |
| % Female, n (%) | 14 (53.8) | 45 (57.70) | 0.9090 |
| Race, n (%) | 0.4440 | ||
| White | 20 (76.9) | 67 (85.9) | |
| Other | 6 (23.1) | 9 (14.1) | |
| CAG, mean ± S.D. [range] | 72.31 ± 14.52 [54 – 102] | 20.58 ± 4.31 [15 – 34] | <0.0001 |
| Disease Duration, mean ± S.D. [range] | 3.51 ± 3.02 [0 – 11] | N/A | N/A |
| Seizure Disorder, n (%) | 11 (42.31) | 1 (1.28) | <0.0001 |
CAG: Cytosine-Adenine-Guanine repeats in the huntingtin gene; Disease Duration: Participant’s age at study visit minus participant’s age at time of motor diagnosis (based on clinical documentation by a neurologist); GNE: Gene-non-expanded; JOHD: Juvenile-Onset Huntington’s Disease; N: Number of participants; S.D.: Standard Deviation
Baseline Group Comparisons
Figure 1A-H shows the baseline group comparison of the clinical measures with the expected elevations of the motor scores (higher being worse) and lower functional scores (lower being worse) in the JOHD group. Additionally, the JOHD group’s mean FA Score, GAI, PSI, PRI, and VCI scores were significantly lower compared to the GNE group, indicating functional and cognitive impairment. Figure 1I-P illustrates the brain imaging findings in the participants who completed at least one neuroimaging study (NJOHD = 23 [88·5%], NGNE = 72 [94·7%]). Panel I demonstrates a lower ICV, supporting the notion that there may be a global neurodevelopmental aspect of JOHD as ICV is determined by maximal brain growth.22 It also highlights the relevance of controlling for ICV when evaluating the remaining measures. After controlling for ICV, the JOHD group had lower volumes of whole brain, cerebral gray, and cerebral white matter compared to the GNE group (Figure 1J-L). The only brain structure that was not smaller among the JOHD cohort was the cerebellum, which was larger at baseline compared to the GNE group, although the results did not reach the prespecified FDR rate of <5% (Figure 1M; Table S1).
Figure 1. Baseline Differences in Clinical and Neuroimaging Measures Between Groups.

The gray and red circles represent the raw data points for the GNE and JOHD groups, respectively. The black circles represent the group means and the black lines represent the 95% confidence intervals of the mean. Panels A-C represent the motor assessments of A) TMS, B) Hypokinesia Score, and C) JHD-TMS score. Panel D shows the Functional Assessment Scale between groups. Panels E-H represent the cognitive measures from the Wechsler Scale. For panels A-H, data were available for 26 participants with JOHD and 78 participants in the GNE group. Panels I-P show baseline brain volumes between groups. For the baseline neuroimaging results, there were data available for 23 participants in the JOHD group and 72 participants in the GNE group.
FA: Functional Assessment; GAI: General Ability Index; Glob. Pall.: Globus Pallidus; GM: Gray Matter; GNE: Gene-Non-Expanded.; Hypo: Hypokinesia Score; ICV: Intracranial Volume; JHD TMS: Juvenile HD Motor Scale; JOHD: Juvenile-Onset Huntington Disease; PRI: Perceptual Reasoning Index; PSI: Processing Speed Index; TMS: Total Motor Score; VCI: Verbal Comprehension Index; WM: White Matter
Longitudinal Change Comparison
There were 18 patients (69·2%) in the JOHD group who had more than one clinical observation available compared to 42 of 78 (55·3%) participants in the GNE group (Table S2). The two groups were comparable in sex distribution. The JOHD group was, on average, 1.3 years older than the GNE group at baseline – a difference that reached nominal statistical significance by t-test (Table S2). However, there was substantial overlap in these age ranges and all group comparisons were adjusted for age. Patients in the JOHD group exhibited significant worsening of all clinical measures compared to the GNE group (Figure 2 & Table 2). Specifically, the JOHD group experienced a mean annualized increase in TMS of 7·29 points compared to a decrease of −0·21 points in the GNE group (Mean Difference [MD] = 7·50, 95% CI [5·71 – 9·28], q<0·0001; Figure 2A). The mean annualized increase in the hypokinesia score was 2·41 points in the JOHD group compared to 0·00 in the GNE group (MD = 2·41, 95% CI [1·71 – 3·12], q<0·0001; Figure 2B). The JOHD participants also had a mean annualized decrease in the PSI of −4·81 points compared to a mean increase of 1·33 points per year in the GNE group (MD = −6·14, 95% CI [−8·27 – −3·90], q<0·0001; Figure 2F).
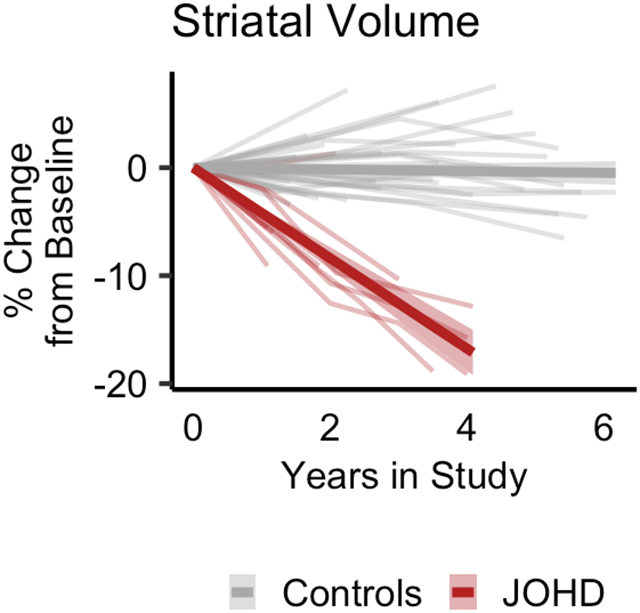
Figure 2. Longitudinal Changes in Clinical and Neuroimaging Measures Between Groups.

Longitudinal clinical data was available for 18 patients with JOHD and 42 participants in the GNE group. Patients with JOHD had a faster rate of worsening in regards to motor (A-C), functional (D), and cognitive (E-H) outcomes compared to the GNE group.
Longitudinal neuroimaging data were available for 11 patients with JOHD and 35 participants in the GNE group. Patients with JOHD had faster annualized percent decreases in the volume of the whole brain (I), and cerebral GM (J) compared to the GNE group. The JOHD participants seemed to have slower developmental increases in cerebral WM (K) compared to the GNE group. The trajectory of change in the percent volume change of the cerebellum did not differ between groups (L). The JOHD group experienced longitudinal atrophy in the striatum (M) and thalamus (N) compared to the GNE group. The annualized percent change over time in volume of the globus pallidus (O) did not differ between groups.
The thin gray and red lines are the raw, connected data points for each individual participant. The bold gray and red lines represent the predicted fit of the raw values from a linear model and the accompanying shaded areas represent the predicted 95% confidence interval.
FA: Functional Assessment; GAI: General Ability Index; Glob. Pall.: Globus Pallidus; GM: Gray Matter; GNE: Gene-Non-Expanded; Hypo: Hypokinesia Score; ICV: Intracranial Volume
JHD TMS: Juvenile HD Motor Scale; JOHD: Juvenile-Onset Huntington Disease; PRI: Perceptual Reasoning Index; PSI: Processing Speed Index; TMS: Total Motor Score; VCI: Verbal Comprehension Index; WM: White Matter
Table 2:
Longitudinal Changes of Clinical and Neuroimaging Outcome Measures
| Mean Annualized Change in JOHD Group |
Mean Annualize Change in GNE Group |
Mean Difference (JOHD – GNE) |
95% Confidence Interval |
t-value | q | ||
|---|---|---|---|---|---|---|---|
| Clinical | TMS | 7.29 | −0.21 | 7.50 | 5.71 – 9.28 | 8.28 | <0.0001 |
| Hypokinesis | 2.41 | 0.00 | 2.41 | 1.71 – 3.12 | 6.76 | <0.0001 | |
| JHD TMS | 2.23 | 0.09 | 2.14 | 1.01 – 3.26 | 3.80 | 0.0040 | |
| FA Score | −1.28 | −0.21 | −1.07 | −1.70 – −0.44 | −3.38 | 0.0023 | |
| GAI | −4.73 | 0.12 | −4.85 | −7.42 – −2.28 | −3.73 | 0.0009 | |
| PSI | −4.81 | 1.33 | −6.14 | −8.37 – −3.90 | −5.43 | <0.0001 | |
| PRI | −4.72 | 0.57 | −4.72 | −7.46 – −1.99 | −3.41 | 0.0021 | |
| VCI | −3.45 | 0.08 | −3.53 | −5.85 – −1.20 | 3.00 | 0.0047 | |
| Neuroimaging | Whole Brain | −1.34 | 0.06 | −1.39 | −1.84 – −0.94 | −6.12 | <0.0001 |
| Cerebral GM | −2.54 | −0.58 | −1.96 | −2.60 – −1.32 | −6.06 | <0.0001 | |
| Cerebral WM | 0.23 | 0.92 | −0.69 | −1.26 – −0.12 | −2.41 | 0.0252 | |
| Cerebellum | 0.38 | 0.45 | −0.06 | −0.75 – 0.63 | −0.19 | 0.8530 | |
| Striatum | −3.99 | −0.06 | −3.93 | −4.98 – −2.90 | −7.50 | <0.0001 | |
| Caudate | −3.73 | 0.34 | 4.07 | −5.83 – −2.32 | −4.60 | <0.0001 | |
| Putamen | −4.03 | −0.32 | −3.71 | −4.70 – −2.72 | −7.43 | <0.0001 | |
| Thalamus | −8.66 | 0.21 | −8.86 | −10.50 – −7.22 | −10.60 | <0.0001 | |
| Globus Pallidus | −0.01 | −0.00 | −0.01 | −0.03 – 0.00 | −1.76 | 0.0955 |
FA: Functional Assessment
GAI: General Ability Index
GM: Gray Matter
GNE: Gene-Non-Expanded Group
JHD TMS: Juvenile HD Motor Scale
JOHD: Juvenile-Onset Huntington Disease
PRI: Perceptual Reasoning Index
PSI: Processing Speed Index
VCI: Verbal Comprehension Index
WM: White Matter
The proportion of participants with longitudinal MRI data was comparable in the JOHD and GNE groups. Of the 23 patients in the JOHD group who had at least one neuroimaging study completed, 11 patients (47.8%) had longitudinal neuroimaging data available. Comparatively, of the 72 GNE participants who had at least one neuroimaging study completed, 35 (48.6%) completed more than one MRI. The baseline demographics of the participants with available longitudinal neuroimaging data are presented in Table S3. Here, the two groups were comparable in age and sex distribution at baseline. Whole brain volume decreased at an annual rate of −1·34% in the JOHD group compared to an increase of 0·06% in the GNE group (MD = −1·39, 95% CI [−1·584 – −0·94], q <0·0001; Figure 2I). Cerebral gray matter volume declined at a rate of −2·54% per year in the JOHD group compared to −0·58% per year in the GNE group (MD = −1·96, 95% CI [−2·60 – −1·32], q<0·0001; Figure 2J). Interestingly, the cerebral white matter volume increased as part of the normal neurodevelopmental process in the GNE group, increasing by 0·92% per year; however, the cerebral white matter volume for the JOHD participants only increased by 0·23% per year, on average (MD = −0·69, 95% CI [−1·26 – −0·12], q=0·0274; Figure 2K). Cerebellar volume was elevated in the JOHD group compared to the GNE group at baseline, but both groups exhibited nearly identical rates of growth over time (Figure 2L).
The mean decrease in striatal volume per year in the JOHD group was −3·99% compared to −0·06% in the GNE group (MD = −3·94%, 95% CI [−4·98 – −2·90], q<0·0001; Figure 2M). Striatal volume was the sum of the caudate and putamen volumes. The mean annualized change of caudate volume in the JOHD group was −3.73% compared to 0.34% in the GNE group (MD = −4.07%, 95% CI [−5.83 – −2.32], q<0.0001). The mean annualized change of putamen volume in the JOHD group was −3.71% compared to −0.32% in the GNE group (MD = −3.71%, 95% CI [−4.70 – −2.72], q<0.0001). The volume of the thalamus showed the most dramatic rate of decline of all brain structures that were evaluated. Specifically, the JOHD group experienced a mean annual decrease in thalamic volume of −8·66% compared to a 0·21% annualized increase in the GNE group (MD = −8·86%, 95% CI [−10·50 – −7·22], q<0·0001; Figure 2N). Lastly, there was not a significant mean difference in the annualized rate of change of the globus pallidus volume between groups (MD = −0·01%, 95% CI [−0·03 – 0·00], q=0·0991; Figure 2O). Details of the longitudinal analyses are outlined in Table 2.
To guard against potential follow-up bias, we re-evaluated the absolute changes in clinical and neuroimaging outcome measures while including participants with only one visit, as well as those with longitudinal data available. Again, participants in the JOHD group had significant worsening of all clinical symptoms over time compared to the GNE group (Figure S2 and Table S4). The imaging results were also similar to the primary results in terms of which brain regions showed significant group differences when evaluating the ICV-correct absolute brain volumes (Figure S3 and Table S5).
Finally, the distribution of longitudinal neuroimaging assessments was similar across age and CAG repeat length. Specifically, of the 11 participants with JOHD who had longitudinal neuroimaging assessments completed, six (55%) had a CAG repeat less than 70 and five (45%) had a CAG repeat equal to or above 70 (Table S6). Of the 18 participants with JOHD who had longitudinal clinical assessments, 10 (55.6%) had a CAG of 70 or above compared to 8 (44.4%) who had a CAG less than 70 (Table S7). The distribution by age and CAG of all participants with at least one MRI are shown in Figure S4. Although the sample size is too small to investigate a CAG repeat effect in the analysis, this figure shows descriptively that change over time slopes do not seem to vary greatly as a function of CAG repeat. CAG repeat length did not significantly predict which patients with JOHD had longitudinal data available (Supplemental Material).
Structure–Function Relationships
The whole brain volume among patients with JOHD was positively associated with FA Score (t=3.28, q=0.016), GAI (t=2.66, q=0.039), and PSI (t=2.84, q=0.029), indicating smaller volume is related to worsening functional and cognitive outcomes. The cerebral gray matter volume was also positively related to FA score (t=3.23, q=0.016). Notable relationships were seen between the volume of the striatum and TMS (t=−2.85, q=0.03) and hypokinesia scores (t=−4.47, q=0.002), with lower striatal volumes being associated with higher (worse) motor scores. In contrast to the hypokinesia score, the correlation between the JOHD-TMS score and striatal volume (t=−2.39, q=0.062), or any other brain regions, did not reach the pre-specified FDR threshold. There were positive relationships between thalamic volume and FA score (t=3.33, q=0.016), plus all cognitive measures that were assessed. While the striatum was associated with PSI, the results of the structure-function analysis seem to broadly indicate that striatal volume was associated with motor function in JOHD while the thalamus was mostly associated with cognitive and functional assessments (Figure 3).
Figure 3. Structure-Function Relationships Between Clinical Measure and Brain Volumes.

A) This grid helps to visualize the relationships between brain measures (vertical axis) and clinical measures (horizontal axis). Red indicates a positive relationship and blue is indicative of a negative relationship. The values in each box are the associated FDR-corrected p-values (q) from the models.
B) Figures 3B-D are presented to show selected individualized associations with raw values. The solid black lines represent the predicted fit of the raw values from a linear model. The gray area represents the predicted 95% confidence interval of a linear model.
FA: Functional Assessment; GAI: General Ability Index; ICV: Intracranial Volume; JOHD TMS: Juvenile HD Motor Scale; PRI: Perceptual Reasoning Index; PSI: Processing Speed Index; VCI: Verbal Comprehension Index
Comparison of Longitudinal Change Between AOHD and JOHD Subjects
The baseline demographics of the AOHD group compared to the JOHD group are presented in Table S8. Specifically, Table S8 reports demographic data on only those participants with available longitudinal clinical and neuroimaging data. The JOHD group experienced significantly faster rates of neurodegeneration of the striatum and thalamus compared to the AOHD group. There were no notable differences in the rate of degeneration of the globus pallidus between groups. However, the JOHD group also demonstrated significantly faster rates of worsening of the TMS score and hypokinesia score relative to the AOHD group (Figure S5 and Table S9).
DISCUSSION
This is the first prospective, longitudinal, neuroimaging study in subjects with JOHD. Patients with JOHD had substantial motor, functional, and cognitive deficits at baseline despite being relatively early in their disease course. These patients also had clear brain atrophy, especially in the striatum. The longitudinal analyses showed clear and convincing evidence that ongoing changes in clinical, cognitive, and imaging measures were quantifiable and substantial. The most rapid rates of change were observed in the volumes of the striatum and thalamus, as well as the cognitive measure of processing speed. These measures may, therefore, be used to track disease progression and may have potential use as biomarkers for future clinical trials.
Our study outlines clinical markers of progression that may be used in patients with JOHD. For motor scores in particular, the development of a scale that is specific to the unique symptoms seen in JOHD has been challenging. In initial studies of the JHD-TMS scale15, the measurements displayed poor overall fit with predicted models. Similarly, in the current study, this scale did demonstrate significant progression over time, but it was not as strongly associated with striatal volume as were the TMS and the derived hypokinesia score. Both of these measures demonstrated significant progression over time and were associated with striatal volume, suggesting that these may be superior tools for tracking disease progression relative to the JHD-TMS scale.15 Additionally, we demonstrated that cognitive function declines over time in patients with JOHD compared to the GNE group. The results provide preliminary evidence that the development of a composite score, similar to the composite UHDRS6, that incorporates motor and cognitive measures, may decrease variability and provide a more optimal measure of disease progression for JOHD in the future.
Numerous studies have investigated the longitudinal trajectory of change of brain volumes in patients with AOHD. Specifically, the TRACK-HD study found that patients with manifest HD experienced an annual decrease in the volume of the caudate of about 3% and approximately 4% decrease per year in the putamen.7 In the present study, we compared the annualized decrease in striatal volume between patients with JOHD and a cohort of motor-manifest patients with AOHD from the PREDICT-HD study. The JOHD group had a significantly faster rate of neurodegeneration compared to the AOHD group. There also appeared to be less variability in the rate of change of striatal volume in the JOHD group compared to the AOHD group (Figure S5). One explanation for the increased variability in the AOHD group may be that these data were collected from a multi-site study, compared to the current single-site study. Another possible factor to consider is that the JOHD group may be experiencing both brain development and neurodegeneration simultaneously. Measures, such as the cerebellum volume, suggest that some brain regions may indeed be developing similar to controls; however, the low variance in the slope of decline of the striatum and thalamus suggest that neurodegeneration is the primary process occurring in those regions. Our results are in-line with and expand upon previous findings. First, a previous retrospective study of patients with JOHD showed that progression of motor symptoms was faster in the JOHD group as compared to patients with AOHD.23 Additionally, it has been shown that the rate of striatal atrophy increases with higher CAG repeat length.24 However, this was only shown for CAG repeats of up to 50. The present study provides preliminary evidence that the rate of neurodegeneration may continue to increase with CAG repeats above 50.
Our study was limited by its sample size and varying lengths of longitudinal follow-up across participants. While it is the largest prospectively collected study on patients with JOHD, it is still a relatively small cohort. It is especially true when discussing the longitudinal neuroimaging analyses that included 11 participants with JOHD who provided 33 observations. In the patients with JOHD, CAG repeat length did not significantly predict whether a participant had longitudinal data or not. Furthermore, the results of the clinical and neuroimaging analyses did not change when including the participants who only had one clinical or neuroimaging assessment. Regardless, the possibility that participants with longitudinal data may somehow differ from participants with only a single assessment should be considered.
This study represents novel findings from a rare group of patients with JOHD. We have demonstrated that clinical and neuroimaging outcomes can be quantified longitudinally and may be useful in conducting clinical trials in patients with JOHD in the future. Furthermore, our study illustrates the power of longitudinal analyses in rare populations and the necessity for continuing research in rare disorders.
Supplementary Material
ACKNOWLEDGEMENTS
We would like to extend our most sincere thank you to all the brave participants and their families for providing their time, data, and samples to make this work possible.
FINANCIAL DISCLOSURES AND COMPETING INTERESTS
This work was funded by the National Institute of Neurological Disorders and Stroke (R01-NS094387 and RO1-NS055903 to PCN) and the CHDI Foundation (to PCN). Support provided to JLS from NINDS K23-NS117736. Support provided to VAM from P50-HD103556. Images collected in this study were collected on a scanner funded by NIH Grant S10-OD025025.
JLS receives salary support Michael J. Fox Foundation for Parkinson’s Research.
DLR reports grants from the Wellcome Trust; personal fees and non-financial support from Roche, Wave Life Sciences, and Voyager Therapeutics; and personal fees from Teva, Novartis, Takeda, AskBio, uniQure, and Axon Advisors.
All other authors declare no competing interests or financial disclosures for the preceding 12 months.
Footnotes
Author Disclosures
The authors report no potential conflicts of interest related to this work.
REFERENCES
- 1.A novel gene containing a trinucleotide repeat that is expanded and unstable on Huntington's disease chromosomes. The Huntington's Disease Collaborative Research Group. Cell 1993;72(6):971–983. [DOI] [PubMed] [Google Scholar]
- 2.Langbehn DR, Brinkman RR, Falush D, Paulsen JS, Hayden MR, International Huntington's Disease Collaborative G. A new model for prediction of the age of onset and penetrance for Huntington's disease based on CAG length. Clin Genet 2004;65(4):267–277. [DOI] [PubMed] [Google Scholar]
- 3.Nopoulos PC. Huntington disease: a single-gene degenerative disorder of the striatum. Dialogues Clin Neurosci 2016;18(1):91–98. [DOI] [PMC free article] [PubMed] [Google Scholar]
- 4.Douglas I, Evans S, Rawlins MD, Smeeth L, Tabrizi SJ, Wexler NS. Juvenile Huntington's disease: a population-based study using the General Practice Research Database. BMJ Open 2013;3(4). [DOI] [PMC free article] [PubMed] [Google Scholar]
- 5.Cronin T, Rosser A, Massey T. Clinical Presentation and Features of Juvenile-Onset Huntington's Disease: A Systematic Review. J Huntingtons Dis 2019;8(2):171–179. [DOI] [PubMed] [Google Scholar]
- 6.Schobel SA, Palermo G, Auinger P, et al. Motor, cognitive, and functional declines contribute to a single progressive factor in early HD. Neurology 2017;89(24):2495–2502. [DOI] [PMC free article] [PubMed] [Google Scholar]
- 7.Tabrizi SJ, Scahill RI, Owen G, et al. Predictors of phenotypic progression and disease onset in premanifest and early-stage Huntington's disease in the TRACK-HD study: analysis of 36-month observational data. Lancet Neurol 2013;12(7):637–649. [DOI] [PubMed] [Google Scholar]
- 8.Paulsen JS, Long JD, Ross CA, et al. Prediction of manifest Huntington's disease with clinical and imaging measures: a prospective observational study. Lancet Neurol 2014;13(12):1193–1201. [DOI] [PMC free article] [PubMed] [Google Scholar]
- 9.Stout JC. Juvenile Huntington's disease: left behind? Lancet Neurol 2018;17(11):932–933. [DOI] [PubMed] [Google Scholar]
- 10.Tereshchenko A, Magnotta V, Epping E, et al. Brain structure in juvenile-onset Huntington disease. Neurology 2019;92(17):e1939–e1947. [DOI] [PMC free article] [PubMed] [Google Scholar]
- 11.Tereshchenko AV, Schultz JL, Kunnath AJ, et al. Subcortical T1-Rho MRI Abnormalities in Juvenile-Onset Huntington's Disease. Brain Sci 2020;10(8). [DOI] [PMC free article] [PubMed] [Google Scholar]
- 12.van der Plas E, Schultz JL, Nopoulos PC. The Neurodevelopmental Hypothesis of Huntington's Disease. J Huntingtons Dis 2020;9(3):217–229. [DOI] [PMC free article] [PubMed] [Google Scholar]
- 13.van der Plas E, Langbehn DR, Conrad AL, et al. Abnormal brain development in child and adolescent carriers of mutant huntingtin. Neurology 2019;93(10):e1021–e1030. [DOI] [PMC free article] [PubMed] [Google Scholar]
- 14.Unified Huntington's Disease Rating Scale: reliability and consistency. Huntington Study Group. Mov Disord 1996;11(2):136–142. [DOI] [PubMed] [Google Scholar]
- 15.Horton MC, Nopoulos P, Nance M, et al. Assessment of the Performance of a Modified Motor Scale as Applied to Juvenile Onset Huntington's Disease. J Huntingtons Dis 2019;8(2):181–193. [DOI] [PubMed] [Google Scholar]
- 16.Quarrell O, Brewer H, Squitieri F, Barker RA, Nance M, Landwehrmeyer B. Juvenile Huntington’s Disease and Other Trinucleotide Repeat Disorders. New York: Oxford University Press, 2009. [Google Scholar]
- 17.Wechsler D. Wechsler Intelligence Scale for Children. Pearson Assessments. 2008. [Google Scholar]
- 18.Wechsler D. Wechsler Adult Intelligence Scale-IV. Pearson Assessments. 2008. [Google Scholar]
- 19.Young Kim E, Johnson HJ. Robust multi-site MR data processing: iterative optimization of bias correction, tissue classification, and registration. Front Neuroinform 2013;7:29. [DOI] [PMC free article] [PubMed] [Google Scholar]
- 20.Desikan RS, Segonne F, Fischl B, et al. An automated labeling system for subdividing the human cerebral cortex on MRI scans into gyral based regions of interest. Neuroimage 2006;31(3):968–980. [DOI] [PubMed] [Google Scholar]
- 21.Benjamini Y, Hochberg Y. Controlling the False Discovery Rate - a Practical and Powerful Approach to Multiple Testing. J R Stat Soc B 1995;57(1):289–300. [Google Scholar]
- 22.Nopoulos PC, Aylward EH, Ross CA, et al. Smaller intracranial volume in prodromal Huntington's disease: evidence for abnormal neurodevelopment. Brain 2011;134:137–142. [DOI] [PMC free article] [PubMed] [Google Scholar]
- 23.Fusilli C, Migliore S, Mazza T, et al. Biological and clinical manifestations of juvenile Huntington's disease: a retrospective analysis. Lancet Neurol 2018;17(11):986–993. [DOI] [PubMed] [Google Scholar]
- 24.Langbehn DR, Stout JC, Gregory S, et al. Association of CAG Repeats With Long-term Progression in Huntington Disease. JAMA Neurol 2019. [DOI] [PMC free article] [PubMed] [Google Scholar]
Associated Data
This section collects any data citations, data availability statements, or supplementary materials included in this article.