

Abstract
Purpose:
Ovarian cancer is the most lethal gynecologic cancer and intrinsically resistant to checkpoint immunotherapies. We sought to augment innate immunity, building on previous work with interferons and monocytes.
Experimental Design:
Preclinical experiments were designed to define the mechanisms of cancer cell death mediated by the combination of interferons alpha and gamma with monocytes. We translated these preclinical findings into a phase I trial of autologous IFN-activated monocytes administered intraperitoneally to platinum-resistant or -refractory ovarian cancer patients.
Results:
Interferon (IFN)-treated monocytes induced caspase 8-dependent apoptosis by the proapoptotic tumor necrosis factor-related apoptosis inducing ligand (TRAIL) and mediated by the death receptors 4 and 5 (DR4 and DR5, respectively) on cancer cells. Therapy was well tolerated with evidence of clinical activity, as 2/9 evaluable patients had a partial response (PR) by RECIST criteria, and 1 additional patient had a CA-125 response. Upregulation of monocyte-produced TRAIL and cytokines was confirmed in peripheral blood. Long-term responders had alterations in innate and adaptive immune compartments.
Conclusions:
Given the mechanism of cancer cell death, and the acceptable tolerability of the clinical regimen, this platform presents a possibility for future combination therapies to augment anti-cancer immunity.
Keywords: Immunotherapy, interferons, monocytes, ovarian cancer, innate immunity
Introduction
Ovarian cancer is the leading cause of death due to gynecologic malignancy, and the fifth leading cause of cancer death in women1. The peritoneal cavity is the earliest and primary site of metastatic spread in ovarian cancer as well as the most common site of relapse2. Patients with peritoneal disease relapse have a poor prognosis, particularly once their disease becomes resistant or refractory to platinum-based chemotherapy. These observations led to trials of intraperitoneal (IP) chemotherapy, thereby focused to the primary site of tumor, which has resulted in an overall survival advantage in phase III clinical trials3–6.
The efficacy of IP chemotherapy raises the possibility of IP administration of novel cellular and/or immune therapies. Since immune checkpoint therapy has limited efficacy in ovarian cancer7 we took the alternative approach of pursuing a therapy exploiting the innate immune system. Monocytes are innate immune cells which, when exposed to certain cytokines, can differentiate into a tumoricidal state in preclinical studies8–13. Work from our group and others has demonstrated that the combination of IFNα and IFNγ plus monocytes has potent synergistic antitumor activity in a xenograft model of ovarian cancer11, and that this combination is capable of inducing differentiation of monocytes into tumoricidal M1 macrophages9,10.We hypothesized that intraperitoneal administration of the combination of both IFNs with autologous monocytes, a combination not previously tested, would lead to an anti-tumor response in ovarian cancer patients, and that this combination would be safe and well-tolerated.
Here we characterize for the first time the mechanism of an innate immunotherapy using a patient’s own IFN-activated monocytes to kill cancer cells and demonstrate that killing is dependent on cell contact and induction of TRAIL and death receptor (DR) 4/5-mediated apoptosis. We translated these results into a first-in-human trial in platinum-resistant or -refractory ovarian cancer patients. We demonstrated that the therapy is well tolerated, with evidence of clinical activity by both imaging and CA-125 responses. Exploratory analyses demonstrated induction of TRAIL expression in monocytes and upregulation of proinflammatory cytokines in blood. Long-term responders displayed different baseline immunologic characteristics from other patients, including lower level of T-regulatory cells and neutrophil-to-lymphocyte ratio at baseline. However, these same patients exhibited a marked increase in myeloid-derived suppressor cells (MDSCs) at the time of clinical and/or tumor progression, suggesting an opportunity for improving this immunologic therapy platform with an additional agent targeting MDSCs.
Methods
Cell Lines:
OVCAR8, OVCAR5, and OVCAR3 ovarian serous epithelial cell lines were obtained from the NCI-60 repository (for OVCAR 8 and 5) and ATCC (for OVCAR 3), respectively. Both lines were re-validated by short tandem repeat profiling. Cells were cultured in complete medium RPMI-1640 (cRPMI) (Quality Biological) supplemented with 10% Heat Inactivated Fetal Bovine Serum (Quality Biological) without antibiotics in a humidified incubator with 5% CO2 warmed at 37°C.
Proteins and Chemicals:
Human IFN-α2a, was a gift of Hoffmann LaRoche (Nutley, NJ), and IFN-γ was purchased from Intermune Pharmaceutical Inc. (Brisbane, CA). All dilutions were performed in cRPMI. Propidium iodide solution was purchased from Sigma-Aldrich (St. Louis).
Isolation of primary patient and control monocytes:
Peripheral blood was isolated by percutaneous venipuncture and collected in two 10 mL EDTA tubes (Becton Dickinson). Peripheral Blood Mononuclear Cells (PBMCs) were isolated as previously described (23). Blood was obtained from patients attending the Women’s Malignancy Branch Ovarian Cancer Clinic under IRB approval through protocol 14-C-0056. De-identified age-matched control blood was obtained through the Department of Transfusion Medicine (DTM), Clinical Research Center, NIH, under protocol 99-CC-06168.
Elutriated Monocytes:
De-identified primary human monocytes from healthy donors were obtained from the DTM, Clinical Research Center, NIH, and cultured as previously described (15).
Monocyte killing assay of cell lines:
Monocytes were co-cultured at a ratio of 10:1 for three days with ovarian cancer cell lines and without IFNs as previously described (15).
Monocyte direct killing assay:
Monocytes were cultured for 24 hours with or without IFN-a2a and IFN-gamma. Monocytes were then washed of culture media and subsequently cultured with OVCAR8 cells at a ratio of 10:1 for an additional 48 hours on 0.4-micron pore size polycarbonate transwell inserts (Corning #7910) or normal 10 cm dishes. Cells were diluted 1:10000 and stained with Sytox green dye. Flow cytometry was then performed and percentage of live cells was calculated.
CRISPR-Cas9:
All CRISPR HDR-plasmid constructs were purchased from Santa Cruz Bio-Technology, used for targeted deletion of specific genes as stated in the product manual.
siRNA knockdowns in epithelial cell lines:
siRNA to DR5 (Hs_TNFRSF10B_6), Cat. No sI03038665 (Qiagen) were validated for knockdown by western blot prior to use in biological assay. Sequence: 5’-CTGCAAATATGGACAGGACTA-3’. siRNAs showing greater than 80% knockdown were used.
siRNA knockdown in primary monocytes:
siRNA mediated knockdown of primary monocytes using reverse transfection was slightly modified from the original method (24). Primary human monocytes were isolated by counter elutriation and further isolated using CD14 positive selection beads (Miltenyi Biotech). TNFSF10B Target Sequences 5’-CCAAACAUACUUUCGAUUU-3’, 5’-GCAACUCCGUCAGCUCGUU-3’, 5’-CAAGUUAUCCUGACCCUAU-3’, 5’-GAGGAAUGGUGAACUGGUC-3’. Knockdown was confirmed by western blot. More complete details can be found in the Supplementary Files.
Western Blots:
At indicated time points cells were pelleted by centrifugation and snap frozen and stored at −80°C. Cell pellets were lysed with M-PER lysis buffer (Thermo) with 1x protease and phosphatase inhibitors (Thermo). Lysates were clarified by centrifugation at 20,000 RPM for 20 minutes at 4°C. Details, include product vender information and antibody clone number can be found in the Supplementary Information.
Flow Cytometry:
5×10⁵ cells were added to 5 mL flow cytometry tubes, spun down at 1000 RPM (Epithelial Cells) 1250 RPM (monocytes) for 5 minutes at 4°C, and re-suspended in 100 μL ice cold PBS. A Fc blocking step (eBioscience) was performed for staining of monocytes for 15 minutes on ice. Antibodies were added at the manufactures suggested concentration for 30 minutes on ice in the dark. Cytometry was performed according to eBioscience protocols on a Becton Dickinson FACSCalibur. Antibodies used are listed in supplemental materials.
Spheroid Generation, confocal microscopy, and gene expression analysis:
detailed materials and methods are in the Supplemental Materials.
Mouse Studies:
Mouse experiments were approved by the NIH Animal Care and Use Committee. Briefly, 10 Foxn1nu athymic mice were injected intraperitoneally with 2*106 OVCAR8 cells. 14 days later, mice were either given PBS or a single dose of intraperitoneal monocytes at a dose of 20*106 cells/mouse. Mice were also given PBS or 1 μL of IFN alfa-2a (20 ug/mL) and gamma-1b (20 ug/mL), for a final dose 20 ng/mouse. Mice were euthanized at first sign of illness.
RNA Isolation:
Cells were harvested at the indicated time points and pelleted by spinning at 1,000 rpm at 4°C using a Beckman Coulter Allegra X-15R centrifuge. The supernatants were removed, and the pellets were washed in 1 ml of PBS (pH 7.4). The pellet was then resuspended in 350 μl of RLT buffer plus from the RNeasy plus kit (Qiagen, Germantown, MD). The RNA mixture was then stored at −80°C until RNA isolation. RNA isolation was performed using the RNeasy plus kit according to the manufacturer’s instructions. To remove contaminating DNA, two DNase steps were performed. DNA was first removed using the genomic DNA (gDNA) eliminator column (Qiagen, Germantown, MD) prior to RNA binding to the RNeasy column. A second, on-column DNase step was performed using 10 μl of DNase 1 with 70 μl of buffer RDD (Qiagen, Germantown, MD) and 2 μl of Turbo DNase (Thermo Fisher, Waltham, MA) per column. The columns were incubated at room temperature for 30 min. The RNA samples were quantitated using the Nanodrop 1000 (Thermo Scientific, Wilmington, DE).
Microarray:
The Ambion® Illumina® TotalPrep™ RNA Amplification Kit (Ambion, Inc, Austin, TX) was used similarly to manufacturer instructions and as previously described50 to prepare biotinylated cRNA from isolated total RNA. Input was normalized to 300 ng to 500 ng per sample and yields ranged from 10 μg to 70 μg. Briefly, the kits employ reverse transcription to produce high yields of first strand cDNA using a reverse transcriptase (RT) that catalyzes the synthesis of near full-length cDNA. The cDNA was subjected to second strand synthesis to convert to a double-stranded DNA (dsDNA) template for transcription for in vitro transcription with T7 RNA polymerase. This method leverages DNA polymerase and RNase H to simultaneously degrade the RNA and synthesize the second strand cDNA. Clean-up is performed to remove RNA, primers, enzymes, and salts that could inhibit transcription. Next, biotinylated antisense RNA copies of each mRNA in a sample are generated. Labeled cRNA (0.75 μg) was then used for hybridization with Illumina HumanHT-12 v4.0 beachchips, scanned on HiScan-SQ imager.
Gene expression analysis:
Signal data were extracted from the image files with the Gene Expression module (v. 1.9.0) of the GenomeStudio software (v. 2011.1) from Illumina, Inc. Signal intensities were converted to log2 scale. Calculation of detection p-values is described in the GenomeStudio Gene Expression Module User Guide. Data for array probes with insufficient signal (probes not having at least two arrays with detection P value < 0.1) were removed from the dataset. After dropping nonperforming probes, quantile normalization was applied across all arrays. A total of 35,680, length 50 nt probes had sufficient signal for ANOVA computation. The single probe with the most statistically significant result was taken to represent the gene’s expression level. Expression estimates are Log2 of BeadChip signal intensity after quantile normalization with JMP/Genomics software (v 6.0; SAS Institute). Expression profiles from for (n=3) technical replicates were averaged together before computing ANOVA across data from (n=3) different donors. Mixed Effects ANOVA was calculated using JMP/Genomics software with treatment condition (fixed) and donor ID (random) effects to test for gene expression differences. N=3 monocyte donors per ex-vivo treatment group. A p-value of 0.05 was used for the statistical significance cutoff, after adjusting for the family-wise error rate (FWER) using Benjamini–Hochberg method to account for multiple testing. Additional requirement of log2 expression ratio greater than 1.0 (2-fold change of IFN-treated vs control, positive or negative) was used to select differentially expressed genes for heatmap. The microarray data have been deposited in NCBI’s Gene Expression Omnibus51 and are accessible through GEO Series accession number GSE190594 (https://www.ncbi.nlm.nih.gov/geo/query/acc.cgi?acc=GSE190594)
Statistical analyses for preclinical experiments:
Student’s t-test, 1-way ANOVA, and 2-way ANOVA with Bonferroni post-test analysis were performed were indicated. The number of samples chosen for each comparison was determined based on past similar experiments or by performing pilot experiments to assess the expected magnitude of differences. This approach was duplicated from another publication (25). The number of experiments performed is indicated in the figure legends. Biological assays were performed in triplicate, with separate donors before statistical analysis was performed.
First-in-human clinical trial design
This was an open-label, single-center phase I study comprised of a conventional 3+3 dose escalation in order to determine the recommended phase 2 dose (RP2D). This clinical trial was conducted in accordance with the Declaration of Helsinki. Informed consent was obtained from each subject. As previously described, on day 0, patients underwent apheresis of peripheral blood mononuclear cells (PBMCs), from which monocytes were purified by counter-flow elutriation, quantified, and cryopreserved19. On day 1 of each 28-day cycle, 3–6 patients at each DL received infusion of pegylated IFNα−2b (Sylatron, Merck; 25–250 mcg) and IFNγ−1b (Actimmune, Horizon; 5–50 mcg), with or without their own autologous monocytes (75–750 × 106 cells). Monocytes and interferon were combined in the infusion product for no more than four hours. No differences were noted in studies comparing viability and functionality of fresh monocytes to cryopreserved monocytes in the final product19. Patients were not pre-medicated with non-steroidal anti-inflammatory drugs to prevent temperature elevation. Doses of each cytokine corresponded to the following in international units (IU): 1.75 × 10⁶ IU or 1.5 × 10⁷ IU for Sylatron, 1 × 10⁵ IU or 1 × 10⁶ IU for Actimmune (see study schema and figures as well as previously published descriptions of monocyte isolation procedure52 and trial design53). Treatment was administered by either intraperitoneal catheter or surgically implanted intraperitoneal port. Monocytes which were not immediately needed were cryopreserved and used as need in later cycles; additional monocytes were collected in later cycles as needed. Patients continued to receive treatment until disease progression, intolerable toxicity, or withdrawal of consent. In addition to the above dose levels, an optional DL of 3b was available for patients at higher dose levels unwilling or unable to tolerate subsequent apheresis procedures, which was comprised of the highest levels of IFNα (250 mcg) and IFNγ (50 mcg), but without the addition of monocytes.
Toxicities were assessed and graded each cycle according to CTCAE 4.0 criteria54. Dose limiting toxicities (DLTs) were determined during the first cycle. DLTs were defined as ≥ Grade 3 fatigue lasting > 7 days, ≥ Grade 3 cytopenias lasting >7 days, ≥ Grade 3 transaminitis lasting >7 days, ≥ Grade 3 depression lasting >7 days, ≥ Grade 3 abdominal pain lasting > 7 days, or any other grade ≥ 3 toxicity lasting > 72 hours despite maximal medical intervention.
The RP2D was defined as the dose at which 0–1 of six patients experienced a dose limiting toxicity, or the highest planned dose level. The RP2D was expanded to six patients in order to get additional information on the safety, tolerability, and efficacy of the combination. Response was determined every 8 weeks by CT imaging according to RECIST criteria v1.1 and/or CA-125 level according to Gynecological Cancer Intergroup (GCIG) criteria21.
Biomarkers/Exploratory Objectives:
Before each cycle, patients underwent collection of peripheral blood for multi-parameter flow cytometry analysis of immune cell populations including T cell subsets, B cell subsets, myeloid subsets (M1 and M2 macrophages, monocytes, dendritic cells), and NK cells, as well as molecules associated with checkpoint blockade (PD1, PD2, PDL1, PDL2, CTLA4). Patient samples were stored at −80°Cand thawed for all analyses except for peripheral blood cell count and differential, which was performed on fresh plasma according to conventional clinical assays. Cell staining and flow cytometry was performed as previously described55. For full list of markers and populations please see the supplementary data.
Presence of anti-IFN antibodies in plasma was determined using a high-throughput particle-based assay56, with healthy age-matched plasma as negative controls and known autoantibody-positive patient plasma as positive controls. Briefly, plasmas were diluted 1:100 in PBS and incubated for 30 minutes with differentially fluorescing magnetic beads that had been covalently coupled to 2.5ug recombinant human IFNα (PBL Biomedical Laboratories; catalog 11101–2) or IFNγ (R&D Systems; catalog 285-IF-100/CF). Beads were washed then incubated with 1 ug/mL PE-labeled goat anti-human IgG (eBioscience; catalog 12–4998) for an additional 30 minutes before being washed again and run in a multiplex assay on the BioPlex X200 instrument (BioRad).
Plasma cytokine levels were assessed at baseline, 3–5 days after administration of first dose of treatment, and directly before administration of second dose of treatment using the V-PLEX Proinflammatory Panel 1 (Meso Scale Diagnostics), which assays for levels of IFN-γ, IL-1β, IL-2, IL-4, IL-6, IL-8, IL-10, IL-12p70, IL-13, and TNF-α.
For RT-PCR, Total RNA from the patient monocytes or monocyte plus IFN product was isolated with an miRNeasy Mini Kit (Qiagen). cDNA was synthesized using a high capacity cDNA reverse transcription kit (Applied Biosystems) with oligo(dT) priming and amplification of gene-specific products was achieved with TaqMan probes (Applied Biosystems). The relative fold change in gene expression was calculated using the delta-delta Ct method (2−ΔΔCt). Probes and target mRNAs were as follows: TNFSF10 - Hs00921974_m1, STAT1 - Hs01013996_m1, GAPDH - Hs99999905_m1.
Statistical Analyses for clinical trial:
Safety analyses included all patients who were enrolled on study. Efficacy analyses were descriptive and included patients who had either RECIST-quantifiable lesions or measurable CA-125 response as defined by GCIG criteria21. For statistical analyses of correlative endpoints, t tests for paired or unpaired data were used as specified in the individual figure legends (significance level, P ≤ .05).
Data Availability Statement:
Raw data for this study were generated at the National Institutes of Health. Derived data supporting the findings of this study are available from the corresponding author upon request. Microarray data generated in this study are publicly available at GEO as described above.
Results
IFN-treated Monocytes Induce Apoptosis via a Cell-contact-dependent Mechanism
Spheroid cultures from the human ovarian cancer cell line OVCAR5 were cultured with monocytes and IFNs, both separately and in combination, or treated with carboplatin-based chemotherapy drugs as a positive control for inducing cell death (Figure 1A). Monocytes and IFNs alone resulted in significant cell death as compared to no treatment, but death did not exceed that induced by chemotherapy. The combination of monocytes and IFNs resulted in an approximately 80% reduction in viability compared to control, significantly greater than chemotherapy. Staining with Hematoxylin and Eosin (H&E) and CD68 IHC were then performed to identify monocytes/macrophages in the tumor spheroid cultures (Figure 1B). The untreated spheroids are complex structures defined by cells with fused nuclei, large vacuole spaces, and extracellular matrix. The addition of monocytes to the culture resulted in migration of CD68-positive monocytes into the spheroids. IFN treatment by itself caused some disaggregation of the spheroid. Remarkably, the combination of both monocytes and IFNs resulted in extensive migration into the spheroids, destruction of most of the spheroid structures, and loss of viable CD68-negative tumor cells. Real-time single-photon confocal microscopy assay utilizing dye-labelled monocytes confirmed the migration of monocytes into the spheroids (Figure 1C and Supplemental videos 1–4). Cell tracking software used to quantify monocyte movement demonstrated that when treated with IFNs, monocytes exhibited decreased track length, displacement, and speed, consistent with a prolonged and close interaction between monocytes and the cancer cells (Supplemental figure 1A–D).
Figure 1: Interferon-treated monocytes kill tumor cells in 3D culture by direct contact.
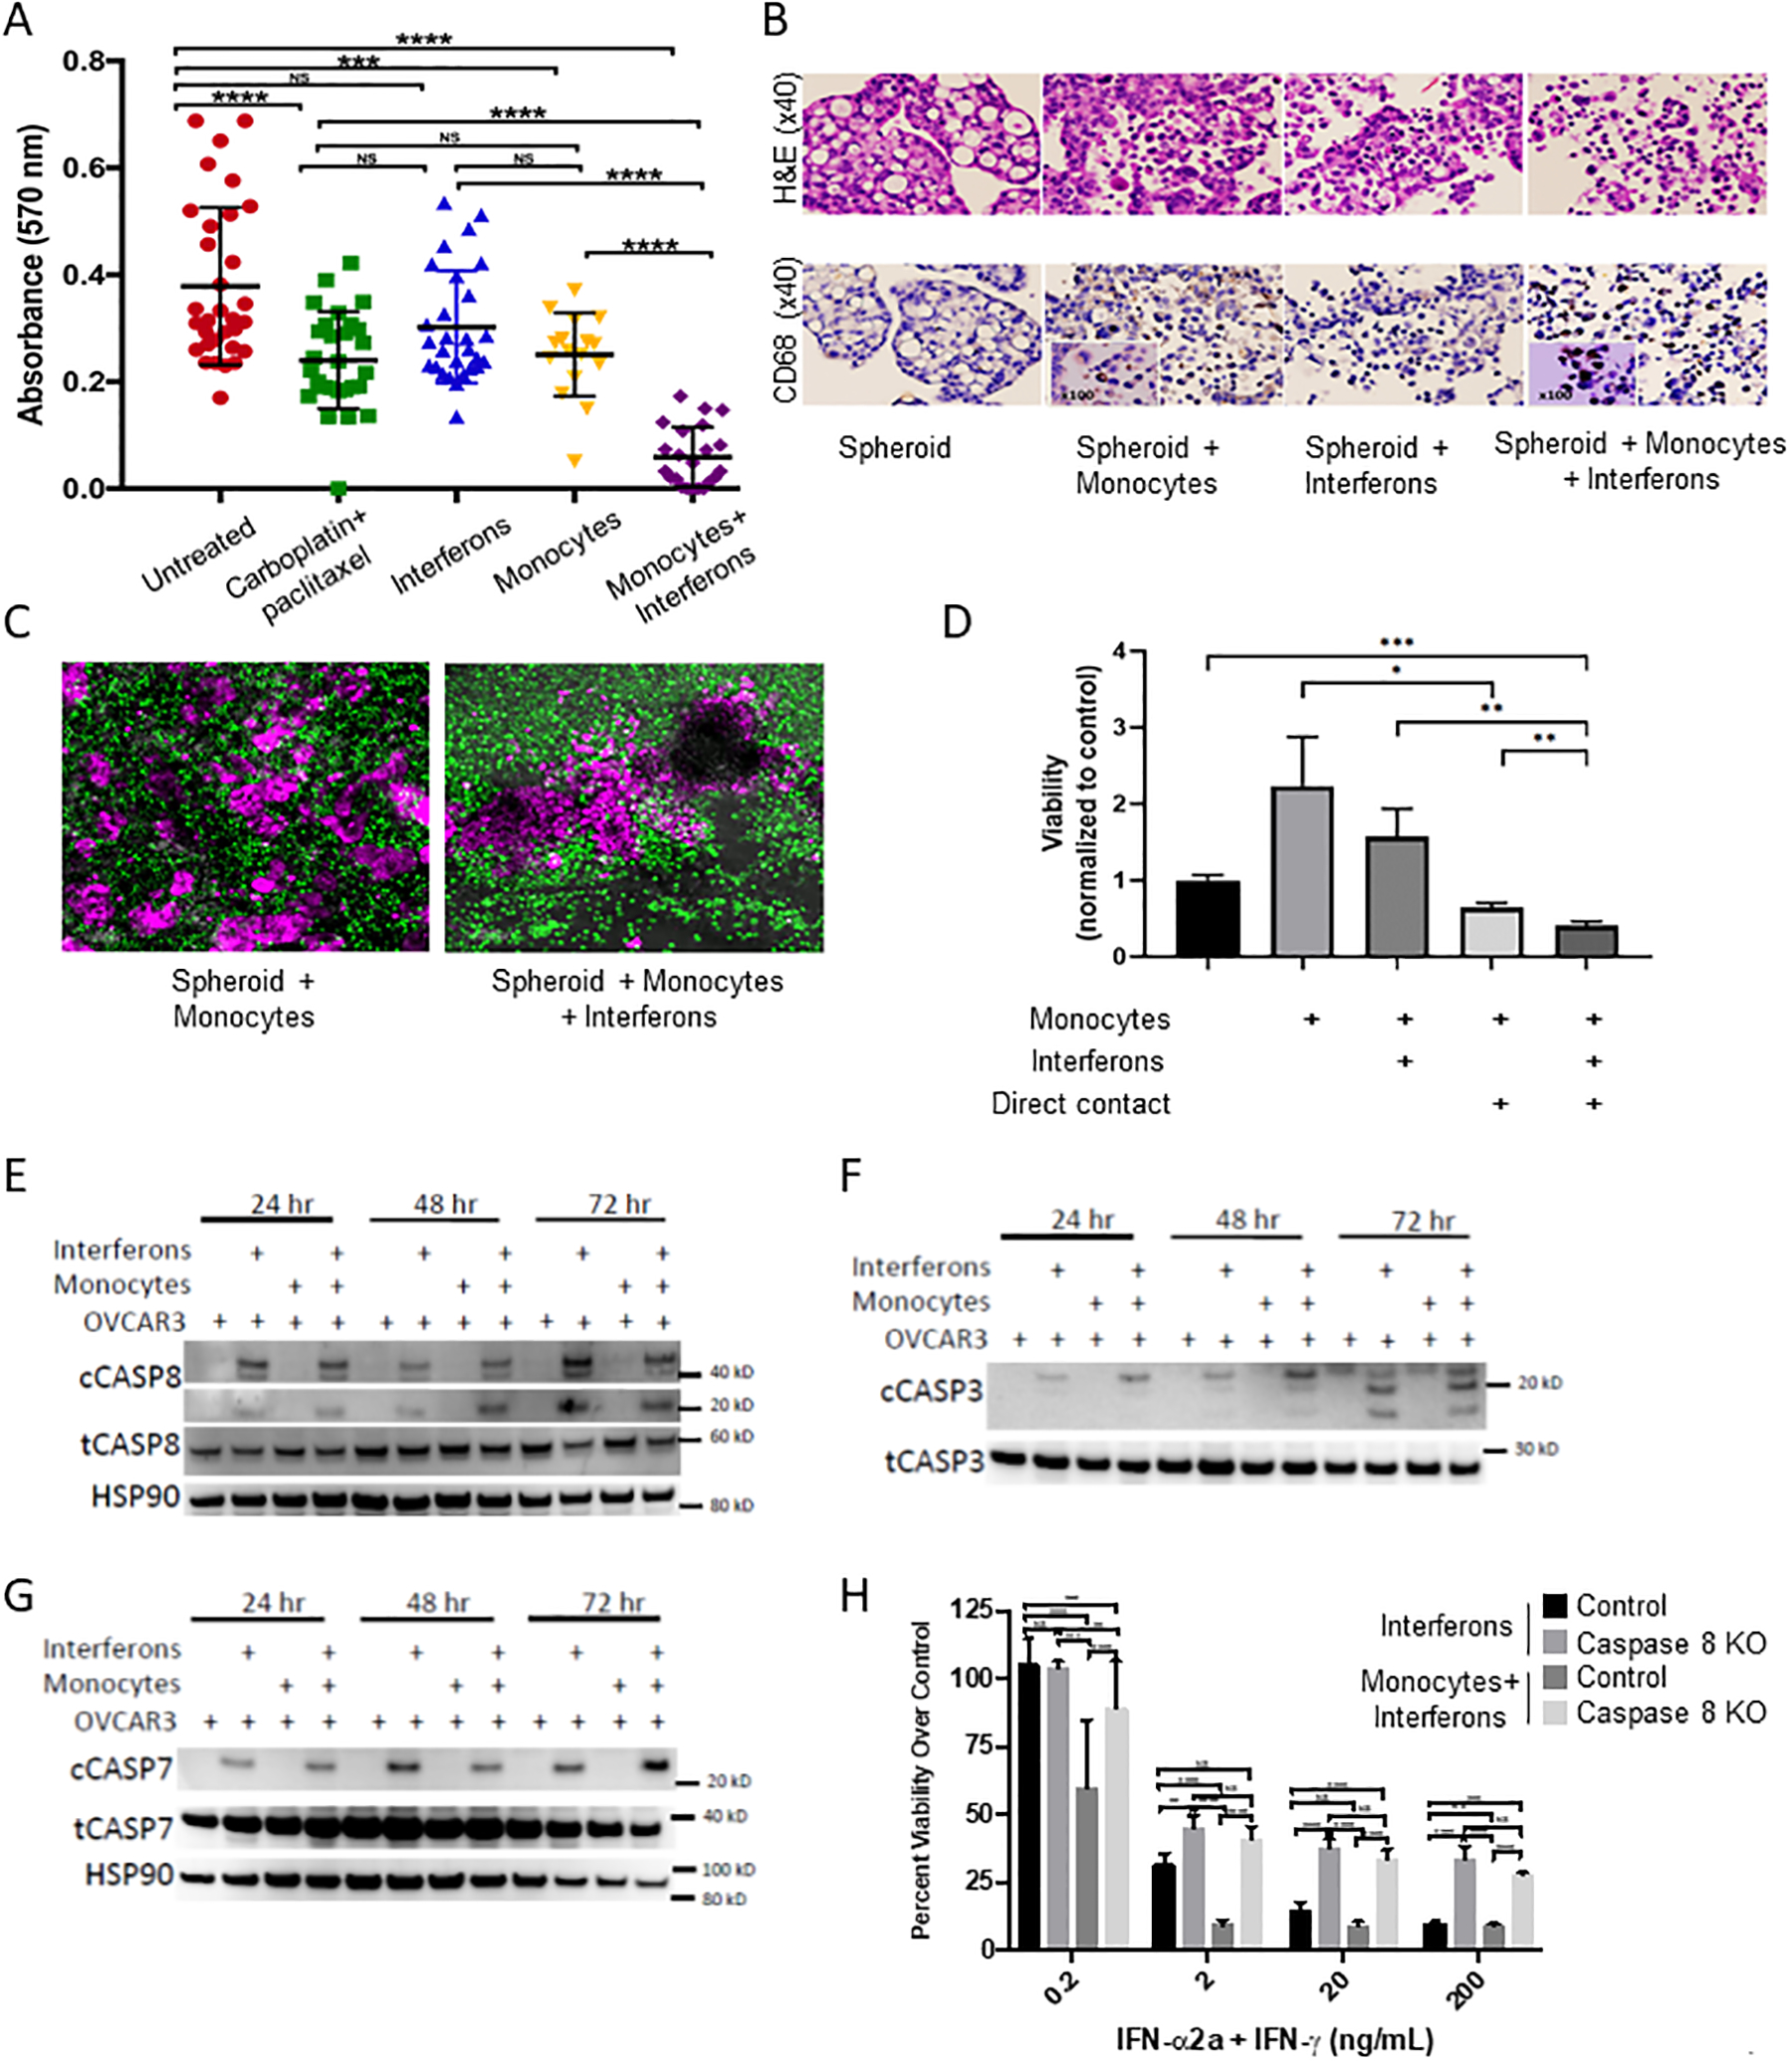
(A) OVCAR 5 spheroids were isolated and plated into flat bottom 96 well tissue culture plates and exposed to indicated treatments for 72 hours. Monocytes were derived from healthy donors and viability was measured using an XTT assay. (B) Spheroids were isolated and treated as in (A) and then fixed and stained with H&E and immunohistochemistry for CD68. (C) Representative confocal image of a 60 μM OVCAR5 spheroid in co-culture with monocytes, either with (right) or without (left) interferons. Monocytes are labeled green and OVCAR5 spheroids are pink. See also videos in supplemental data. (D) Monocytes were cultured with or without IFNs for 24 hours, washed, and then added either directly to OVCAR8 cells (Contact) or separated from target cells by transwell inserts. After 48 additional hours of coculture, viability of the OVCAR8 cells was measured by flow cytometry assay of sytox green dye. (E-G) EpCam+ OVCAR3 cells were isolated from monocyte and OVCAR3 co-culture experiments as above and cell lysates were probed for protein expression by western blot for cleaved and total caspase-8 (E), caspase-3 (F), and caspase-7 (G), with loading controls as indicated. (H) Caspase-8 null cells (Caspase-8−/−) were assayed for cytotoxicity in the monocyte assay compared to normal control cells (n=3 donors). Data are pooled from three separate experiments and three separate donors, with *P < 0.05, **P < 0.01, ***P < 0.001, ****P < 0.0001 by 2-way ANOVA.
In order to determine whether direct cell contact is required for cell killing, we used a transwell assay in which monocytes were treated with IFNs for 24 hours, then washed, and then added to wells with OVCAR8 (permissive of direct cell contact) or separated by a 0.4-micron membrane (too small for cell contact) (Figure 1D). The 0.4-micron membrane prevented cell killing by the monocytes, demonstrating the importance of a cell contact-dependent mechanism. Importantly, without direct contact, the presence of the monocytes appeared to stimulate cancer cell growth by more than 2-fold, but when in direct contact, they triggered cell death, decreasing cancer cell viability by 35% alone and 60% with IFNs present in this experiment. The requirement for cell-cell contact for tumor cell killing suggested that expression of death-receptor ligands on the monocytes might be responsible for the observed tumor cell death by activation of the extrinsic apoptosis pathway. Consistent with this idea, co-culture of OVCAR3 cells with IFNs and monocytes led to activation of the extrinsic apoptosis pathway, showing an increase in cleavage of the initiator procaspase-8 and downstream “executioner” procaspases-3 and −714 (Figures 1E–G). Conversely, an OVCAR3 cell line CRISPR-deleted for caspase-8 was largely immune to monocyte killing (Figure 1H and Supplemental figure 1E). Taken together, these data implicate a mechanism by which monocytes activated by IFNs kill ovarian cancer cells by direct contact, triggering the extrinsic apoptosis pathway.
IFN-activated monocytes kill tumor cells via TRAIL and DR4/5
We next sought to identify a ligand expressed by activated monocytes that could mediate cell contact-dependent killing of ovarian cancer cells. Global gene expression analysis performed on monocytes treated with both IFNs versus either IFNα or IFNγ alone revealed that one of the most upregulated genes was TRAIL (Figure 2A), a molecule expressed on activated monocytes as well as other immune cells, which is capable of inducing apoptosis through the extrinsic signaling pathway15 (see also Supplemental Table 1 for complete list of differentially expressed genes and Supplemental Table 2 for complete list of genes in heatmap). This is in line with previous reports that TRAIL is synergistically upregulated in cell lines by the combination of IFNα and IFNγ16, at least in part due to direct transcriptional upregulation mediated by an IFN-stimulated response element in the TRAIL promoter17. We cultured IFN-treated monocytes from healthy human donors with OVCAR3 ovarian cancer cells and confirmed this upregulation of TRAIL at the protein level using flow cytometry (Figure 2B), and western blotting of cell lysates (Figures 2C).
Figure 2: IFN-activated monocytes kill via TRAIL and DR4/5.
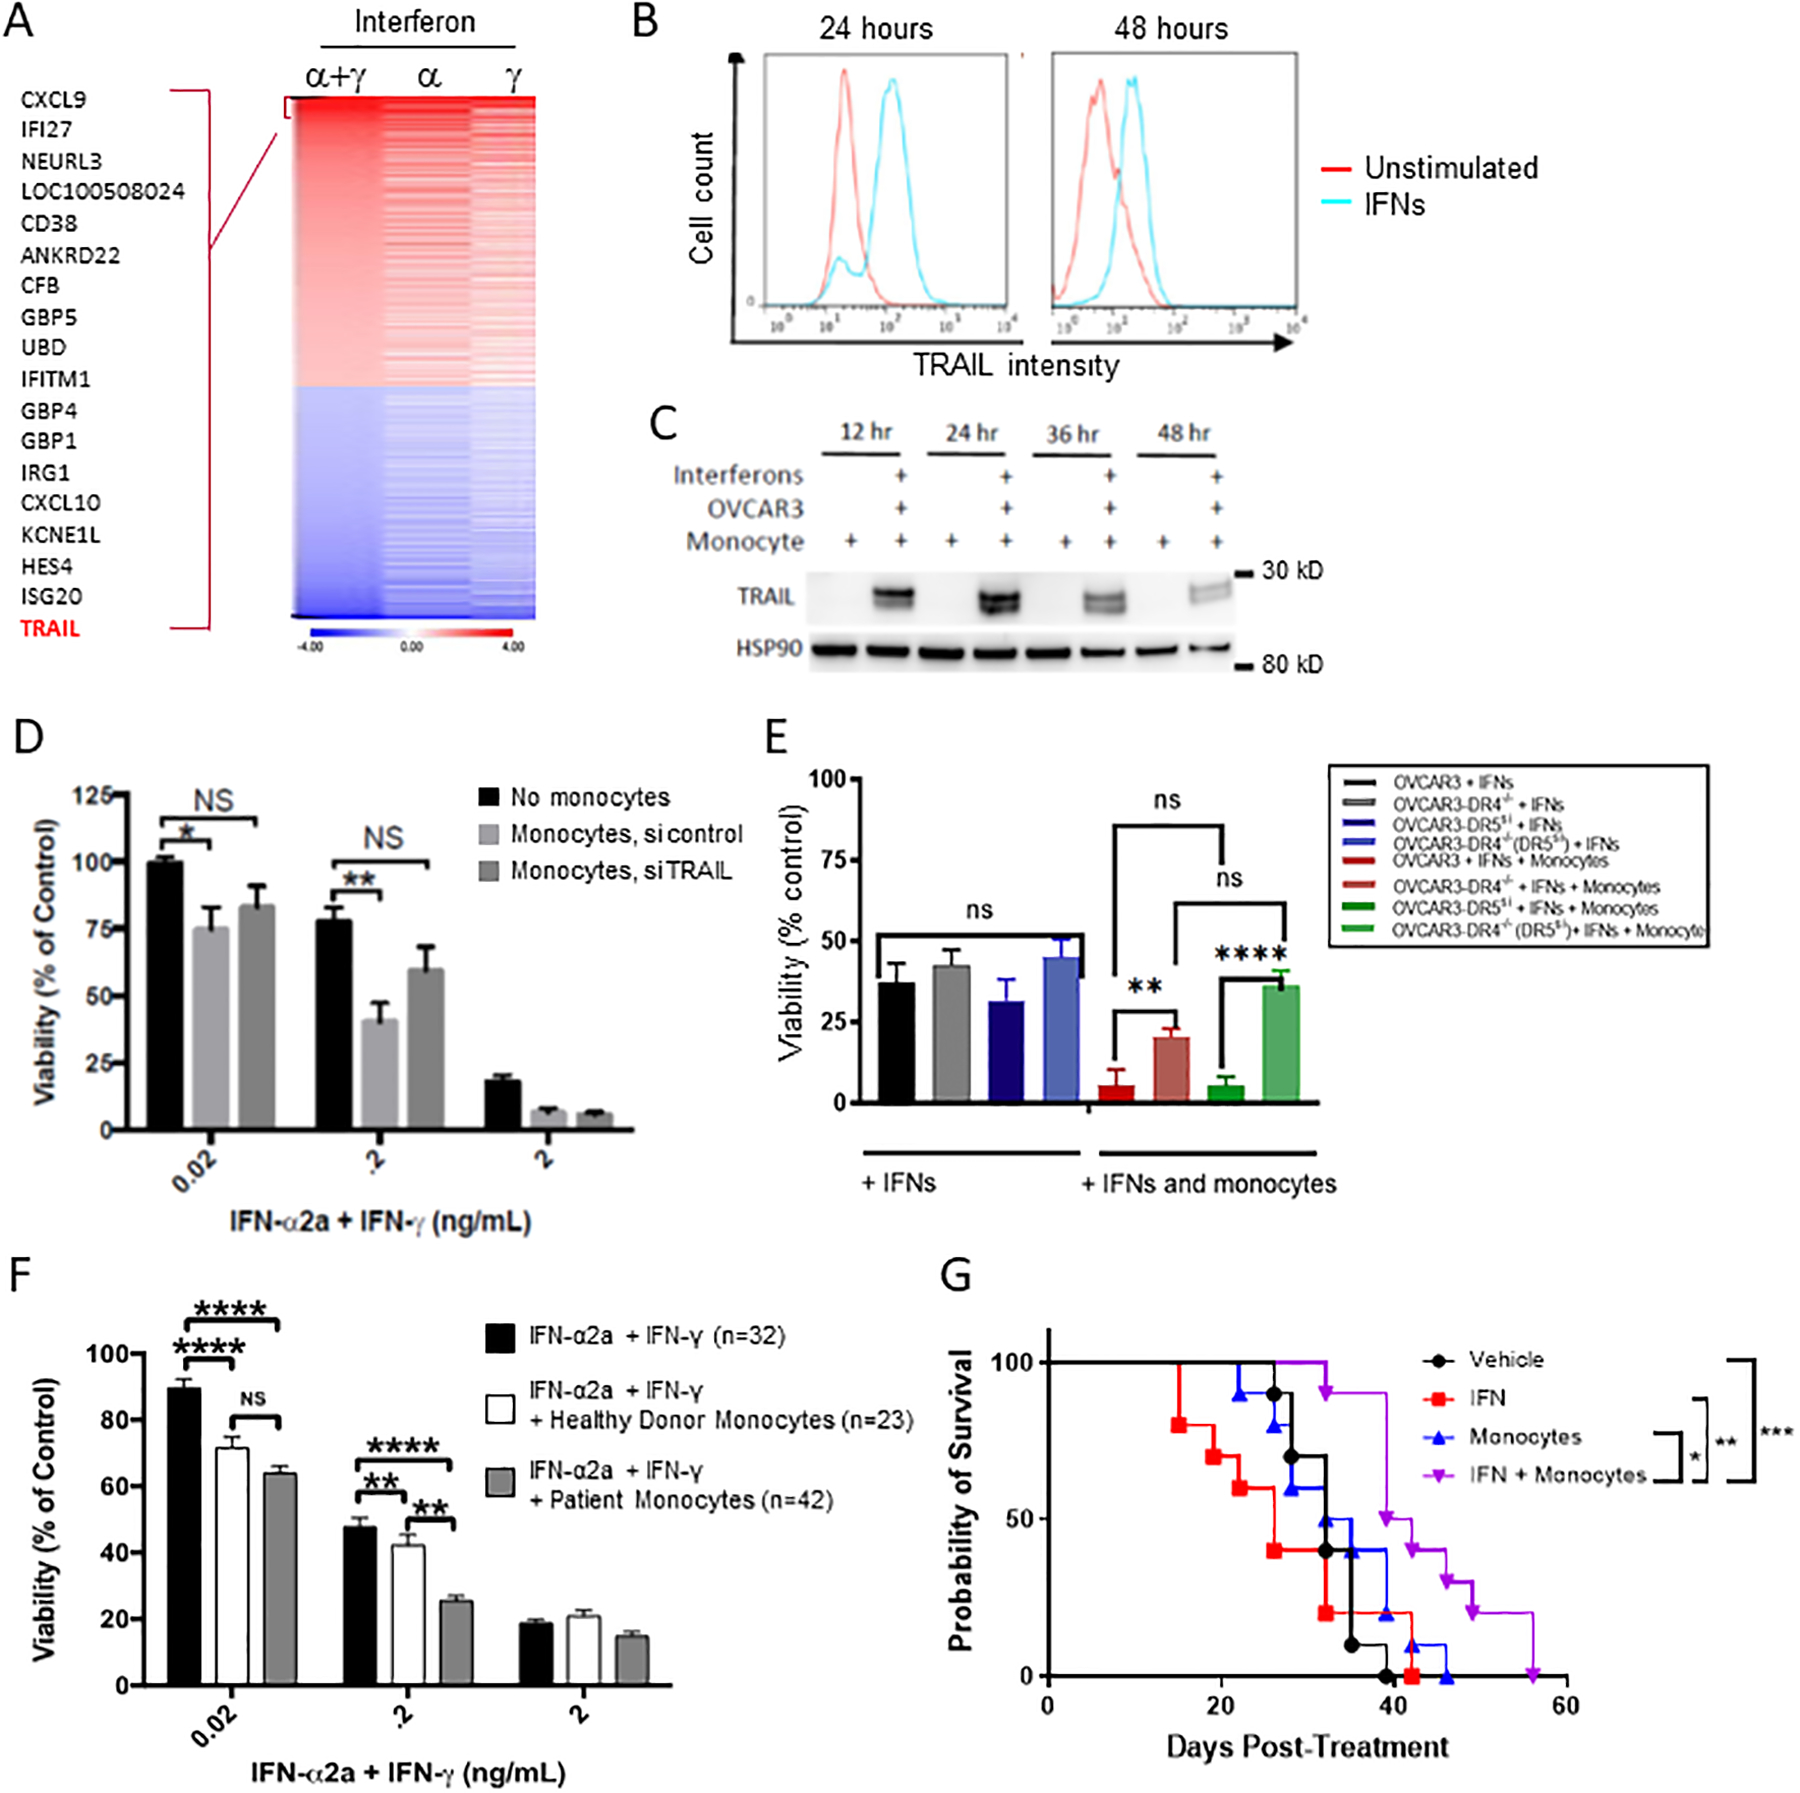
(A) Monocytes from 3 healthy donors were cultured untreated or in the presence of one or both interferons 48 hours and gene expression analysis was performed as described in the methods. Heatmap is shown of differentially expressed genes (IFNs vs control) with log2 expression ratios greater than 1.0 or less than −1.0 as well as an FDR-corrected p-value of less than 0.05. (B) Untreated monocytes (red) and IFN-α and IFN-γ stimulated monocytes (blue) were cultured for 24 and 48 hours. Surface TRAIL expression was measured by flow cytometry (data is representative of 3 separate donors). (C) Monocytes were co-cultured with OVCAR3 at an effector to target ratio of 10:1 and treated with and without IFNs (n=3). OVCAR3 were separated from monocytes using positive bead isolation for EpCam and lysates were probed by western blot for TRAIL and HSP90 (loading control). (D) Monocytes (n=3) were treated with IFNs alone (black bar), IFNS plus scramble siRNA (light gray bar) or IFNS plus siRNA against TRAIL. Monocytes were then cocultured with OVCAR3 cells and viability of the OVCAR3 cells was determined as above. (E) DR4 null, DR5 knockdown, and double DR4 knockout DR5 knockdown cells were used as target cells for measuring IFNs and monocyte mediated killing compared to scramble siRNA controls (n=3) (F) Peripheral blood monocytes were isolated from patients diagnosed with ovarian cancer (grey filled) and age-matched healthy controls (white filled) and measured in the killing assay compared to IFNs alone (black bars) with OVCAR3. n indicates the number of individual monocyte donors. *P < 0.05, **P < 0.01 by two-way ANOVA. (G) 10 Foxn1nu athymic mice were injected intraperitoneally with 2*106 OVCAR8 cells. 14 days later, mice were either given PBS or a single dose of intraperitoneal monocytes at a dose of 20*106 cells/mouse. Mice were also given PBS or 1 μL of interferon alfa-2a (20 ug/mL) and gamma-1b (20 ug/mL), for a final dose 20 ng/mouse. Mice were euthanized at first sign of illness. *P < 0.05, ***P < 0.0005 by Log-rank (Mantel-Cox) test.
To confirm that TRAIL is required for IFN-activated monocytes to induce cell death, we knocked down TRAIL in IFN-activated healthy donor monocytes using siRNA and measured killing of OVCAR3 cells compared to control (Figure 2D). RNA interference was only partially effective in knocking down TRAIL in primary monocytes (Supplemental figure 2A). Even with partial knockdown, it was apparent that control-transfected monocytes could kill OVCAR3 cells at increasing IFN concentrations, whereas knockdown of TRAIL rescued OVCAR3 cell viability to a level not statistically different from that of IFN-treated cells. TRAIL has been shown to initiate apoptosis in OVCAR3 cells by binding to its receptors DR4 and DR5, and OVCAR3 cells are known to respond equally through both DR4 and DR518. To measure the effect of each death receptor, we performed CRISPR-Cas9 deletion of DR4 and/or siRNA knockdown of DR5 in OVCAR3 cells (Figure 2E and Supplemental figure 2B–E). DR4 knockout significantly decreased cytotoxicity compared to control OVCAR3 cells co-cultured with monocytes and IFNs. Whereas knockdown of DR5 resulted in cytotoxicity that was decreased but not statistically significant, the double DR4/DR5 depletion rescued cell death to the levels of OVCAR3 treated with IFNs only, suggesting a greater role for DR4 mediated signaling versus DR5.
We confirmed the clinical applicability of these results by testing the ability of IFN-activated monocytes derived from ovarian cancer patients to kill OVCAR3 ovarian cancer cells (Figure 2F). Monocytes were isolated from the peripheral blood of healthy donors or ovarian cancer patients by elutriation, as previously described19. Interestingly, IFN-activated monocytes from these heavily pretreated ovarian cancer patients were not only effective at killing OVCAR3 cells, but we found that they were actually significantly more cytotoxic than those from healthy donors when used with the intermediate concentration of IFNs (p<0.01). To demonstrate the ability of IFN-activated monocytes to kill tumors in vivo, nude mice injected intraperitoneally with OVCAR8 cells were treated 14 days later with a single intraperitoneal dose of monocytes, IFNs, or the combination (Figure 2G). Given the requirement for direct cell contact between the IFN activated monocytes for killing the tumor cells (Fig 1D), we chose IP injection of the monocytes over other routes of administration. The combination displayed a 17% increase in overall survival versus over monocytes alone (40.5 vs 33.5 days, p<0.01), and 60% increase over IFNs alone (40.5 vs 26 days, p<0.01). Together, the data presented above demonstrate that IFN activated monocytes kill tumors via direct cell contact through the TRAIL pathway and that they prolong survival in vivo.
Design of a first-in-human trial of intraperitoneally administered autologous monocytes and IFNs.
The above data suggested the translational potential of IFN-activated monocytes as an antitumor therapy. The intraperitoneal route of administration was chosen because of our observation in Figure 1D that monocytes not in direct contact with cancer cells could potentially increase cancer growth. We hypothesized that intraperitoneal administration of the combination of dual IFNs and autologous monocytes, a combination not previously tested, would lead to an anti-tumor response in ovarian cancer patients, and that this combination would be safe and well-tolerated.
In order to determine the safety and tolerability of this combination, we performed a phase I, dose escalation clinical trial in ovarian cancer patients with platinum-resistant or platinum-refractory disease. The primary objective was to determine the safety of the treatment and the recommended phase II dose (RP2D), or maximum tolerated dose (MTD). Four dose levels were enrolled, alternately escalating monocytes and IFN doses (Figure 3A). Patients underwent apheresis to collect mononuclear cells, and monocytes were enriched by elutriation20. On day 1 of each 28-day cycle, patients received intraperitoneal infusion of IFNα (25 or 250 mg) and IFNγ (5 or 50 mg), with or without their autologous monocytes (75 or 750 × 106 cells) (Figure 3A–B). Dose de-escalation was allowed if patients had completed the DLT period (one cycle) and continued to show clinical benefit. Excess monocytes were cryopreserved for later use and additional monocytes were collected in later cycles as needed. Before each cycle, patients underwent collection of peripheral blood for multi-parameter flow cytometry analysis of immune cell populations and cytokine profiling.
Figure 3: Design of first-in-human trial.
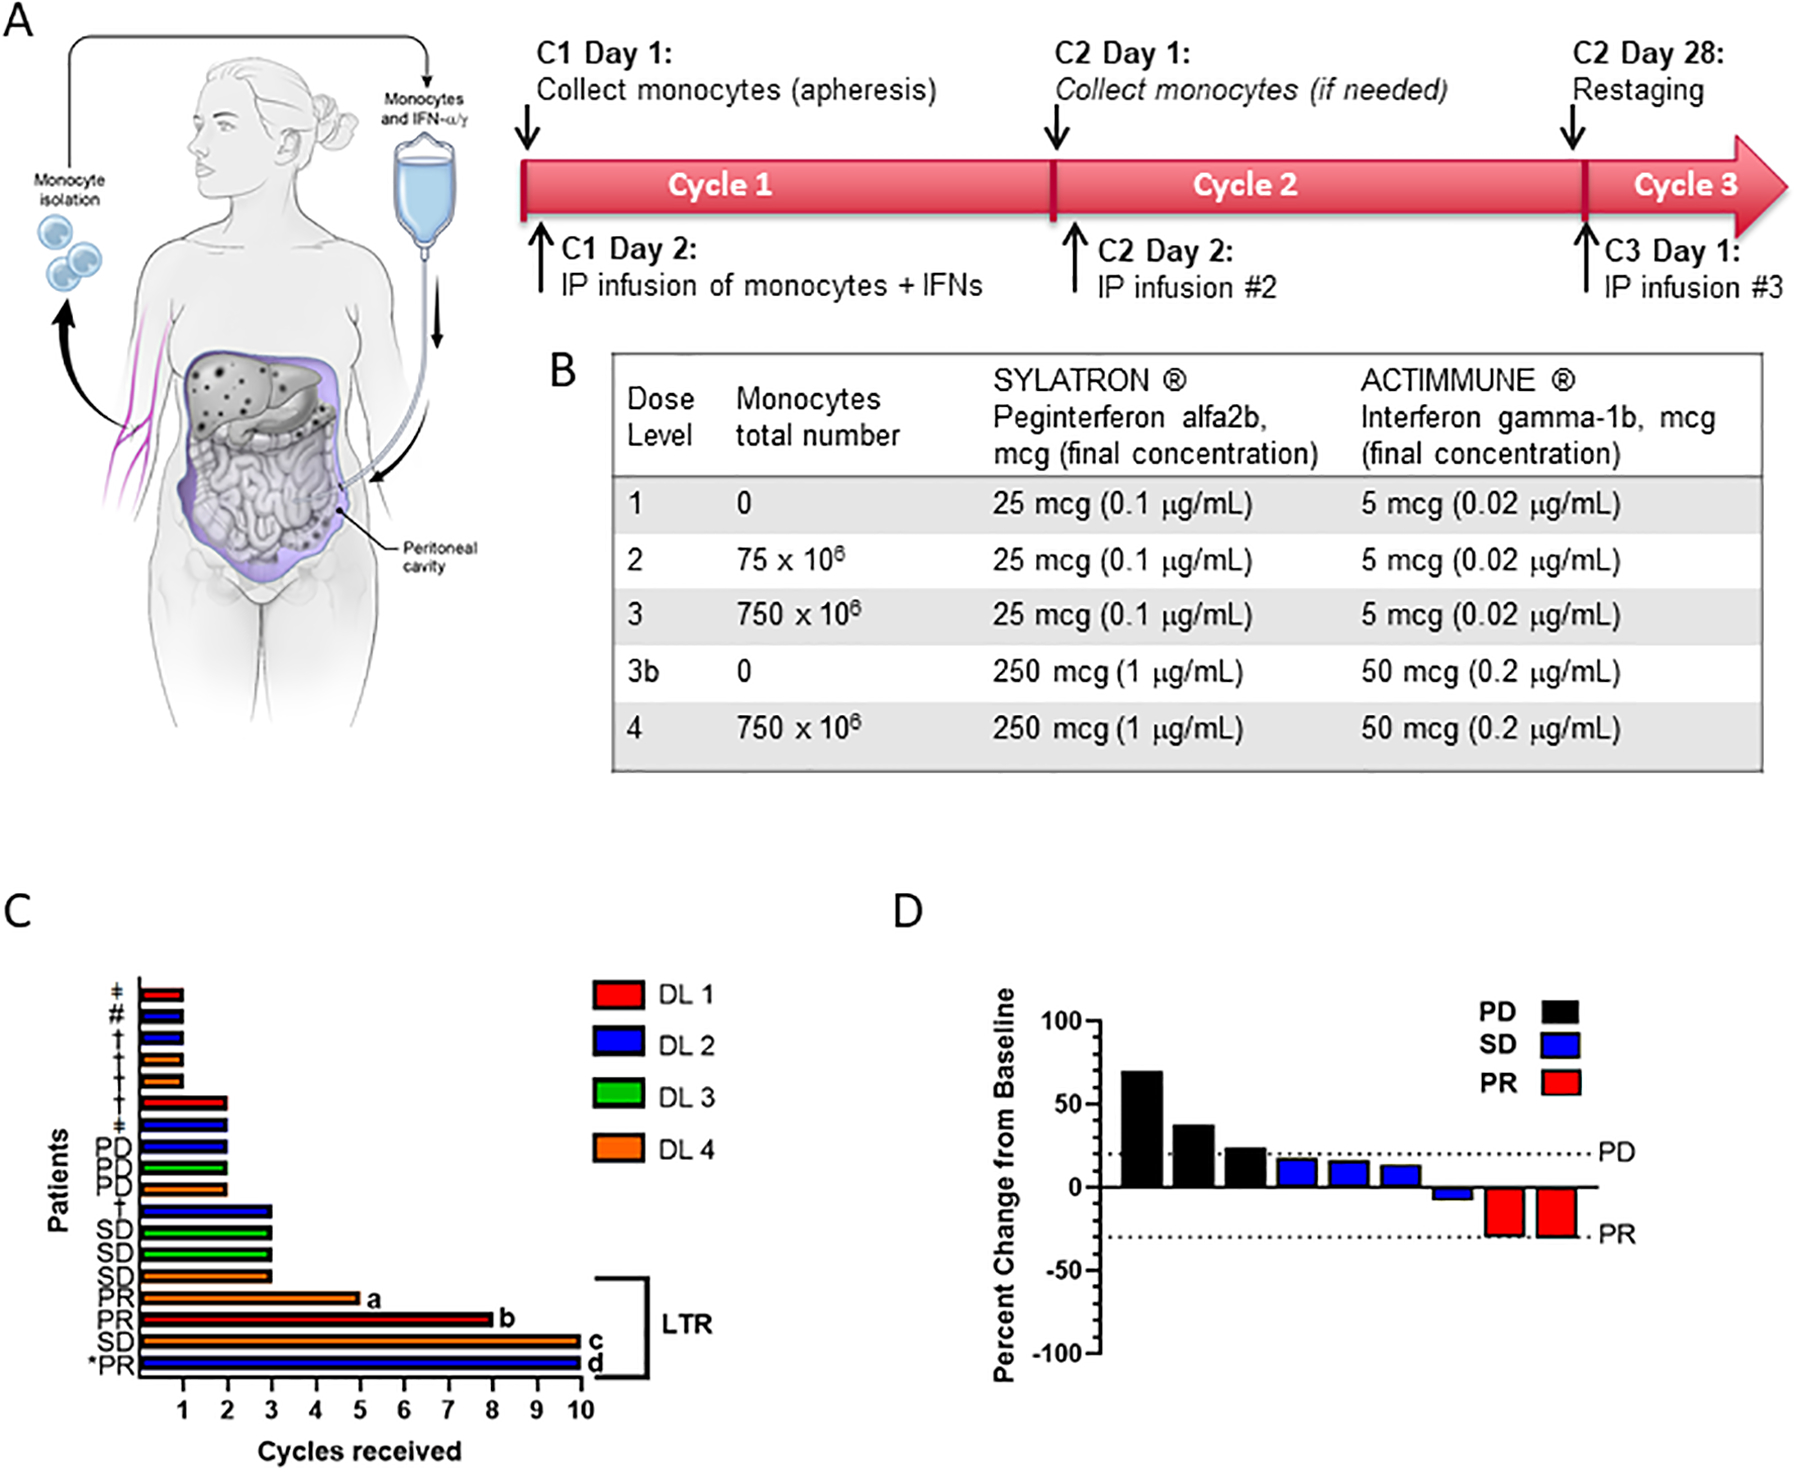
(A) Study schema. Prior to day −1, patients undergo placement of intraperitoneal catheter or surgically implanted intraperitoneal port. On day 1 of each cycle, autologous monocytes are collected by pheresis, quantified, and stored at 4 degrees Celsius overnight. On day 2, set quantities of monocytes are mixed with recombinant interferon-gamma and interferon-alpha approximately four hours before intraperitoneal administration. In subsequent cycles, additional monocytes are harvested as needed, but monocytes cryopreserved from the previous cycle may be used. Restaging is performed every other cycle. (B) Table indicates levels for dose escalation according to typical 3+3 study design. Dose level 3b was included as an optional “step-down” dose for patients at higher dose levels who were unable to tolerate repeat phereses or for whom sufficient quantities of monocytes could not be collected. (C) Swimmer plot illustrating time on study for all patients at all dose levels (n=18). Bars are color-coded to indicate dose level (DL) as indicated in the legend at right. Patients with a best response of PR, SD, or PD according to RECIST 1.1 are labelled. *PR denotes a CA-125 partial response according to GCIG criteria, † indicates clinical progression, ǂ indicates patient withdrew from study for other reasons (see description in results section), # indicates the single patient who discontinued treatment due to toxicity (grade 3 anemia). Bracket on right indicates the four longest patients on study, which are defined as long-term responders (LTR) for the purposes of further correlative analyses (see text and figure 4). (D) Percent change in tumor size from baseline.
Between February 2017 and June 2019, a total of 18 patients were enrolled and received one or more doses of treatment (Table 1), including 6 total patients at the RP2D, dose level 4 (DL4), corresponding to 250 mcg IFN-a, 50 mcg IFN-g, and 750 × 106 monocytes. Patients had epithelial ovarian or fallopian tube cancer histologies, with high-grade serous being the most common histology (n=12), and a variety of aggressive ovarian cancer morphologies represented. All patients had platinum-resistant disease. This was a heavily pre-treated population, with a median of 5 prior therapies received, ranging from 1 to 13 lines of prior therapy. In all, 83% of patients had previously received bevacizumab, including all six patients at the RP2D; 39% of patients had received treatment with a PARP inhibitor, and 17% had received treatment with an immune checkpoint inhibitor on a previous clinical trial.
Table 1.
Patient Demographics and Baseline Characteristics
| Characteristic/Demographic | DL1 (n=3) |
DL2 (n=6) |
DL3 (n=3) |
DL4 (n=6) |
All Patients (n=18) |
|---|---|---|---|---|---|
| ECOG, No. (%) | |||||
| 0 | 0 (0) | 2 (33.3) | 1 (33.3) | 3 (50) | 6 (33.3) |
| 1 | 3 (100) | 4 (66.7) | 2 (66.7) | 3 (50) | 12 (66.7) |
| Tumor Histology, No. (%) | |||||
| High grade serous | 3 (100) | 2 (33.3) | 2 (66.7) | 1 (16.7) | 8 (44.4) |
| High grade serous, primary peritoneal | 0 (0) | 1 (16.7) | 0 (0) | 0 (0) | 1 (5.6) |
| High grade papillary serous | 0 (0) | 1 (16.7) | 0 (0) | 2 (33.3) | 3 (16.7) |
| Mucinous | 0 (0) | 1 (16.7) | 0 (0) | 0 (0) | 1 (5.6) |
| Clear cell | 0 (0) | 1 (16.7) | 1 (33.3) | 0 (0) | 2 (11.1) |
| Clear cell papillary serous | 0 (0) | 0 (0) | 0 (0) | 1 (16.7) | 1 (5.6) |
| Poorly differentiated | 0 (0) | 0 (0) | 0 (0) | 1 (16.7) | 1 (5.6) |
| Carcinosarcoma | 0 (0) | 0 (0) | 0 (0) | 1 (16.7) | 1 (5.6) |
| Number of prior lines of therapy, median (range) | 4 (2–9) | 4 (1–9) | 6 (3–13) | 5 (3–8) | 5 (1–13) |
| CA-125, median (range) | NA (33.9->1500) | NA (49.8->1500) | NA (14->1500) | NA (14.8->1500) | NA (4.8->1500) |
| History of Bevacizumab, No. (%) | 2 (66.6) | 4 (66.7) | 3 (100) | 6 (100) | 15 (83.3) |
| History of immune checkpoint inhibitor, No. (%) | 0 (0) | 0 (0) | 3 (100) | 0 (0) | 3(17) |
| History of PARP inhibitor, No. (%) | 0 (0) | 2 (33.3) | 1 (33.3) | 4 (66.6) | 7 (38.9) |
Abbreviations: DL, dose level; ECOG, Eastern Cooperative Oncology Group Performance Status
Safety and Antitumor Activity
The combination treatment was generally well-tolerated. At the time of data cut-off in June 2019, all 18 patients had discontinued treatment. One patient had a peritoneal catheter which became dislodged after one cycle and was unable to be replaced, necessitating her removal from the study. An additional patient elected to stop receiving treatment after one cycle in order to pursue alternative therapy. Two of 16 patients initially assigned to dose levels with monocytes had difficulties tolerating apheresis, due to a combination of apheresis catheter discomfort and low levels of monocytes harvested, which necessitated frequent apheresis sessions. These two patients elected to step down to dose levels without monocytes (one from DL4 to DL3b after 2 apheresis procedures, one from DL2 to DL1 after 4 apheresis procedures) in order to continue receiving treatment.
Safety was evaluated in all patients (n=18). The most common toxicities of any grade were lymphocyte decrease (13/18 patients, 72.2%), anemia (9/18, 50%), fatigue (8/18, 44.4%), abdominal pain (6/18, 33.3%), nausea (5/18, 27.8%), and fever (4/18, 22%) (Table 2 and Supplemental Table 3). There were no grade 4 toxicities. The most common grade 3 toxicities were decreased lymphocyte count (6/18, 33.3%) and abdominal pain (2/18, 11.1%) (Table 2). There was one grade 3 skin infection, attributed to a peritoneal catheter, that resolved with appropriate antibiotic treatment and removal of the catheter. This patient subsequently underwent surgical implantation of an IP port and resumed treatment with no further complications. For patients with surgically implanted ports, there were no infectious or other port-related complications.
Table 2.
Treatment-Related Adverse Events (TRAEs)
| Toxicity | DL1 (n=3) | DL2 (n=6) | DL3 (n=3) | DL4 (n=6) | Gr3 or higher, No. (%) | Total, No. (%) |
|---|---|---|---|---|---|---|
| Anemia | 3 | 2 | 1 | 3 | 1/18 (5.6) | 9/18 (50) |
| Flashing lights | 0 | 1 | 0 | 0 | 0/18 (0) | 1/18 (5.6) |
| Abdominal distension | 0 | 0 | 0 | 1 | 0/18 (0) | 1/18 (5.6) |
| Abdominal pain | 3 | 1 | 0 | 2 | 2/18 (11.1) | 6/18 (33.3) |
| Gastroparesis | 0 | 0 | 1 | 0 | 0/18 (0) | 1/18 (5.6) |
| Nausea | 2 | 1 | 1 | 1 | 0/18 (0) | 5/18 (27.8) |
| Vomiting | 1 | 2 | 0 | 1 | 0/18 (0) | 4/18 (22.2) |
| Chills | 1 | 0 | 1 | 1 | 0/18 (0) | 3/18 (16.7) |
| Fatigue | 2 | 2 | 2 | 2 | 1/18 (5.6) | 8/18 (44.4) |
| Fever | 1 | 1 | 1 | 1 | 0/18 (0) | 4/18 (22.2) |
| Pain | 1 | 0 | 1 | 1 | 0/18 (0) | 3/18 (16.7) |
| Catheter related infection | 1 | 0 | 0 | 0 | 0/18 (0) | 1/18 (5.6) |
| Peritoneal infection | 1 | 0 | 0 | 0 | 1/18 (5.6) | 1/18 (5.6) |
| Skin infection | 1 | 1 | 1 | 0 | 1/18 (5.6) | 3/18 (16.7) |
| aPTT prolonged | 0 | 1 | 0 | 0 | 0/18 (0) | 1/18 (5.6) |
| AST increased | 0 | 0 | 1 | 0 | 0/18 (0) | 1/18 (5.6) |
| Lymphocyte count decreased | 3 | 4 | 2 | 4 | 6/18 (33.3) | 13/18 (72.2) |
| Platelet count decreased | 1 | 2 | 0 | 1 | 0/18 (0) | 4/18 (22.2) |
| White blood cell decreased | 0 | 1 | 0 | 1 | 0/18 (0) | 2/18 (11.1) |
| Anorexia | 1 | 0 | 0 | 0 | 0/18 (0) | 1/18 (5.6) |
| Creatinine increased | 1 | 1 | 0 | 0 | 0/18 (0) | 2/18 (11.1) |
| Hypermagnesemia | 0 | 0 | 0 | 1 | 0/18 (0) | 1/18 (5.6) |
| Hypoalbuminemia | 1 | 0 | 0 | 0 | 0/18 (0) | 1/18 (5.6) |
| Hypocalcemia | 1 | 1 | 0 | 0 | 0/18 (0) | 2/18 (11.1) |
| Hypokalemia | 0 | 2 | 0 | 2 | 1/18 (5.6) | 4/18 (22.2) |
| Hypomagnesemia | 2 | 1 | 0 | 0 | 0/18 (0) | 3/18 (16.7) |
| Hyponatremia | 2 | 0 | 0 | 1 | 0/18 (0) | 3/18 (16.7) |
| Hypophosphatemia | 1 | 0 | 0 | 2 | 0/18 (0) | 3/18 (16.7) |
| Arthralgia | 0 | 0 | 0 | 1 | 0/18 (0) | 1/18 (5.6) |
| Joint range of motion decreased | 0 | 0 | 1 | 0 | 1/18 (5.6) | 1/18 (5.6) |
| Neck pain | 0 | 0 | 1 | 0 | 0/18 (0) | 1/18 (5.6) |
| Facial nerve disorder | 1 | 0 | 0 | 0 | 0/18 (0) | 1/18 (5.6) |
| Hematoma | 0 | 1 | 0 | 0 | 0/18 (0) | 1/18 (5.6) |
| Hypotension | 0 | 0 | 0 | 1 | 0/18 (0) | 1/18 (5.6) |
| Night sweats/lightheadedness | 2 | 1 | 0 | 0 | 0/18 (0) | 3/18 (16.7) |
| Rash maculo-papular | 1 | 0 | 0 | 0 | 0/18 (0) | 1/18 (5.6) |
| Vascular disorders – Arterial Bleed | 0 | 1 | 0 | 0 | 0/18 (0) | 1/18 (5.6) |
Abbreviations: DL, Dose Level; Gr, grade; No., number
The only dose-limiting toxicity (DLT) occurred in a patient on DL 2 who developed grade 3 anemia and was discontinued for this reason. This dose level was subsequently expanded to 6 patients without an additional occurrence. The RP2D was determined to be the highest dose level tested, which was 250 mcg IFNα, 50 mcg IFNγ, and 750 × 106 monocytes.
Patients continued to be treated until they were unable to tolerate therapy or therapy was terminated due to either clinical or radiologic progression (Figure 3C). The mean number of cycles per patient administered was 3.2, with a range of 1 to 10 cycles. Four patients received 5 or more cycles (2 patients on the highest dose level, DL4, and one patient each on dose levels DL1 and DL2).
Because safety was the primary endpoint of this phase 1 clinical trial, RECIST measurable lesions were not a criterion for enrollment on study. In patients with RECIST measurable disease, response was determined as an exploratory endpoint (Figure 3D). The best response observed was a partial response (PR). Of the 9 patients with RECIST-measurable lesions, 2 had a PR, both with ≥30 percent decrease in target lesion size. Four patients had stable disease, and 3 had progressive disease as best response. In addition, one patient with primary peritoneal cancer whose disease burden was not quantifiable by RECIST criteria had a CA-125 response according to GCIG criteria21, with CA-125 decreasing from 124 U/mL to a nadir of 31.5 U/mL after one cycle of treatment. Notably this patient remained on treatment for 10 cycles, before treatment was discontinued due to clinical progression. In addition to the 3 patients with radiologic progression, a total of 5 patients were taken off study due to clinical progression. Overall, these results indicate that treatment was safe and well-tolerated, with evidence of clinical activity.
IFN treatment results in upregulation of TRAIL in patient monocytes and increased proinflammatory cytokines in peripheral blood
Our preclinical data implicated TRAIL as a primary mediator of antitumor effect of IFN-activated monocytes in preclinical studies. To determine if TRAIL was upregulated in our clinical trial patients’ monocytes, we performed RT-PCR on the IFN-treated monocytes from the infusion product of each individual patient and compared with the same patient’s untreated monocytes (Fig 4A). Importantly, TRAIL was consistently up-regulated in the IFN-treated product by a median of 178% (p<0.05). Other markers of IFN-pathway activation, namely STAT1 and STAT2, showed a strong trend of upregulation in every individual patient’s IFN-treated monocytes. The data confirm TRAIL production in the phase I trial and suggest that IFN signal response machinery was activated in the monocytes administered to the patients.
Figure 4: Effects of IFN treatment on immunologic parameters in monocytes and peripheral blood.
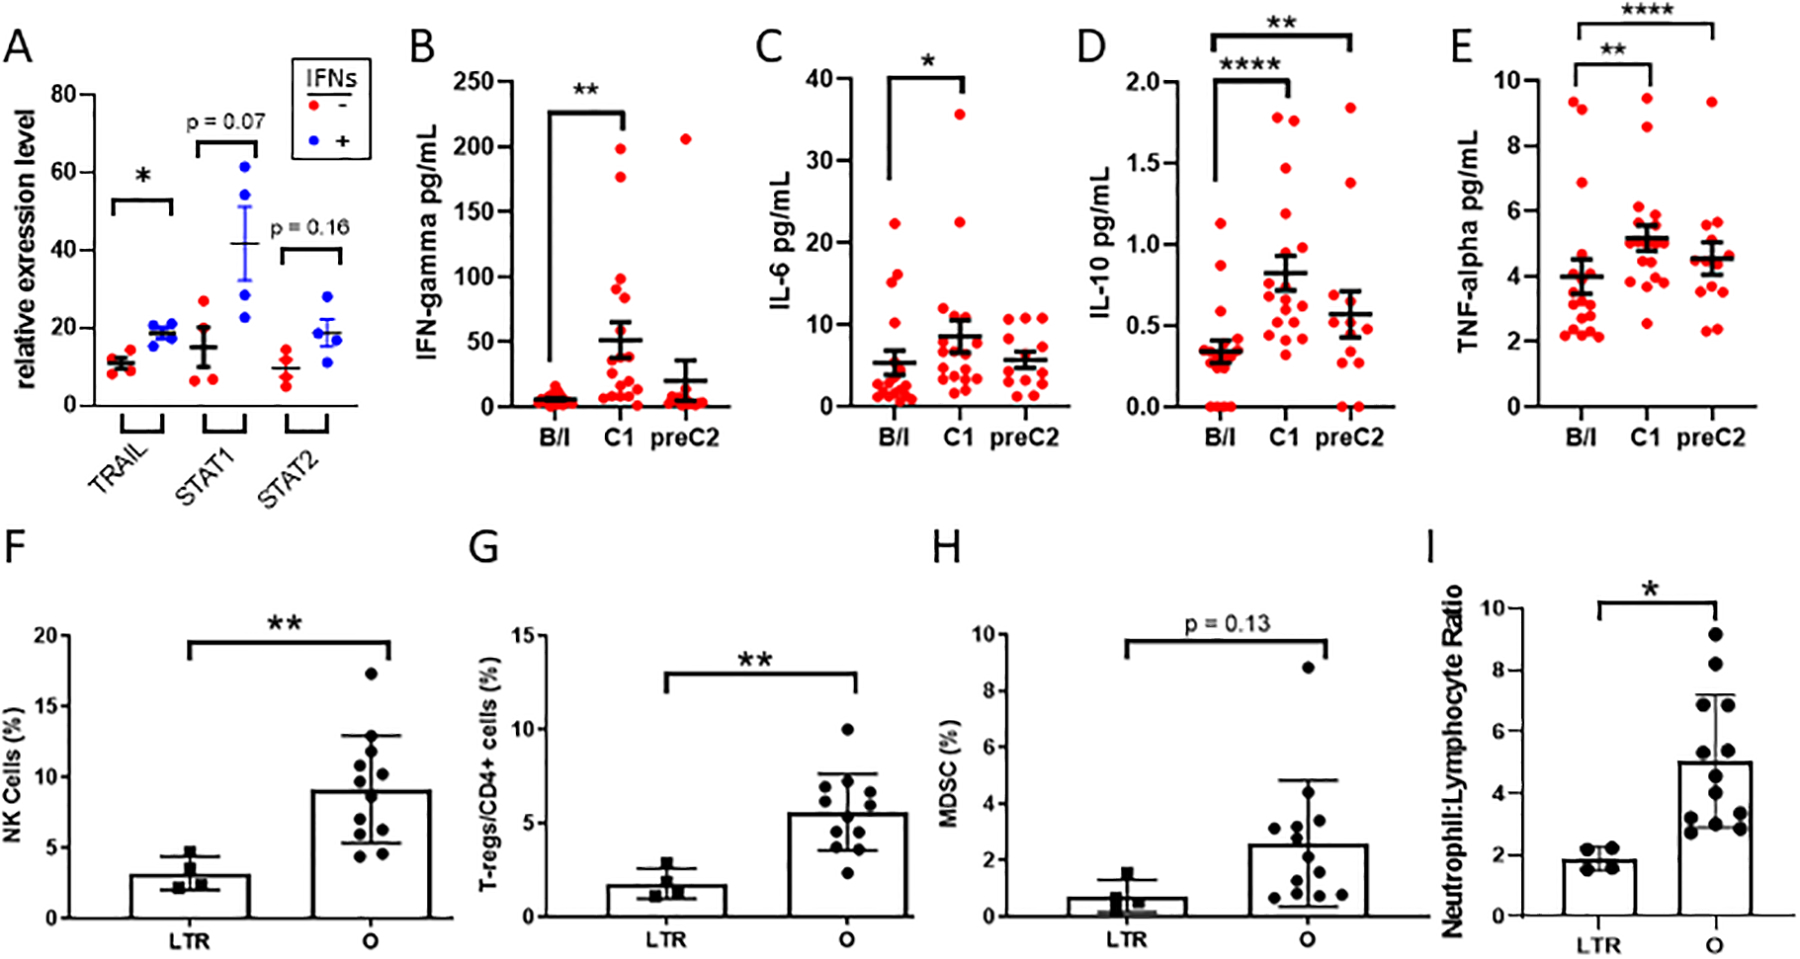
(A) Total mRNA was derived from elutriated patient monocytes (Monocytes) or IFN-treated product (Monocytes + IFN) and RT-PCR was performed for the indicated mRNAs. (B-E) Cytokines secreted by activated monocytes were measured at baseline (b/l), 3–5 days after administration of treatment (C1), and immediately before second cycle of treatment (C2) by multiplex ELISA-based proinflammatory cytokine panel. (F-H) Peripheral blood mononuclear cells were isolated at baseline and immunophenotyped by flow cytometry. Long-term responders (LTR) were compared to all other patients (O) for frequency of Natural Killer (NK) cells, T-regulatory (Treg) cells,, and myeloid-derived suppressor (MDSC) cells. (I) Comparison of baseline neutrophil to lymphocyte ratio by manual cell differential in long-term responders versus others. * p<0.05, **p<0.01, ****p<0.001 by paired two-tailed t-test (A-E) or unpaired two-tailed t-test (F-I).
We asked whether this intraperitoneal therapy resulted in detectable anti-IFN antibodies in plasma, since prior studies have shown that administration of intravenous IFNs in patients with melanoma resulted in formation of potentially neutralizing antibodies22,23. Plasma samples were collected from all 18 patients at baseline and before the last cycle of treatment received (range 2–10 cycles). ELISA was performed for both anti-IFNγ and anti-IFNα antibodies compared to positive control WHO antibodies and negative control sera from healthy age-matched donors. No anti-IFN antibodies were detected either at baseline or after maximal exposure (Supplemental Figure 5A-B).
We next sought to determine if intraperitoneal treatment exerted systemic effects. Activation of monocytes by IFNs leads to the production of multiple proinflammatory cytokines24. Here, we profiled cytokines in peripheral blood at baseline, 3–5 days after administration of cycle 1 of treatment, and before administration of cycle 2 using a 10-plex cytokine array. Interestingly, intraperitoneal treatment with monocytes and IFNs led to a marked increase in multiple cytokines associated with monocyte activation, including an 8.8-fold upregulation of IFNγ itself. We also measured a 60% increase in interleukin-6 (IL-6), a 2.4-fold increase in interleukin-10 (IL-10), and 30% increase in tumor necrosis factor alpha (TNFα), (Figure 4B–E). No adverse events were observed that correlated with this increase in IL-6. This elevation persisted throughout the cycle, as levels of IL-10 and TNFα remained significantly elevated above baseline at the pre-C2 timepoint. The cytokine profile of response to monocytes and IFNs in the peripheral blood is consistent with the preclinical data and suggests priming of the immune system towards an anti-tumor environment.
Long-term responders have lower baseline Tregs, MDSC, and neutrophil to lymphocyte ratio
In order to further understand the immunophenotypic effects of this treatment regimen and correlate these with response, we profiled immune cells from peripheral blood from the best responders, i.e. patients who remained on therapy for five or more cycles. Peripheral blood mononuclear cells (PBMCs) at baseline were analyzed by flow cytometry to compare long-term responders (>5 cycles, LTR) to the remaining patients for approximately 100 immune subsets involved in both innate and adaptive immunity (Supplemental Table 4). Compared to the others, LTRs had approximately one-third as many natural killer (NK, defined as CD3-, CD56+) and again one-third as many immunosuppressive T-regulatory (T-reg, defined as percent CD25+FoxP3+CD127lo/CD3+CD4+) cells at baseline compared to the other patients (p<0.01 for both). The LTRs also trended toward a lower baseline number of myeloid-derived suppressor cells (MDSCs, defined as percent CD33+/CD11b+HLA-DR-) (Figure 4F–H). The long-term responders had a 65% lower baseline neutrophil-to-lymphocyte ratio (NLR) in peripheral blood (Figure 4I, p<0.05), a finding that has been previously correlated with better antitumor immunity and prognosis in ovarian cancer25–27 and other solid tumors. This pattern of cellular phenotypes suggests that LTRs have a discernible pattern of immune cells in their peripheral blood at baseline, potentially predisposing them to a more favorable response to immunotherapy.
Long-term responders develop increased levels of classical monocytes and MDSCs over time
We then identified systemic differences over time which might correlate either with longer-term effects of therapy or with eventual disease progression. Importantly, there was no change in numbers of total monocytes in peripheral blood either by flow cytometry (Figure 5A) or by manual differential (Supplemental Figure 6). There was no effect of therapy on monocyte differentiation in peripheral blood at the early time point (3–5 days after cycle 1 administration; data not shown). Notably, all four LTRs initially had very high percentages (14.3–22.4%) of non-classical monocytes (CD14-CD16+ monocytes, for full gating see figure legend) at baseline. Upon initiation of treatment, the percentage of non-classical monocytes subsequently decreased below 8% in each of these participants (Figure 5B), and there was a corresponding increase in classical monocytes (CD14+ CD16− monocytes) over time, reaching >57% (Figure 5C). Similarly, we noted an increase in MDSCs (defined as CD33+/CD11b+HLA-DR-) at the time of disease progression, with 4/4 long-term responders having a marked increase in MDSCs at progression compared with baseline (2.7–25-fold increase, Figure 5D–F).
Figure 5: Long-term responders develop increased levels of classical monocytes and MDSCs over time.
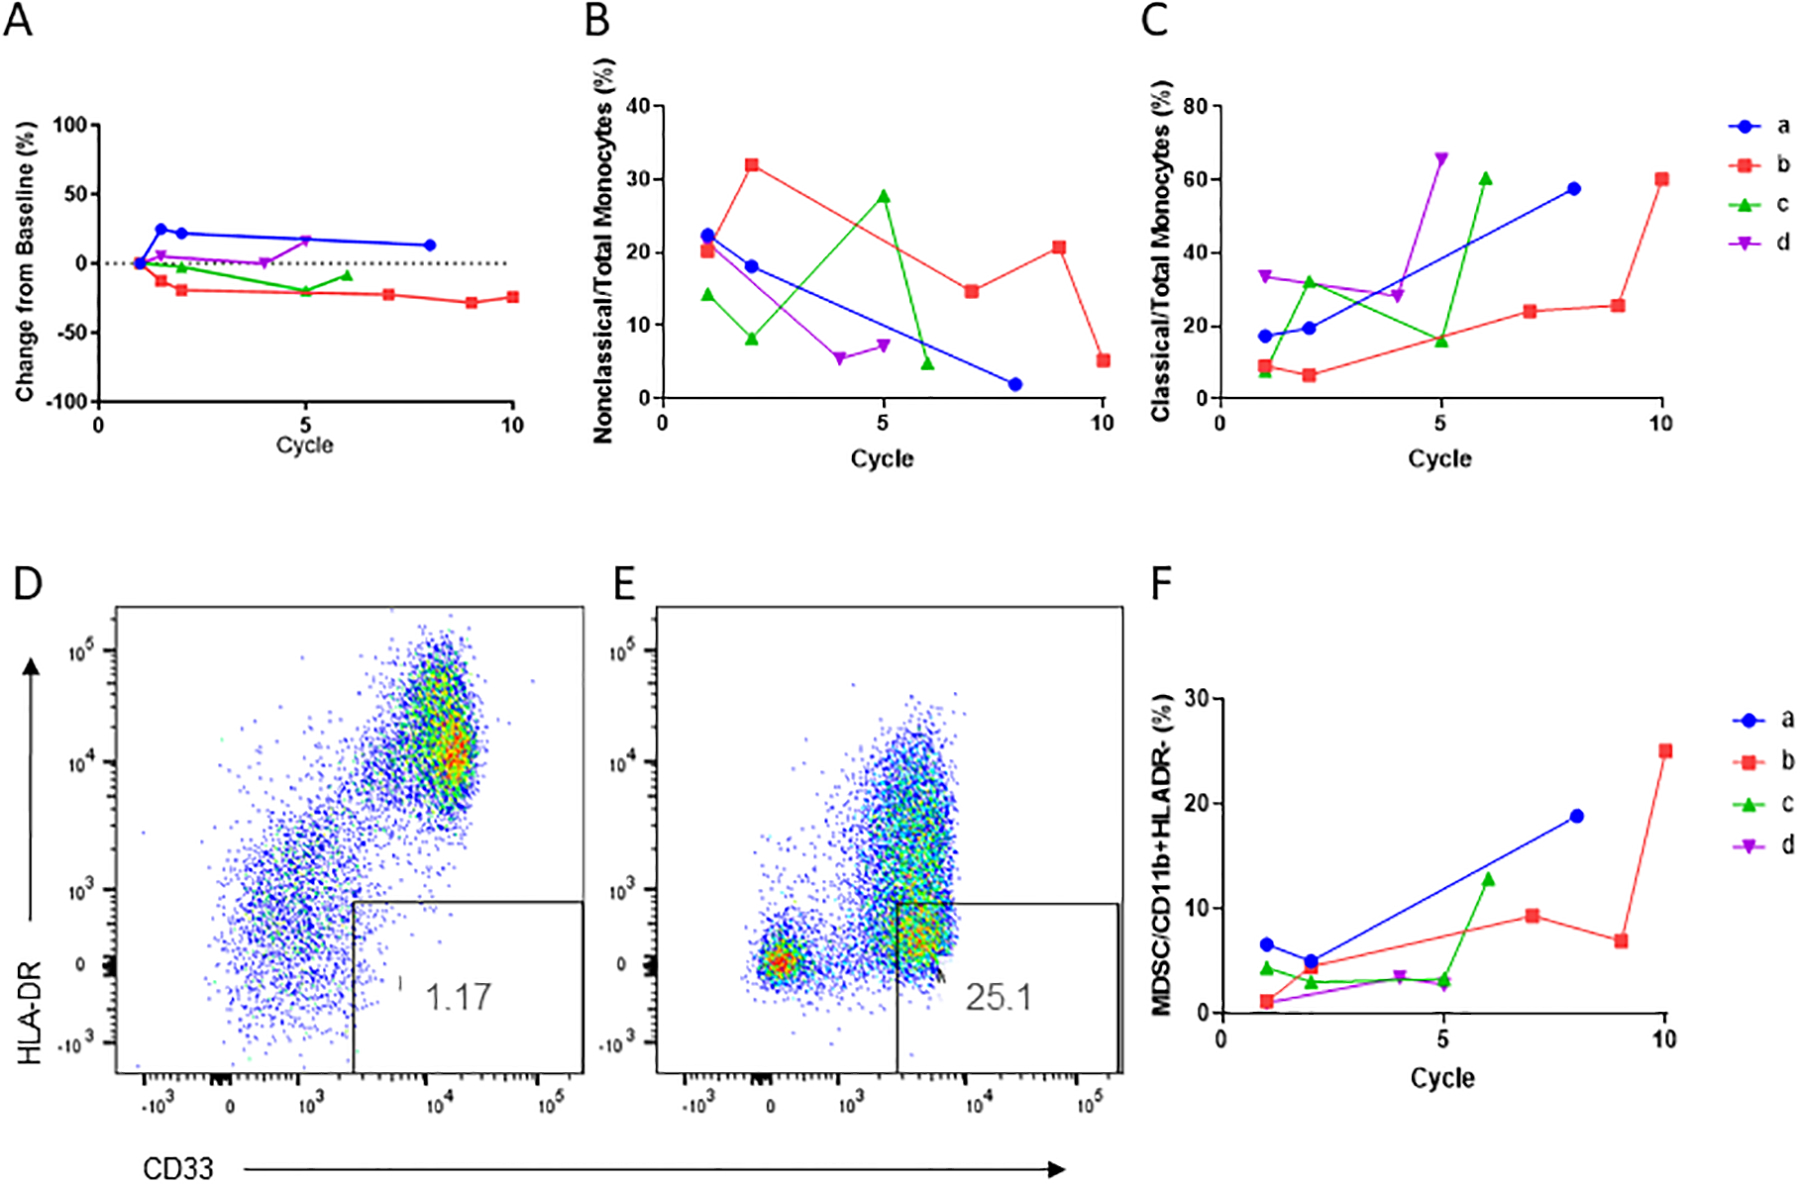
(A) Total peripheral blood monocytes as percentage of live cells for the four long-term responders over time. (B) Nonclassical and (C) Classical peripheral blood monocytes for the four long-term responders (LTR) over time. Data shown as percentage of all monocytes, p<0.05 for percentage of nonclassical or classical monocytes at progression versus baseline by paired t-test. (D-E) Flow cytometry dotplots of percentage of myeloid derived suppressor cells at baseline (D) and before cycle 10 of treatment (E) for LTR patient 2. (F) Percentage of myeloid derived suppressor cells in all four long-term responders over time (p=0.08 for percentage of MDSCs at progression versus baseline by paired t-test).
Discussion
We present preclinical data and a first-in-human clinical trial characterizing the therapeutic mechanism, safety, and tolerability of the combination of intraperitoneal IFNα, IFNγ, and autologous monocytes in ovarian cancer. This combination of innate immune system directed therapy has not been previously tested. Current immunotherapies predominantly focus on the adaptive immune system, with the intent of enhancing T cell activity against cancer, predominantly by blocking immune checkpoints28.
In our preclinical experiments, we characterize the mechanism of tumor cell killing by IFN activated monocytes as being largely dependent on direct contact between TRAIL, a type II membrane protein which is potently upregulated on monocytes by IFN treatment, and the death receptors DR 4/5 on tumor cells. This contact results in caspase-8-dependent apoptosis of the tumor cell via the extrinsic pathway. Previous attempts to activate the TRAIL pathway in cancer therapy have used synthetic TRAIL or agonist antibodies of TRAIL receptors. These were unsuccessful clinically due to short half-life of the synthetic protein or inability of agonist antibodies to form oligomers of the receptors29,30. The ability of IFNs to upregulate endogenous TRAIL on monocytes potentially provides a more stable and physiologic means to activate death receptors in cancer cells.
We then demonstrate the therapeutic potential of this cellular anti-cancer using a cell culture system in which IFN-activated monocytes from ovarian cancer patients were fully capable of killing ovarian cancer cells, as well as in a in a mouse model of ovarian cancer, in which a single IP injection of human monocytes and IFNs resulted in a survival advantage. Because of the dispersion of cells after injecting tumor cells intraperitoneally and the rapid onset of disease burden in our mouse model, tumor tissue was unable to be collected to assess monocyte infiltration and differentiation in vivo. Future studies will incorporate intra-ovarian bursal injections of ovarian cancer tumor cells to assay for monocyte infiltration and differentiation. Furthermore, we plan to implement multiple IP injections and various dosing schedules of human monocytes and IFNs in future in vivo models, so that tumor infiltration of monocytes can be quantified.
Our resulting phase I study successfully determined the safety and tolerability of the combination of intraperitoneal pegylated IFNα, IFNγ, plus autologous monocytes in women with platinum-resistant or refractory ovarian cancer. When designing this study, we took into account the preclinical data suggesting the necessity for direct contact between the activated monocytes and the cancer cells, and therefore chose the intraperitoneal administration route. Ovarian cancer predominantly occurs in the peritoneal cavity, with metastases outside the abdomen occurring in less than half of patients, and at a median of 6 years later than abdominal recurrences31. Intraperitoneal chemotherapy has been successfully delivered to patients and can improve survival when delivered in the adjuvant setting3–5. In this trial we used a similar approach to the delivery of the study agents to the peritoneal cavity, in most cases using an indwelling port to administer cells and IFNs, followed by saline flush and physical rotation of the patient. The overall approach can be standardized and administered in an institution with capabilities for both intraperitoneal port placement and elutriation of monocytes from apheresis products.
The treatment regimen was well-tolerated and permitted repeat dosing at the RP2D of 250 mcg IFNα, 50 mcg IFNγ, and 750 × 106 monocytes, thus allowing for this to be a platform on which to build more targeted immunotherapy for women with ovarian cancer. The most common adverse events observed were expected based on previous trials of individual IFNs and included hematologic toxicities as well as abdominal discomfort and nausea. There was not a clear decrease in tolerability or increase in adverse events at the higher dose levels. There were no grade 4 or grade 5 toxicities, and the most common grade 3 toxicities were decreased lymphocyte count and abdominal discomfort. These toxicities are comparable to previous reports of intraperitoneally-delivered cellular or chemotherapies32–38.
The combination displayed preliminary evidence of antitumor activity, with 2/9 measurable patients experiencing a partial response, 5/9 with stable disease, and 3/9 with progressive disease by RECIST criteria. One additional patient with peritoneal lesions not measurable by RECIST had a CA-125 response by GCIG criteria, with a greater than 50% decrease in CA-125. This was a heavily pretreated population with a median of 5 prior treatment regimens. In this clinical setting, responses are rare (<20%) and durations of response are brief (under 6 months). A larger number of patients will be needed to more accurately quantify the response rate of this regimen, and an expansion cohort is planned at the RP2D. As an indication of both tolerability and therapeutic activity, four patients were able to remain on this regimen for five or more cycles, and two completed ten cycles of treatment.
We performed correlative biomarker studies to further understand the immunologic effects of this regimen as well as to provide information for development of future combination therapies. Importantly, the therapy did not result in the formation of detectable anti-IFN antibodies even with up to ten cycles of treatment. This may be due to the IP delivery of the IFNs, in contrast to prior studies where they were administered intravenously.
Corroborating our preclinical mechanistic data, RT-PCR on the therapeutic product demonstrated upregulation of TRAIL and other IFN-regulated genes. Cytokine array of peripheral blood additionally revealed that multiple cytokines secreted by activated monocytes were increased by therapy, including TNFα, IFNγ, and IL-10. This is important to note, given that the IFNs and activated monocytes were administered to the peritoneal cavity, yet retained the ability to influence the systemic immune system.
Our comprehensive analysis of immune subsets in peripheral blood also provides insight into the wide-reaching effects of this therapeutic approach, and its effect on both innate and adaptive immunity. Interestingly, compared with non-responders, long-term responders to therapy had at baseline a lower percentage of NK cells and T-regs, a lower neutrophil-to-lymphocyte ratio, and a trend toward lower MDSCs. In particular, the lower frequency of T-regs and MDSCs in the patients who had clinical benefit may indicate a more favorable and less immunosuppressive tumor microenvironment at baseline, thus facilitating the therapeutic effect of this innate immune cell-based therapy in those patients. Consistent with this idea, these patients were noted to have a rise in MDSC at the time of progression, suggesting a switch to a more immune suppressive environment. These findings warrant evaluation in future studies as possible predictive biomarkers of response to therapy, and as potential targets to increase the anti-cancer activity of this combination.
Additionally, there was a shift in monocyte differentiation in peripheral blood of long-term responders over time, with an increase in classical monocytes and decrease in nonclassical monocytes, as well as an increase in MDSCs. The changes measured in peripheral blood suggest that the intraperitoneal administration of the IFNs was able to influence the immune system more broadly. IFN treatment may skew differentiation of monocytes toward non-classical monocytes, which preferentially differentiate into activated macrophages and dendritic cells with cytotoxic and antitumorigenic functions39–41. In contrast, immunosuppression in the tumor microenvironment or chronic inflammation can induce formation and/or release from the bone marrow of classical monocytes instead, which have many protumorigenic functions including suppression of T cell function and recruitment of Tregs41. Because these changes were observed to correlate with eventual clinical progression, it is possible that these represent markers of immunologic tolerance and disease progression, since both MDSCs and classical monocytes can be associated with a protumorigenic microenvironment.
Importantly, the immunologic findings that we describe in peripheral blood may not capture more extensive and complex changes in the tumor microenvironment itself. For example, classical monocytes can become immunosuppressive by differentiating into tumor-associated or M2-like macrophages in the tumor, which in turn have pleiotropic suppressive effects on both innate and adaptive immune cell populations42, and may additionally directly facilitate the formation of ovarian cancer stem cells in the tumor itself43,44. Likewise, MDSCs are detectable in peripheral blood but are generally present in much larger numbers in the tumor microenvironment, to which they are recruited by the tumor secreting multiple cytokines and chemokines45–47. In our planned expansion cohort, it will be important to determine the effect of monocytes and IFNs on the tumor microenvironment via biopsies and extensive immunophenotyping of tumor and/or ascites. If the higher T regs, NK cells and MDSCs that we measured in the non-responding patients are corroborated in the tumor microenvironment in larger numbers of patients, they suggest a role for combination with therapeutic agents targeting MDSCs and/or tumor-associated macrophages in order to improve outcomes for these women48,49.
In summary, these data demonstrate the feasibility of repeated intraperitoneal administration of the combination of 250 mcg pegIFNα−2b, 50 mcg IFNγ−1b, and 750 × 106 monocytes. The combination is well tolerated with potential antitumor activity, and we have characterized the TRAIL/DR4/5 dependent mechanism of this therapy. Future studies will further determine the activity of this regimen as well as the immunologic effects on the tumor microenvironment. We will incorporate analysis of immunophenotypes and tumor characteristics such as DR4/DR5 expression at baseline that correlate with favorable response as well as later changes corresponding to clinical progression. Such studies will aid in future explorations of combination therapies. Our data set the stage for further investigation of this IP monocyte and IFN regimen as an innate immunity “scaffold” with the potential to be combined with additional therapies targeting key components of the immune system in order to achieve the greatest possible antitumor response.
Supplementary Material
Statement of Significance.
Overall survival for advanced ovarian cancer remains poor, particularly for women with platinum-resistant disease. We report the bench to bedside development of a novel cytokine-stimulated autologous monocyte therapy for advanced, platinum-resistant or -refractory ovarian cancer. Activated monocytes killed tumor cells in mice via a TRAIL-dependent pathway. Treatment was well tolerated and produced partial responses by RECIST criteria. These findings characterize the mechanism of a novel cellular immunotherapy for ovarian cancer which is well tolerated with evidence of clinical activity in a heavily pretreated patient population. This therapy may serve as the backbone for a combination immunotherapy regimen incorporating additional agents targeting T-regulatory cells and/or myeloid-derived suppressor cells (MDSCs).
Acknowledgments
The authors are most grateful to all our patients who participated in this clinical trial, as well as our excellent research nurses and nurse practitioners, clinic volunteers, study coordinators, medical oncology fellows, and support staff. Special thanks to Patricia Steeg, PhD for her invaluable and expert guidance in formulating this manuscript. This work is dedicated to the memory of Samuel Baron, MD.
Acknowledgment of research support for the study:
This research was supported by the Intramural Research Program of the Center for Cancer Research, National Cancer Institute, National Institutes of Health (ZIA BC 011584); Merck (drug only, Sylatron™); Horizon (drug only, Actimmune™). This project was also funded in part with federal funds from the National Cancer Institute, National Institutes of Health, under Contract No. 75N910D00024, Task Order No., Task Order No. 75N91019F00129. The content of this publication does not necessarily reflect the views or policies of the Department of Health and Human Services, nor does mention of trade names, commercial products, or organizations imply endorsement by the U.S. Government.
Footnotes
Conflict of Interest Statement
The authors declare no potential conflicts of interest.
References
- 1.Torre LA, Trabert B, DeSantis CE, Miller KD, Samimi G, Runowicz CD. Ovarian cancer statistics, 2018. CA Cancer J Clin. 2018;68(4):284–296. [DOI] [PMC free article] [PubMed] [Google Scholar]
- 2.Amate P, Huchon C, Dessapt AL, Bensaid C, Medioni J, Le Frère Belda MA. Ovarian cancer: sites of recurrence. Int J Gynecol Cancer J Int Gynecol Cancer Soc. 2013;(v;23(9):1590–6). [DOI] [PubMed] [Google Scholar]
- 3.Alberts DS, Liu PY, Hannigan EV, O’Toole R, Williams SD, Young JA. Intraperitoneal cisplatin plus intravenous cyclophosphamide versus intravenous cisplatin plus intravenous cyclophosphamide for stage III ovarian cancer. N Engl J Med. 1996;26;335(26):1950–5. [DOI] [PubMed] [Google Scholar]
- 4.Markman M, Bundy BN, Alberts DS, Fowler JM, Clark-Pearson DL, Carson LF. Phase III trial of standard-dose intravenous cisplatin plus paclitaxel versus moderately high-dose carboplatin followed by intravenous paclitaxel and intraperitoneal cisplatin in small-volume stage III ovarian carcinoma: an intergroup study of the Gynecologic Oncology Group. Southwest Oncol Group East Coop Oncol Group J Clin Oncol J Am Soc Clin Oncol. 2001;Feb 15;19(4):1001–7. [DOI] [PubMed] [Google Scholar]
- 5.Armstrong DK, Bundy B, Wenzel L, Huang HQ, Baergen R, Lele S. Intraperitoneal cisplatin and paclitaxel in ovarian cancer. N Engl J Med. 2006;5;354(1):34–43. [DOI] [PubMed] [Google Scholar]
- 6.van Driel WJ, Koole SN, Sikorska K, et al. Hyperthermic Intraperitoneal Chemotherapy in Ovarian Cancer. N Engl J Med. 2018;378(3):230–240. doi: 10.1056/NEJMoa1708618 [DOI] [PubMed] [Google Scholar]
- 7.Maiorano BA, Maiorano MFP, Lorusso D, Maiello E. Ovarian Cancer in the Era of Immune Checkpoint Inhibitors: State of the Art and Future Perspectives. Cancers. 2021;13(17):4438. doi: 10.3390/cancers13174438 [DOI] [PMC free article] [PubMed] [Google Scholar]
- 8.Murray PJ, Allen JE, Biswas SK, et al. Macrophage activation and polarization: nomenclature and experimental guidelines. Immunity. 2014;41(1):14–20. doi: 10.1016/j.immuni.2014.06.008 [DOI] [PMC free article] [PubMed] [Google Scholar]
- 9.Baron S, Hernandez J, Bekisz J, et al. Clinical model: interferons activate human monocytes to an eradicative tumor cell level in vitro. J Interferon Cytokine Res Off J Int Soc Interferon Cytokine Res. 2007;27(2):157–163. doi: 10.1089/jir.2006.0083 [DOI] [PubMed] [Google Scholar]
- 10.Baron S, Finbloom J, Horowitz J, et al. Near eradication of clinically relevant concentrations of human tumor cells by interferon-activated monocytes in vitro. J Interferon Cytokine Res Off J Int Soc Interferon Cytokine Res. 2011;31(7):569–573. doi: 10.1089/jir.2010.0153 [DOI] [PMC free article] [PubMed] [Google Scholar]
- 11.Nakashima H, Miyake K, Clark CR, et al. Potent antitumor effects of combination therapy with IFNs and monocytes in mouse models of established human ovarian and melanoma tumors. Cancer Immunol Immunother CII. 2012;61(7):1081–1092. doi: 10.1007/s00262-011-1152-x [DOI] [PMC free article] [PubMed] [Google Scholar]
- 12.Johnson CL, Green DS, Zoon KC. Human monocytes in the presence of interferons alpha2a and gamma are potent killers of serous ovarian cancer cell lines in combination with paclitaxel and carboplatin. J Interferon Cytokine Res Off J Int Soc Interferon Cytokine Res. 2015;35(1):55–62. doi: 10.1089/jir.2014.0057 [DOI] [PMC free article] [PubMed] [Google Scholar]
- 13.Gordon S, Taylor PR. Monocyte and macrophage heterogeneity. Nat Rev Immunol. 2005;5(12):953–964. doi: 10.1038/nri1733 [DOI] [PubMed] [Google Scholar]
- 14.Van Opdenbosch N, Lamkanfi M. Caspases in Cell Death, Inflammation, and Disease. Immunity. 2019;50(6):1352–1364. doi: 10.1016/j.immuni.2019.05.020 [DOI] [PMC free article] [PubMed] [Google Scholar]
- 15.Yang A, Wilson NS, Ashkenazi A. Proapoptotic DR4 and DR5 signaling in cancer cells: toward clinical translation. Curr Opin Cell Biol. 2010;22(6):837–844. doi: 10.1016/j.ceb.2010.08.001 [DOI] [PubMed] [Google Scholar]
- 16.Sanda C, Weitzel P, Tsukahara T, et al. Differential gene induction by type I and type II interferons and their combination. J Interferon Cytokine Res Off J Int Soc Interferon Cytokine Res. 2006;26(7):462–472. doi: 10.1089/jir.2006.26.462 [DOI] [PubMed] [Google Scholar]
- 17.Kirshner JR, Karpova AY, Kops M, Howley PM. Identification of TRAIL as an Interferon Regulatory Factor 3 Transcriptional Target. J Virol. 2005;79(14):9320–9324. doi: 10.1128/JVI.79.14.9320-9324.2005 [DOI] [PMC free article] [PubMed] [Google Scholar]
- 18.Reis CR, van der Sloot AM, Natoni A, et al. Rapid and efficient cancer cell killing mediated by high-affinity death receptor homotrimerizing TRAIL variants. Cell Death Dis. 2010;1(10):e83. doi: 10.1038/cddis.2010.61 [DOI] [PMC free article] [PubMed] [Google Scholar]
- 19.Green DS, Nunes AT, Tosh KW, David-Ocampo V, Fellowes VS, Ren J. Production of a cellular product consisting of monocytes stimulated with Sylatron® (Peginterferon alfa-2b) and Actimmune® (Interferon gamma-1b) for human use. J Transl Med. 2019;14;17(1):82. [DOI] [PMC free article] [PubMed] [Google Scholar]
- 20.Green DS, Nunes AT, David-Ocampo V, Ekwede IB, Houston ND, Highfill SL. A Phase 1 trial of autologous monocytes stimulated ex vivo with Sylatron® (Peginterferon alfa-2b) and Actimmune® (Interferon gamma-1b) for intra-peritoneal administration in recurrent ovarian cancer. J Transl Med. 2018;16;16(1):196. [DOI] [PMC free article] [PubMed] [Google Scholar]
- 21.Rustin GJS, Vergote I, Eisenhauer E, et al. Definitions for response and progression in ovarian cancer clinical trials incorporating RECIST 1.1 and CA 125 agreed by the Gynecological Cancer Intergroup (GCIG). Int J Gynecol Cancer Off J Int Gynecol Cancer Soc. 2011;21(2):419–423. doi: 10.1097/IGC.0b013e3182070f17 [DOI] [PubMed] [Google Scholar]
- 22.Davis-Daneshfar A, Böni R, von Wussow P, Joller H, Burg G, Dummer R. Adjuvant immunotherapy in malignant melanoma: impact of antibody formation against interferon-alpha on immunoparameters in vivo. J Immunother Hagerstown Md 1997. 1997;20(3):208–213. doi: 10.1097/00002371-199705000-00006 [DOI] [PubMed] [Google Scholar]
- 23.Fierlbeck G, Schreiner T, Schaber B, Walser A, Rassner G. Neutralizing interferon β antibodies in melanoma patients treated with recombinant and natural interferon β. Cancer Immunol Immunother. 1994;39(4):263–268. doi: 10.1007/BF01525990 [DOI] [PMC free article] [PubMed] [Google Scholar]
- 24.Schroder K, Hertzog PJ, Ravasi T, Hume DA. Interferon-γ: an overview of signals, mechanisms and functions. J Leukoc Biol. 2004;75(2):163–189. doi: 10.1189/jlb.0603252 [DOI] [PubMed] [Google Scholar]
- 25.Williams KA, Labidi-Galy SI, Terry KL, et al. Prognostic significance and predictors of the neutrophil-to-lymphocyte ratio in ovarian cancer. Gynecol Oncol. 2014;132(3):542–550. doi: 10.1016/j.ygyno.2014.01.026 [DOI] [PMC free article] [PubMed] [Google Scholar]
- 26.Zhou Q, Hong L, Zuo MZ, He Z. Prognostic significance of neutrophil to lymphocyte ratio in ovarian cancer: evidence from 4,910 patients. Oncotarget. 2017;8(40):68938–68949. doi: 10.18632/oncotarget.20196 [DOI] [PMC free article] [PubMed] [Google Scholar]
- 27.Huang QT, Zhou L, Zeng WJ, et al. Prognostic Significance of Neutrophil-to-Lymphocyte Ratio in Ovarian Cancer: A Systematic Review and Meta-Analysis of Observational Studies. Cell Physiol Biochem Int J Exp Cell Physiol Biochem Pharmacol. 2017;41(6):2411–2418. doi: 10.1159/000475911 [DOI] [PubMed] [Google Scholar]
- 28.Ning F, Cole CB, Annunziata CM. Driving Immune Responses in the Ovarian Tumor Microenvironment. Front Oncol. 2020;10:604084. doi: 10.3389/fonc.2020.604084 [DOI] [PMC free article] [PubMed] [Google Scholar]
- 29.Diaz Arguello OA, Haisma HJ. Apoptosis-Inducing TNF Superfamily Ligands for Cancer Therapy. Cancers. 2021;13(7):1543. doi: 10.3390/cancers13071543 [DOI] [PMC free article] [PubMed] [Google Scholar]
- 30.Razeghian E, Suksatan W, Sulaiman Rahman H, et al. Harnessing TRAIL-Induced Apoptosis Pathway for Cancer Immunotherapy and Associated Challenges. Front Immunol. 2021;12:3379. doi: 10.3389/fimmu.2021.699746 [DOI] [PMC free article] [PubMed] [Google Scholar] [Retracted]
- 31.Shinagare AB, O’Neill AC, Cheng S, et al. Advanced High-Grade Serous Ovarian Cancer: Frequency and Timing of Thoracic Metastases and the Implications for Chest Imaging Follow-up. Radiology. 2015;277(3):733–740. doi: 10.1148/radiol.2015142467 [DOI] [PubMed] [Google Scholar]
- 32.Alberts DS, Liu PY, Hannigan EV, et al. Intraperitoneal cisplatin plus intravenous cyclophosphamide versus intravenous cisplatin plus intravenous cyclophosphamide for stage III ovarian cancer. N Engl J Med. 1996;335(26):1950–1955. doi: 10.1056/NEJM199612263352603 [DOI] [PubMed] [Google Scholar]
- 33.Markman M, Bundy BN, Alberts DS, et al. Phase III trial of standard-dose intravenous cisplatin plus paclitaxel versus moderately high-dose carboplatin followed by intravenous paclitaxel and intraperitoneal cisplatin in small-volume stage III ovarian carcinoma: an intergroup study of the Gynecologic Oncology Group, Southwestern Oncology Group, and Eastern Cooperative Oncology Group. J Clin Oncol Off J Am Soc Clin Oncol. 2001;19(4):1001–1007. doi: 10.1200/JCO.2001.19.4.1001 [DOI] [PubMed] [Google Scholar]
- 34.Armstrong DK, Bundy B, Wenzel L, et al. Intraperitoneal cisplatin and paclitaxel in ovarian cancer. N Engl J Med. 2006;354(1):34–43. doi: 10.1056/NEJMoa052985 [DOI] [PubMed] [Google Scholar]
- 35.Berek JS, Hacker NF, Lichtenstein A, et al. Intraperitoneal recombinant alpha-interferon for “salvage” immunotherapy in stage III epithelial ovarian cancer: a Gynecologic Oncology Group Study. Cancer Res. 1985;45(9):4447–4453. [PubMed] [Google Scholar]
- 36.Stevenson HC, Keenan AM, Woodhouse C, et al. Fate of gamma-interferon-activated killer blood monocytes adoptively transferred into the abdominal cavity of patients with peritoneal carcinomatosis. Cancer Res. 1987;47(22):6100–6103. [PubMed] [Google Scholar]
- 37.Colombo N, Peccatori F, Paganin C, et al. Anti-tumor and immunomodulatory activity of intraperitoneal IFN-gamma in ovarian carcinoma patients with minimal residual tumor after chemotherapy. Int J Cancer. 1992;51(1):42–46. doi: 10.1002/ijc.2910510109 [DOI] [PubMed] [Google Scholar]
- 38.Pujade-Lauraine E, Guastalla JP, Colombo N, et al. Intraperitoneal recombinant interferon gamma in ovarian cancer patients with residual disease at second-look laparotomy. J Clin Oncol Off J Am Soc Clin Oncol. 1996;14(2):343–350. doi: 10.1200/JCO.1996.14.2.343 [DOI] [PubMed] [Google Scholar]
- 39.Delneste Y, Charbonnier P, Herbault N, et al. Interferon-gamma switches monocyte differentiation from dendritic cells to macrophages. Blood. 2003;101(1):143–150. doi: 10.1182/blood-2002-04-1164 [DOI] [PubMed] [Google Scholar]
- 40.Papewalis C, Jacobs B, Wuttke M, et al. IFN-alpha skews monocytes into CD56+-expressing dendritic cells with potent functional activities in vitro and in vivo. J Immunol Baltim Md 1950. 2008;180(3):1462–1470. doi: 10.4049/jimmunol.180.3.1462 [DOI] [PubMed] [Google Scholar]
- 41.Olingy CE, Dinh HQ, Hedrick CC. Monocyte heterogeneity and functions in cancer. J Leukoc Biol. 2019;106(2):309–322. doi: 10.1002/JLB.4RI0818-311R [DOI] [PMC free article] [PubMed] [Google Scholar]
- 42.Zhou J, Tang Z, Gao S, Li C, Feng Y, Zhou X. Tumor-Associated Macrophages: Recent Insights and Therapies. Front Oncol. 2020;10. doi: 10.3389/fonc.2020.00188 [DOI] [PMC free article] [PubMed] [Google Scholar]
- 43.Komura N, Mabuchi S, Shimura K, et al. The role of myeloid-derived suppressor cells in increasing cancer stem-like cells and promoting PD-L1 expression in epithelial ovarian cancer. Cancer Immunol Immunother CII. Published online June 19, 2020. doi: 10.1007/s00262-020-02628-2 [DOI] [PMC free article] [PubMed] [Google Scholar]
- 44.Cui TX, Kryczek I, Zhao L, et al. Myeloid-derived suppressor cells enhance stemness of cancer cells by inducing microRNA101 and suppressing the corepressor CtBP2. Immunity. 2013;39(3):611–621. doi: 10.1016/j.immuni.2013.08.025 [DOI] [PMC free article] [PubMed] [Google Scholar]
- 45.Duwe AK, Singhal SK. The immunoregulatory role of bone marrow. I. Suppression of the induction of antibody responses to T-dependent and T-independent antigens by cells in the bone marrow. Cell Immunol. 1979;43(2):362–371. doi: 10.1016/0008-8749(79)90180-1 [DOI] [PubMed] [Google Scholar]
- 46.Young MR, Young ME, Wright MA. Stimulation of immune-suppressive bone marrow cells by colony-stimulating factors. Exp Hematol. 1990;18(7):806–811. [PubMed] [Google Scholar]
- 47.Gabrilovich DI, Ostrand-Rosenberg S, Bronte V. Coordinated regulation of myeloid cells by tumours. Nat Rev Immunol. 2012;12(4):253–268. doi: 10.1038/nri3175 [DOI] [PMC free article] [PubMed] [Google Scholar]
- 48.Lu X, Horner JW, Paul E, et al. Effective combinatorial immunotherapy for castration-resistant prostate cancer. Nature. 2017;543(7647):728–732. doi: 10.1038/nature21676 [DOI] [PMC free article] [PubMed] [Google Scholar]
- 49.Horikawa N, Abiko K, Matsumura N, et al. Anti-VEGF therapy resistance in ovarian cancer is caused by GM-CSF-induced myeloid-derived suppressor cell recruitment. Br J Cancer. 2020;122(6):778–788. doi: 10.1038/s41416-019-0725-x [DOI] [PMC free article] [PubMed] [Google Scholar]
- 50.Van Gelder RN, von Zastrow ME, Yool A, Dement WC, Barchas JD, Eberwine JH. Amplified RNA synthesized from limited quantities of heterogeneous cDNA. Proc Natl Acad Sci U S A. 1990;87(5):1663–1667. doi: 10.1073/pnas.87.5.1663 [DOI] [PMC free article] [PubMed] [Google Scholar]
- 51.Edgar R, Domrachev M, Lash AE. Gene Expression Omnibus: NCBI gene expression and hybridization array data repository. Nucleic Acids Res. 2002;30(1):207–210. doi: 10.1093/nar/30.1.207 [DOI] [PMC free article] [PubMed] [Google Scholar]
- 52.Green DS, Nunes AT, Tosh KW, et al. Production of a cellular product consisting of monocytes stimulated with Sylatron® (Peginterferon alfa-2b) and Actimmune® (Interferon gamma-1b) for human use. J Transl Med. 2019;17(1):82. doi: 10.1186/s12967-019-1822-6 [DOI] [PMC free article] [PubMed] [Google Scholar]
- 53.Green DS, Nunes AT, David-Ocampo V, et al. A Phase 1 trial of autologous monocytes stimulated ex vivo with Sylatron® (Peginterferon alfa-2b) and Actimmune® (Interferon gamma-1b) for intra-peritoneal administration in recurrent ovarian cancer. J Transl Med. 2018;16(1):196. doi: 10.1186/s12967-018-1569-5 [DOI] [PMC free article] [PubMed] [Google Scholar]
- 54.Common Terminology Criteria for Adverse Events (CTCAE). Published online 2009:79. [Google Scholar]
- 55.Lepone LM, Donahue RN, Grenga I, et al. Analyses of 123 Peripheral Human Immune Cell Subsets: Defining Differences with Age and between Healthy Donors and Cancer Patients Not Detected in Analysis of Standard Immune Cell Types. J Circ Biomark. 2016;5:5. doi: 10.5772/62322 [DOI] [PMC free article] [PubMed] [Google Scholar]
- 56.Ding L, Mo A, Jutivorakool K, Pancholi M, Holland SM, Browne SK. Determination of human anticytokine autoantibody profiles using a particle-based approach. J Clin Immunol. 2012;32(2):238–245. doi: 10.1007/s10875-011-9621-8 [DOI] [PubMed] [Google Scholar]
Associated Data
This section collects any data citations, data availability statements, or supplementary materials included in this article.
Supplementary Materials
Data Availability Statement
Raw data for this study were generated at the National Institutes of Health. Derived data supporting the findings of this study are available from the corresponding author upon request. Microarray data generated in this study are publicly available at GEO as described above.