

SUMMARY
In addition to tau and Aβ pathologies, inflammation plays an important role in Alzheimer’s disease (AD). Variants in APOE and TREM2 increase AD risk. ApoE4 exacerbates tau-linked neurodegeneration and inflammation in P301S tau mice and removal of microglia blocks tau-dependent neurodegeneration. Microglia adopt a heterogeneous population of transcriptomic states in response to pathology, at least some of which are dependent on TREM2. Previously we reported that knockout (KO) of TREM2 attenuated neurodegeneration in P301S mice that express mouse Apoe. Because of the possible common pathway of ApoE and TREM2 in AD, we tested whether TREM2 KO (T2KO) would block neurodegeneration in P301S Tau mice expressing ApoE4 (TE4), similar to that observed with microglial depletion. Surprisingly, we observed exacerbated neurodegeneration and tau pathology in TE4-T2KO vs. TE4 mice, despite decreased TREM2-dependent microgliosis. Our results suggest that tau pathology dependent microgliosis that is TREM2-independent facilitates tau-mediated neurodegeneration in the presence of ApoE4.
Keywords: Apolipoprotein E4, TREM2, Tau pathology, Microgliosis, Alzheimer’s disease, Tau-mediated neurodegeneration
eTOC blurb
Gratuze et al. demonstrate that TREM2 deletion does not protect against tau pathology and tau-mediated neurodegeneration in the presence of ApoE4. Despite decreasing TREM2-dependent microgliosis, a TREM2-independent microgliosis persists in the presence of ApoE4 and tau pathology that exhibits high microglial lysosomal burden and lipid accumulation.
INTRODUCTION
Alzheimer’s Disease (AD) is the most common cause of dementia and is characterized by extracellular plaques mainly composed of aggregated Aβ peptide, and intraneuronal neurofibrillary tangles and dystrophic neurites that contain aggregated, hyperphosphorylated tau protein1,2. Tau pathology, and not Aβ, strongly correlates with local brain atrophy and neuronal death. APOE4, the strongest genetic risk factor for AD, has an established role in promoting Aβ aggregation into amyloid plaques. However, a myriad of other effects of APOE4 on the blood brain barrier, glucose and lipid metabolism, and exacerbated inflammation may also contribute to the link between APOE4 and AD, including the exacerbation of tau-associated neurodegeneration and inflammation3–6.
Neuroinflammation is a prominent aspect of AD and primary tauopathies and is implicated as a driver of tau-dependent neurodegeneration in animal models7. APOE4 is associated with augmented inflammatory astrocytic and microglial phenotypes, whereas knockout of Apoe strongly protects against neurodegeneration and inflammatory gene expression in the P301S mouse model, 6,8. In vivo, ablation of microglia in P301S mice expressing APOE4 (TE4) prevented neurodegeneration and reduced tau phosphorylation8. The functional state of microglia, rather than their overall abundance, affects neurodegeneration as protein expression markers such as CD68, Clec7a, or P2ry12 appear to correlate with tau-dependent neurodegeneration more robustly than simply microglial number. Single-cell RNAseq (scRNAseq) and immune profiling experiments have identified a number of microglial transcriptional profiles in the context of neurodegeneration9–11. Whether particular microglial transcriptional programs are driving neurodegeneration versus responding to neurodegeneration is unclear.
TREM2 is a critical regulator of a Cd9+Clec7a+Cd11c+ microglial state that was initially described in amyloid mouse models as “disease-associated microglia” (DAM)12. Studies in mouse models of amyloid deposition demonstrated a pivotal function for TREM2, and by extension the “DAM” state, in the microglial response to amyloid and that TREM2 signaling is protective in decreasing Aβ-mediated local injury13–17. Loss of TREM2 or expression of AD-associated TREM2 variants are linked to increased seeding and spreading of neuritic plaque phosphorylated tau, and exacerbated neuronal injury and tau pathology in mixed amyloid-tau transgenic models18–20, suggesting a role for TREM2 in suppressing Aβ-driven tau pathology. Conversely, we and others have previously shown that loss of TREM2 or expression of AD-associated TREM2 variants attenuate microgliosis and neurodegeneration in a mouse model of primary tauopathy21–23, raising the hypothesis that the reactive microglial state in response to amyloid was associated with protective effects but that reactive microglia in the context of tauopathy drove neurodegeneration. However, recent reports found that although TREM2 deficiency reduced Cd11c+ reactive microglia, loss of TREM2 was not protective against neurodegeneration in Grn−/− or hTDP-43 mice24,25. Interestingly, Grn−/− and Trem2−/− mice independently exhibit deficiencies in lipid metabolism and TREM2 can directly bind hTDP-43, which may be important for its phagocytic clearance.
ApoE4 may exert toxic gain-of-function phenotypes relative to ApoE3 and ApoE2 that could cause general dysfunction of ApoE-related pathways. Given the reported overlap between TREM2 and ApoE in AD and microglial function, we decided to test whether and how TREM2 deficiency would affect tau-dependent neurodegeneration in the context of ApoE4. We hypothesized that Trem2 KO would dampen microglial reactivity to attenuate the detrimental effect of ApoE4 on tau-dependent neurodegeneration. Surprisingly, we found exacerbated neurodegeneration and tauopathy in Trem2-deficient TE4 mice despite decreased detection of DAM-like, TREM2-dependent microglial profiles. Moreover, we observed TREM2-independent increases in microglial expression of lysosome-associated genes in TE4 mice.
RESULTS
TREM2 deletion increases tau-mediated brain atrophy and does not reduce synaptic loss in the presence of ApoE4.
To investigate the interplay between TREM2 and ApoE4 on tauopathy, inflammation, and neurodegeneration, we used the P301S-tau mouse model. By 9.5 months-of-age, this model develops strong tau hyperphosphorylation and aggregation, gliosis, and synaptic and neuronal loss in the hippocampus and entorhinal/piriform cortex (EC/PC)26. We generated P301S mice on either a human ApoE4-KI (TE4) or ApoE-KO (TEKO) background with and without TREM2 to generate 4 groups of mice: TE4, TEKO, TE4-T2KO, TEKO-T2KO. No change in brain volume was detected among these four groups at 3 months-of-age, prior to neurodegeneration in this model (Suppl.Fig.1B).
At 9.5 months-of-age, ApoE-KO strongly attenuated brain atrophy in P301S mice compared with mice expressing ApoE4 (Fig.1A–D), similar to prior reports6,8,27. Previously, we found that 9.5 month old P301S mice expressing mouse Apoe with Trem2 deletion develop significantly less EC/PC atrophy than P301S expressing TREM223. Surprisingly, volumetric analysis revealed marked hippocampal volume loss (~27%) and EC/PC volume loss (~35%) in the TE4-T2KO compared to TEKO and TEKO-T2KO mice (Fig.1A–C). Interestingly, TE4-T2KO displayed even smaller hippocampus and EC/PC volumes compared to TE4 mice. Additionally, the dentate gyrus granule cell layer was significantly thinner in TE4 mice compared to TEKO mice, independent of TREM2 deletion (Fig.1D).
Figure 1. TREM2 deletion increases the effect of ApoE4 on hippocampal atrophy and does not counteract the detrimental effect of ApoE4 on tau-mediated synaptic loss in 9-month-old TE4 mice.
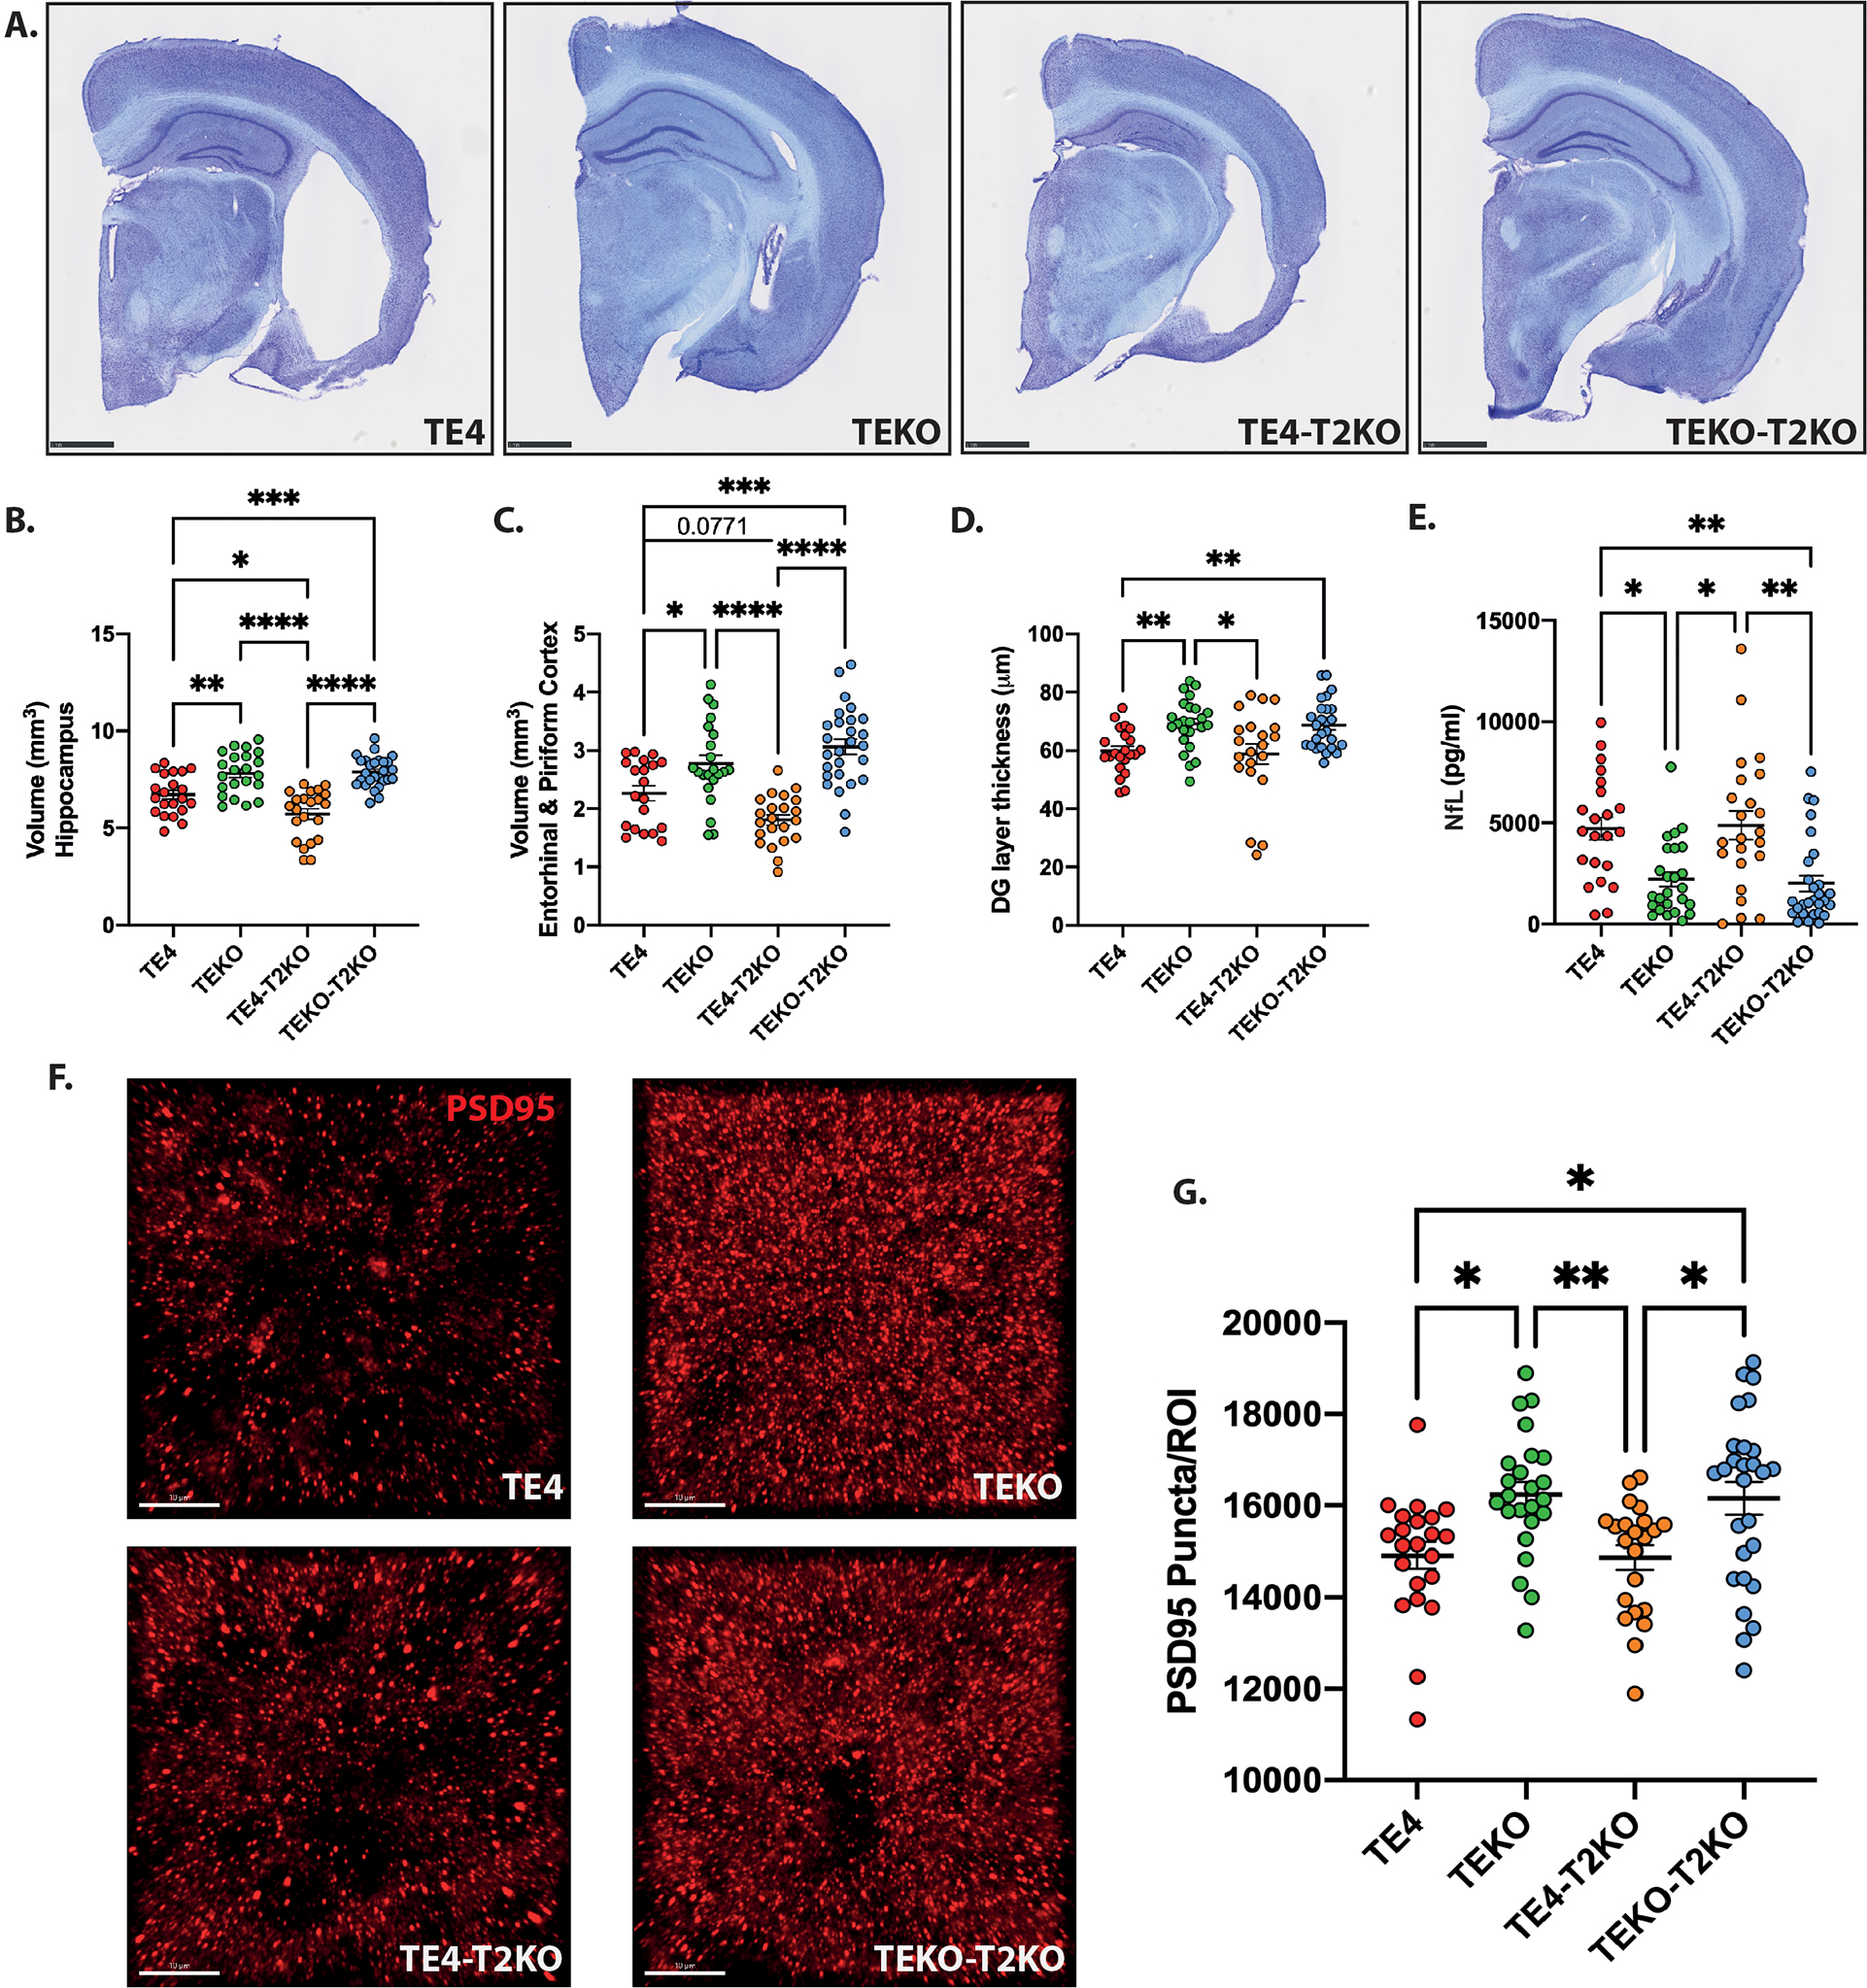
(A) Representative images of Cresyl violet staining from brains of 9-month-old mice. Scale bars: 1 mm. (B–E) Quantification of the average volume of the hippocampus (B), entorhinal and piriform cortices (C), granule cell layer of the dentate gyrus (DG) (D), and protein levels of neurofilament light chain (NfL) (E). (F) Representative images and (G) Quantification of postsynaptic PSD-95 (red) puncta numbers per image (region of interest – ROI) in the HC. Scale bars: 10 μm. Data are presented as mean ± SEM. Significance was determined using a one-way ANOVA followed by a Tukey’s post hoc test for (C) and with a Kruskal–Wallis test followed by a Dunn’s post hoc test for (D, E, G) due to the nonparametric data set. Welch’s and Brown–Forsythe ANOVA test was used for (B) due to significantly different variances. *, P < 0.05; **, P < 0.01; ***, P < 0.001; ****, P < 0.0001. (n=20–27 mice/group).
We next measured plasma protein levels of neurofilament light chain (NfL), a marker of neuroaxonal damage and neurodegeneration28. We observed a significant increase in plasma NfL in TE4 compared to TEKO independent of TREM2 (Fig.1E). NfL levels were barely detectable in age-matched littermates without the tau mutation (Suppl.Fig.1C). NfL levels did not differ between the TE4 and TE4-T2KO groups, possibly because levels had reached a plateau. NfL levels also did not differ in these groups at 3 months-of-age, prior to neurodegeneration (Suppl.Fig.1C). We measured the effect of TREM2 on synaptic loss in TE4 mice by quantifying hippocampal postsynaptic (PSD95) puncta. We observed decreased PSD95 puncta in TE4 mice compared to TEKO mice, independent of the presence of TREM2 (Fig.1F,G). Thus, in the presence of ApoE4, TREM2 deletion increases tau-mediated brain atrophy.
TREM2 deletion does not reduce phosphorylated tau accumulation in the presence of ApoE4.
To determine whether the TREM2-independent effect of ApoE4 on brain atrophy and synaptic loss is associated with increased tau pathology, we immunostained brain sections from these mice for p-tau using AT8 (pS202/pT205) and AT180 (pT231) and pathological tau conformations using MC1. We observed a significant increase in hippocampal AT8 (Fig.2A,D) and AT180 (Fig.2B,E) staining in TE4-T2KO compared to the other groups and an increase in hippocampal MC1 staining in TE4-T2KO compared to TEKO and TEKO-T2KO (Fig.2C,F). No significant difference in AT8 staining in the EC/PC was observed (Fig.2A,G), but AT180 and MC1 staining were increased in TE4-T2KO EC/PC compared to TEKO and TEKO-T2KO (Fig.2B,C,H,I). Surprisingly, while there is increased MC1 staining in TE4 mice versus TEKO and TEKO-T2KO in the EC/PC (Fig.2KC,I), p-tau staining did not differ in the hippocampus/entorhinal cortex of TE4 versus TEKO or TEKO-T2KO groups, which differs from our previous findings6,8. We performed Western blot analysis for AT8 and AT180 pTau markers in the RIPA and Sarkosyl-insoluble fractions (Fig.2J–Q) as well as ELISA analysis of soluble and insoluble phosphorylated and total tau levels (Fig.2R–U). No differences were observed between groups in the RIPA and soluble fractions for pTau and total tau. However, insoluble pTau and total tau levels were increased in TE4-T2KO (Fig.2O,P,Q,T) and TE4 mice (Fig.2O,T,U) compared to TEKO and/or TEKO-T2KO mice, confirming an increase of aggregated pTau and tau in TE4, that is not attenuated by TREM2 deletion. Finally, we analyzed hippocampal pTau staining patterns (Fig.2V; type1–type4) that are associated with progressively more advanced pathological tau/neurodegeneration stages6,8. TEKO mice were highly enriched with type 1 & 2 patterns, which represents earlier pathological tau stages. In contrast, TE4 mice had predominantly type 3 & 4 patterns, which are associated with more advanced tau stages and neurodegeneration (Fig.2V). Remarkably, TREM2 deletion in TEKO mice strongly blocked the progression of pathological tau stages, resulting in almost exclusively type 1 & 2 patterns in these mice. While more subtle, there is a switch from type 3 to type 4 pattern in TE4-T2KO mice vs. TE4 mice. This p-tau pattern analysis confirms that ApoE4 augments p-tau pathology and highlights the complex role of TREM2 on tau pathology. Interestingly, we23 and others29 did not observe increased p-tau pathology in P301S mice expressing murine ApoE that lacked TREM2, suggesting that human ApoE4 has a different impact on tau pathology than mouse ApoE used in the previous studies.
Figure 2. TREM2 deletion does not reduce tau pathology in 9-month-old TE4 mice.
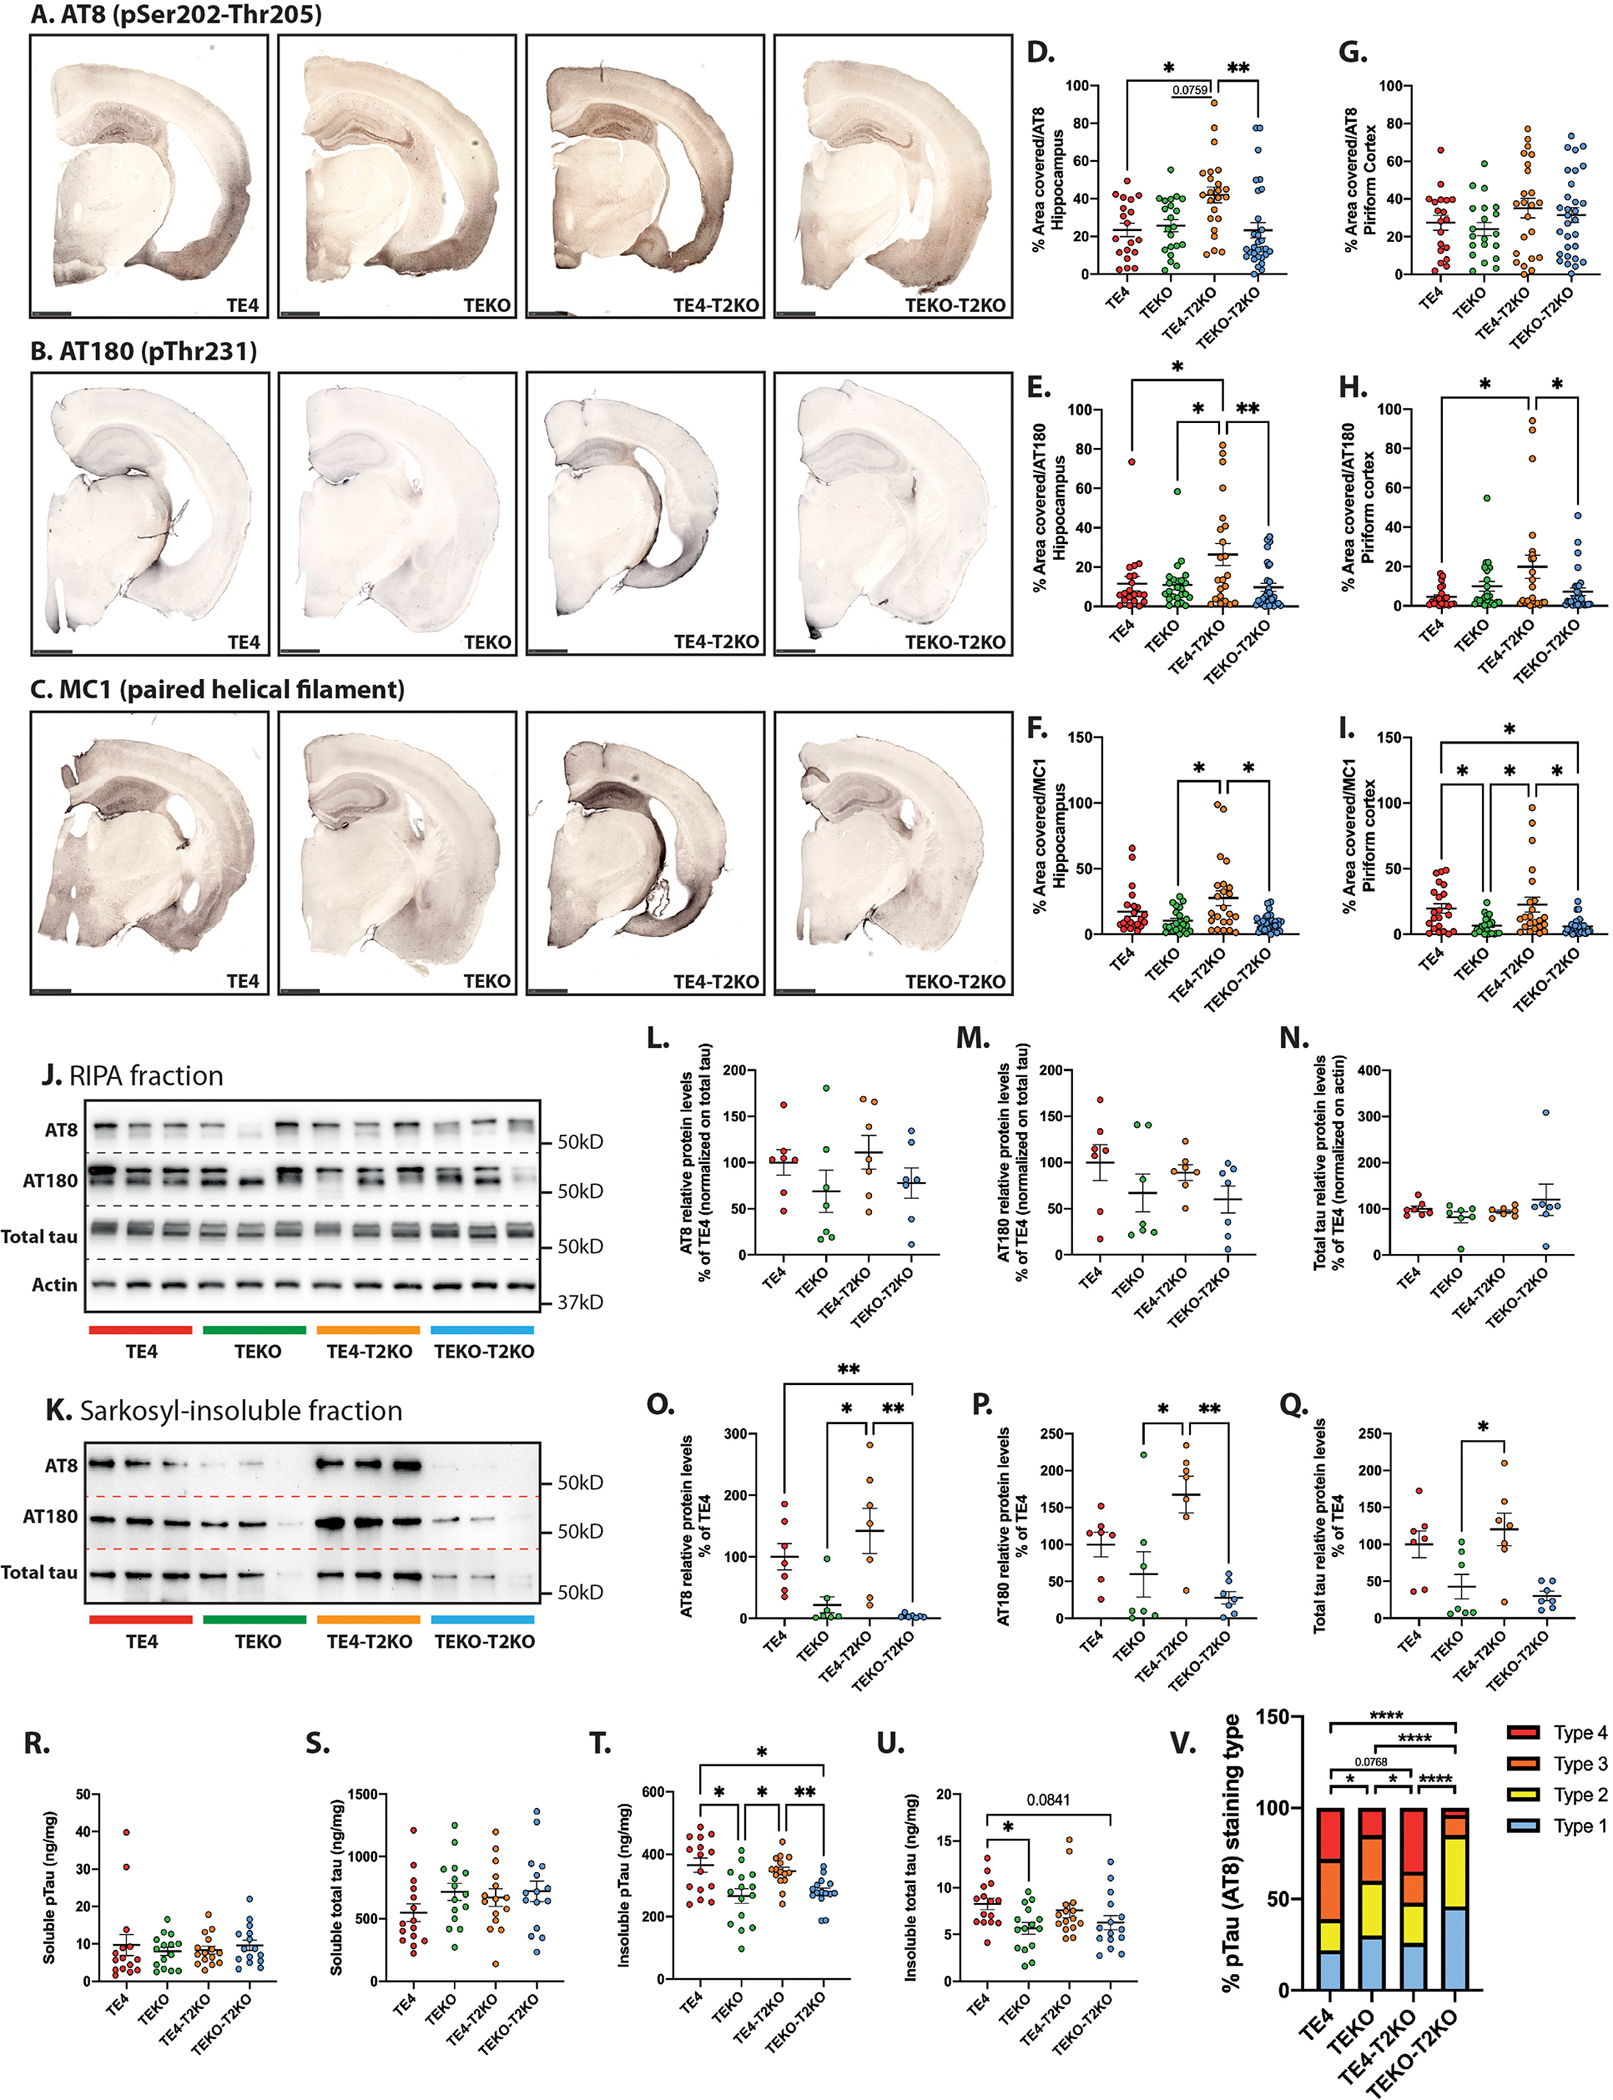
(A-C) Representative images of pTau AT8 (A), AT180 (B) and tau confirmational dependent MC1 (C) staining in brain sections. Scale bars: 1 mm. Quantification of the percentage area covered by AT8, AT180, and MC1 staining in the hippocampus (C, D, and E respectively) and piriform cortex (G, H, and I respectively). (n=20–30 mice/group). (J) Western blot detection of AT8, AT180, total tau and actin protein levels in RIPA fraction extracted from hippocampal tissue (3 representative lanes/group). (K) Western blot detection of AT8, AT180 and total tau protein levels in Sarkosyl-insoluble fraction extracted from hippocampal tissue (3 representative lanes/group). (L- Q) Quantitative analysis of AT8, AT180 and total tau relative levels in RIPA (L, M, and N respectively) and Sarkosyl-insoluble (O, P, and Q respectively) fractions (n=7 mice/group). (R–U) Total hippocampal pTau and total tau concentrations in Sarkosyl-soluble (R and S respectively), and Sarkosyl-insoluble (T and U respectively) fractions assessed by ELISA. (n=15 mice/group). (V) Distribution of the four pTau staining types in hippocampus from AT8 staining. Type 1 has intense mossy fiber staining as well as diffuse cell body staining in the dentate gyrus granule cell layer and CA1 pyramidal cell layer; type 2 has compact and dense tangle-like cell body staining primarily in the dentate gyrus granule cells and CA3 pyramidal cells, but also has sparse staining in the CA1 region; type 3 has staining primarily in the neuropil of the stratum radiatum of the CA region with clear staining of dendrites from pyramidal neurons and only some staining in the neuronal cell bodies; type 4 has dense staining over the entire hippocampus, unlike other staining patterns; type 4 staining is fragmented, dotted, and grainy6. Data are presented as the mean ± SEM. Significance was determined using a one-way ANOVA followed by a Tukey’s post hoc test for (E, G, H, L, M, N, R, S) and with a Kruskal–Wallis test followed by a Dunn’s post hoc test for (D, F, I, O, P, Q, U) due to the nonparametric data set. Welch’s and Brown–Forsythe ANOVA test was used for (T) due to significantly different variances. For (V), Fisher’s exact test two-sided was used with adjusted p value based on false-discovery rate. *, P < 0.05; **, P < 0.01.
snRNA-seq of microglia reveals changes regulated by TREM2 removal, ApoE4, and tau pathology.
Microglial reactivity plays a crucial role in driving tau pathology and tau-mediated neurodegeneration8,30, which is exacerbated by ApoE46 and dependent on TREM222,23. To decipher specific microglial states associated with neurodegeneration, we isolated microglial nuclei from the hippocampus of E4, TE4 and TEKO in the presence or absence of Trem2 (T2KO) (Fig.3A) using immunolabeling for PU.1 and performed snRNAseq (Fig.3B, Suppl.Fig.3&Table 1). We identified ten clusters after analysis of differentially expressed marker genes. Most nuclei to a varying degree expressed Cx3cr1, Csf1r, and Hexb mRNA (Fig.3D). These markers were highly expressed in three clusters, which were largely homogenous in their gene expression, and generally resembled transcriptomic states colloquially referred to as “homeostatic.” (Fig.3E). Homeostatic microglia represented the largest proportion of PU.1+ nuclei, representing ~70%. Other smaller clusters were identified as perivascular/border-associated macrophages, inflammatory, MHCII, or proliferating based on differentially expressed marker genes (Fig.3C,E;Suppl.Fig.4), and did noticeably differ across groups. The proportion of homeostatic microglia was highest in E4 and E4-T2KO mice, followed by mice lacking ApoE, while homeostatic microglia were strongly reduced in TE4 and TE4-T2KO (Fig.3G; Suppl.Table 2). One microglial cluster expressing predominantly interferon-responsive genes (Fig.3H,I) was significantly increased in TE4 and TE4-T2KO mice.
Figure 3. snRNA-seq of microglia reveals changes regulated by TREM2 removal, ApoE4 and tau pathology in PU.1+ nuclei.
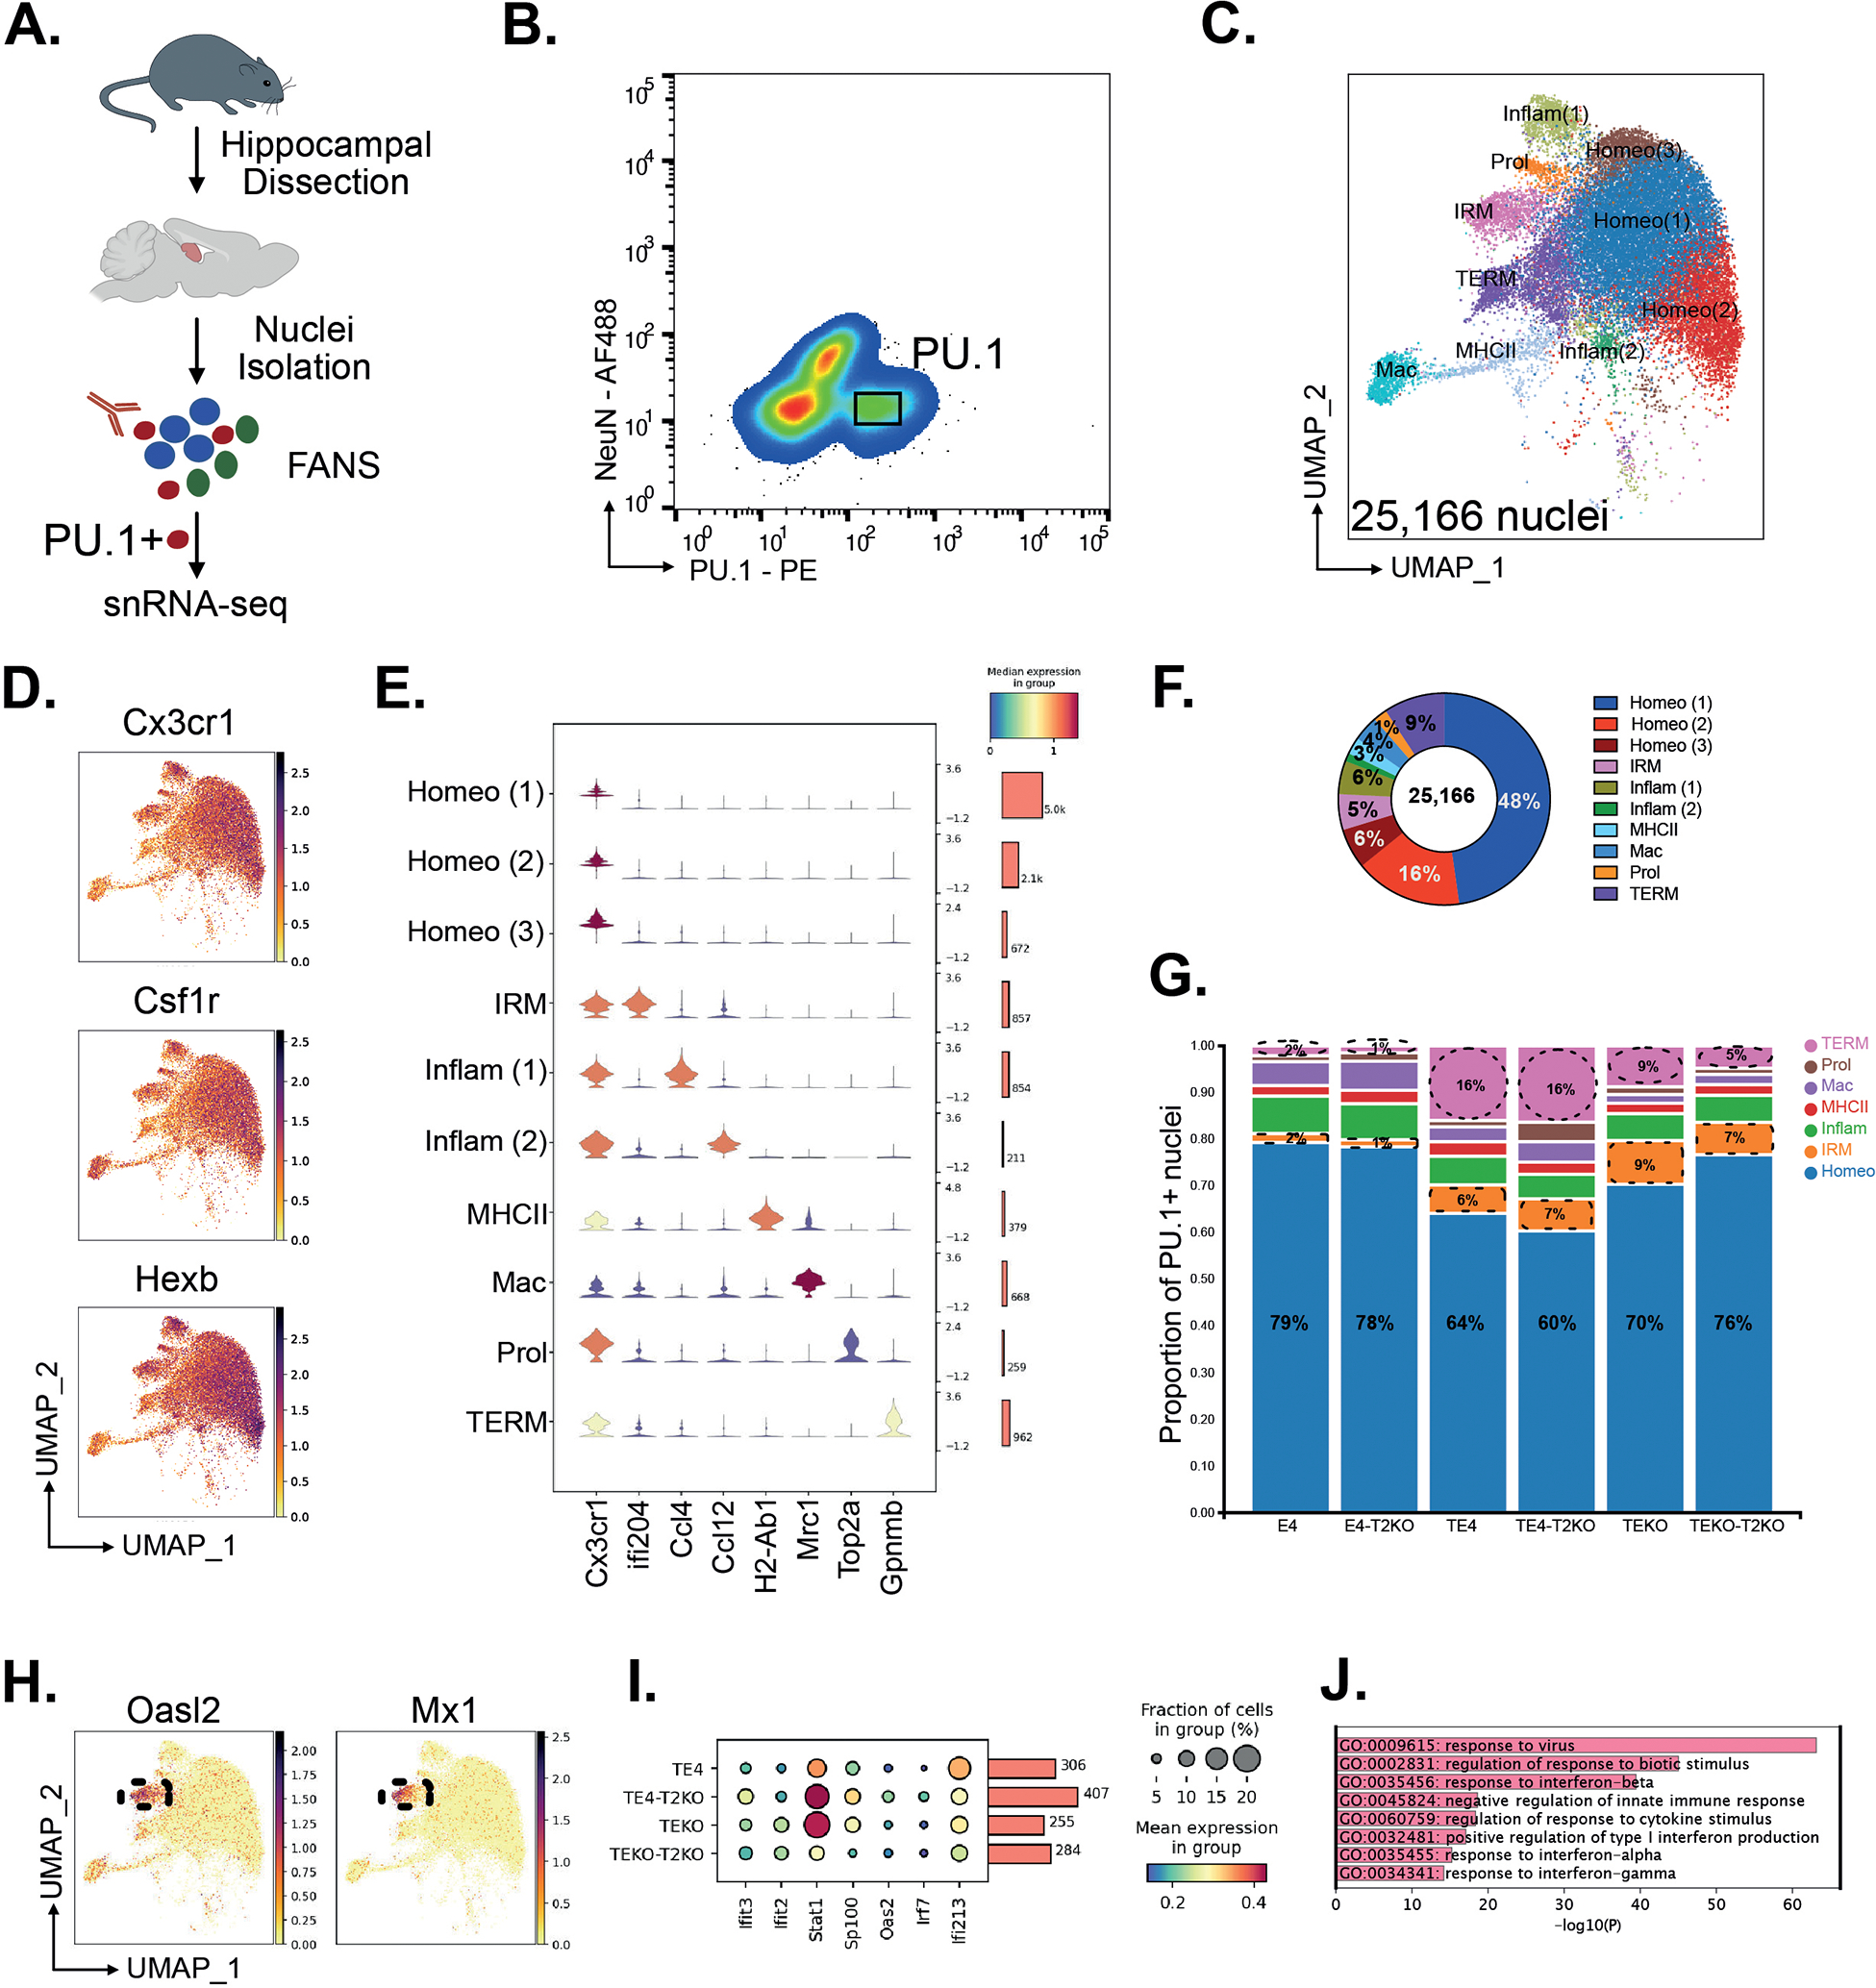
(A) Experimental design for isolation of PU.1+ nuclei from hippocampus. (B) Flow plots from the PU.1 sort gate showing expression of the nuclei markers NeuN and PU.1 for neurons and microglia, respectively. (C) UMAP for 25,166 nuclei from n=3 per group and annotated by cluster. (D) UMAP of canonical microglia markers Cx3cr1, Csf1r, and Hexb. (E) Expression of canonical marker genes delineates 9 microglial states and one macrophage (Mac) population (Homeo = homeostatic microglia; IRM = Interferon responsive microglia; Inflam = inflammatory microglia; Prol = proliferative microglia; TERM = Tau/ApoE4 reactive microglia, Mac = perivascular macrophages). (F) Donut plot for proportion of different PU.1+ clusters. (G) Stacked barplots showing the proportion of microglia states in the six experimental groups. (H) UMAP of IRM marker genes Oasl2 and Mx1. (I) Dot plot of IRM genes. (J) GO term analysis of IRM marker genes compared to homeostatic microglia.
TREM2-KO decreases TREM2-dependent reactive microglia genes while maintaining high expression of TREM2-independent microgliosis genes in TE4 mice.
One cluster exhibited similarity with DAM-like microglia as defined in amyloid mice12, but with a number of differences, and was enriched in TE4 and TE4-T2KO groups. For discussion purposes we labeled this cluster Tau/ApoE4 reactive microglia (TERM) (Fig.4A, Suppl.Table 3), indicating that these microglia respond to mutant tau pathology and that the reactivity is increased with ApoE4, consistent with our previous observations in TE4 mice31. The TERM cluster exhibited up-regulated Lpl and Spp1, whereas homeostatic markers such as P2ry12 and Sall1 were downregulated (Fig.4B). Among the 440 up-regulated genes were genes associated with lysosomal function (e.g., Ctsb, Cd63, Cd68, and Cstd) (Fig.4C,D). Other GO terms included cell migration and cell adhesion, GTPase activity, autophagy, endosomal transport, as well as regulation of cytokine production and neuronal cell death. Previously, we found that proportions of snRNAseq clusters may not reflect intermediate effects on gene expression31, so we evaluated expression of genes related to previously reported transcriptomic profiles. We first compared expression of homeostatic markers (Fig.4E,F), all of which were reduced in TE4 relative to the other groups. Consistent with this observation, we observed a pronounced decrease in P2RY12 staining in TE4, although this decrease was markedly attenuated in TE4-T2KO mice (Fig.4G,H). Thus, TREM2 deficiency preserved homeostatic-associated microglial gene expression in the presence of severe tau pathology and neurodegeneration.
Figure 4. Microglial reactivity profile in 9-month-old TE4 and TEKO mice deleted for TREM2.
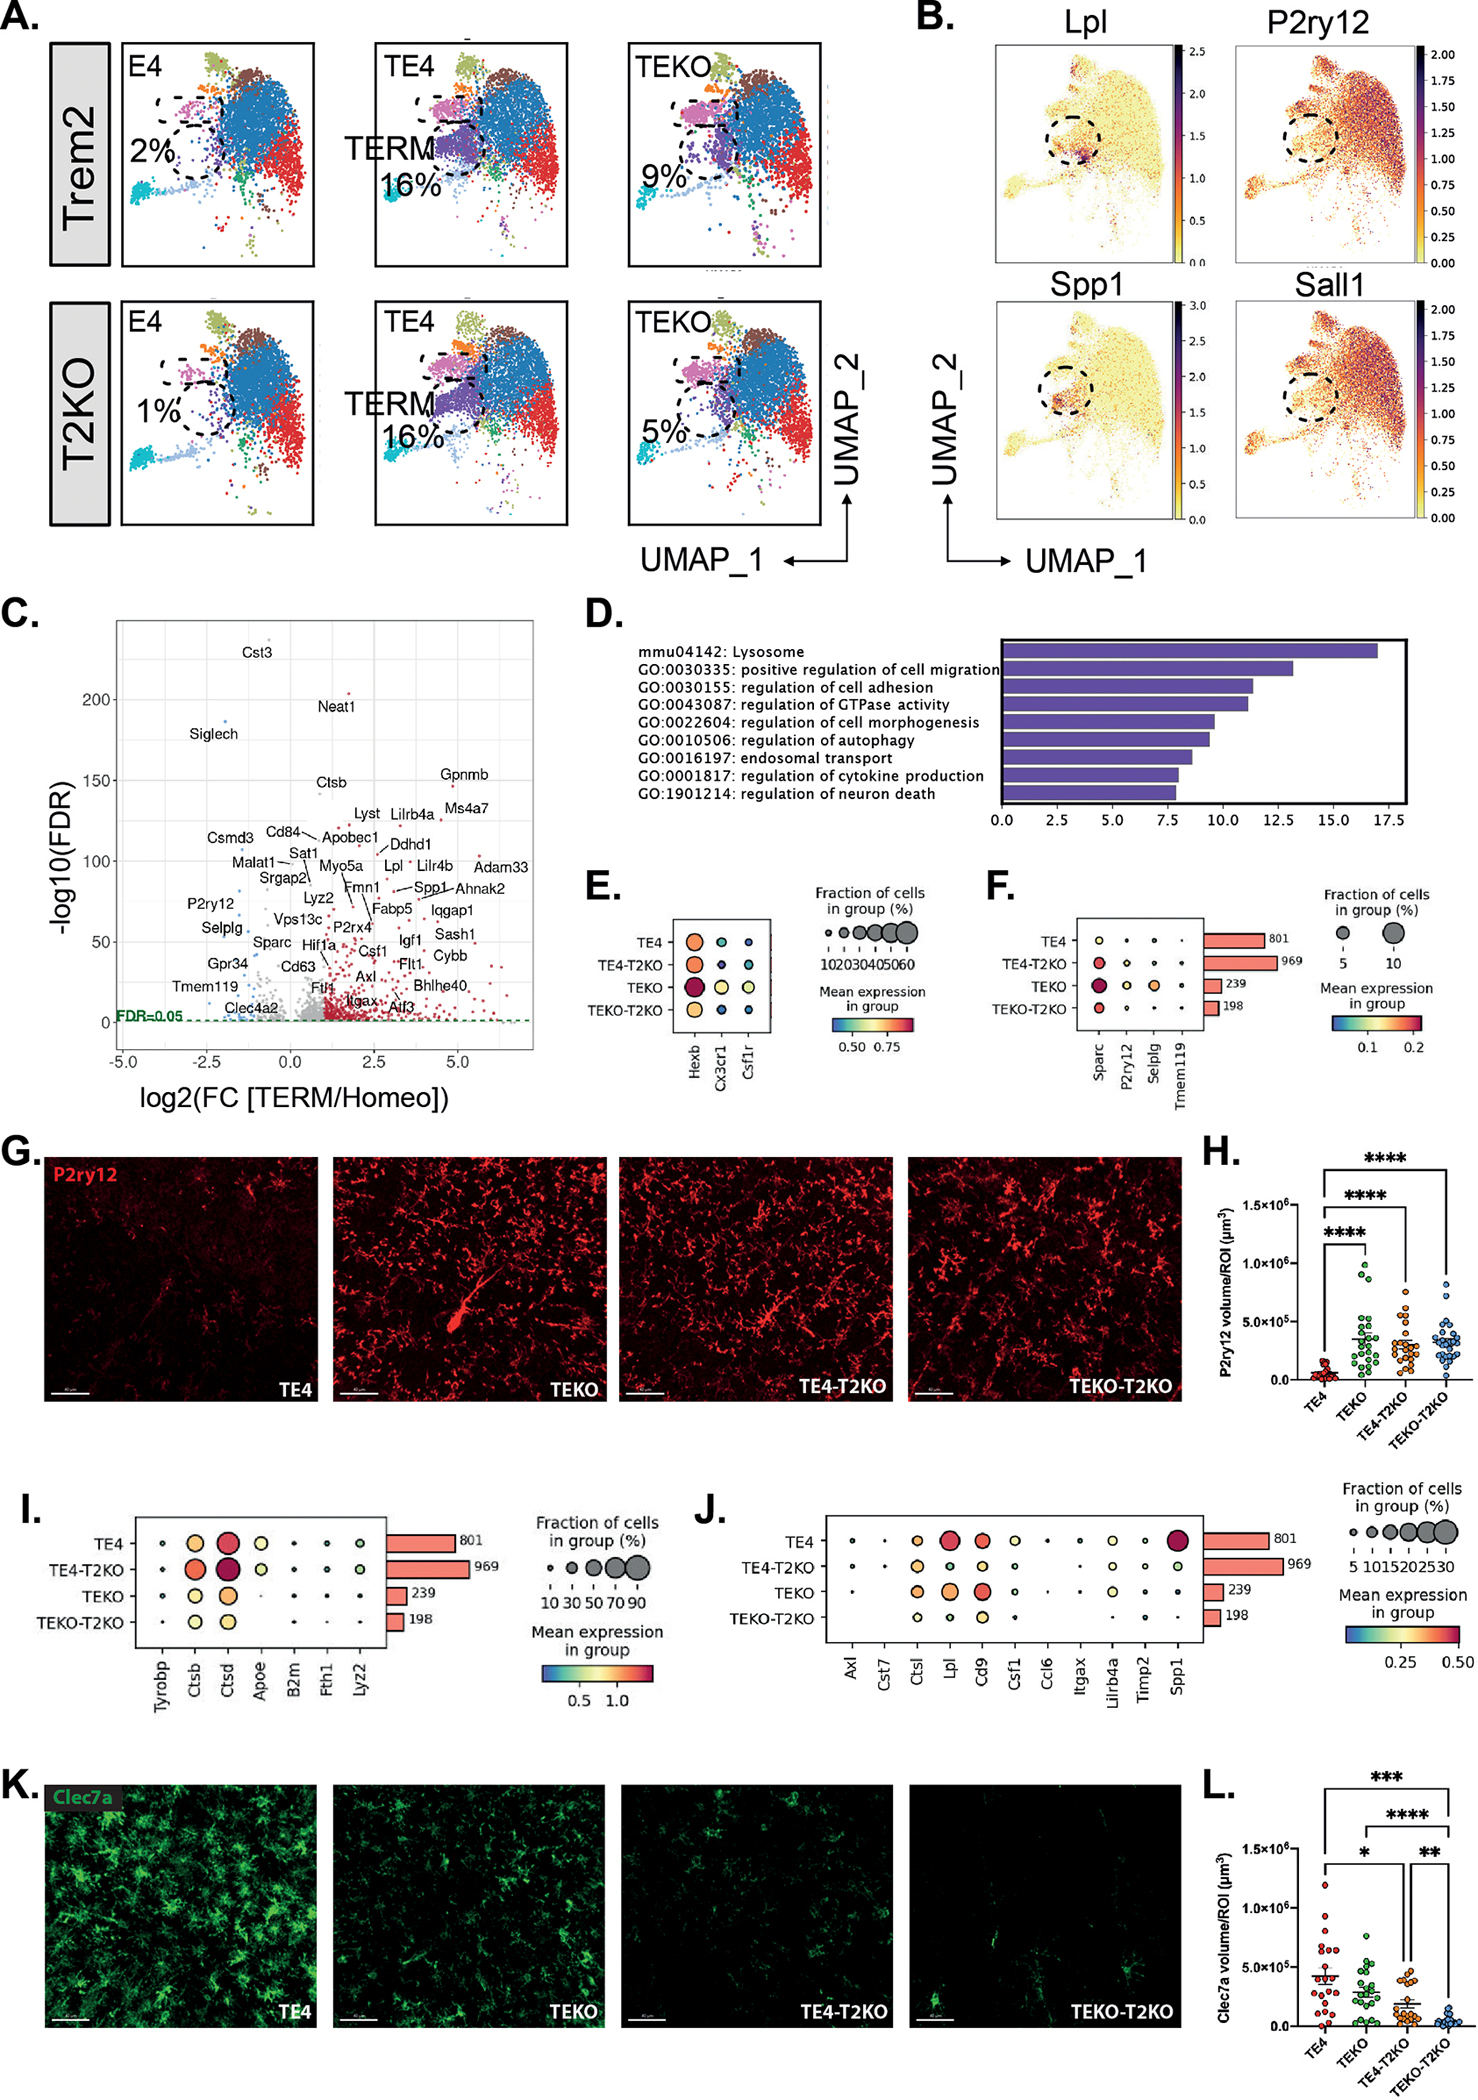
(A) UMAP showing the cluster distribution of all six experimental groups. (B) UMAP of selected up-regulated (Lpl, Spp1) and down-regulated (P2ry12, Sall1) Tau/ApoE4 reactive microglia marker genes. (C) Volcano plot showing the fold changes (log2(FC)) between Tau/ApoE4 reactive microglia to homeostatic microglia and their significance (-log(10) FDR). Significant up-regulated and down-regulated genes are depicted in red and blue, respectively. (D) GO analysis of 440 up-regulated genes in Tau/ApoE4 reactive microglia compared to homeostatic microglia. (E-F) Dot plot of selected genes showing fraction of nuclei and level of expression of homeostatic microglia genes from the Tau/ApoE4 reactive microglia cluster. (G) Representative images and quantification (H) of the average volume covered by P2ry12 in the HC. Scale bars: 40 μm. (I-J) Dot plot showing fraction of nuclei and level of expression of TREM2-dependent (I) and TREM2-independent (J) genes from the Tau/ApoE4 reactive microglia cluster. (G) Representative images and quantification (H) of the average volume covered by Clec7a in the HC. Scale bars: 40 μm. Data are presented as mean ± SEM. Significance was determined using a Kruskal–Wallis test followed by a Dunn’s post hoc test for (H) due to the nonparametric data set. Welch’s and Brown–Forsythe ANOVA test was used for (L) due to significantly different variances. *, P < 0.05; **, P < 0.01; ***, P < 0.001; ****, P < 0.0001. (n=20–27 mice/group).
Subsets of genes in DAM in amyloid mice were found to be dependent on TREM2 and others independent12. We therefore assessed the expression level of genes based on their previously described TREM2-dependence (Suppl.Table 4). Both TE4 and TE4-TKO mice exhibited elevated expression of Ctsb, Ctsd, Fth1 and Lyz2 compared to TEKO and TEKO-T2KO (Fig.4I), suggesting a TREM2-independent microglial response to tau pathology and neurodegeneration. In contrast, we detected lower expression of Spp1, Lpl, Cd9, Lilrb4, Csf1 Ccl6, and Itgax in TE4-T2KO and TEKO-T2KO (Fig.4J), similar to previous reports of TREM2-dependent DAM gene expression in response to amyloid12. We also detected a marked decrease in immunostaining for DAM-associated Clec7a in TE4-T2KO and TEKO-T2KO compared to TE4 and TEKO microglia (Fig.4K,L). Interestingly, TEKO-T2KO displayed an even stronger downregulation in Clec7a compared to TE4-T2KO, suggesting that the presence of ApoE4 can increase Clec7a+ microglia in the presence of tau pathology despite the absence of TREM2. Importantly, TE4 mice expressed higher levels of reactive microglia markers as Spp1, Lpl, Ctsb, Ctsd, and Lyz2 mRNA compared to TEKO mice (Fig.4I,J).
Our snRNA-seq data indicate a reactive microglial phenotype with some DAM-like features in P301S mice that is increased in the presence of human ApoE4. While Trem2 deficiency increased hippocampal atrophy and did not alter tau pathology, we still observed decreased expression of several genes previously described to be TREM2-dependent in both amyloid and tau pathology models. However, there was an increase in TREM2-independent reactive microglial gene expression in TE4-T2KO, suggesting that TREM2-independent microgliosis promotes tau-mediated neurodegeneration in the presence of ApoE4. Interestingly, expression of some TREM2-independent microglia genes (Ctsd and Ctsb) was higher in TE4-T2KO mice compared to TE4 mice (Fig.4I). Ctsd and Ctsb encode for cathepsins D and B, lysosomal proteases that play roles in protein degradation and immune responses. Reifschneider et al. recently demonstrated that loss of TREM2 rescues hyperactivation of microglia, but not lysosomal deficits and neurotoxicity in models of progranulin deficiency25, leading us to hypothesize that TE4-T2KO mice display altered lysosomal phenotypes.
Increase of lysosomal burden in TE4 mice despite TREM2 deletion
We evaluated expression of lysosomal markers in the DAM-like cluster in addition to Ctsd and Ctsb. Both TE4 and TE4-T2KO, expressed higher levels of Grn, Cd68, Lamp2, Timp2, Galc, and Lipa compared to TEKO mice (Fig.5A,B), suggesting higher lysosomal burden in ApoE4-expressing mice with tau pathology. Several lysosomal genes exhibited even higher expression in TE4-T2KO compared to TE4 mice, consistent with lysosomal alterations in TE4-T2KO. We extended these observations by staining for CD68 and found the volume of CD68+ phagolysosomes per microglia was increased in TE4-T2KO mice compared to other groups, including TE4 (Fig.5C,D). We additionally found increased microglial LAMP1 volume per cell in TE4 and TE4-T2KO mice compared to TEKO mice (Fig.5G,H). GFAP+ astrocytes also displayed upregulated LAMP1 volume per cell in TE4 and TE4-T2KO mice compared to TEKO mice (Fig.5G,I), suggesting that the increased lysosomal volume in TE4 and TE4-T2KO mice extends to astrocytes.
Figure 5. Lysosomal burden and synaptic engulfment by microglia are increased in TE4 mice despite TREM2 deletion.
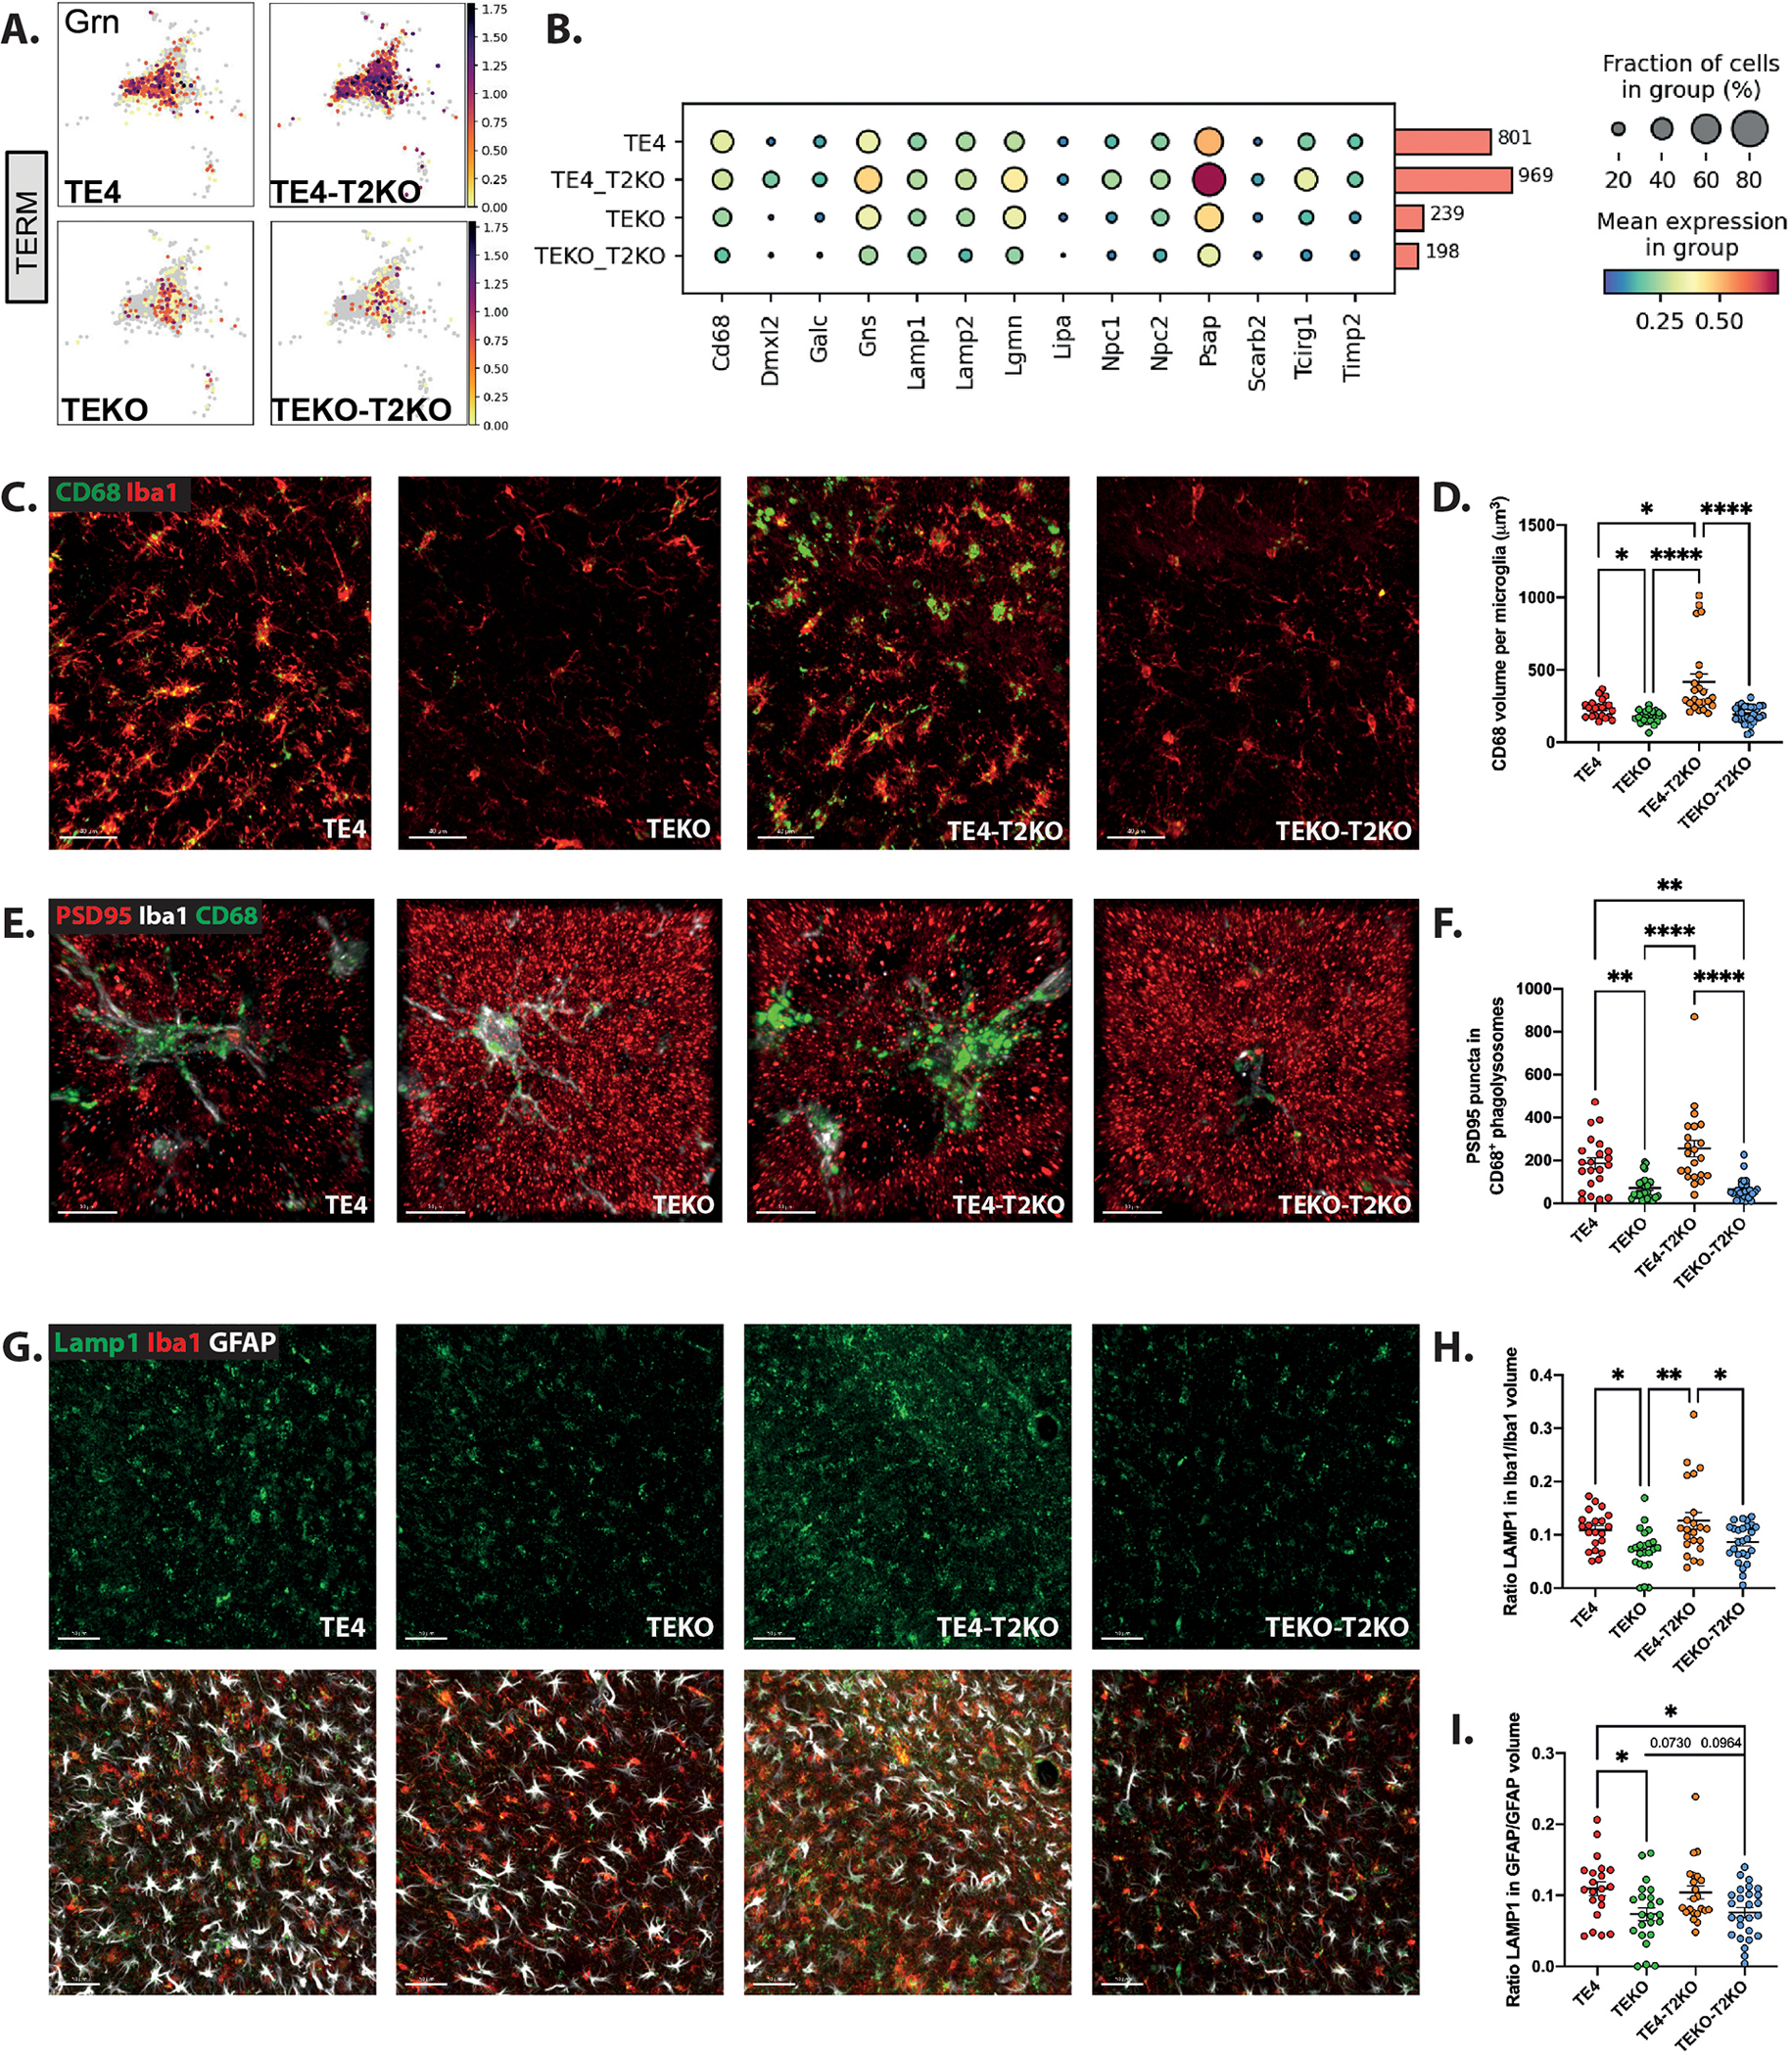
(A) UMAP of Grn gene from Tau/ApoE4 reactive microglia. (B) Dot plot of selected genes showing fraction of nuclei and level of expression of lysosomal-associated genes from the Tau/ApoE4 reactive microglia cluster. (C) Representative images and (D) Quantification of the CD68 (green) volume per microglia (Iba1 (red)) in the HC. Scale bars: 40 μm. (E) Representative images and (F) Quantification of engulfed PSD-95 (red) puncta within CD68+ (green) vesicles per microglia (Iba1 (white)) in the HC. Scale bars: 10 μm. (G) Representative images of Lamp1 (green), GFAP (white) and Iba1 (red) in the HC. Scale bars: 50 μm. (H) Quantification of ratios Lamp1 volume in Iba1+ cells/Iba1 volume (B) and LAMP1 volume in GFAP+ cells/GFAP volume (I). Data are presented as mean ± SEM. Significance was determined using a one-way ANOVA followed by a Tukey’s post hoc test for (H, I) and using a Kruskal–Wallis test followed by a Dunn’s post hoc test due to the nonparametric data set for (D, F). *, P < 0.05; **, P < 0.01; ****, P < 0.0001. (n=20–27 mice/group).
We next tested the effect of TREM2 and ApoE4 on lysosomal morphology in vitro in myeloid cells under stress conditions (Suppl.Fig.2). Bone marrow–derived macrophages (BMDMs) from E4, E4-T2KO, EKO or EKO-T2KO mice were incubated for 6 hours in concentrations of CSF1-containing L-cell-conditioned medium (L929) ranging from optimal to starving (10% to 0.5%). When cultured in media containing 10% L929 media, BMDMs displayed similar LAMP1+ vesicles area/cell, independent of the presence of ApoE4 or TREM2. However, upon L929 media starvation, LAMP1+ vesicle area was significantly increased in E4-T2KO and EKO-T2KO, suggesting that, upon stress conditions, TREM2 deletion, but not ApoE4, can enlarge lysosomal volume in myeloid cells, as observed in the TE4-T2KO mice.
To further characterize lysosomal phenotypes in microglia from TE4 mice with or without TREM2, we measured galectin-3, a marker of damaged lysosomes32–34, in microglia (Fig.6A,B). We observed increased microglial galectin-3 in TE4 compared to TEKO mice, independent of the presence of TREM2 (Fig.6B), suggesting TREM2-independent and ApoE4-mediated lysosomal damage. We also assessed lipid accumulation in microglial lysosomes using LipidTox stain for neutral lipids in CD68+ microglial phagolysosomes (Fig.6C,D). Lysosomes play a major role in lipid metabolism and the maintenance of cellular lipid homeostasis and defective lysosomal lipid metabolism can impair essential lysosomal functions, as seen in lysosomal lipid storage diseases35–37. Interestingly, a recent report indicated ApoE4-mediated microglial lipid accumulation impairs microglia surveillance of neuronal-network activity38. We observed increased lipid accumulation in CD68+ vesicles of microglia in TE4 compared to TEKO mice, independent of the presence of TREM2 (Fig.6C–D), suggesting TREM2-independent and ApoE4-mediated lysosomal lipid accumulation potentially exacerbates lysosomal impairments. To further investigate whether lysosomal lipid accumulation depends on ApoE4, we assessed lysosomal LipidTox staining in P301S mice expressing mouse Apoe. While not littermates in our cohort, these mice express the same human tau mutation and are age- and sex-matched to the other mice being analyzed. Interestingly, we observed reduced microglial lysosomal lipid accumulation in P301S mice expressing mouse Apoe compared to TE4 mice. Lipid accumulation in P301S mice expressing murine Apoe was similar to that found in TEKO and TEKO-T2KO mice (Suppl.Fig.7), suggesting that ApoE4 promotes abnormal lysosomal lipid accumulation in P301S mice.
Figure 6. Lysosomal damage and aberrant lysosomal lipid accumulation in TE4 mice despite TREM2 deletion.
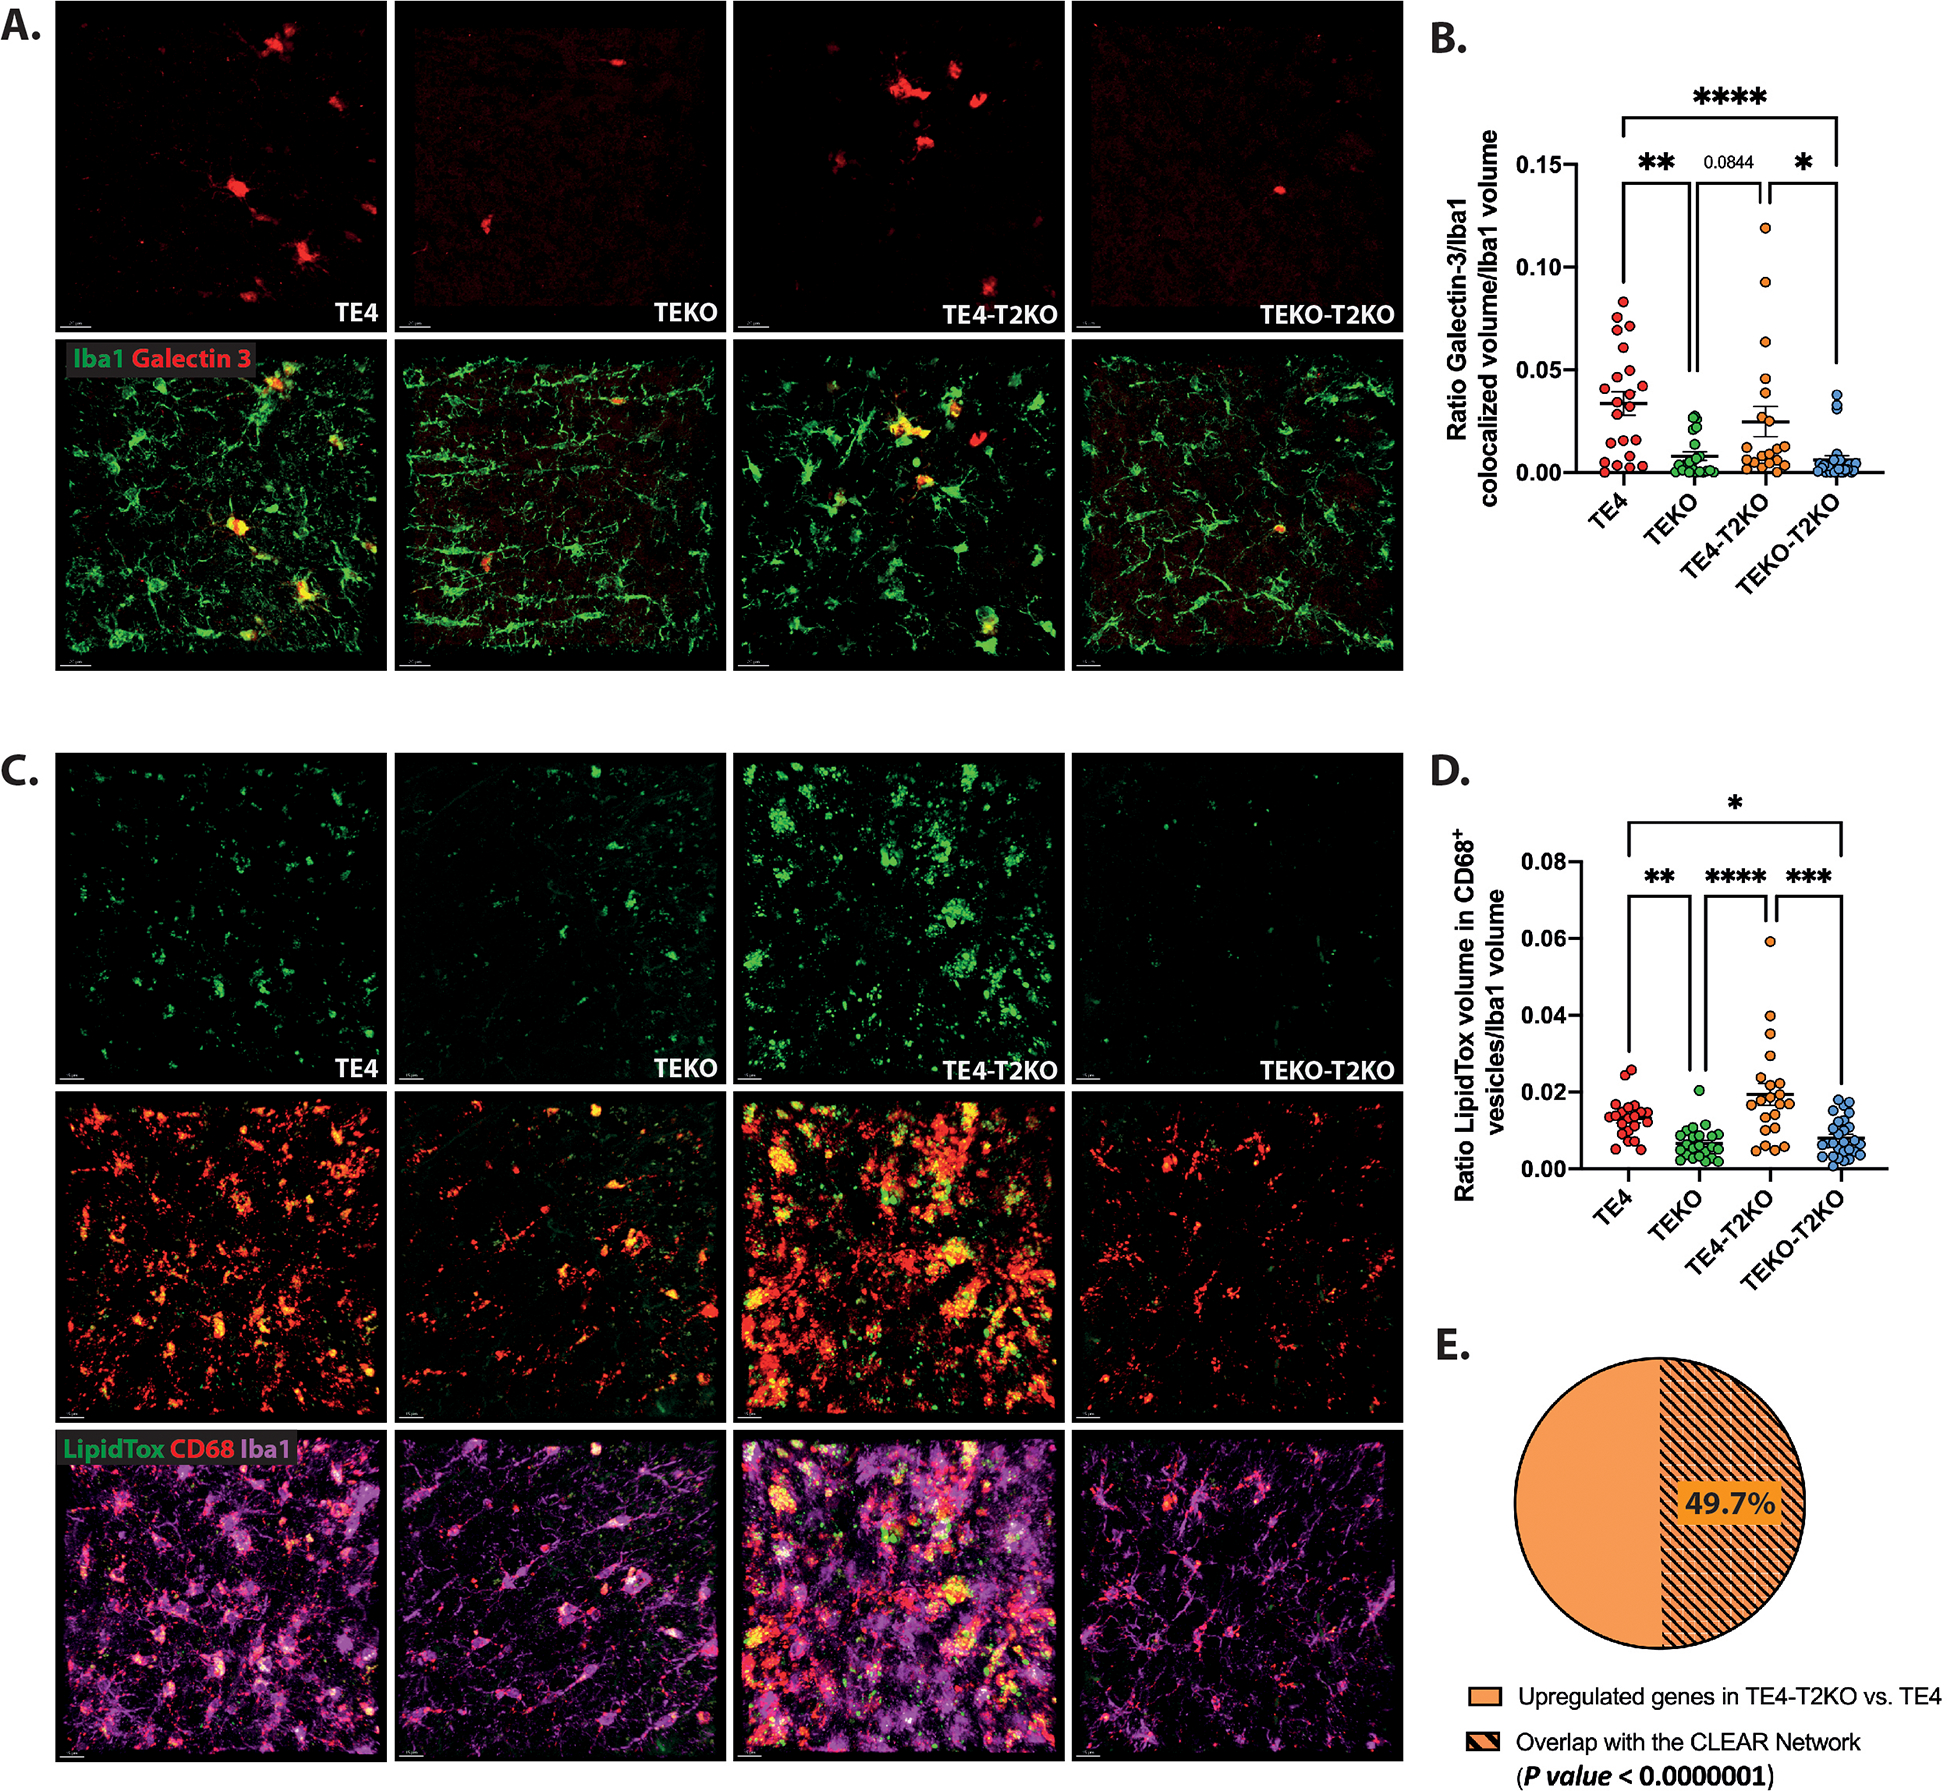
(A) Representative images of Galectin-3 (red) and Iba1 (green) in the HC. Scale bars: 20 μm. (B) Quantification of the ratio of Galectin-3 colocalized with Iba1 volume per Iba1 microglia volume. (C) Representative images of LipidTox (green), CD68 (red) and Iba1 (purple) in the HC. Scale bars: 15 μm. (D) Quantification of the ratio of LipidTox volume within CD68+ vesicles per Iba1 microglia volume. (E) Representative proportion of the percent of genes from the CLEAR network within the upregulated genes in TE4-T2KO vs. TE4 microglia. Data are presented as mean ± SEM. Significance was determined using a Kruskal–Wallis test followed by a Dunn’s post hoc test due to the nonparametric data set for (B, D). For B, one outlier has been detected and excluded from the analysis in the TE4-T2KO group using the ROUT method based on the False Discovery Rate with Q=1%. For E, we used a Chi squared test = 53.948 with 1 degrees of freedom; two-tailed P value < 0.0000001. *, P < 0.05; **, P < 0.01; ****, P < 0.0001. (n=20–27 mice/group).
Given that a subset of genes previously described as Trem2-dependent in microglia remain elevated in the TE4-T2KO, we next assessed whether these genes are upregulated through activation of the CLEAR (Coordinated Lysosomal Expression and Regulation) network following disruption of lysosomal function. TFEB regulates lysosomal function and mediates gene expression by binding to E-box sites at promoters of genes belonging to the CLEAR network39. We first assessed genes that were upregulated (n=157; padj<0.05) in TE4-T2KO microglia compared to TE4. GO analysis showed an enrichment for terms associated with lysosomes in microglia isolated from the hippocampus of TE4-T2KO mice. Next, we assessed the overlap of upregulated genes in microglial TE4-T2KO with the CLEAR network39. We used the interactive TFEBexplorer to identify genes that are predicted to be upregulated by TFEB40. Out of the 157 differentially expressed, upregulated genes in TE4-T2KO microglia, 78 (49.7%) were predicted to be upregulated by TFEB (Fig.6E; Suppl.Table 5), supporting the involvement of the CLEAR network and increased lysosomal burden.
To better understand the mechanisms underlying the augmented brain atrophy in TE4-T2KO mice, we also evaluated whether these mice demonstrate changes in complement components or the NLRP3 pathway, both previously shown to drive tau pathology and tau-mediated neurodegeneration in vivo41–44. We observed no changes in the level of NLRP3-related caspase 1 and ASC (Suppl.Fig.5). Also, no change was observed in C3 level. However, we observed decreased C1qA levels in TE4-T2KO and TEKO-T2KO mice compared to TE4 mice (Suppl.Fig.5B), consistent with previous reports that TREM2 KO decreased C1qa mRNA and protein22,23 and suggesting that more severe neurodegeneration in TE4-T2KO mice is C1q-independent.
Human snRNAseq from AD-E4 patients display similar microglial profiles compared to TE4 mice in TREM2 variant carriers (p.R47H, p.R62H) vs. TREM common variant.
To investigate whether the microglia profile in TE4 mice with or without TREM2 was relevant to human AD, we analyzed microglial snRNAseq from the parietal cortex45,46 from AD donors with at least one copy of APOE4 and either TREM2 common variant (CV) or the AD-associated p.R47H or p.R62H variants (E4-T2car) (Fig.7A). Microglial gene signature comparison between Micro.0 and Micro.1 clusters confirmed a significantly higher homeostatic gene signature in Micro.0 compared to Micro.1, while Micro.1 exhibited a statistically stronger gene signature score for reactive microglia (Fig.7B,C). We then specifically compared gene expression between E4-T2CV and E4-T2car brains in the Micro.1 reactive cluster, similar to our previous analysis in the TE4 mice (Fig.7D,E). Surprisingly, the homeostatic gene signature is higher in AD brains with E4-T2CV compared to E4-T2car, with increased expression of resting microglia genes as CX3CR1 and P2RY12. However, other homeostatic genes as HEXB and TMEM119 were higher in E4-T2car brains, suggesting a complex regulation of homeostatic gene expression in the presence of T2CV and T2car with APOE4. Nonetheless, E4-T2car do not fully recapitulate the homeostatic signature as the median signature score is <0, consistent with the reactive status of Micro.1. We next assessed the expression level of gene subsets based on the DAM transcriptional profile (Fig.7D,E), similar to our analysis in TE4 mice (Fig.4I,J). We detected lower expression of AXL, CD9, SPP1, LPL, CD9, LILRB4, and ITGAX in E4-T2car (Fig.7D,E), similar to what we observed in TE4-T2KO. The TREM2-independent DAM-like transcriptomic state was similar between E4-T2CV and E4-T2car brains (Fig.7D,E) in accordance with our observations in TE4 vs. TE4-T2KO. Finally, we evaluated lysosomal-associated gene expression in microglia from AD brains. While the gene signature score was slightly lower in AD-E4-T2car, several lysosomal-associated genes were expressed at higher levels in E4-T2car, such as DMXL2, GALC, GNS, LGMN, SCARB2 and TIMP2 (Fig.7D,E), similar to lysosomal alterations in TE4-T2KO. We additionally analyzed a subset of the ROSMAP human pre-frontal cortex snRNA-seq data representing APOE4 donors in both TREM2 categories and confirmed higher TREM2-independent gene signature score in AD-E4-T2car compared to AD-E4-T2CV (Suppl.Fig.6)47. There were no statistically significant changes in the homeostatic and TREM2-dependent gene signature score between AD-E4-T2car and AD-E4-T2CV groups (Suppl.Fig.6D), but a stronger, while not statistically significant after multiple test correction (nominal p=1.9e-2; adj. p >0.05), lysosomal-associated gene signature score was present in AD-E4-T2car.These human data support findings in TE4 mice suggesting a sustained TREM2-independent microgliosis and lysosomal activity in the presence of ApoE4 and tau pathology despite TREM2 partial loss-of-function.
Figure 7. Human single-nuclei RNA sequencing from AD-E4 patients display similar microglia profiles in TREM2 variant carriers (p.R47H, p.R62H) vs. TREM2 common variant carriers) as in TE4 mice.
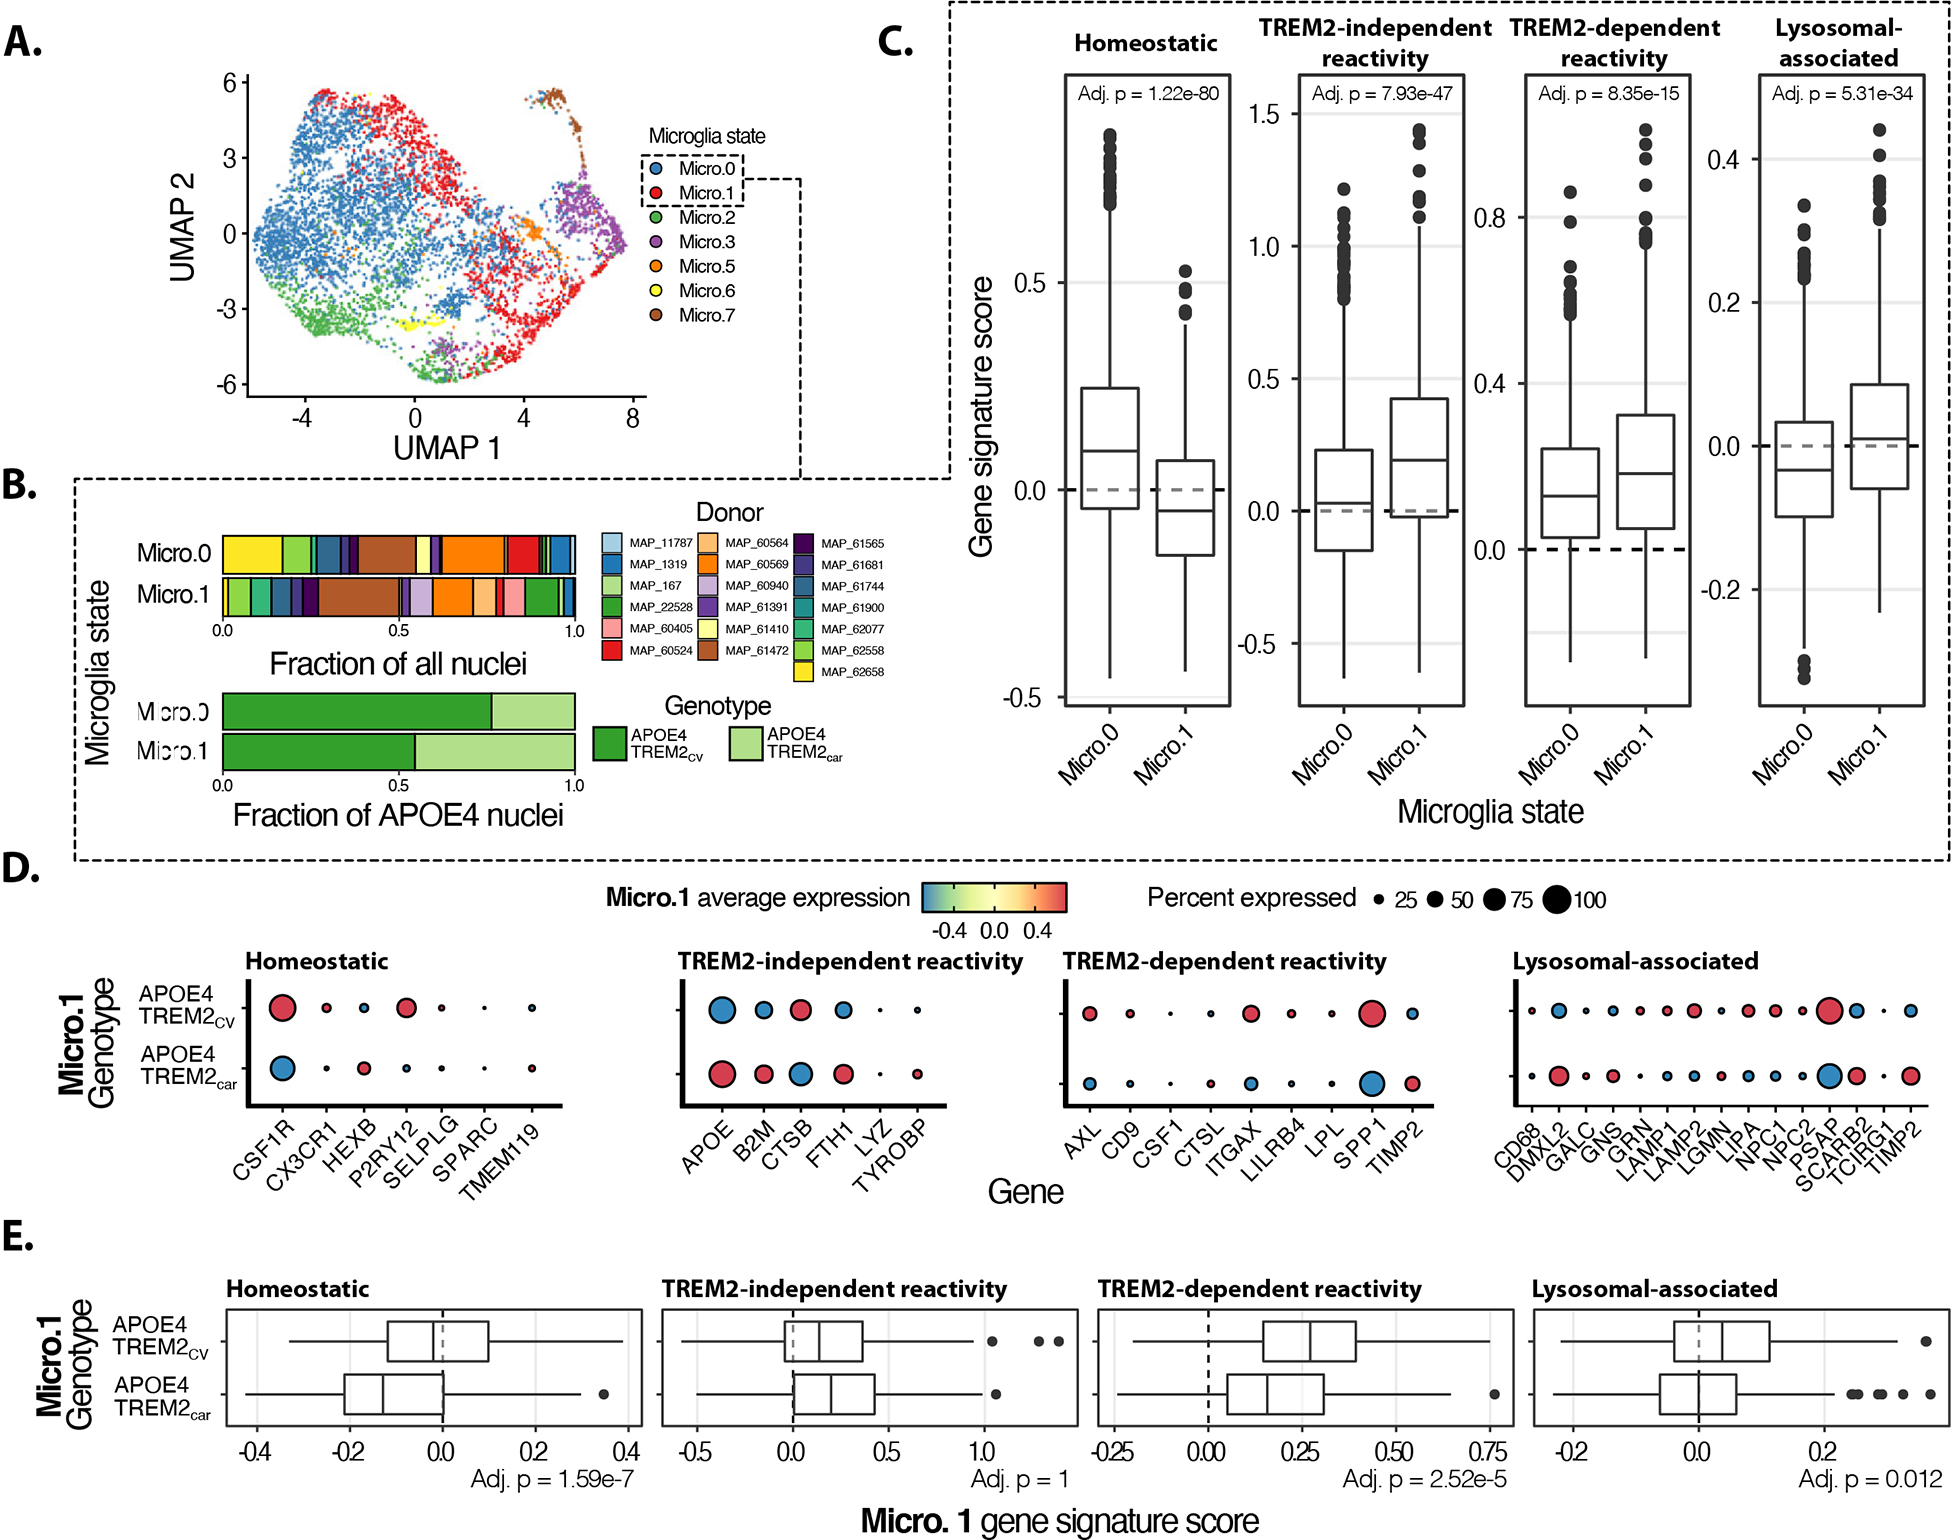
(A) UMAP representation of human microglia snRNA-seq data45. Micro.0 corresponds to resting-state microglia, and Micro.1 corresponds to activated microglia. (B) Distribution of donors and genotypes for Micro.0 and Micro.1. (C) Gene signature score comparisons between Micro.0 and Micro.1. (D) Reactive microglia (Micro.1) gene expression patterns for the signatures of interest across TREM2 genotypes. (E) Gene signature comparisons for the signatures of interest across TREM2 genotypes. Gene signature comparisons p-values calculated using Wilcoxon rank-sum test and adjusted for multiple testing using a Bonferroni correction.
Microglial phagocytosis of synapses remains elevated despite TREM2 deletion in the presence of tau pathology and ApoE4.
We previously described that in P301S mice with mouse Apoe, TREM2 loss-of-function decreased synaptic phagocytosis22. Given that in TE4-T2KO we observed increased CD68+ phagolysosome volume, we evaluated the number of PSD-95 puncta within microglial CD68+ phagolysosomes. We found significantly more PSD-95 puncta in CD68+ vesicles per microglia in the HC of TE4 mice compared to TEKO, independent of the presence of TREM2 (Fig.5C–F), consistent with decreased synaptic density in TE4 and TE4-T2KO. Thus, TREM2 is not required for the phagocytosis of tau-damaged synapses by microglia in the presence of ApoE4.
TREM2 deletion increases GFAP+ astrocytes and ApoE4 levels within microglia and astrocytes in P301S mice.
Previously, we described that TREM2 deletion or loss of function decreased astrogliosis in P301S mice expressing mouse Apoe, concomitant with reduced neurodegeneration22,23. We therefore evaluated whether astrogliosis is affected in TE4-T2KO mice and observed an increase in the volume covered by GFAP in the HC of TE4-T2KO compared to the TE4 mice, TEKO, and TEKO-T2KO mice (Suppl.Fig.8A,B). In addition, because of the previously described function of astrocytic ApoE4 on tau-mediated synaptic loss and neurodegeneration31, we also evaluated ApoE levels in glial cells. Interestingly, there was increased ApoE immunoreactivity level per GFAP+ cell and per Iba1+ cell observed in TE4-T2KO compared to TE4 mice (Fig.8D,E). We did not observe higher ApoE RNA levels in microglia of TE4-T2KO compared to TE4 mice (Fig.4I), possibly suggesting a defect in ApoE4 degradation rather than increased production. Next, we measured whether ApoE4 itself accumulates in the lysosomes of TE4-T2KOs by assessing ApoE colocalized with LAMP1 in microglia and astrocytes in our mice (Fig.8F–H). Interestingly, only half of ApoE immunostaining in microglia is found in LAMP1 vesicles in TE4 mice, independent of Trem2 status. Regarding astrocytes, less ApoE colocalized with LAMP1 in TE4-T2KO mice compared to TE4 mice (Fig.8G). It is possible that this is because less ApoE4 reaches LAMP1+ vesicles of TE4-T2KO mice, resulting in more ApoE outside this compartment.
Figure 8. TREM2 deletion increases GFAP+ astrocytes and ApoE levels in TE4 mice.
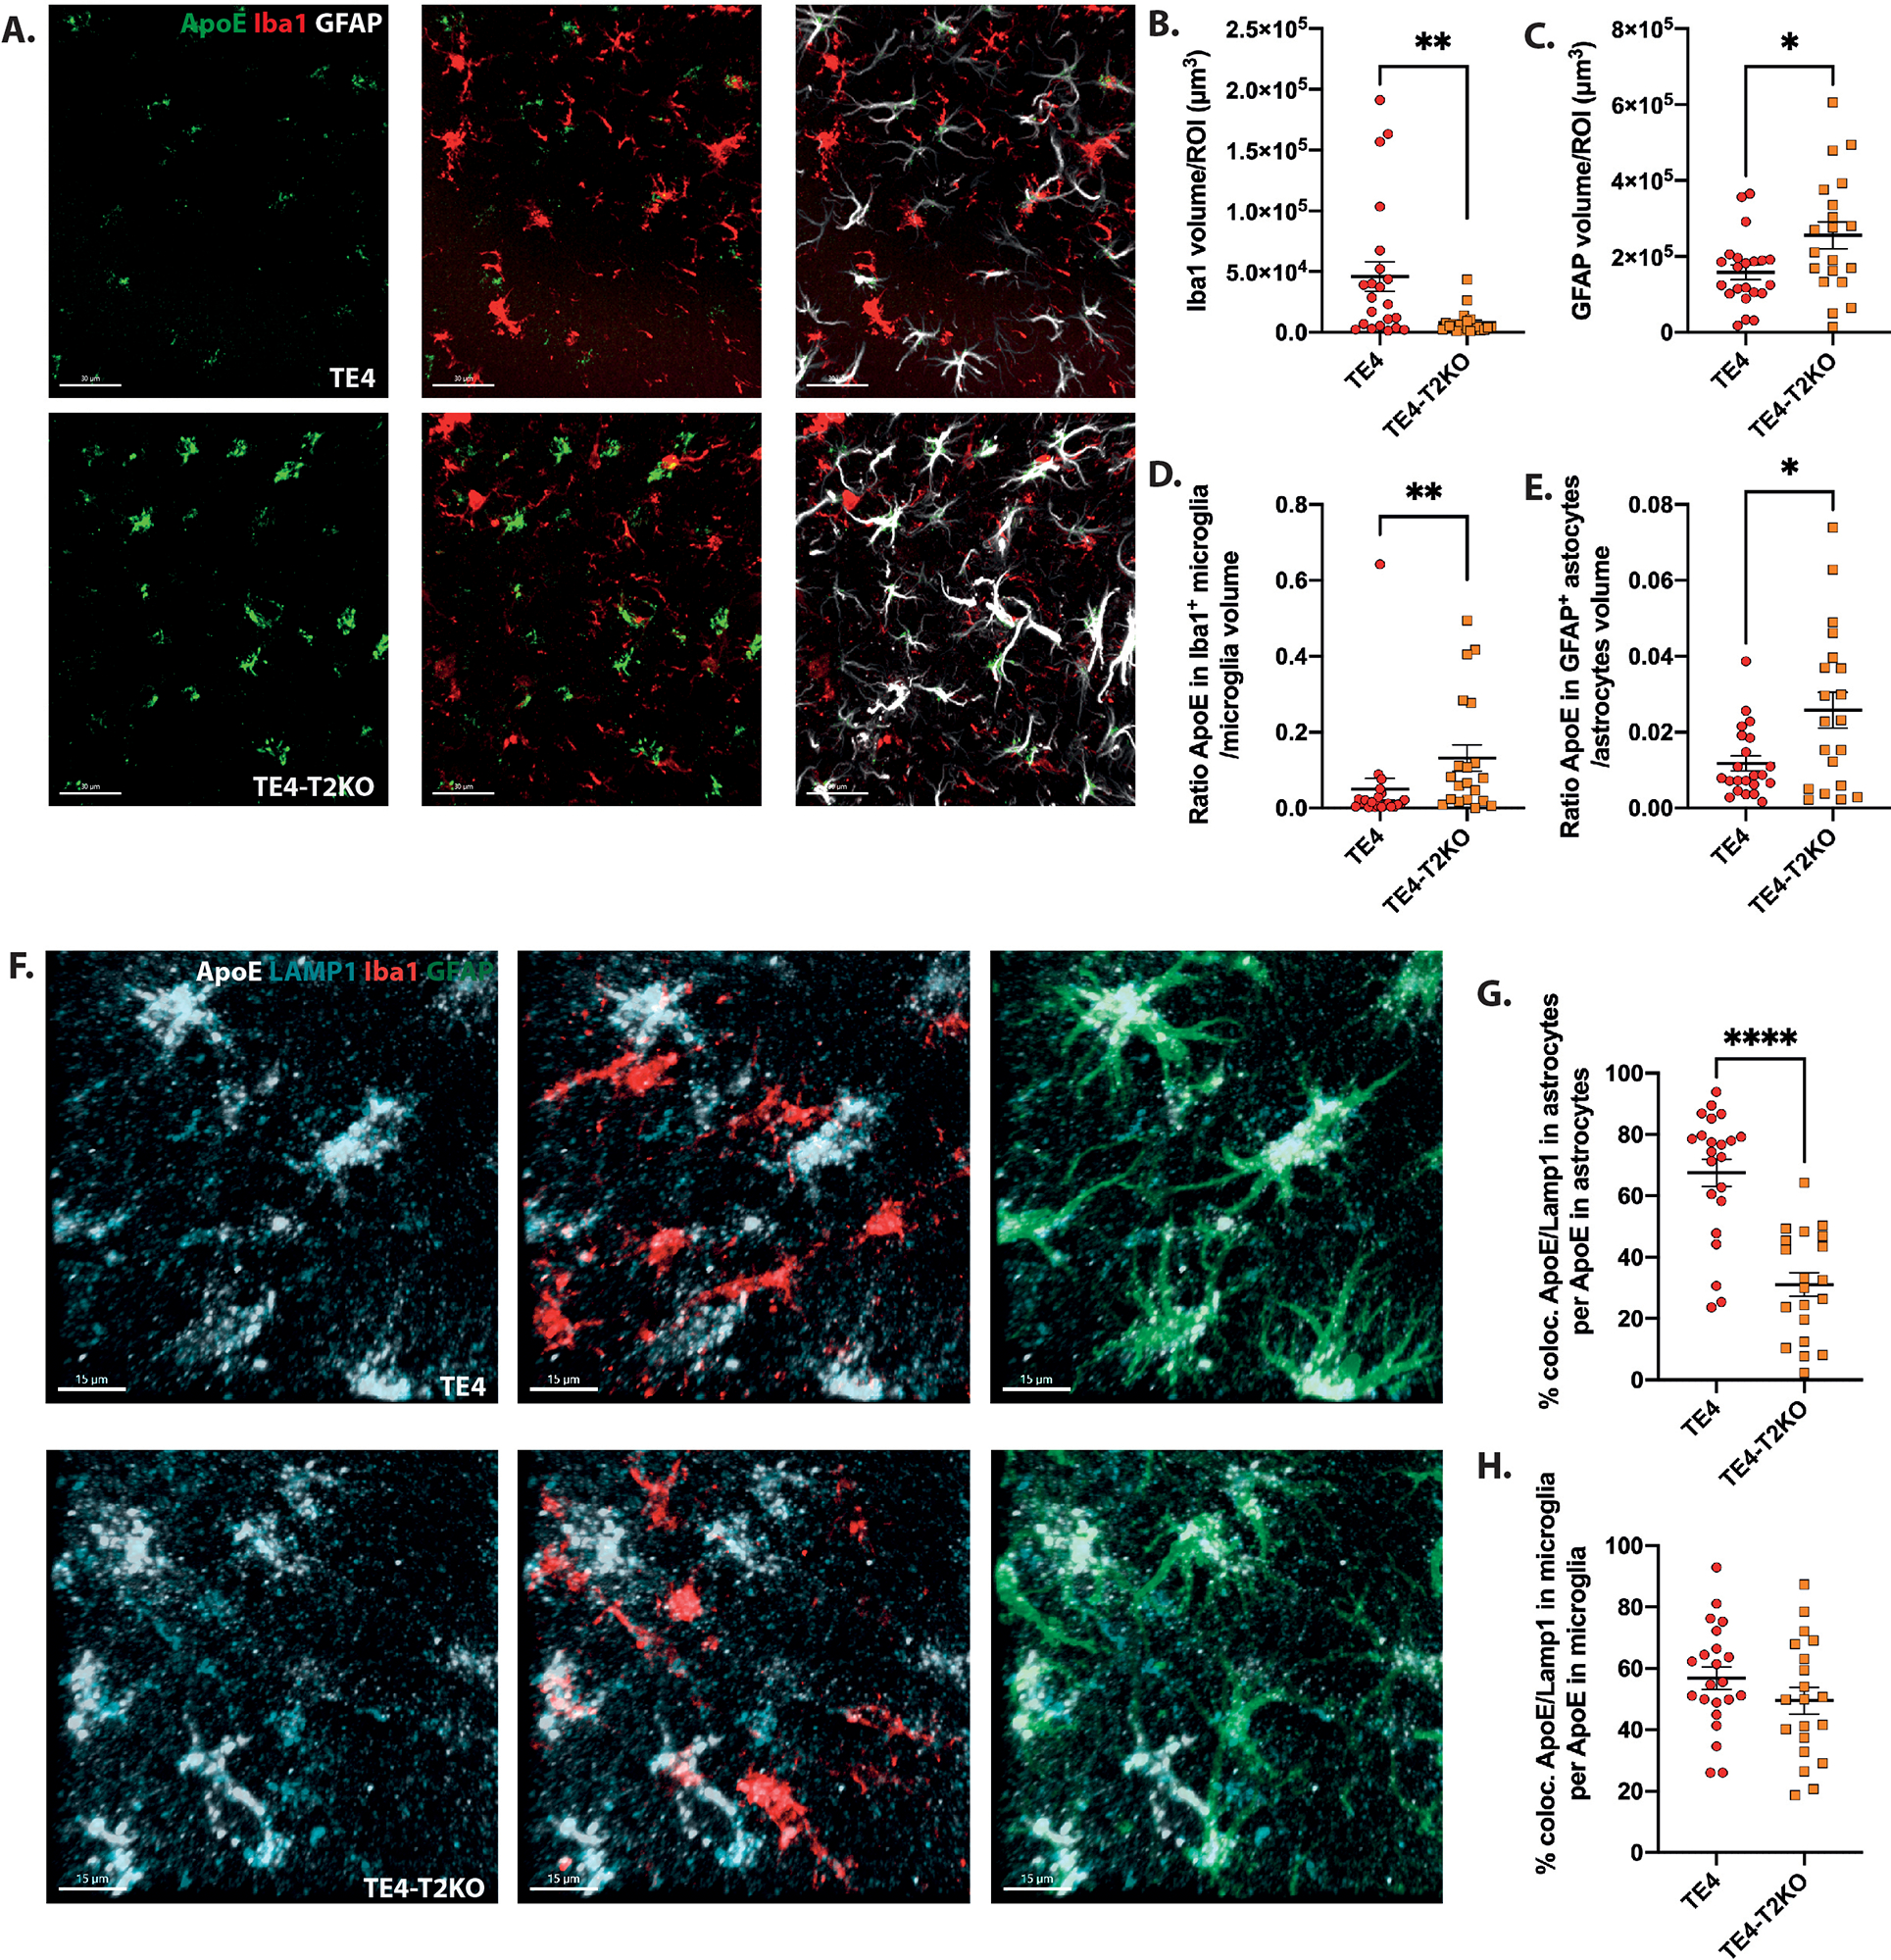
(A) Representative images of ApoE (green), Iba1 (red) and GFAP (white) in the HC. Scale bars: 30 μm. (B, C) Quantification of the average volume covered by Iba1 (B) and GFAP (C)/ROI. (D) Quantification of the ratio of ApoE volume within Iba1+ cells divided by Iba1 volume. (E) Quantification of the ratio of ApoE volume within GFAP+ cells divided by GFAP volume. (F) Representative images of ApoE (white), LAMP1 (cyan), Iba1 (red) and GFAP (green) in the HC. Scale bars: 15 μm. (G-H) Quantification of the colocalized ApoE-LAMP1 volume within GFAP+ (G) and Iba1+ (H) cells. Data are presented as mean ± SEM. Significance was determined using an unpaired, 2-tailed Mann-Whitney test due to the nonparametric data set, except for (C) where an unpaired, 2-tailed t-test with Welch’s correction was used due to significantly different variances. *, P < 0.05 P < 0.01; ****, P < 0.0001. (n=20–22 mice/group).
DISCUSSION
ApoE4 and TREM2 functions in relation to tau pathology and tau mediated neurodegeneration
In this study, we found that TREM2 deletion did not protect against neurodegeneration or synaptic loss in P301S mice that expressed ApoE4. Rather, hippocampal atrophy and tau phosphorylation were increased in TE4-T2KO compared to TE4, suggesting TREM2-dependent microglial functions were protective in the presence of ApoE4. Further analysis revealed decreased expression of genes previously described as TREM2-dependent but sustained TREM2-independent microglial reactivity concomitant with highly expanded lysosomal volume. These data are surprising, as several studies reported that TREM2 loss-of-function is protective against tau-associated microgliosis and neurodegeneration21–23. Moreover, upregulation of genes associated with the DAM-like microglial transcriptomic state, such as Cd68 or Clec7a, and suppression of “homeostatic” microglial genes such as P2ry12, were previously described as strongly correlated with neurodegeneration in P301S mice. However, TE4-T2KO mice exhibited preservation of P2ry12 expression and suppressed Clec7a expression, while still upregulating Cd68 and exhibiting profound neurodegeneration. Our results uncover new complexities in the relationship between ApoE and TREM2 and the overall role of microglia in driving tau-dependent neurodegeneration.
Surprisingly, the protective effects of TREM2-deficiency in P301S mice are completely abolished in the presence of human ApoE4, probably because of differential effects of murine Apoe versus human ApoE4, which share 70% homology at the amino acid level. In amyloid mouse models, ApoE4 strongly increases CAA compared to murine Apoe48, likely due to differences in protein-protein interactions between murine Apoe and human ApoE4 with Aβ. While it is unclear whether microglial responses differ with murine ApoE compared to human ApoE4, prior studies suggest ApoE4 alters endosomal/lysosomal trafficking and cholesterol homeostasis49–51. Altogether, these studies suggest that interpretation of previous studies of microglia in tauopathy need to consider potential differential effects of murine Apoe versus human ApoE4.
We recently showed that selective removal of astrocyte-derived ApoE4, but not ApoE3, reduces tau-associated neurodegeneration31. These results suggest that ApoE4 exerts a degree of toxic gain-of-function in relation to other human APOE isoforms. In the present study, TREM2 deletion elevated ApoE4 levels in astrocytes of TE4 mice, which could potentially exacerbate a toxic effect of APOE4 and contribute to the neurodegenerative process in TE4-T2KO mice. Previous studies found that astrocyte APOE4 was upregulated upon microglia depletion using CSF1R antagonists; however, microglial depletion also strongly blocked neurodegeneration. Together, these results suggest that astrocyte-derived ApoE4 may exacerbate toxicity, but that toxicity requires the presence of microglia and specifically TREM2-independent microglial mechanisms.
Several studies have hypothesized functional links between TREM2 and APOE as key regulators of microglial responses to neurodegenerative insults52,53. Previous studies, along with findings in this study, show knockout of Trem2 or Apoe results in similar preservation of “homeostatic” expression of genes such as P2ry12 or Tmem11954. In addition, some microglial phenotypic similarities are observed for Trem2 and Apoe knockout including increased lipid droplet formation in response to demyelinating injury or deficits in microglial clustering around amyloid plaques14,55,56. Some studies have also described a direct interaction between ApoE and TREM2 that could influence phagocytosis or TREM2 signaling57,58. A few studies have investigated the effect of TREM2 function in the context of APOE3 or APOE4 in AD pathology and in mouse models. Deletion of Trem2 in APPPS1ΔE9 mice that expressed human ApoE3 or ApoE4 found isoform and age-dependent effects of TREM2 function on plaque growth and DAM-gene expression52. Analysis of snRNAseq data from human AD patients found that ApoE4 or TREM2-R47H were associated with a reduction in an amyloid-responsive CD163+ microglial population59. In contrast to our previous findings in P301S mice that express mouse Apoe, in this study we found that TREM2 knockout alongside ApoE4 expression did not protect against neurodegeneration. Further studies will be required to confirm these results are specific to ApoE4 as opposed to ApoE3 or ApoE2.
Tau-mediated microgliosis: what drives the neurodegeneration?
Our snRNA-seq data show that tau pathology and neurodegeneration were associated with a decrease in the overall proportion of homeostatic microglia in the presence of ApoE4, independent of the presence of TREM2. This tau-dependent switch from a homeostatic state to a reactive state with some features of a “DAM-like” state was attenuated in TEKO, which also had reduced neurodegeneration. Although the removal of TREM2 did not grossly affect the overall homeostatic and reactive microglia proportions as identified in snRNAseq, removal of TREM2 lowered the expression of several genes such as Lpl, Cd9 or Spp1 previously attributed to a TREM2-dependent transcriptomic state of “Stage-2 DAM” in amyloid models12. DAMs were originally identified by comparing scRNA-seq transcriptomes of microglia in the brains of wild-type mice or in an amyloid mouse model and expressed TREM2-dependent and independent genes12. We similarly identified TREM2-independent microglial lysosomal-related gene expression in TE4-T2KO mice. Markers associated with TREM2-dependent, DAM-like microglia, such as Clec7a, positively correlate with neurodegeneration in tau models, but are associated with plaque-associated microglia in amyloid models that are generally considered as protective. This raises the puzzling question of how similar microglial transcriptional programs can apparently be associated with protection during amyloid phases of AD pathology and harmful during tau phases. Our results indicate that not all transcriptomic responses associated with the DAM-like state may be important for driving neurodegeneration. Inhibition or knockout of TREM2 in Grn−/− mice enhanced neurodegeneration while attenuating induction of several DAM-associated genes while preserving upregulation of lysosomal and phagocytic-related genes25. In addition, non-DAM-associated microglial programs, such as interferon-responsive microglia are implicated in tau pathology, neurodegeneration, and synaptic phagocytosis9,60,61. It will be important to thoroughly characterize the complex functional programs that are upregulated and downregulated within microglia to determine which may be beneficial and which may be injurious.
Conclusion
We found that in mice expressing ApoE4, TREM2-independent microglial reactivity drives tauopathy-induced brain atrophy and synaptic loss. Although TREM2 deletion decreased the expression of a subset of DAM-like genes, lysosomal-related genes remained elevated in microglia and astrocytes alongside high synaptic phagocytosis, which can explain, at least partially the absence of neuroprotection. Further understanding of the specific microglial profile driving neurodegeneration in AD and in primary tauopathies will be essential to develop novel therapeutic strategies targeting TREM2 and microglia.
STAR★Methods
Resource availability
Lead contact
Further information and requests for resources and reagents should be directed to and will be fulfilled by the Lead Contact, David M. Holtzman (holtzman@wustl.edu).
Materials availability
This study did not generate new unique reagents.
Data and code availability
-
Mouse snRNA-seq data that support the findings of this study have been deposited in the Gene Expression Omnibus (GEO) database with accession number GSE206368. For Human data: http://ngi.pub/SNARE/
Sequence files, quantified gene expression and clean data from the Knight ADRC are available in NIAGADS (https://dss.niagads.org/datasets/ng00108/).
For the evaluation of the CLEAR network in the microglial upregulated genes in TE4-T2KO mice, we used the interactive TFEBexplorer (https://tfeb.tigem.it/help.php) to identify genes that are predicted to be upregulated by the master regulator TFEB.
This study did not generate new original code.
Any additional information required to reanalyze the data reported in this work paper is available from the Lead Contact upon request.
Experimental model and subject details
Animals
P301S Tau transgenic mice (Stock No. 008169, Jackson Laboratories) harbors 1N4R tau overexpressing the human P301S tau mutation, driven by the mouse prion protein PrP promoter. These mice have been backcrossed to C57BL/6 mice (Stock No. 027, Charles River) more than 10 times. Human ApoE4 KI mice (C57BL/6) were provided by P. M. Sullivan (Duke University) and ApoE KO mice (C57BL/6) were purchased from The Jackson Laboratory (002052). P301S tau transgenic mice were crossed to human ApoE4 mice to generate TE4 mice. Separately, ApoEKO (EKO) mice were crossed to TREM2KO (T2KO) mice to generate ApoE+/− TREM2+/−, which were then crossed together to obtain EKO-T2KO mice. EKO-T2KO mice were crossed with TE4 mice to generate F1 heterozygotes. F1 × F1 produced the generation of TE4, TEKO, TE4-T2KO, TEKO, TEKO-T2KO, E4, TKO, E4-T2KO, EKO, and EKO-T2KO used in this study. Because male PS19 mice at different ages have greater tau pathology and neurodegeneration, and less variability than female mice, only males were used for analysis in this study. All mice were on a C57BL/6 background. All P301S Tau transgenic mice involved in the final analysis were obtained from the same generation. Littermates of the same sex were randomly assigned to experimental groups. All animal procedures and experiments were performed under guidelines approved by the Institutional Animal Care and Use Committee (IACUC) at Washington University School of Medicine. All experiments and data analysis was accomplished by researchers who were completely blind to the genotype of the mice.
Sample collection
At the time of death, mice were anesthetized with i.p. pentobarbital (200 mg/kg). Blood samples were collected in EDTA-treated tubes before cardiac perfusion with 3 U/mL heparin in cold Dulbecco’s PBS. Blood samples were spun down (10 minutes, 2000 g, 4°C), and blood plasma was collected. Brains were carefully extracted and cut into 2 hemispheres. The left hemisphere was collected for immunostaining and fixed in 4% paraformaldehyde overnight before being transferred to 30% sucrose and stored at 4°C until they were sectioned. Brains were cut coronally into 50-μm sections on a freezing sliding microtome (Leica, SM1020R) and stored in cryoprotectant solution (0.2 M PBS, 15% sucrose, 33% ethylene glycol) at −20°C until use. The right hemisphere was dissected to isolate the hippocampus and the cortex for biochemical analysis, and the tissue was kept at −80°C until analyzed.
Method details
Volumetric analysis and neuronal layer thickness measurement
Brain sections were mounted and allowed to dry overnight. The following day, sections were stained in cresyl violet for 6 minutes at room temperature. The slices were then sequentially dehydrated in increasing ethanol concentrations followed by xylene and coverslipped with Cytoseal 60 (Thermo Fisher Scientific, 8310–16). Slides were scanned using Hamamatsu’s Nanozoomer microscope at 20X magnification. Hippocampus and EC/PC were traced using the NDP.view 2. Volumetric analysis of the hippocampus and the entorhinal/piriform cortex was performed via stereological methods by assessing sections spaced 300 μm starting from bregma −1.1 mm to bregma −3.2 mm (6 – 8 sections per mouse depending on the severity of brain atrophy). The formula for the volumetric calculation was volume = (sum of area) * 0.3 mm. Three sections, corresponding approximately to bregma coordinates −1.7, −2.3, and −2.9mm were selected to measure the thickness of the dentate gyrus granular cell layer by drawing a scale perpendicular to the cell layer in all 3 slices and taking the average value for each mouse.
Immunohistochemistry
Three sections were selected for AT8-biotinylated, AT180, and MC1 immunohistochemical staining. Sections were washed in Tris-buffered saline (TBS) buffer 3 times, for 5 min each. After washing, sections were incubated in 0.3% hydrogen peroxide in TBS for 10 min at room temperature in order to block endogenous peroxidase activity, followed by 3 washes in TBS, for 5 min each. Sections were then blocked with 3% milk in TBS with 0.25% Triton X-100 (TBSX) for 1 h at room temperature to prevent non-specific antibody binding. Then sections were incubated at 4°C overnight with AT8-biotinylated antibody (mouse monoclonal, 1:500), AT180 antibody (mouse monoclonal, 1:500), and MC1 antibody (mouse monoclonal, 1:500), respectively. The next day, after 3 washes in TBS, sections incubated with AT180 or MC1 antibodies were incubated with goat anti-mouse HRP-conjugated secondary antibody (1:500) in 3% milk in TBS with 0.25% Triton X-100 for 1 h at room temperature. For AT8 staining, after washing, sections were incubated in ABC Elite solution (VectaStain, PK-6100) for 1 hour, followed by 3 times washing in TBS. Finally, sections were developed and stained using DAB Peroxidase Substrate, washed, and mounted on slides. After drying overnight, the slides were dehydrated in increasing ethanol concentrations followed by xylene, coverslipped with Cytoseal 60, and scanned using Hamamatsu’s Nanozoomer microscope at 20X magnification. Images were analyzed using the NDP.view 2. Images were further processed and quantified with the use of Fiji software.
Immunofluorescence
For immunofluorescent staining, sections were washed in Phosphate-buffered saline (PBS) 3 times, for 5 min each. After washing, sections were permeabilized with 0.25% PBSX for 30min, followed by 3 washes in TBS, for 5 minutes each. Then sections were blocked in 3% Bovine serum albumin/3% donkey serum in 0.1% PBSX for 1 h at room temperature, followed by overnight incubation at 4°C with primary antibodies (rabbit polyclonal apoE, 1:500; mouse monoclonal GFAP, 1:500; goat polyclonal Iba1, 1:500; rabbit polyclonal Iba1, 1:2000; rabbit polyclonal P2ry12, 1:500; rat monoclonal Clec7a, 1:50; mouse monoclonal LAMP1, 2μg/ml; rabbit polyclonal PSD-95, 1:500; rabbit polyclonal Galectin-3, 1:500 and rat monoclonal CD68, 1:500). The next day, after 3 washes in PBS, sections were incubated with corresponding fluorescence-labeled secondary antibodies for 2 h at room temperature. Then sections were washed in PBS 3 times, for 20 min each, followed by incubation in 0.1% Sudan black solution in 70% ethanol for 10 min. Finally, sections were washed in PBS 3 times and mounted in MWL4–88 with antifade 300 added (9 parts of MWL 4–88 to 1 part antifade 300). To simultaneously stain neutral lipids with immunofluorescently-labeled proteins, we used a digitonin-based buffer to selectively permeabilize cell membranes without disrupting intracellular lipid accumulation 63. A fresh 5% digitonin solution was prepared just before each stain by adding boiling water to digitonin powder (EMD Millipore, 300410) followed by mixing and heating at 98°C for 15 minutes. This 5% digitonin stock was diluted 1:500 with TBS and filtered using a 0.22 um filter to make the 0.01% digitonin permeabilization solution. After three 5 minutes washes with TBS, floating tissue sections were incubated in permeabilization solution for 10 minutes at room temperature. After three TBS washes, tissues were blocked with 5% donkey serum/TBS for 1 hr at RT and then incubated in primary antibodies in 1% donkey serum/TBS overnight at 4C. After three TBS washes, tissue sections were incubated in a mix of secondary antibodies and the neutral lipid dye LipidTox Green (1:1000, Invitrogen H34475) for 1.5 hr at RT 65. Following three TBS washes, sections were mounted onto glass slides and imaged via confocal microscopy similarly to other immunofluorescence staining.
Six images per mouse were obtained for analysis. Images in Figures 4G, 4K, 5C, 5G, 6A, 6C, 8A, and 8F were taken using a Leica Stellaris 5 confocal. Images in Figures 1F and 5E were taken using a Zeiss LSM 880 II Confocal with an AiryScan detector. Images in Suppl.Figure 2 were taken by Cytation 5 and analyzed by ImageJ. Quantification of confocal images were performed on a semiautomated platform using MATLAB and Imaris 9.7.1 software to create surfaces of each stain based on a threshold applied to all images and colocalize surfaces. For PDS95, spots were detected for each channel using an x-y size of 0.2 μm, a z size of 0.6 μm, and an automated background subtraction. A 0.1-μm x-y and 0.3-μm z guard was applied to exclude spots intersecting the edge of the image volume. Three images per mouse were obtained in the polymorphic layer of the piriform cortex for this analysis. For quantification of the number of PSD-95 puncta engulfed in CD68+ phagolysosomes, the PSD-95 puncta previously detected was automatically counted within the CD68+ surface per microglia using Imaris 9.7.1 software. Three to five microglia were imaged for each mouse.
Soluble/Insoluble tau extraction.
Hippocampus was weighed and homogenized using a pestle with 20 μL buffer/mg tissue (10 mM Tris-HCl pH 7.4, 0.8 M NaCl, 1 mM EDTA, 2 μM DTT, 0.1% Sarkosyl, cOmplete and PhosStop [both Roche], and 10% sucrose). Samples were centrifuged for 10 minutes at 10,000 g and 4°C. Supernatant was removed and kept on ice while the pellet was re-homogenized in the same volume of buffer with a sonicator at 30% amplitude, 1 second on/1 second off pulse, for 1 minute, and centrifuged for 10 minutes at 10,000 g and 4°C. The 2 supernatants were pooled together and incubated with 1% Sarkosyl rotating at RT for 1 hour. Samples were then centrifuged for 1 hour at 300,000 g and 4°C. The supernatant is the sarkosyl-soluble fraction (SS). The pellet was washed in PBS, suspended in PBS and sonicated at 30% amplitude, 1s/1s pulse, for 1min (Sarkosyl-insoluble fraction (SI)). SS and SI fractions were frozen until used for ELISA or Western Blot.
Total tau and pTau ELISA.
The concentration of tau and pTau was quantified as previously described 22 by sandwich ELISA using Tau-5 (in-house antibody) as the coating antibody and human-specific biotinylated HT7 for detection for tau ELISA and using HJ14.5 (in-house p.Thr181-tau antibody) as the coating antibody and human-specific biotinylated AT8 for detection for pTau ELISA. Briefly, 96-well halfarea plates were coated with 20 μg/mL of either HJ14.5 or Tau-5 antibody and incubated at 4°C overnight. The next day, the plate was blocked in 3% BSA (RPI Corp.) in PBS for 1 hour at 37°C. Next, peptide standards and samples were diluted in sample buffer (0.25% BSA/PBS, 1× protease inhibitor, 300 mM Tris pH 7.4, PBS), loaded onto the plate, and incubated at 4°C overnight. On the third day, 0.3 μg/mL of biotinylated AT8 for pTau ELISA (Thermo Fisher Scientific, MN1020B) or biotinylated HT7 for tau ELISA (Thermo Fisher Scientific, MN1000B) was applied to the plate for 1.5 hours at 37°C, and then Streptavidin-poly-HRP-40 (1:10,000 for tau and 1:6,000 for pTau) (Fitzgerald) was applied for 1.5 hours at room temperature. TMB Superslow Substrate solution (MilliporeSigma) was added and the plates were read at 650 nm on a BioTek plate reader after developing for 30 minutes at room temperature. All samples were run in duplicate.
Protein extraction and Western Blot
Hippocampus tissues were lysed using cold RIPA buffer. Samples were selected based on the mean values of hippocampal volumes. Complete Protease Inhibitor and phosSTOP Phosphatase Inhibitor were added freshly to RIPA buffer. Tissues were weighed and hand-homogenized in cold RIPA buffer at 20 μl buffer/mg of tissue. Homogenate was centrifuged 30min at 20,000 g at 4°C in a microcentrifuge. Supernatant was collected for western blot. Protein concentration was determined by using BCA Protein Assay Kit. 5 μg of total protein was loaded and separated by 4%–20% Mini-PROTEAN TGX gels in Tris/Glycine/SDS running buffer (Bio-Rad). Gel was transferred on a PVDF membrane using the Trans-Blot Turbo Transfer System (Bio-Rad). The membrane was blocked with 5% milk in TBS with 0.05% Tween (TBST) for 60 min at room temperature, followed by incubation with AT8 antibody (mouse monoclonal, 1:1000), AT180 antibody (mouse monoclonal, 1:1000), total tau Tau5 antibody (mouse monoclonal, 1:1000), ASC (rabbit polyclonal, 1:1000), C3 (rabbit polyclonal, 1:1000), C1qA (rabbit polyclonal, 1:1000), Caspase 1 (mouse monoclonal, 1:1000) and Pan-actin (rabbit polyclonal, 1:5000) at 4°C for overnight. The next day, membrane was incubated with corresponding secondary HRP-conjugated secondary antibodies for 1 h at room temperature. Images were captured using the ChemiDoc MP Imaging System (BIO-RAD) and analyzed with ImageJ.
NfL concentration
Plasma NfL concentration was measured with NF-Light Simoa Assay Advantage kit using Simoa HD-X. The measurement was performed following the manufacturer’s instructions.
Nuclei isolation and FANS
Hippocampi from 3 mice per experimental group were pooled for single nuclei RNA-seq. Dissected hippocampi were homogenized in lysis buffer (10% Triton X-100, 0.1M DTT, 40U/μL RNasin Promega, protease inhibitor complex, and 2% BSA in PBS) using a Dounce homogenizer for 10 strokes. Samples were incubated for 5 minutes on ice and then centrifuged at 500 × g for 5 minutes at 4μ°C in a tabletop centrifuge. The pellet was resuspended in sort buffer (0.5M EDTA, 40U/μL RNasin Promega, 2% BSA in PBS), transferred to FACS tube, filtered through a 70-μm mesh strainer, and centrifuged at 800 × g for 5 minutes at 4°C in a swinging bucket centrifuge. We resuspended the pellet in sort buffer and stained with the following antibodies: mouse anti-NeuN-Alexa Fluor 488 (1:500; MilliporeSigma; MAB377X [clone A60] and rat anti-SPI1 (PU.1) - PE (1:100; Biolegend 681308 [clone 7C2C34]) for neurons and microglia, respectively. DAPI (1:1,000; BioLegend 422801) was used to label nuclei. After immunolabeling, samples were strained through a 70-μm mesh strainer, washed 1 more time, resuspended in sort buffer, and kept on ice until FANS. PU.1+ nuclei were purified by FANS using a Beckman Coulter Mo-Flo Astrios EQ sorter. After selection of DAPI+ nuclei and exclusion of doublets, we gated on PU.1+ nuclei (Suppl.Fig.3).
Single nuclei RNA-seq
The resulting purified nuclei were centrifuged at 800 × g for 5 minutes at 4°C and then resuspended in PBS supplemented with 400 mg/mL bovine serum albumin (Sigma Aldrich, B6917). Individual nuclei were then coupled to beads using the 10X Genomics Chromium controller. Single nuclei sequencing libraries were prepared following the 10X Genomics Protocol using v3.1 chemistry and sequenced to a median depth of approximately 50,000 reads per nucleus using an Illumina NovaSeq 6000 on a rapid run. Data was mapped using Cell Ranger (10X Genomics) to mm10 and analyzed using the Seurat R toolkit for single-cell genomics67. We obtained a median of ~500 genes per nucleus. Nuclei with more than 5% of mitochondrial genes and clusters enriched for mitochondrial genes were removed. We also filtered out 1 non-myeloid nuclei cluster based on predominantly neuronal marker expression.
Human snRNA-seq data
Human parietal cortex tissue samples were obtained from the Knight Alzheimer Disease Research Center (Knight ADRC) and processed as described previously45,46. We selected from this dataset only donors with neuropathology-confirmed AD and at least one copy of ApoE4. We stratified the donors based on TREM2 genetic status. In total, we selected 6 carriers of TREM2 variants p.R47H or p.R62H (TREM2car; n=642 nuclei) and 9 non-carriers of any known variant in TREM2 associated with AD risk (TREM2CV; n=1,358 nuclei). We normalized the microglia from the snRNA-seq data using the SCTransform function from the Seurat package69. We used the Nebula package 71 to perform differential expression analyses using a generalized linear model controlling for donor age of death and sex, but were underpowered to detect significant changes in gene expression for the tested genes individually in activated microglia (Micro.1) across TREM2 genotypes. To circumvent this issue, we estimated gene signature scores for each nuclei using the AddModuleScore function to determine the expression profile of homeostatic microglia, (Trem2-independent), (Trem2-dependent), and lysosomal. This method compares the average gene expression of a gene list of interest to a set of background genes matched by gene expression 72. For each gene list of interest, we included the same number of background genes. Positive gene signature scores indicate the gene signature is higher than the background genes. To compare signatures across groups, we performed Wilcoxon rank-sum tests, which were adjusted for multiple testing using the Bonferroni correction. For visualization purposes, the SCT-normalized snRNA-seq data was projected in UMAP space using Seurat’s function RunUMAP with principal components 2 through 8. Principal component 1 was highly correlated with barcode sequencing depth (Spearman’s ρ=0.56, p<2.2e-16) and discarded.
We obtained human-mouse orthology data from the Mouse Genomics Informatics database (HOM_MouseHumanSequence.rpt, obtained from http://www.informatics.jax.org/downloads/reports). Most mouse genes analyzed (38 of 40) had one-to-one orthology with human, and we included both human orthologs for Ccl6 (CCL15 and CCL22) and Ctsl (CTSL and CTSV).
We additionally analyzed the ROSMAP human pre-frontal cortex tissue snRNA-seq data from the Rush Alzheimer’s Disease Center 47. This data was integrated with the Knight ADRC cohort as described previously 45. We analyzed a subset of this cohort representing ApoE4 donors in both TREM2 categories (n=5 TREM2CV donors, n=593 nuclei; n=4 TREM2car donors, n=759 nuclei). We performed the gene signature scores analyses as described above.
All tissue samples were obtained for the original studies with informed consent for research use and were approved by the review board of the respective institutions according to the National Institute on Aging-Alzheimer’s Association (NIA-AA) criteria.
Quantification and statistical analysis
Statistics
All results were reported as mean ± SEM and all statistical analyses were conducted in Prism 9 (GraphPad). Gaussian distribution was evaluated using the D’Agostino-Pearson normality test. Statistical analysis between two groups was performed using a 2-tailed Student’s unpaired t-test under a normal distribution. In case of unequal variances, Welch’s correction was used with the Student’s unpaired t-test. If samples deviated from the normal distribution, statistical analysis was performed using a Mann-Whitney test. Statistical analysis for more than two groups was performed using ordinary one-way ANOVA followed by a Tukey’s post hoc test under a normal distribution. In case of unequal variances, Welch’s and Brown–Forsythe tests were used. If samples deviated from the normal distribution, statistical analysis was performed using Kruskal–Wallis test followed by a Dunn’s post hoc test. p-value less than 0.05 (p < 0.05) was considered as statistic significant difference. *, P < 0.05; **, P < 0.01; ***, P < 0.001; ****, P < 0.0001. The number of mice per group (n) used for each experiment can be found in figure legends. For the supplemental figure 2, n represents biological replicates in technical duplicates.
Supplementary Material
Suppl. Table 1: Marker genes (related to Figure 3)
Suppl. Table 2: Tau/ApoE4 reactive microglia vs. homeostatic genes (related to Figure 3)
Suppl. Table 4: Comparison Tau/ApoE4 reactive microglia vs. DAM (related to Figure 4)
Suppl. Table 5: Differential Gene expression list of upregulated genes in microglial TE4-T2KO vs.TE4 that intersect with the CLEAR network (related to Figure 6)
KEY RESOURCES TABLE.
| REAGENT or RESOURCE | SOURCE | IDENTIFIER |
|---|---|---|
| Antibodies | ||
| Rabbit polyclonal anti-Galectin 3 (LGALS3) | Cell signaling | Cat# 12733 RRID: AB_2798009 |
| Rat monoclonal anti-SPI1 (PU.1) - PE | Biolegend | Cat# 681308 RRID: AB_2629618 |
| Rat monoclonal anti-Lamp1 (1D4B) | Developmental Studies Hybridoma Bank | Cat# 1D4B RRID: AB_528127 |
| Rabbit polyclonal anti-apoE | Cell signaling | Cat# D719N RRID: AB_2798191 |
| Mouse monoclonal anti-GFAP-Alexa Fluor 488 | eBioscience | Cat# 53–9892-82 RRID: AB_10598515 |
| Goat polyclonal anti-Iba1 | Novus Biologicals | Cat# NB100-1028 RRID: AB_521594 |
| Rabbit polyclonal anti-Iba1 | Wako | Cat# 019-19741 RRID: AB_839504 |
| Mouse monoclonal anti- Phospho-tau (Ser202, Thr205) (AT8), biotinylated | Thermo Fisher Scientific | Cat# MN1020B RRID: AB_223648 |
| Mouse monoclonal anti-human tau (HT7), biotinylated | Thermo Fisher Scientific | Cat# MN1000B RRID: AB_223453 |
| Mouse monoclonal anti-p-tau HJ14.5 (Thr181) | In house8 | N/A |
| Mouse monoclonal anti-tau (TAU-5) | Gift from L. Binder, Northwestern University62 | N/A |
| Rat monoclonal anti-CD68, clone FA-11 | AbD SeroTec | Cat# MCA1957 RRID: AB_322219 |
| Mouse monoclonal anti-tau MC1 (conformational change) | Gift from Dr. Peter Davies64 | N/A |
| Mouse monoclonal anti- Phospho-tau (Thr231) (AT180) | Thermo Fisher Scientific | Cat# MN1040 RRID: AB_223649 |
| Mouse monoclonal anti- Caspase 1 | Invitrogen | Cat# 14-9832-80 RRID: AB_2016624 |
| Rabbit polyclonal anti-PSD-95 | Thermo Fisher Scientific | Cat# 51-6900 RRID: AB_2533914 |
| Mouse monoclonal anti-NeuN-Alexa Fluor 488 | MilliporeSigma | Cat# MAB377X RRID: AB_2149209 |
| Rabbit polyclonal anti-C3 | Abcam | Cat# ab97462 RRID: AB_10679468 |
| Mouse monoclonal anti-ASC/TMS1 | Novus Biologicals | Cat# NBP1-78977SS RRID: AB_11018513 |
| Rabbit polyclonal anti-C1qA | Proteintech | Cat# 11602-1-AP RRID: AB_2067153 |
| Rabbit polyclonal anti-Pan-actin | Cell signaling | Cat# 4968 RRID: AB_2313904 |
| Rabbit polyclonal anti-P2ry12 | Gift from Dr. Oleg Butovsky66 | N/A |
| Rat monoclonal anti-Clec7a | InvivoGen | Cat# mabg-mdect RRID: AB_2753143 |
| Donkey anti Rabbit IgG (H+L) Highly Cross-Adsorbed Secondary antibody, Alexa Fluor 594 | Thermo Fisher Scientific | Cat# A-21206 RRID: AB_2535792 |
| Donky anti-Goat IgG (H+L) Cross-Adsorbed Secondary Antibody, Alexa Fluor 647 | Thermo Fisher Scientific | Cat# A-21447 RRID: AB_141844 |
| Donkey anti Mouse IgG (H+L) Highly Cross-Adsorbed Secondary antibody, Alexa Fluor 488 | Thermo Fisher Scientific | Cat# A-21202 RRID: AB_141607 |
| Donkey anti Rabbit IgG (H+L) Highly Cross-Adsorbed Secondary antibody, Alexa Fluor 488 | Thermo Fisher Scientific | Cat# A-21206 RRID: AB_2535792 |
| Donkey anti Rat IgG (H+L) Highly Cross-Adsorbed Secondary antibody, Alexa Fluor 488 | Thermo Fisher Scientific | Cat# A-21208 RRID: AB_141709 |
| Donkey anti Mouse IgG (H+L) Highly Cross-Adsorbed Secondary antibody, Alexa Fluor 594 | Thermo Fisher Scientific | Cat# A-21203 RRID: AB_141633 |
| Donkey anti Rabbit IgG (H+L) Highly Cross-Adsorbed Secondary antibody, Alexa Fluor 405 | Thermo Fisher Scientific | Cat# A48258 RRID: AB_2890547 |
| Peroxidase AffiniPure Goat Anti-Rabbit IgG (H+L) | Jackson ImmunoResearch | Cat# 111-035-003 RRID: AB_2313567 |
| Peroxidase AffiniPure Goat Anti-Mouse IgG (H+L) | Jackson ImmunoResearch | Cat# 111-035-003 RRID: AB_10015289 |
| Chemicals | ||
| Sudan Black B | Millipore Sigma | Cat# 199664 |
| DAPI | Millipore Sigma | Cat# MBD0015 |
| Cresyl Violet | Millipore Sigma | Cat# C5042 |
| N-Lauroylsarcosine (Sarkosyl) | Sigma-Aldrich | Cat# 61739-25G |
| BSA | RPI research products | Cat# A30075 |
| BSA | Sigma-Aldrich | Cat# B6917 |
| Digitonin | EMD Millipore | Cat# 300410 |
| 3,3′-Diaminobenzidine tetrahydrochloride (DAB) | Sigma-Aldrich | Cat# D5905 |
| Critical Commercial Assays | ||
| NF-Light Simoa Assay Advantage Kit | Quanterix | Cat# 103186 |
| VECTASTAIN Elite ABC-HRP Kit, Peroxidase (Standard) | Vector laboratories | Cat# PK-6100 |
| PierceBCA Protein Assay Kit | Thermo Fisher Scientific | Cat# 23225 |
| Cytoseal60 mounting medium | Thermo Fisher Scientific | Cat# 8310-16 |
| 10x Tris/Glycine/SDS Running Buffer | Bio-Rad | Cat# 1610732 |
| 4%-20% Mini-PROTEAN TGX gels | Bio-Rad | Cat# 4561096 |
| Trans-Blot Turbo RTA Mini 0.2 μm PVDF Transfer Kit | Bio-Rad | Cat# 1704272 |
| Complete Protease Inhibitor | Roche | Cat# 11697498001 |
| PhosSTOP Phosphatase Inhibitor | Roche | Cat# 04906845001 |
| Strep-HRP40 | Fitzgerald | Cat# 65R-S104PHRP |
| 3,3′,5,5′-Tetramethylbenzidine Liquid Substrate, super slow, for ELISA | Millipore Sigma | Cat# T5569 |
| CitiFluor MWL4-88 | Electron Microscopy Sciences | Cat# 17977-150 |
| CitiFluor AF300 | Electron Microscopy Sciences | Cat# 17977-25 |
| LipidTox Green | Invitrogen | Cat# 34475 |
| Deposited Data | ||
| Mouse snRNAseq raw data | This paper | Raw data will be deposited to GEO (GSE206368) |
| Human snRNAseq raw data | 45 | http://ngi.pub/SNARE/ |
| Experimental Models: Organisms/Strains | ||
| ApoE4 KI | Gift from Dr. Patrick M. Sullivan68 | N/A |
| ApoE KO | Jackson Laboratory | Stock No. 002052 RRID: IMSR_JAX:002052 |
| C57BL/6 | Charles Rivers | Stock No. 027 RRID: IMSR_CRL:027 |
| P301S Tau | Jackson Laboratory | Stock No. 008169 RRID: IMSR_JAX:008169 |
| TREM2KO | Gift from Dr. Marco Colonna70 | N/A |
| Software and Algorithms | ||
| Prism 8 | GraphPad | https://www.graphpad.com/ |
| Fiji | ImageJ | https://imagej.net/Fiji |
| Imaris | Imaris | https://imaris.oxinst.com/ |
| NDP.view 2 | Hamamatsu | https://www.hamamatsu.com/jp/en/index.html |
| Seurat | 69 | https://github.com/satijalab/seurat/releases/tag/v3.0.0 |
| Other | ||
| Zeiss LSM 880 II Airyscan FAST Confocal Microscope | Zeiss | Zeiss LSM 880 II Airyscan FAST |
| Leica Stellaris 5 Confocal microscope | Leica | Stellaris 5 |
| Hamamatsu Nanozoomer HT | Hamamatsu | Nanozoomer HT |
| Cytation 5 | Agilent | BioTek Cytation 5 Cell Imaging Multimode Reader |
Highlights:
TREM2 deletion does not reduce tau-linked neurodegeneration in the presence of ApoE4
TREM2 deletion does not protect against tau pathology in the presence of ApoE4
ApoE4 and tau pathology induce TREM2-independent lysosomal burden in microglia
ApoE4 and tau-associated microgliosis exhibit TREM2-independent lipid accumulation
ACKNOWLEDGMENTS
This study was supported by the JPB Foundation (DMH and CKG); Cure Alzheimer’s Fund (DMH); National Institutes of Health (NIH) grants RF1AG047644 (DMH), RF1NS090934 (DMH), 1RF1 AG061060 (CKG and JS), R01 AG056511 (CKG and JS); the BrightFocus foundation (MG, A2020257F). This publication includes data generated at the UC San Diego IGM Genomics Center utilizing an Illumina NovaSeq 6000 that was purchased with funding from a NIH SIG grant (#S10 OD026929).
For the human data, this work was possible thanks to the following grants from the NIH: NIA R01AG057777, R56AG067764, U01AD072464, P30AG066444, P01AG026276, R01AG044546, P01AG003991, RF1AG053303, U01AG072464, and the Chan Zuckerberg Initiative. O.H. is an Archer Foundation Research Scientist. Study data were provided by the Rush Alzheimer’s Disease Center, Rush University Medical Center, Chicago. Data collection was supported through funding by NIA grants P30AG10161 (ROS), R01AG15819 (ROSMAP; genomics and RNAseq), R01AG17917 (MAP), R01AG30146, RF1AG57473 (single nucleus RNAseq), U01AG32984 (genomic and whole exome sequencing), U01AG61356 (whole genome sequencing, ROSMAP AMP-AD).
Confocal data were generated on a Zeiss LSM 880 Airyscan Confocal Microscope (grant OD021629, WUCCI, CDI-CORE-2015–505 and CDI-CORE-2019–813, 3770 and 4642). The authors specifically thank Travis Tabor and Alexandra Litvinchuk for their helpful advice for the staining of neutral lipids.
Footnotes
DECLARATION OF INTERESTS
D.M.H is as an inventor on a patent licensed by Washington University to C2N Diagnostics on the therapeutic use of anti-tau antibodies. D.M.H. and J.D.U. are inventors on a submitted patent on TREM2 antibodies. D.M.H. co-founded and is on the scientific advisory board of C2N Diagnostics. D.M.H. is on the scientific advisory board of Denali, Genentech, and Cajal Neuroscience and consults for Alector. All other authors declare no competing interests. DMH is on the advisory board for “Neuron”.
INCLUSION AND DIVERSITY
We support inclusive, diverse, and equitable research.
Publisher's Disclaimer: This is a PDF file of an unedited manuscript that has been accepted for publication. As a service to our customers we are providing this early version of the manuscript. The manuscript will undergo copyediting, typesetting, and review of the resulting proof before it is published in its final form. Please note that during the production process errors may be discovered which could affect the content, and all legal disclaimers that apply to the journal pertain.
REFERENCES
- 1.Castellani RJ, Rolston RK, and Smith MA (2010). Alzheimer disease. Disease-a-Month 56, 484–546. 10.1016/j.disamonth.2010.06.001. [DOI] [PMC free article] [PubMed] [Google Scholar]
- 2.Holtzman DM, Morris JC, and Goate AM (2011). Alzheimer’s disease: The challenge of the second century. Sci. Transl. Med. 3. 10.1126/scitranslmed.3002369. [DOI] [PMC free article] [PubMed] [Google Scholar]
- 3.Baek MS, Cho H, Lee HS, Lee JH, Ryu YH, and Lyoo CH (2020). Effect of APOE ε4 genotype on amyloid-β and tau accumulation in Alzheimer’s disease. Alzheimer’s Res. Ther. 12, 1–12. 10.1186/S13195-020-00710-6/FIGURES/5. [DOI] [PMC free article] [PubMed] [Google Scholar]
- 4.Therriault J, Benedet AL, Pascoal TA, Mathotaarachchi S, Chamoun M, Savard M, Thomas E, Kang MS, Lussier F, Tissot C, et al. (2020). Association of Apolipoprotein E ε4 With Medial Temporal Tau Independent of Amyloid-β. JAMA Neurol. 77, 470–479. 10.1001/JAMANEUROL.2019.4421. [DOI] [PMC free article] [PubMed] [Google Scholar]
- 5.Weigand AJ, Thomas KR, Bangen KJ, Eglit GML, Delano-Wood L, Gilbert PE, Brickman AM, and Bondi MW (2021). APOE interacts with tau PET to influence memory independently of amyloid PET in older adults without dementia. Alzheimers. Dement. 17, 61–69. 10.1002/ALZ.12173. [DOI] [PubMed] [Google Scholar]
- 6.Shi Y, Yamada K, Liddelow SA, Smith ST, Zhao L, Luo W, Tsai RM, Spina S, Grinberg LT, Rojas JC, et al. (2017). ApoE4 markedly exacerbates tau-mediated neurodegeneration in a mouse model of tauopathy. Nature 549, 523–527. 10.1038/nature24016. [DOI] [PMC free article] [PubMed] [Google Scholar]
- 7.Leyns CEG, and Holtzman DM (2017). Glial contributions to neurodegeneration in tauopathies . Mol. Neurodegener 12. 10.1186/s13024-017-0192-x. [DOI] [PMC free article] [PubMed] [Google Scholar]
- 8.Shi Y, Manis M, Long J, Wang K, Sullivan PM, Remolina Serrano J, Hoyle R, and Holtzman DM (2019). Microglia drive APOE-dependent neurodegeneration in a tauopathy mouse model. J. Exp. Med. 216, 2546–2561. 10.1084/jem.20190980. [DOI] [PMC free article] [PubMed] [Google Scholar]
- 9.Mathys H, Adaikkan C, Gao F, Young JZ, Manet E, Hemberg M, De Jager PL, Ransohoff RM, Regev A, and Tsai LH (2017). Temporal Tracking of Microglia Activation in Neurodegeneration at Single-Cell Resolution. Cell Rep. 21, 366–380. 10.1016/J.CELREP.2017.09.039. [DOI] [PMC free article] [PubMed] [Google Scholar]
- 10.Sala Frigerio C, Wolfs L, Fattorelli N, Thrupp N, Voytyuk I, Schmidt I, Mancuso R, Chen WT, Woodbury ME, Srivastava G, et al. (2019). The Major Risk Factors for Alzheimer’s Disease: Age, Sex, and Genes Modulate the Microglia Response to Aβ Plaques. Cell Rep. 27, 1293–1306.e6. 10.1016/J.CELREP.2019.03.099. [DOI] [PMC free article] [PubMed] [Google Scholar]
- 11.Chen Y, and Colonna M (2021). Microglia in Alzheimer’s disease at single-cell level. Are there common patterns in humans and mice? J. Exp. Med. 218. 10.1084/JEM.20202717. [DOI] [PMC free article] [PubMed] [Google Scholar]
- 12.Keren-Shaul H, Spinrad A, Weiner A, Matcovitch-Natan O, Dvir-Szternfeld R, Ulland TK, David E, Baruch K, Lara-Astaiso D, Toth B, et al. (2017). A Unique Microglia Type Associated with Restricting Development of Alzheimer’s Disease. Cell 169, 1276–1290.e17. 10.1016/j.cell.2017.05.018. [DOI] [PubMed] [Google Scholar]
- 13.Song W, Hooli B, Mullin K, Jin SC, Cella M, Ulland TK, Wang Y, Tanzi RE, and Colonna M (2017). Alzheimer’s disease-associated TREM2 variants exhibit either decreased or increased ligand-dependent activation. Alzheimer’s Dement. 13, 381–387. 10.1016/j.jalz.2016.07.004. [DOI] [PMC free article] [PubMed] [Google Scholar]
- 14.Wang Y, Ulland TK, Ulrich JD, Song W, Tzaferis JA, Hole JT, Yuan P, Mahan TE, Shi Y, Gilfillan S, et al. (2016). TREM2-mediated early microglial response limits diffusion and toxicity of amyloid plaques. J. Exp. Med. 10.1084/jem.20151948. [DOI] [PMC free article] [PubMed] [Google Scholar]
- 15.Ulrich JD, Finn M, Wang Y, Shen A, Mahan TE, Jiang H, Stewart FR, Piccio L, Colonna M, and Holtzman DM (2014). Altered microglial response to Aβ plaques in APPPS1–21 mice heterozygous for TREM2. Mol. Neurodegener. 9, 20. 10.1186/1750-1326-9-20. [DOI] [PMC free article] [PubMed] [Google Scholar]
- 16.Cheng-Hathaway PJ, Reed-Geaghan EG, Jay TR, Casali BT, Bemiller SM, Puntambekar SS, Von Saucken VE, Williams RY, Karlo JC, Moutinho M, et al. (2018). The Trem2 R47H variant confers loss-of-function-like phenotypes in Alzheimer’s disease. Mol. Neurodegener. 13. 10.1186/s13024-018-0262-8. [DOI] [PMC free article] [PubMed] [Google Scholar]
- 17.Jay TR, Miller CM, Cheng PJ, Graham LC, Bemiller S, Broihier ML, Xu G, Margevicius D, Karlo JC, Sousa GL, et al. (2015). TREM2 deficiency eliminates TREM2+ inflammatory macrophages and ameliorates pathology in Alzheimer’s disease mouse models. J. Exp. Med. 212, 287–295. 10.1084/jem.20142322. [DOI] [PMC free article] [PubMed] [Google Scholar]
- 18.Leyns CEG, Gratuze M, Narasimhan S, Jain N, Koscal LJ, Jiang H, Manis M, Colonna M, Lee VMY, Ulrich JD, et al. (2019). TREM2 function impedes tau seeding in neuritic plaques. Nat. Neurosci. 22, 1217–1222. 10.1038/s41593-019-0433-0. [DOI] [PMC free article] [PubMed] [Google Scholar]
- 19.Gratuze M, Chen Y, Parhizkar S, Jain N, Strickland MR, Serrano JR, Colonna M, Ulrich JD, and Holtzman DM (2021). Activated microglia mitigate Aβ-associated tau seeding and spreading. J. Exp. Med. 218, e20210542. 10.1084/jem.20210542. [DOI] [PMC free article] [PubMed] [Google Scholar]
- 20.Lee S-H, Meilandt WJ, Xie L, Gandham VD, Ngu H, Barck KH, Rezzonico MG, Imperio J, Lalehzadeh G, Huntley MA, et al. (2021). Trem2 restrains the enhancement of tau accumulation and neurodegeneration by β-amyloid pathology. Neuron 109, 1–19. 10.1016/j.neuron.2021.02.010. [DOI] [PubMed] [Google Scholar]
- 21.Sayed FA, Telpoukhovskaia M, Kodama L, Li Y, Zhou Y, Le D, Hauduc A, Ludwig C, Gao F, Clelland C, et al. (2018). Differential effects of partial and complete loss of TREM2 on microglial injury response and tauopathy. Proc. Natl. Acad. Sci. U. S. A. 115, 10172–10177. 10.1073/pnas.1811411115. [DOI] [PMC free article] [PubMed] [Google Scholar]
- 22.Gratuze M, Leyns CEG, Sauerbeck AD, St-Pierre MK, Xiong M, Kim N, Serrano JR, Tremblay MÈ, Kummer TT, Colonna M, et al. (2020). Impact of TREM2R47Hvariant on tau pathology-induced gliosis and neurodegeneration. J. Clin. Invest. 10.1172/JCI138179. [DOI] [PMC free article] [PubMed] [Google Scholar]
- 23.Leyns CEG, Ulrich JD, Finn MB, Stewart FR, Koscal LJ, Serrano JR, Robinson GO, Anderson E, Colonna M, and Holtzman DM (2017). TREM2 deficiency attenuates neuroinflammation and protects against neurodegeneration in a mouse model of tauopathy. Proc. Natl. Acad. Sci. U. S. A. 114, 11524–11529. 10.1073/pnas.1710311114. [DOI] [PMC free article] [PubMed] [Google Scholar]
- 24.Xie M, Liu YU, Zhao S, Zhang L, Bosco DB, Pang YP, Zhong J, Sheth U, Martens YA, Zhao N, et al. (2022). TREM2 interacts with TDP-43 and mediates microglial neuroprotection against TDP-43-related neurodegeneration. Nat. Neurosci. 25, 26–38. 10.1038/S41593-021-00975-6. [DOI] [PMC free article] [PubMed] [Google Scholar]
- 25.Reifschneider A, Robinson S, Van Lengerich B, Gnörich J, Logan T, Heindl S, Vogt MA, Weidinger E, Riedl L, Wind K, et al. (2022). Loss of TREM2 rescues hyperactivation of microglia, but not lysosomal deficits and neurotoxicity in models of progranulin deficiency. EMBO J. 41, e109108. 10.15252/EMBJ.2021109108. [DOI] [PMC free article] [PubMed] [Google Scholar]
- 26.Yoshiyama Y, Higuchi M, Zhang B, Huang SM, Iwata N, Saido TCC, Maeda J, Suhara T, Trojanowski JQ, and Lee VMY (2007). Synapse Loss and Microglial Activation Precede Tangles in a P301S Tauopathy Mouse Model. Neuron 53, 337–351. 10.1016/j.neuron.2007.01.010. [DOI] [PubMed] [Google Scholar]
- 27.Shi Y, Andhey PS, Ising C, Wang K, Snipes LL, Boyer K, Lawson S, Yamada K, Qin W, Manis M, et al. (2021). Overexpressing low-density lipoprotein receptor reduces tau-associated neurodegeneration in relation to apoE-linked mechanisms. Neuron 109, 2413–2426.e7. 10.1016/J.NEURON.2021.05.034. [DOI] [PMC free article] [PubMed] [Google Scholar]
- 28.Khalil M, Teunissen CE, Otto M, Piehl F, Sormani MP, Gattringer T, Barro C, Kappos L, Comabella M, Fazekas F, et al. (2018). Neurofilaments as biomarkers in neurological disorders. Nat. Rev. Neurol. 2018 1410 14, 577–589. 10.1038/s41582-018-0058-z. [DOI] [PubMed] [Google Scholar]
- 29.Bemiller SM, McCray TJ, Allan K, Formica SV, Xu G, Wilson G, Kokiko-Cochran ON, Crish SD, Lasagna-Reeves CA, Ransohoff RM, et al. (2017). TREM2 deficiency exacerbates tau pathology through dysregulated kinase signaling in a mouse model of tauopathy. Mol. Neurodegener. 12. 10.1186/s13024-017-0216-6. [DOI] [PMC free article] [PubMed] [Google Scholar]
- 30.Mancuso R, Fryatt G, Cleal M, Obst J, Pipi E, Monzón-Sandoval J, Ribe E, Winchester L, Webber C, Nevado A, et al. (2019). CSF1R inhibitor JNJ-40346527 attenuates microglial proliferation and neurodegeneration in P301S mice. Brain 142, 3243–3264. 10.1093/brain/awz241. [DOI] [PMC free article] [PubMed] [Google Scholar]
- 31.Wang C, Xiong M, Gratuze M, Bao X, Shi Y, Andhey PS, Manis M, Schroeder C, Yin Z, Madore C, et al. (2021). Selective removal of astrocytic APOE4 strongly protects against tau-mediated neurodegeneration and decreases synaptic phagocytosis by microglia. Neuron 109, 1657–1674.e7. 10.1016/j.neuron.2021.03.024. [DOI] [PMC free article] [PubMed] [Google Scholar]
- 32.Arhzaouy K, Papadopoulos C, Schulze N, Pittman SK, Meyer H, and Weihl CC (2019). VCP maintains lysosomal homeostasis and TFEB activity in differentiated skeletal muscle. Autophagy 15, 1082–1099. 10.1080/15548627.2019.1569933/SUPPL_FILE/KAUP_A_1569933_SM9194.ZIP. [DOI] [PMC free article] [PubMed] [Google Scholar]
- 33.Papadopoulos C, and Meyer H (2017). Detection and Clearance of Damaged Lysosomes by the Endo-Lysosomal Damage Response and Lysophagy. Curr. Biol. 27, R1330–R1341. 10.1016/J.CUB.2017.11.012. [DOI] [PubMed] [Google Scholar]
- 34.Jia J, Claude-Taupin A, Gu Y, Choi SW, Peters R, Bissa B, Mudd MH, Allers L, Pallikkuth S, Lidke KA, et al. (2020). Galectin-3 Coordinates a Cellular System for Lysosomal Repair and Removal. Dev. Cell 52, 69–87.e8. 10.1016/J.DEVCEL.2019.10.025. [DOI] [PMC free article] [PubMed] [Google Scholar]
- 35.Settembre C, and Ballabio A (2014). Lysosome: Regulator of lipid degradation pathways. Trends Cell Biol. 24, 743–750. 10.1016/J.TCB.2014.06.006. [DOI] [PMC free article] [PubMed] [Google Scholar]
- 36.Schulze H, and Sandhoff K (2011). Lysosomal lipid storage diseases. Cold Spring Harb. Perspect. Biol. 3, 1–19. 10.1101/cshperspect.a004804. [DOI] [PMC free article] [PubMed] [Google Scholar]
- 37.Gabandé-Rodríguez E, Pérez-Cañamás A, Soto-Huelin B, Mitroi DN, Sánchez-Redondo S, Martínez-Sáez E, Venero C, Peinado H, María, &, and Ledesma, D. (2019). Lipid-induced lysosomal damage after demyelination corrupts microglia protective function in lysosomal storage disorders. EMBO J. 38, e99553. 10.15252/EMBJ.201899553. [DOI] [PMC free article] [PubMed] [Google Scholar]
- 38.Victor MB, Leary N, Luna X, Meharena HS, Scannail AN, Bozzelli PL, Samaan G, Murdock MH, von Maydell D, Effenberger AH, et al. (2022). Lipid accumulation induced by APOE4 impairs microglial surveillance of neuronal-network activity. Cell Stem Cell 29, 1197–1212.e8. 10.1016/j.stem.2022.07.005. [DOI] [PMC free article] [PubMed] [Google Scholar]
- 39.Palmieri M, Impey S, Kang H, di Ronza A, Pelz C, Sardiello M, and Ballabio A (2011). Characterization of the CLEAR network reveals an integrated control of cellular clearance pathways. Hum. Mol. Genet. 20, 3852–3866. 10.1093/hmg/ddr306. [DOI] [PubMed] [Google Scholar]
- 40.Cegli R De Carrella D., Siciliano D, Gambardella G, Napolitano G, Malta C. Di, Ballabio A, and Bernardo D. di (2022). TFEBexplorer: An integrated tool to study genes regulated by the stress-responsive Transcription Factor EB. 10.1080/27694127.2022.2097822 1, 295–305. 10.1080/27694127.2022.2097822. [DOI] [Google Scholar]
- 41.Ising C, Venegas C, Zhang S, Scheiblich H, Schmidt SV, Vieira-Saecker A, Schwartz S, Albasset S, McManus RM, Tejera D, et al. (2019). NLRP3 inflammasome activation drives tau pathology. Nature 575, 669. 10.1038/S41586-019-1769-Z. [DOI] [PMC free article] [PubMed] [Google Scholar]
- 42.Dejanovic B, Huntley MA, De Mazière A, Meilandt WJ, Wu T, Srinivasan K, Jiang Z, Gandham V, Friedman BA, Ngu H, et al. (2018). Changes in the Synaptic Proteome in Tauopathy and Rescue of Tau-Induced Synapse Loss by C1q Antibodies. Neuron 100, 1322–1336.e7. 10.1016/j.neuron.2018.10.014. [DOI] [PubMed] [Google Scholar]
- 43.Wu T, Dejanovic B, Gandham VD, Gogineni A, Edmonds R, Schauer S, Srinivasan K, Huntley MA, Wang Y, Wang TM, et al. (2019). Complement C3 Is Activated in Human AD Brain and Is Required for Neurodegeneration in Mouse Models of Amyloidosis and Tauopathy. Cell Rep. 28, 2111–2123.e6. 10.1016/j.celrep.2019.07.060. [DOI] [PubMed] [Google Scholar]
- 44.Litvinchuk A, Wan YW, Swartzlander DB, Chen F, Cole A, Propson NE, Wang Q, Zhang B, Liu Z, and Zheng H (2018). Complement C3aR inactivation attenuates tau pathology and reverses an immune network deregulated in tauopathy models and Alzheimer’s disease. Neuron 100, 1337. 10.1016/J.NEURON.2018.10.031. [DOI] [PMC free article] [PubMed] [Google Scholar]
- 45.Brase L, You S-F, Del-Aguila JL, Dai Y, Novotny BC, Soriano-Tarraga C, Dykstra T, Fernandez MV, Budde JP, Bergmann K, et al. (2022). A landscape of the genetic and cellular heterogeneity in Alzheimer disease. medRxiv 10, 2021.11.30.21267072. 10.1101/2021.11.30.21267072. [DOI] [Google Scholar]
- 46.Da Mesquita S, Papadopoulos Z, Dykstra T, Brase L, Farias FG, Wall M, Jiang H, Kodira CD, de Lima KA, Herz J, et al. (2021). Meningeal lymphatics affect microglia responses and anti-Aβ immunotherapy. Nature 593, 255–260. 10.1038/S41586-021-03489-0. [DOI] [PMC free article] [PubMed] [Google Scholar]
- 47.Zhou Y, Song WM, Andhey PS, Swain A, Levy T, Miller KR, Poliani PL, Cominelli M, Grover S, Gilfillan S, et al. (2020). Human and mouse single-nucleus transcriptomics reveal TREM2-dependent and TREM2-independent cellular responses in Alzheimer’s disease. Nat. Med. 26, 131–142. 10.1038/S41591-019-0695-9. [DOI] [PMC free article] [PubMed] [Google Scholar]
- 48.Liao F, Zhang TJ, Jiang H, Lefton KB, Robinson GO, Vassar R, Sullivan PM, and Holtzman DM (2015). Murine versus human apolipoprotein E4: differential facilitation of and co-localization in cerebral amyloid angiopathy and amyloid plaques in APP transgenic mouse models. 10.1186/s40478-015-0250-y. [DOI] [PMC free article] [PubMed] [Google Scholar]
- 49.Van Acker ZP, Bretou M, and Annaert W (2019). Endo-lysosomal dysregulations and late-onset Alzheimer’s disease: Impact of genetic risk factors. Mol. Neurodegener. 14. 10.1186/s13024-019-0323-7. [DOI] [PMC free article] [PubMed] [Google Scholar]
- 50.Lefterov I, Zhou B, Kim J, Mathews PM, Duff KE, Nuriel T, Peng KY, Ashok A, Dillman AA, Figueroa HY, et al. (2017). The Endosomal-Lysosomal Pathway Is Dysregulated by APOE4 Expression in Vivo. Front. Neurosci. | www.frontiersin.org 11, 702. 10.3389/fnins.2017.00702. [DOI] [PMC free article] [PubMed] [Google Scholar]
- 51.TCW J, Qian L, Pipalia NH, Chao MJ, Liang SA, Shi Y, Jain BR, Bertelsen SE, Kapoor M, Marcora E, et al. (2022). Cholesterol and matrisome pathways dysregulated in astrocytes and microglia. Cell 185, 2213–2233.e25. 10.1016/J.CELL.2022.05.017. [DOI] [PMC free article] [PubMed] [Google Scholar]
- 52.Fitz NF, Wolfe CM, Playso BE, Biedrzycki RJ, Lu Y, Nam KN, Lefterov I, and Koldamova R (2020). Trem2 deficiency differentially affects phenotype and transcriptome of human APOE3 and APOE4 mice. Mol. Neurodegener. 15. 10.1186/S13024-020-00394-4. [DOI] [PMC free article] [PubMed] [Google Scholar]
- 53.Krasemann S, Madore C, Cialic R, Baufeld C, Calcagno N, El Fatimy R, Beckers L, O’Loughlin E, Xu Y, Fanek Z, et al. (2017). The TREM2-APOE Pathway Drives the Transcriptional Phenotype of Dysfunctional Microglia in Neurodegenerative Diseases. Immunity 47, 566–581.e9. 10.1016/J.IMMUNI.2017.08.008. [DOI] [PMC free article] [PubMed] [Google Scholar]
- 54.Shi Y, and Holtzman DM (2018). Interplay between innate immunity and Alzheimer disease: APOE and TREM2 in the spotlight. Nat. Rev. Immunol. 18, 759–772. 10.1038/S41577-018-0051-1. [DOI] [PMC free article] [PubMed] [Google Scholar]
- 55.Ulrich JD, Ulland TK, Mahan TE, Nyström S, Peter Nilsson K, Song WM, Zhou Y, Reinartz M, Choi S, Jiang H, et al. (2018). ApoE facilitates the microglial response to amyloid plaque pathology. J. Exp. Med. 215, 1047–1058. 10.1084/JEM.20171265. [DOI] [PMC free article] [PubMed] [Google Scholar]
- 56.Nugent AA, Lin K, van Lengerich B, Lianoglou S, Przybyla L, Davis SS, Llapashtica C, Wang J, Kim DJ, Xia D, et al. (2020). TREM2 Regulates Microglial Cholesterol Metabolism upon Chronic Phagocytic Challenge. Neuron 105, 837–854.e9. 10.1016/J.NEURON.2019.12.007. [DOI] [PubMed] [Google Scholar]
- 57.Atagi Y, Liu CC, Painter MM, Chen XF, Verbeeck C, Zheng H, Li X, Rademakers R, Kang SS, Xu H, et al. (2015). Apolipoprotein E Is a Ligand for Triggering Receptor Expressed on Myeloid Cells 2 (TREM2). J. Biol. Chem. 290, 26043–26050. 10.1074/JBC.M115.679043. [DOI] [PMC free article] [PubMed] [Google Scholar]
- 58.Yeh FL, Wang Y, Tom I, Gonzalez LC, and Sheng M (2016). TREM2 Binds to Apolipoproteins, Including APOE and CLU/APOJ, and Thereby Facilitates Uptake of Amyloid-Beta by Microglia. Neuron 91, 328–340. 10.1016/J.NEURON.2016.06.015. [DOI] [PubMed] [Google Scholar]
- 59.Nguyen AT, Wang K, Hu G, Wang X, Miao Z, Azevedo JA, Suh ER, Van Deerlin VM, Choi D, Roeder K, et al. (2020). APOE and TREM2 regulate amyloid-responsive microglia in Alzheimer’s disease. Acta Neuropathol. 140, 477–493. 10.1007/S00401-020-02200-3. [DOI] [PMC free article] [PubMed] [Google Scholar]
- 60.Rexach JE, Polioudakis D, Yin A, Swarup V, Chang TS, Nguyen T, Sarkar A, Chen L, Huang J, Lin LC, et al. (2020). Tau Pathology Drives Dementia Risk-Associated Gene Networks toward Chronic Inflammatory States and Immunosuppression. Cell Rep. 33. 10.1016/J.CELREP.2020.108398. [DOI] [PMC free article] [PubMed] [Google Scholar]
- 61.Roy ER, Chiu G, Li S, Propson NE, Kanchi R, Wang B, Coarfa C, Zheng H, and Cao W (2022). Concerted type I interferon signaling in microglia and neural cells promotes memory impairment associated with amyloid β plaques. Immunity 55, 879–894.e6. 10.1016/J.IMMUNI.2022.03.018. [DOI] [PMC free article] [PubMed] [Google Scholar]
- 62.Lopresti P, Szuchet S, Papasozomenos SC, Zinkowski RP, and Binder LI (1995). Functional implications for the microtubule-associated protein tau: localization in oligodendrocytes. Proc. Natl. Acad. Sci. U. S. A. 92, 10369–10373. 10.1073/PNAS.92.22.10369. [DOI] [PMC free article] [PubMed] [Google Scholar]
- 63.Bersuker K, Peterson CWH, To M, Sahl SJ, Savikhin V, Grossman EA, Nomura DK, and Olzmann JA (2018). A Proximity Labeling Strategy Provides Insights into the Composition and Dynamics of Lipid Droplet Proteomes. Dev. Cell 44, 97–112.e7. 10.1016/J.DEVCEL.2017.11.020. [DOI] [PMC free article] [PubMed] [Google Scholar]
- 64.Jicha GA, Bowser R, Kazam IG, and Davies P (1997). Alz-50 and MC-1, a New Monoclonal Antibody Raised to Paired Helical Filaments, Recognize Conformational Epitopes on Recombinant Tau. J. Neurosci. Res 48, 128–132. 10.1002/(SICI)1097-4547(19970415)48:2. [DOI] [PubMed] [Google Scholar]
- 65.Bailey AP, Koster G, Guillermier C, Hirst EMA, MacRae JI, Lechene CP, Postle AD, and Gould AP (2015). Antioxidant Role for Lipid Droplets in a Stem Cell Niche of Drosophila. Cell 163, 340–353. 10.1016/J.CELL.2015.09.020. [DOI] [PMC free article] [PubMed] [Google Scholar]
- 66.Butovsky O, Jedrychowski MP, Moore CS, Cialic R, Lanser AJ, Gabriely G, Koeglsperger T, Dake B, Wu PM, Doykan CE, et al. (2014). Identification of a unique TGF-β-dependent molecular and functional signature in microglia. Nat. Neurosci. 17, 131–143. 10.1038/NN.3599. [DOI] [PMC free article] [PubMed] [Google Scholar]
- 67.Satija R, Farrell JA, Gennert D, Schier AF, and Regev A (2015). Spatial reconstruction of single-cell gene expression data. Nat. Biotechnol. 2015 335 33, 495–502. 10.1038/nbt.3192. [DOI] [PMC free article] [PubMed] [Google Scholar]
- 68.Knouff C, Hinsdale ME, Mezdour H, Altenburg MK, Watanabe M, Quarfordt SH, Sullivan PM, and Maeda N (1999). Apo E structure determines VLDL clearance and atherosclerosis risk in mice. J. Clin. Invest. 103, 1579–1586. 10.1172/JCI6172. [DOI] [PMC free article] [PubMed] [Google Scholar]
- 69.Stuart T, Butler A, Hoffman P, Hafemeister C, Papalexi E, Mauck WM, Hao Y, Stoeckius M, Smibert P, and Satija R (2019). Comprehensive Integration of Single-Cell Data. Cell 177, 1888–1902.e21. 10.1016/J.CELL.2019.05.031. [DOI] [PMC free article] [PubMed] [Google Scholar]
- 70.Turnbull IR, Gilfillan S, Cella M, Aoshi T, Miller M, Piccio L, Hernandez M, and Colonna M (2006). Cutting Edge: TREM-2 Attenuates Macrophage Activation. J. Immunol. 10.4049/jimmunol.177.6.3520. [DOI] [PubMed] [Google Scholar]
- 71.He L, Davila-Velderrain J, Sumida TS, Hafler DA, Kellis M, and Kulminski AM (2021). NEBULA is a fast negative binomial mixed model for differential or co-expression analysis of large-scale multi-subject single-cell data. Commun. Biol 4. 10.1038/S42003-021-02146-6. [DOI] [PMC free article] [PubMed] [Google Scholar]
- 72.Tirosh I, Izar B, Prakadan SM, Wadsworth MH, Treacy D, Trombetta JJ, Rotem A, Rodman C, Lian C, Murphy G, et al. (2016). Dissecting the multicellular ecosystem of metastatic melanoma by single-cell RNA-seq. Science 352, 189–196. 10.1126/SCIENCE.AAD0501. [DOI] [PMC free article] [PubMed] [Google Scholar]
Associated Data
This section collects any data citations, data availability statements, or supplementary materials included in this article.
Supplementary Materials
Suppl. Table 1: Marker genes (related to Figure 3)
Suppl. Table 2: Tau/ApoE4 reactive microglia vs. homeostatic genes (related to Figure 3)
Suppl. Table 4: Comparison Tau/ApoE4 reactive microglia vs. DAM (related to Figure 4)
Suppl. Table 5: Differential Gene expression list of upregulated genes in microglial TE4-T2KO vs.TE4 that intersect with the CLEAR network (related to Figure 6)
Data Availability Statement
-
Mouse snRNA-seq data that support the findings of this study have been deposited in the Gene Expression Omnibus (GEO) database with accession number GSE206368. For Human data: http://ngi.pub/SNARE/
Sequence files, quantified gene expression and clean data from the Knight ADRC are available in NIAGADS (https://dss.niagads.org/datasets/ng00108/).
For the evaluation of the CLEAR network in the microglial upregulated genes in TE4-T2KO mice, we used the interactive TFEBexplorer (https://tfeb.tigem.it/help.php) to identify genes that are predicted to be upregulated by the master regulator TFEB.
This study did not generate new original code.
Any additional information required to reanalyze the data reported in this work paper is available from the Lead Contact upon request.