

Abstract
Prospective epidemiological studies have provided limited evidence for an association between tea consumption and liver cancer risk. Based on a population-based prospective cohort study in middle-aged Chinese women, we investigated the association between tea consumption and the risk of primary liver cancer. Detailed information on tea drinking habits and other potential confounders was obtained at the baseline interview. Incident liver cancer cases were identified through record linkage with the population-based cancer registry and verified through home visits and review of medical charts by medical experts. Multiple aspects of tea drinking habits including starting age, duration, intensity, and cumulative consumption of any type of tea and green tea were considered. Multivariable-adjusted hazard ratios (aHRs) and their 95% confidence intervals (CIs) were derived from the Cox regression models. After a median follow-up time of 18.12 (interquartile range=1.59) years, 253 incident liver cancer cases were identified from 71,841 cohort members. Compared to never tea drinkers, the risk of liver cancer for participants who have consumed over 30 kg of dried tea leaves cumulatively was 0.56 (95% CI: 0.32–0.97). For those who drank green tea only, the aHR was 0.54 (95% CI: 0.30–0.98). This updated study suggested an inverse association between cumulative consumption of tea, especially green tea, and the risk of primary liver cancer.
Keywords: primary liver cancer, green tea, cohort study, dietary habits, protective factor
Graphical Abstract
INTRODUCTION
Primary liver cancer is the sixth most common cancer and the third leading cause of cancer death worldwide. The latest global cancer statistics showed that the estimated number of new liver cancer cases and deaths in 2020 are about 905,677 and 830,1801. The highest incidence and mortality rates of liver cancer are observed in Eastern Asia, with an age-standardized incidence rate of 17.8 per 100,000 and a mortality rate of 16.1 per 100,000 in 2020. As the most populous country, China has the heaviest burden of liver cancer, with approximately 45% of new cases and 47% of deaths worldwide occurring in the country1.
Animal and in vitro studies have found that tea extracts (especially green tea) have inhibitory effects on the development of multiple malignancies, including liver cancer, mainly through the antioxidant and anti-inflammatory properties of tea polyphenols, especially epigallocatechin-3-gallate (EGCG)2,3. Studies have suggested the chemopreventive potential of EGCG in liver carcinogenesis, particularly in metabolic syndrome-associated liver cancer3. The key mechanisms are the ability of EGCG to inhibit receptor tyrosine kinases and improve metabolic abnormalities3. However, evidence from the epidemiologic studies do not consistently support the above hypothesis4–8. According to the World Cancer Research Fund (WCRF) Continuous Update Project Expert Report 2018, the association between tea consumption and liver cancer was judged as “limited-no conclusion”4. Meta-analyses including both cohort and case-control studies showed that tea consumption was inversely associated with the risk of liver cancer5,6. However, the association was not significant when only prospective studies were included7,8. Considering the inherent nature of retrospective studies, the significant associations might have been subject to recall bias. Therefore, the association between tea consumption and the risk of liver cancer warrants more prospective studies to confirm. In addition, prior studies have focused particularly on the role of frequency/intensity of tea consumption, with little attention being paid to the starting age, duration, as well as the cumulative amount of tea consumption and liver cancer risk.
The Shanghai Women’s Health Study (SWHS) is a large population-based prospective cohort study in middle-aged Chinese women9. SWHS collected detailed information on the tea drinking habits of the cohort members, including the type, intensity, and duration of tea consumption, providing an excellent opportunity to study the association between tea drinking habits and liver cancer risk. Therefore, the current study aimed to investigate the association between tea consumption and the risk of primary liver cancer based on the SWHS, a population-based prospective cohort study in Chinese women.
MATERIALS AND METHODS
Cohort Design
The SWHS is a population-based prospective cohort study in Chinese women aged 40–70 years old to investigate the role of environmental exposures and biomarkers for the risk of cancer and other chronic diseases9. Details of the cohort design have been described in our previously published papers9–11. Briefly, 74,940 Chinese women were recruited from an urban district in Shanghai between 1996 and 2000. Each participant completed an in-person baseline interview and recorded anthropometric measurements.
All the cohort members were followed through a combination of database linkage and active follow-ups. Incident cancer cases and deaths records were linked to the Shanghai Cancer Registry and the Shanghai Vital Statistics Registry annually12. Active follow-up surveys were conducted every 3–4 years, with response rates of 99.7% (2000–2002), 98.7% (2002–2004), 94.9% (2004–2006), 92.3% (2007–2010), and 91.1% (2012–2017) for the first to the fifth surveys, respectively. Cancer cases were verified through home visits and review of medical charts by clinical and pathological experts. Cancers were coded using the International Classification of Disease, Ninth Revision (ICD-9)13. Primary liver cancer, the outcome of interest, was defined as malignant neoplasm of liver and intrahepatic bile ducts with an ICD-9 code of 155.
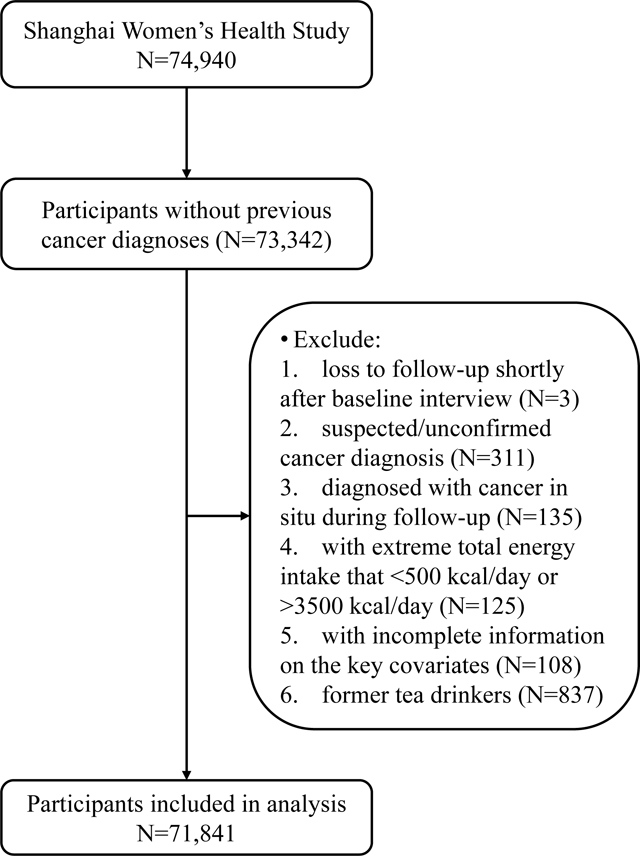
In the current study, we excluded participants who (i) reported previous cancer diagnoses at baseline interview (N=1,598); (ii) loss to follow-up shortly after baseline interview (N=3); (iii) suspected/unconfirmed cancer diagnosis (N=311); (iv) diagnosed with cancer in situ during follow-up (N=135); (v) with extreme total energy intake that <500 kcal/day or >3500 kcal/day14 (N=125); (vi) with incomplete information on the key covariates (N=108) and (vii) former tea drinkers (N=837), remaining 71,841 participants included in the analysis.
Assessment of tea consumption
Tea drinking habits were assessed for each participant at a baseline interview. Regular tea drinkers were defined as those who had ever drunk tea three or more times a week for at least six consecutive months in their lifetime. Regular tea drinkers were additionally asked about the age at which they began regularly drinking tea, the type of tea mainly consumed (i.e. green, black, oolong, scented, or other), as well as whether or not they were still a regular drinker at the time of the interview. Current regular tea drinkers were then additionally asked the amount (in grams) of dried tea leaves consumed each month in the year prior to the baseline interview. Former tea drinkers were defined as those who stopped drinking regularly before the interview and were asked at what age they stopped regularly drinking tea.
An analysis of the urinary excretion of epigallocatechin was conducted in a subset of 683 participants to assess the validity of using self-reported data to measure tea consumption. Specifically, the mean (reported with 25th and 75th percentiles) of urinary epigallocatechin (nmol/mg creatinine) for participants with different levels of green tea consumption (g/day) were as follows: 0.12 (0.08, 0.36) for nondrinkers, 0.12 (0.03, 0.61) for consumption of ≤1.7 g/day, 0.16 (0.12, 1.20) for consumption of 1.8–3.3 g/day, 0.25 (0.12, 1.85) for consumption of 3.4–5.0 g/day, and 0.96 (0.12, 5.16) for consumption of >5.0 g/day. A statistically significant trend for the increasing level of epigallocatechin and the intensity of green tea consumption was found (P value for trend<0.01), supporting the validity of our measurements on tea consumption15.
Based on the questionnaire, we utilized four variables to indicate multiple aspects of tea drinking habits: age of starting regular tea consumption (years old), duration of tea consumption (age at baseline minus age of starting regular tea consumption, years), intensity of tea consumption (dried tea leaves consumed per month during the last year, g/month) and cumulative consumption of tea (intensity multiplied by duration, kg). Above exposure variables for current tea drinkers were categorized into three predefined groups based on corresponding distributions (age of starting regular tea consumption: ≤25 years old, >25 and ≤35 years old, and >35 years old; duration of tea consumption: ≤10 years, >10 and ≤20 years, and >20 years; intensity of tea consumption: ≤50 g/month, >50 and ≤150 g/month, and >150 g/month; cumulative consumption of tea: ≤15 kg, >15 and ≤30 kg, and >30 kg).
Selection of covariates
Covariates included in the analyses were selected a priori for their known associations with tea consumption and liver cancer4,16. We considered demographic characteristics, cigarette smoking, alcohol drinking, obesity, diabetes, history of liver diseases, family history of cancer, physical activity, oral contraceptives, and dietary factors such as total energy intake, carbohydrate, protein, fat, fiber, vitamin C, red meat, poultry, fish, fruits, and vegetables.
Statistical Analyses
Baseline characteristics were described as numbers with frequencies for categorical variables and means with standard deviations (SD) for continuous variables. The differences between groups were compared using χ2 tests for categorical variables and t-tests for continuous variables.
The associations between tea consumption and the risk of liver cancer were estimated using Cox proportional hazards regression models17. Age was taken as the underlying time metric and models were stratified by birth cohorts (1926–1935, 1936–1945, 1946–1960)18. The entry time was defined as age at study enrollment and the exit time was defined as age at liver cancer diagnosis, death, loss to follow-up, or December 31, 2016, whichever came first. The proportional hazard assumption was examined by calculating the correlations of Schoenfeld residuals of each covariate with three functions of follow-up time (t, log(t), and t2)19. No evidence of a departure from the assumption was detected. Hazard ratios (HRs) and their 95% confidence intervals (CIs) were calculated in two models: the age-adjusted model (Model 1) and the multivariable-adjusted model (Model 2). Model 1 adjusted for age at study enrollment (year, continuous); Model 2 further adjusted for the following potential confounders: education (elementary school or less, secondary school, college or above), income (low, middle, high), cigarette smoking (ever, never), alcohol drinking (ever, never), body mass index (BMI) (kg/m2, continuous), history of chronic hepatitis (yes, no), history of cholelithiasis (yes, no), history of type 2 diabetes mellitus (T2DM) (yes, no), family history of liver cancer (yes, no), total energy intake (kcal/day, continuous) and total physical activity (MET-hours/week, continuous). Other covariates mentioned above were not included in Model 2 because the inclusion of these variables neither changed the HRs substantially (>10%) nor improved the precision of the risk estimates20. Never tea drinkers were set as reference categories in all analyses. When we focused on green tea consumption only, those who have consumed other types of tea (2444 participants) were excluded from the analyses. Linear trends across categories were evaluated by entering the median of each category into the model as a continuous variable (never drinkers=0).
To examine the robustness of the main results, the following sensitivity analyses were conducted. Firstly, considering the potential residual confounding caused by cigarette smoking and alcohol drinking, we repeated the main analyses among non-smoking and non-alcohol-drinking participants (68516 participants, 94.3%). Secondly, we repeated the analyses among participants without a history of chronic hepatitis/cholelithiasis, history of T2DM/hypertension, and family history of liver cancer to rule out the possible impact of these conditions. We also excluded the first two years’ cohort observations (i.e. the entry time was shifted to 2 years after the date of the baseline interview) to rule out possible reverse causation. Thirdly, to evaluate possible effect modification of body fatness and menopausal status, stratified analyses by BMI (<24kg/m2, ≥24kg/m2) and menopausal status (premenopausal, postmenopausal) were conducted. The multiplicative interactions between exposure variables and BMI/menopausal status were assessed by the Wald χ2 test. Finally, we created joint categories of intensity and duration (≤100 g/month for ≤15 years, >100 g/month for ≤15 years, ≤100 g/month for >15 years, and >100 g/month for >15 years) to investigate their joint effect.
A two-sided P value of less than 0.05 was considered statistically significant. Analyses were performed in SAS 9.4 (SAS Inc., Cary, N.C., USA).
RESULTS
After a median follow-up time of 18.12 years (interquartile range=1.59 years), 253 incident primary liver cancer cases were identified from 71,841 participants. Table 1 displays the distribution of baseline characteristics, tea drinking habits, and known risk factors by liver cancer status of the study participants. A regular tea drinking habit (ever drinking tea ≥3 times/week for >6 months continuously) was reported by 28.65% of the participants at baseline. Briefly, participants with liver cancer were about 6 years older than those without liver cancer and were more likely to have a lower level of education and income, a history of chronic hepatitis, cholelithiasis, and T2DM, as well as a family history of liver cancer. Regarding tea drinking habits, participants who developed liver cancer were less likely to drink tea regularly. The distributions of baseline characteristics by tea drinking habits are shown in Supplementary Table 1. Except for oral contraceptive use, history of chronic hepatitis, and history of cholelithiasis, the distributions of other variables were all significantly different between never tea drinkers and current regular tea drinkers.
Table 1.
Distribution of baseline characteristics and tea drinking habits by liver cancer status (SWHS, 1996–2016)
| Characteristicsa | All subjects (N=71841) | Non-cases (N=71588) | Cases (N=253) | P valueb |
|---|---|---|---|---|
| Age at study enrollment (years old) | 52.50 ± 9.06 | 52.50 ± 9.06 | 58.49 ± 8.34 | <0.001 |
| Education | <0.001 | |||
| Elementary school or less | 15396 (21.43) | 15290 (21.36) | 106 (41.90) | |
| Middle school | 46821 (65.17) | 46698 (65.23) | 123 (48.62) | |
| College or above | 9624 (13.40) | 9600 (13.41) | 24 (9.49) | |
| Incomec | 0.010 | |||
| Low | 39039 (54.34) | 38888 (54.32) | 151 (59.68) | |
| Middle | 20211 (28.13) | 20135 (28.13) | 76 (30.04) | |
| High | 12591 (17.53) | 12565 (17.55) | 26 (10.28) | |
| Ever cigarette smoker | 1979 (2.75) | 1969 (2.75) | 10 (3.95) | 0.244 |
| Ever alcohol drinker | 1606 (2.24) | 1602 (2.24) | 4 (1.58) | 0.481 |
| Postmenopausal | 35059 (48.80) | 34865 (48.70) | 194 (76.68) | <0.001 |
| Oral contraceptive use | 14649 (20.39) | 14592 (20.40) | 57 (22.53) | 0.398 |
| History of chronic hepatitis | 1836 (2.56) | 1801 (2.52) | 35 (13.83) | <0.001 |
| History of cholelithiasis | 7976 (11.10) | 7924 (11.07) | 52 (20.55) | <0.001 |
| History of type 2 diabetes mellitus | 3075 (4.28) | 3050 (4.26) | 25 (9.88) | <0.001 |
| Family history of liver cancer | 2356 (3.28) | 2330 (3.25) | 26 (10.28) | <0.001 |
| Body mass index (kg/m2) | 24.01 ± 3.42 | 24.01 ± 3.42 | 25.05 ± 3.79 | 0.089 |
| Total physical activity (MET-hours/week) | 106.65 ± 45.05 | 106.65 ± 45.06 | 106.58 ± 48.44 | <0.001 |
| Total energy (kcal/day) | 1673.70 ± 393.84 | 1631.56 ± 392.64 | 1673.55 ± 393.84 | 0.981 |
| Carbohydrate (g/day) | 285.18 ± 66.93 | 285.19 ± 66.94 | 281.95 ± 66.63 | 0.441 |
| Protein (g/day) | 67.01 ± 20.66 | 67.02 ± 20.66 | 63.58 ± 20.34 | 0.008 |
| Fat (g/day) | 29.33 ± 13.04 | 29.34 ± 13.04 | 27.61 ± 13.19 | 0.036 |
| Vitamin C (g/day) | 90.74 ± 48.85 | 90.77 ± 48.87 | 84.09 ± 44.05 | 0.017 |
| Red meat (g/day) | 50.87 ± 36.13 | 50.89 ± 36.13 | 46.13 ± 36.64 | 0.037 |
| Poultry (g/day) | 15.27 ± 17.70 | 15.27 ± 17.69 | 13.70 ± 18.36 | 0.157 |
| Fish (g/day) | 50.56 ± 44.53 | 50.59 ± 44.54 | 42.90 ± 42.04 | 0.006 |
| Fruits (g/day) | 295.63 ± 168.87 | 295.65 ± 168.90 | 291.13 ± 159.29 | 0.671 |
| Vegetables (g/day) | 264.20 ± 178.96 | 264.35 ± 179.04 | 220.62 ± 149.23 | <0.001 |
| Tea drinking habits | ||||
| Never drinker | 51261 (71.35) | 51063 (71.33) | 198 (78.26) | 0.015 |
| Current drinker | 20580 (28.65) | 20525 (28.67) | 55 (21.74) | 0.015 |
| Age of starting regular tea consumption (years old) | 33.43 ± 11.87 | 33.41 ± 11.86 | 40.16 ± 15.39 | 0.002 |
| Duration of tea consumption (years) | 17.31 ± 11.75 | 17.30 ± 11.75 | 17.86 ± 13.85 | 0.728 |
| Intensity of tea consumption (g/month) | 135.01 ± 96.57 | 135.04 ± 96.51 | 125.27 ± 119.04 | 0.546 |
| Cumulative consumption of tea (kg) | 29.96 ± 34.62 | 29.96 ± 34.60 | 26.87 ± 41.96 | 0.587 |
Continuous variables were displayed as means ± standard deviations; Categorical variables were displayed as numbers (percentages)
Continuous variables were compared using t-tests and categorical variables were compared using χ2 tests.
Defined as low: <¥20,000 per family per year; middle: ¥20,000–39,999 per family per year; high: ≥¥30,000 per family per year.
Table 2 displays the results of Cox regression models. Overall, we found that cumulative consumption of tea was significantly associated with a lower risk of primary liver cancer. After adjusting for all potential confounders, the risk of liver cancer for participants who have consumed >30 kg of dried tea leaves cumulatively was 0.56 (95% CI: 0.32–0.97). The effect size was similar when we focused on those who consumed only green tea and no other tea. The multivariable-adjusted HR for participants who have consumed >30 kg of dried green tea leaves cumulatively was 0.54 (95% CI: 0.30–0.98). Test for trend suggested a linear relationship between cumulative consumption of tea and the reduction of liver cancer risk (multivariable-adjusted P value for trend=0.038 for any type of tea). Results of all the other exposure variables were not statistically significant. For example, compared to never tea drinkers, participants who have consumed tea for more than 20 years had a 31% non-significant lower risk of liver cancer, and participants who have consumed >150 g/month of dried tea leaves had a 42% non-significant lower risk of liver cancer.
Table 2.
Association between tea consumption and the risk of liver cancer (SWHS, 1996–2016)
| Any type of tea | Green teaa | |||||||
|---|---|---|---|---|---|---|---|---|
|
|
|
|||||||
| Cases | Incidence densityb | HRc | HRd | Cases | Incidence densityb | HRc | HRd | |
| Never drinkers (Ref.) | 198 | 22.28 | 1.00 | 1.00 | 198 | 22.28 | 1.00 | 1.00 |
| Current drinkers | 55 | 15.09 | 0.91 (0.78, 1.06) | 0.92 (0.79, 1.07) | 52 | 16.18 | 0.94 (0.81, 1.10) | 0.95 (0.81, 1.10) |
| Age of starting regular tea consumption (years old) | ||||||||
| ≤25 | 11 | 9.97 | 0.61 (0.33, 1.13) | 0.63 (0.34, 1.16) | 10 | 10.27 | 0.64 (0.34, 1.21) | 0.65 (0.34, 1.23) |
| >25 and ≤35 | 12 | 10.65 | 0.70 (0.39, 1.27) | 0.72 (0.40, 1.30) | 11 | 10.97 | 0.72 (0.39, 1.34) | 0.73 (0.40, 1.36) |
| >35 | 32 | 22.62 | 1.02 (0.70, 1.48) | 1.02 (0.70, 1.49) | 31 | 25.05 | 1.12 (0.77, 1.64) | 1.11 (0.76, 1.63) |
| P trend | 0.503 | 0.569 | 0.868 | 0.885 | ||||
| Duration of tea consumption (years) | ||||||||
| ≤10 | 19 | 16.44 | 0.99 (0.62, 1.59) | 0.96 (0.60, 1.55) | 19 | 18.82 | 1.13 (0.70, 1.82) | 1.09 (0.68, 1.75) |
| >10 and ≤20 | 16 | 14.18 | 0.94 (0.56, 1.56) | 0.96 (0.57, 1.61) | 15 | 14.92 | 0.98 (0.58, 1.67) | 1.00 (0.58, 1.70) |
| >20 | 20 | 14.69 | 0.67 (0.42, 1.07) | 0.69 (0.43, 1.11) | 18 | 15.01 | 0.69 (0.43, 1.12) | 0.71 (0.43, 1.15) |
| P trend | 0.102 | 0.144 | 0.165 | 0.200 | ||||
| Intensity of tea consumption (g/month) | ||||||||
| ≤50 | 18 | 19.59 | 1.06 (0.65, 1.72) | 1.11 (0.68, 1.81) | 17 | 21.21 | 1.15 (0.70, 1.88) | 1.19 (0.72, 1.97) |
| >50 and ≤150 | 28 | 14.84 | 0.82 (0.55, 1.22) | 0.83 (0.56, 1.25) | 26 | 15.51 | 0.86 (0.57, 1.30) | 0.86 (0.57, 1.31) |
| >150 | 9 | 10.72 | 0.60 (0.31, 1.17) | 0.58 (0.30, 1.14) | 9 | 12.22 | 0.68 (0.35, 1.34) | 0.66 (0.34, 1.29) |
| P trend | 0.089 | 0.087 | 0.223 | 0.199 | ||||
| Cumulative consumption of tea (kg) | ||||||||
| ≤15 | 28 | 17.99 | 1.09 (0.73, 1.63) | 1.09 (0.73, 1.64) | 27 | 19.85 | 1.21 (0.80, 1.81) | 1.19 (0.79, 1.79) |
| >15 and ≤30 | 13 | 14.90 | 0.86 (0.49, 1.50) | 0.88 (0.50, 1.54) | 13 | 16.63 | 0.96 (0.55, 1.68) | 0.97 (0.55, 1.72) |
| >30 | 14 | 11.52 | 0.55 (0.32, 0.95) | 0.56 (0.32, 0.97) | 12 | 11.20 | 0.54 (0.30, 0.97) | 0.54 (0.30, 0.98) |
| P trend | 0.030 | 0.038 | 0.047 | 0.051 | ||||
Participants who consumed other types of tea were excluded from the analysis.
Per 100,000 person years.
Adjusted for age at study enrollment.
Adjusted for age at study enrollment, education, income, BMI, cigarette smoking, alcohol drinking, history of chronic hepatitis, history of cholelithiasis, history of T2DM, family history of liver cancer, total energy intake, and total physical activity.
The results of sensitivity analyses substantially supported the main findings. Results of Cox regression for non-smoking and non-alcohol-drinking participants are shown in Table 3. The point estimates were close to the main results, but all the HRs and tests for trend were not statistically significant. Similar results were observed after excluding participants with a family history of liver cancer (Table 4). When we repeated the analyses among participants without a history of chronic hepatitis/cholelithiasis, or those without a history of T2DM/hypertension, the HRs for participants who have consumed >30 kg of dried tea leaves were greater (0.72 and 0.84, respectively), but none of the results were statistically significant (Table 4). The exclusion of the first two years’ cohort observations did not substantially change the results (Table 4). There was no evidence of multiplicative interactions between tea consumption and BMI/menopausal status (Supplementary Table 2 & Supplementary Table 3). Results of joint categories of duration and intensity of tea consumption suggested that participants with both the longest duration and highest intensity of tea consumption had the lowest risk of liver cancer (Supplementary Table 4).
Table 3.
Association between tea consumption and the risk of liver cancer among non-smoking and non-alcohol-drinking participants (SWHS, 1996–2016)
| Any type of tea | Green teaa | |||||||
|---|---|---|---|---|---|---|---|---|
|
|
|
|||||||
| Cases | Incidence densityb | HRc | HRd | Cases | Incidence densityb | HRc | HRd | |
| Never drinkers (Ref.) | 190 | 22.12 | 1.00 | 1.00 | 190 | 22.12 | 1.00 | 1.00 |
| Current drinkers | 50 | 14.76 | 0.91 (0.78, 1.07) | 0.92 (0.78, 1.08) | 47 | 15.73 | 0.94 (0.80, 1.10) | 0.94 (0.80, 1.11) |
| Age of starting regular tea consumption (years old) | ||||||||
| ≤25 | 10 | 9.92 | 0.63 (0.33, 1.19) | 0.64 (0.34, 1.22) | 9 | 10.10 | 0.65 (0.33, 1.26) | 0.65 (0.33, 1.28) |
| <25 and ≤35 | 11 | 10.44 | 0.70 (0.38, 1.29) | 0.72 (0.39, 1.34) | 10 | 10.65 | 0.71 (0.38, 1.36) | 0.73 (0.38, 1.39) |
| >35 | 29 | 21.90 | 1.00 (0.68, 1.48) | 1.00 (0.67, 1.48) | 28 | 24.17 | 1.10 (0.74, 1.63) | 1.09 (0.73, 1.62) |
| P trend | 0.475 | 0.534 | 0.782 | 0.800 | ||||
| Duration of tea consumption (years) | ||||||||
| ≤10 | 16 | 14.63 | 0.89 (0.53, 1.49) | 0.86 (0.52, 1.44) | 16 | 16.75 | 1.02 (0.61, 1.70) | 0.98 (0.58, 1.63) |
| <10 and ≤20 | 16 | 15.19 | 1.02 (0.61, 1.71) | 1.04 (0.62, 1.75) | 15 | 15.97 | 1.07 (0.63, 1.82) | 1.08 (0.63, 1.85) |
| >20 | 18 | 14.51 | 0.68 (0.42, 1.10) | 0.70 (0.43, 1.15) | 16 | 14.62 | 0.69 (0.41, 1.14) | 0.71 (0.42, 1.18) |
| P trend | 0.153 | 0.215 | 0.215 | 0.265 | ||||
| Intensity of tea consumption (g/month) | ||||||||
| ≤50 | 17 | 19.32 | 1.06 (0.64, 1.74) | 1.12 (0.68, 1.84) | 16 | 20.80 | 1.14 (0.68, 1.89) | 1.19 (0.71, 1.99) |
| <50 and ≤150 | 26 | 14.76 | 0.83 (0.55, 1.25) | 0.84 (0.55, 1.28) | 24 | 15.32 | 0.86 (0.56, 1.32) | 0.86 (0.56, 1.33) |
| >150 | 7 | 9.40 | 0.54 (0.25, 1.15) | 0.52 (0.25, 1.12) | 7 | 10.73 | 0.62 (0.29, 1.32) | 0.60 (0.28, 1.27) |
| P trend | 0.081 | 0.079 | 0.170 | 0.189 | ||||
| Cumulative consumption of tea (kg) | ||||||||
| ≤15 | 26 | 17.53 | 1.08 (0.71, 1.63) | 1.08 (0.71, 1.63) | 25 | 19.26 | 1.18 (0.78, 1.80) | 1.17 (0.76, 1.78) |
| <15 and ≤30 | 11 | 13.44 | 0.78 (0.42, 1.44) | 0.80 (0.43, 1.48) | 11 | 15.00 | 0.87 (0.47, 1.60) | 0.89 (0.48, 1.65) |
| >30 | 13 | 11.98 | 0.59 (0.34, 1.04) | 0.60 (0.34, 1.06) | 11 | 11.48 | 0.57 (0.31, 1.05) | 0.57 (0.31, 1.05) |
| P trend | 0.051 | 0.063 | 0.069 | 0.075 | ||||
Participants who consumed other types of tea were excluded from the analysis.
Per 100,000 person years.
Adjusted for age at study enrollment.
Adjusted for age at study enrollment, education, income, BMI, history of chronic hepatitis, history of cholelithiasis, history of T2DM, family history of liver cancer, total energy intake, and total physical activity.
Table 4.
The association between cumulative tea consumption (dried tea leaves, kg) and the risk of liver cancer for specific participants (SWHS, 1996–2000)
| Cases | Incidence ratea | HRb | HRc | |
|---|---|---|---|---|
| Without history of chronic hepatitis/cholelithiasis | ||||
| Never drinkers (Ref.) | 137 | 17.69 | 1.00 | 1.00 |
| ≤15 | 17 | 12.51 | 0.99 (0.60, 1.65) | 1.00 (0.60, 1.66) |
| >15 and ≤30 | 8 | 10.49 | 0.79 (0.39, 1.61) | 0.80 (0.39, 1.65) |
| >30 | 12 | 11.52 | 0.71 (0.40, 1.29) | 0.72 (0.39, 1.31) |
| Without history of T2DM/hypertension | ||||
| Never drinkers (Ref.) | 129 | 19.31 | 1.00 | 1.00 |
| ≤15 | 17 | 13.84 | 0.98 (0.59, 1.63) | 1.01 (0.61, 1.69) |
| >15 and ≤30 | 8 | 11.79 | 0.80 (0.39, 1.63) | 0.83 (0.40, 1.70) |
| >30 | 13 | 14.63 | 0.80 (0.45, 1.42) | 0.84 (0.47, 1.50) |
| Without family history of liver cancer | ||||
| Never drinkers (Ref.) | 178 | 20.69 | 1.00 | 1.00 |
| ≤15 | 25 | 16.63 | 1.11 (0.73, 1.70) | 1.15 (0.75, 1.76) |
| >15 and ≤30 | 11 | 13.04 | 0.82 (0.45, 1.51) | 0.86 (0.46, 1.58) |
| >30 | 13 | 11.12 | 0.58 (0.33, 1.02) | 0.59 (0.34, 1.05) |
| Excluding the first two-years’ observation | ||||
| Never drinkers (Ref.) | 176 | 19.82 | 1.00 | 1.00 |
| ≤15 | 23 | 14.78 | 1.01 (0.65, 1.56) | 1.01 (0.65, 1.56) |
| >15 and ≤30 | 12 | 13.75 | 0.89 (0.49, 1.59) | 0.91 (0.50, 1.65) |
| >30 | 12 | 9.87 | 0.53 (0.30, 0.96) | 0.53 (0.30, 0.96) |
Per 100,000 person years.
Adjusted for age at study enrollment.
Adjusted for age at study enrollment, education, income, cigarette smoking, alcohol drinking, BMI, history of chronic hepatitis, history of cholelithiasis, history of T2DM, family history of liver cancer, total energy intake, and total physical activity.
DISCUSSION
Based on a population-based prospective cohort study in middle-aged Chinese women, the current study investigated the associations between multiple aspects of tea drinking habits and the risk of primary liver cancer. Greater cumulative consumption of tea was found to be associated with a lower risk of liver cancer.
Using the data from the same cohort (SWHS), Nechuta et al. had already reported the association between tea consumption and liver cancer risk in 201221. However, the previous study included only non-smoking and non-alcohol-drinking participants, with fewer liver cancer cases (N=134). Moreover, only two variables (tea consumption per month and years of consumption) were analyzed in the previous study. In addition, the previous study focused on overall digestive system cancers and did not consider the specific confounders of liver cancer such as chronic hepatitis and cholelithiasis, which may have led to biased estimation. Therefore, we updated our previous analysis with a larger number of liver cancer cases and a more comprehensive statistical analysis.
To the best of our knowledge, 8 prospective cohort studies have examined the association between tea/green tea consumption and the risk of liver cancer in the general population21–28. Five of them were conducted in Japan22,25–28, two in China21,23, and one in Europe24. Four studies were based on a single population21,25,26,28, while the other four studies were multicenter22–24,27. The SWHS included only urban populations21, the China Kadoorie Biobank (CKB)23 included both urban and rural populations, and other studies did not describe their study population as urban or rural22,24–28. The current study suggested a non-significant lower risk for participants with greater intensity of tea consumption, which was consistent with the reports of the Japan Public Health Center-Based Prospective Study Cohort II (JPHC-II)22 and the CKB23. The European Prospective Investigation into Cancer and Nutrition (EPIC) study suggested that tea consumers in the highest compared to the lowest quintile had a lower risk of hepatocellular carcinoma by 59% (HR=0.41, 95% CI: 0.22–0.78)24. In the Ohsaki Cohort Study (OCS), the risk of liver cancer for participants who drank ≥5 cups/day of green tea was 0.58 (95% CI: 0.41–0.83)25. Three other studies have used frequency of tea drinking (times/day or times/week) rather than intensity (cups/day, ml/day, or g/month) as exposure of interest, and their results were also non-significant26–28.
Unlike most studies that focused only on the intensity/frequency of tea consumption, our study evaluated tea drinking habits in a more comprehensive manner, which included age of starting, duration, intensity, and cumulative consumption of tea. The results suggested a lower risk for participants who started drinking tea at an earlier age and who have consumed tea for a longer period, but none of the HRs or tests for trend reached statistical significance. While neither intensity nor duration alone was significantly associated with liver cancer risk, the amount of cumulative tea consumption, which represents the combined effects of both intensity and duration, was significantly associated with a lower risk of liver cancer. The results of joint categories of intensity and duration also suggested a significantly lower risk of liver cancer for participants with both the longest duration and the highest intensity of tea consumption.
Compared to other established risk factors for liver cancer such as dietary aflatoxin exposures, hepatitis B or C virus infection, alcoholic drinks, and obesity, the effect of tea consumption is relatively weak4,16. In addition to the relatively low doses of tea to which humans are typically exposed compared with those in experimental settings, possible explanations for the inconsistent results of the relevant epidemiological studies include the following: Firstly, the measurement of tea consumption varied across studies. For example, the intensity of tea consumption has been measured in several units including “ml/day”, “cups/day”, and “g/day”22–25. Due to the variation in tea concentration, the same liquid volume of tea may not indicate the same level of tea leaves consumption. The measurement error may lead to non-differential misclassification and attenuation of effect estimates to null values. Therefore, we recommend using the mass of dried tea leaves rather than the liquid volume of tea as the measurement of tea consumption. Secondly, differences in the tea preparation process, especially the degree of fermentation, may affect the levels of bioactive compounds in different types of tea29. The current study specifically examined the effect of green tea and found that the HRs for the effect of green tea consumption on liver cancer were not found to differ significantly from those of any type of tea. Due to the limited number of consumers, we did not analyze other types of tea specifically. Thirdly, heterogeneity of genetic susceptibility, metabolic differences, and lifestyle factors across different populations might also lead to inconsistent results. Several studies (including our study) observed a clustering phenomenon of cigarette smoking, alcohol drinking, and tea drinking habits23,24 while others did not22,25,28. Considering that cigarette smoking and alcohol drinking are strong risk factors for liver cancer, the protective effect of tea might be obscured.
In general, there remains limited evidence from prospective epidemiological studies linking tea consumption to a lower risk of liver cancer. Further explorations on the tea-liver cancer association are needed, especially with the well-defined evaluation of tea drinking habits by considering the tea concentrations, water temperature, and other lifestyle and metabolic-related factors.
The strengths of the current study included the prospective study design, complete follow-up, and comprehensive confounder control that helps to minimize many sources of bias. Besides, we evaluated the tea drinking habits in multiple aspects, including starting age, duration, intensity, and cumulative consumption, providing more detailed information than in previous publications. Still, several limitations to this study need to be acknowledged. The major one is the small number of cases in some categories (particularly amongst categories with high exposure levels) and therefore the limited statistical power. Studies with larger sample sizes are warranted to confirm our findings that cumulative consumption of tea increases the risk of liver cancer, and to determine whether the lack of associations between age at starting, duration, and intensity of tea consumption and liver cancer risk are due to insufficient statistical power. Planned pooling studies and systematic reviews of existing literature that could expand the sample size might also be alternatives. Another concern is the uncertainty regarding the evaluation of cumulative tea consumption, which was multiplied by intensity (levels in the year prior to the baseline interview) and duration (time interval between the start of regular tea drinking and baseline interview). The intensity of tea consumption in a given year is not necessarily representative of the average level for the entire exposure period. It is also not possible to take into account the short-term suspensions of tea drinking during the exposure period. Even so, the misclassification was non-differential and the actual effect size was more likely to be underestimated. Apart from this, information on the status of hepatitis B/C virus infection, which are important risk factors for liver cancer, was not available in our datasets. As a complement, a self-reported history of chronic hepatitis at study enrollment was included in the multivariable-adjusted models. We also performed a sensitivity analysis by excluding participants with a history of chronic hepatitis/cholelithiasis, and the results remained consistent with the main analysis. Last but not least, the participants in this study are middle-aged Chinese women from an urban area whose lifestyles and dietary habits may differ from those of the other populations. Therefore, our findings should be interpreted and extrapolated with caution.
CONCLUSIONS
In conclusion, the current study supported the inverse association between the consumption of tea and the risk of primary liver cancer. Participants who have consumed a greater amount of tea cumulatively had a lower risk of liver cancer compared to never tea drinkers. Our study emphasized the role of cumulative tea consumption on the risk of liver cancer. Further studies are needed to confirm our findings and to investigate the underlying mechanisms.
Supplementary Material
Novelty and Impact.
Previous epidemiological studies have reached inconsistent conclusions regarding the association between tea consumption and liver cancer risk. Our study highlighted the importance of cumulative consumption of tea, not just the intensity of tea consumption. We found that greater cumulative consumption of dried tea leaves was associated with a lower risk of liver cancer.
ACKNOWLEDGMENTS
We would like to thank all participants and staff from the Shanghai Women’s Health Study for their contribution to this research.
FUNDING
This work was supported by the National Key Project of Research and Development Program of China [2021YFC2500404, 2021YFC2500400, 2016YFC1302503]; and the parent cohort was supported by a grant from the US National Institutes of Health [UM1 CA182910]. All funders had no role in the design, analysis, and writing of this article.
Abbreviations
- BMI
body mass index
- CI
confidence interval
- CKB
China Kadoorie Biobank
- EPIC
European Prospective Investigation into Cancer and nutrition
- HR
hazard ratio
- ICD-9
the International Classification of Disease, Ninth Revision
- JPHC-II
Japan Public Health Center-Based Prospective Study Cohort II
- OCS
Ohsaki Cohort Study
- SD
standard deviations
- SWHS
Shanghai Women’s Health Study
- T2DM
type 2 diabetes mellitus
- WCRF
World Cancer Research Fund
Footnotes
CONFLICT OF INTEREST
The authors have declared no conflicts of interest.
ETHICS STATEMENT
The cohort protocol has been approved by the Institutional Review Boards of the Shanghai Cancer Institute and Vanderbilt University. Informed consent has been obtained from all participants. The current study has been approved by the Renji Hospital Ethics Committee of Shanghai Jiao Tong University School of Medicine (KY2019-197).
DATA AVAILABILITY STATEMENT
The data will be available on request pending approval by the scientific committee of the relevant institutes. Further details that support the findings of this study are available from the corresponding authors upon request.
REFERENCE
- 1.Sung H, Ferlay J, Siegel RL, Laversanne M, Soerjomataram I, Jemal A, Bray F. Global cancer statistics 2020: GLOBOCAN estimates of incidence and mortality worldwide for 36 cancers in 185 countries. CA Cancer J Clin. 2021; 71: 209–249. [DOI] [PubMed] [Google Scholar]
- 2.Yang CS, Wang X, Lu G, Picinich SC. Cancer prevention by tea: animal studies, molecular mechanisms and human relevance. Nat Rev Cancer. 2009; 9: 429–439. [DOI] [PMC free article] [PubMed] [Google Scholar]
- 3.Shimizu M, Shirakami Y, Sakai H, Kubota M, Kochi T, Ideta T, Miyazaki T, Moriwaki H. Chemopreventive potential of green tea catechins in hepatocellular carcinoma. Int J Mol Sci. 2015; 16: 6124–6139. [DOI] [PMC free article] [PubMed] [Google Scholar]
- 4.World Cancer Research Fund/American Institute for Cancer Research. Continuous Update Project Expert Report 2018. Diet, nutrition, physical activity and liver cancer. Available at dietandcancerreport.org. [Google Scholar]
- 5.Fon Sing M, Yang WS, Gao S, Gao J, Xiang YB. Epidemiological studies of the association between tea drinking and primary liver cancer: a meta-analysis. Eur J Cancer Prev. 2011; 20: 157–165. [DOI] [PubMed] [Google Scholar]
- 6.Kim TL, Jeong GH, Yang JW, Lee KH, Kronbichler A, Van Der Vliet HJ, Grosso G, Galvano F, Aune D, Kim JY, Veronese N, Stubbs B, Solmi M, Koyanagi A, Hong SH, Dragioti E, Cho E, De Rezende LFM, Giovannucci EL, Shin JI, Gamerith G. Tea consumption and risk of cancer: an umbrella review and meta-analysis of observational studies. Adv Nutr. 2020; 11: 1437–1452. [DOI] [PMC free article] [PubMed] [Google Scholar]
- 7.Zhao LG, Li ZY, Feng GS, Ji XW, Tan YT, Li HL, Gunter MJ, Xiang YB. Tea drinking and risk of cancer incidence: a meta-analysis of prospective cohort studies and evidence evaluation. Adv Nutr. 2021; 12: 402–412. [DOI] [PMC free article] [PubMed] [Google Scholar]
- 8.Yu F, Jin Z, Jiang H, Xiang C, Tang J, Li T, He J. Tea consumption and the risk of five major cancers: a dose-response meta-analysis of prospective studies. BMC Cancer. 2014; 14: 197. [DOI] [PMC free article] [PubMed] [Google Scholar]
- 9.Zheng W, Chow WH, Yang G, Jin F, Rothman N, Blair A, Li HL, Wen W, Ji BT, Li Q, Shu XO, Gao YT. The Shanghai Women’s Health Study: rationale, study design, and baseline characteristics. Am J Epidemiol. 2005; 162: 1123–1131. [DOI] [PubMed] [Google Scholar]
- 10.Shu XO, Yang G, Jin F, Liu D, Kushi L, Wen W, Gao YT, Zheng W. Validity and reproducibility of the food frequency questionnaire used in the Shanghai Women’s Health Study. Eur J Clin Nutr. 2004; 58: 17–23. [DOI] [PubMed] [Google Scholar]
- 11.Matthews CE, Shu XO, Yang G, Jin F, Ainsworth BE, Liu D, Gao YT, Zheng W. Reproducibility and validity of the Shanghai Women’s Health Study physical activity questionnaire. Am J Epidemiol. 2003; 158: 1114–1122. [DOI] [PubMed] [Google Scholar]
- 12.Rao C, Yang G, Hu J, Ma J, Xia W, Lopez AD. Validation of cause-of-death statistics in urban China. Int J Epidemiol. 2007; 36: 642–651. [DOI] [PubMed] [Google Scholar]
- 13.World Health Organization. International statistical classification of diseases, injuries, and causes of death. Vol 2. Geneva, Switzerland: World Health Organization; 1975. [Google Scholar]
- 14.Willett WC, eds. Nutritional Epidemiology, 3rd ed. Oxford: Oxford University Press, 2013. 529p [Google Scholar]
- 15.Dai Q, Shu XO, Li H, Yang G, Shrubsole MJ, Cai H, Ji B, Wen W, Franke A, Gao YT, Zheng W. Is green tea drinking associated with a later onset of breast cancer? Ann Epidemiol. 2010; 20: 74–81. [DOI] [PMC free article] [PubMed] [Google Scholar]
- 16.Yang WS, Zeng XF, Liu ZN, Zhao QH, Tan YT, Gao J, Li HL, Xiang YB. Diet and liver cancer risk: a narrative review of epidemiological evidence. Br J Nutr. 2020; 124: 330–340. [DOI] [PubMed] [Google Scholar]
- 17.Cox DR. Regression models and life-tables (with discussion). J R Stat Soc Series B. 1972; 34: 187–220. [Google Scholar]
- 18.Korn EL, Graubard BI, Midthune D. Time-to-event analysis of longitudinal follow-up of a survey: choice of the time-scale. Am J Epidemiol. 1997; 145: 72–80. [DOI] [PubMed] [Google Scholar]
- 19.Schoenfeld D Partial residuals for the proportional hazards regression model. Biometrika. 1982;69:239–41. [Google Scholar]
- 20.Harrell FE Jr, eds. Regression modelling strategies: with applications to linear models, logistic regression, and survival analysis. New York: Springer, 2001. 582p [Google Scholar]
- 21.Nechuta S, Shu XO, Li HL, Yang G, Ji BT, Xiang YB, Cai H, Chow WH, Gao YT, Zheng W. Prospective cohort study of tea consumption and risk of digestive system cancers: results from the Shanghai Women’s Health Study. Am J Clin Nutr. 2012; 96: 1056–1063. [DOI] [PMC free article] [PubMed] [Google Scholar]
- 22.Inoue M, Kurahashi N, Iwasaki M, Shimazu T, Tanaka Y, Mizokami M, Tsugane S. Effect of coffee and green tea consumption on the risk of liver cancer: cohort analysis by hepatitis virus infection status. Cancer Epidemiol Biomarkers Prev. 2009; 18: 1746–1753. [DOI] [PubMed] [Google Scholar]
- 23.Li X, Yu C, Guo Y, Bian Z, Shen Z, Yang L, Chen Y, Wei Y, Zhang H, Qiu Z, Chen J, Chen F, Chen Z, Lv J. Association between tea consumption and risk of cancer: a prospective cohort study of 0.5 million Chinese adults. Eur J Epidemiol. 2019; 34: 753–763. [DOI] [PMC free article] [PubMed] [Google Scholar]
- 24.Bamia C, Lagiou P, Jenab M, Trichopoulou A, Fedirko V, Aleksandrova K, Pischon T, Overvad K, Olsen A, Tjønneland A, Boutron-Ruault MC, Fagherazzi G, Racine A, Kuhn T, Boeing H, Floegel A, Benetou V, Palli D, Grioni S, Panico S, Tumino R, Vineis P, Bueno-De-Mesquita HB, Dik VK, Bhoo-Pathy N, Uiterwaal CS, Weiderpass E, Lund E, Quirós JR, Zamora-Ros R, Molina-Montes E, Chirlaque MD, Ardanaz E, Dorronsoro M, Lindkvist B, Wallström P, Nilsson LM, Sund M, Khaw KT, Wareham N, Bradbury KE, Travis RC, Ferrari P, Duarte-Salles T, Stepien M, Gunter M, Murphy N, Riboli E, Trichopoulos D. Coffee, tea and decaffeinated coffee in relation to hepatocellular carcinoma in a European population: multicentre, prospective cohort study. Int J Cancer. 2015; 136: 1899–1908. [DOI] [PMC free article] [PubMed] [Google Scholar]
- 25.Ui A, Kuriyama S, Kakizaki M, Sone T, Nakaya N, Ohmori-Matsuda K, Hozawa A, Nishino Y, Tsuji I. Green tea consumption and the risk of liver cancer in Japan: the Ohsaki Cohort study. Cancer Causes Control. 2009; 20: 1939–1945. [DOI] [PubMed] [Google Scholar]
- 26.Tamura T, Wada K, Konishi K, Goto Y, Mizuta F, Koda S, Hori A, Tanabashi S, Matsushita S, Tokimitsu N, Nagata C. Coffee, green tea, and caffeine intake and liver cancer risk: a prospective cohort study. Nutr Cancer. 2018; 70: 1210–1216. [DOI] [PubMed] [Google Scholar]
- 27.Shimazu T, Tsubono Y, Kuriyama S, Ohmori K, Koizumi Y, Nishino Y, Shibuya D, Tsuji I. Coffee consumption and the risk of primary liver cancer: pooled analysis of two prospective studies in Japan. Int J Cancer. 2005; 116: 150–154. [DOI] [PubMed] [Google Scholar]
- 28.Nagano J, Kono S, Preston DL, Mabuchi K. A prospective study of green tea consumption and cancer incidence, Hiroshima and Nagasaki (Japan). Cancer Causes Control. 2001; 12: 501–508. [DOI] [PubMed] [Google Scholar]
- 29.Yuan JM. Cancer prevention by green tea: evidence from epidemiologic studies. Amer J Clin Nutr. 2013; 98: 1676S–1681S. [DOI] [PMC free article] [PubMed] [Google Scholar]
Associated Data
This section collects any data citations, data availability statements, or supplementary materials included in this article.
Supplementary Materials
Data Availability Statement
The data will be available on request pending approval by the scientific committee of the relevant institutes. Further details that support the findings of this study are available from the corresponding authors upon request.