

Abstract
BACKGROUND & AIMS:
In 2021, the US Preventive Services Task Force lowered the colorectal cancer (CRC) screening age to 45y. We used conjoint analysis—a method that assesses complex decision making—to update our understanding on people’s CRC screening test preferences in the context of new guidelines.
METHODS:
We conducted a conjoint analysis survey among unscreened individuals ≥40yo at average risk for CRC to determine the relative importance of screening test attributes in their decision making (e.g., modality, effectiveness at reducing CRC risk, bowel prep, etc.). We also performed simulations to estimate the proportion of people who would prefer each US Multi-Society Task Force (MSTF) on CRC-recommended test. The analyses were stratified among those aged 40-49 (newly or soon-to-be eligible for screening) and ≥50 years (have been eligible).
RESULTS:
Overall, 1,000 participants completed the conjoint analysis (40-49yo, n=456; ≥50yo, n=544). When considering all five US MSTF-recommended tests, there were differences in test preferences between age groups (p=0.019), and the most preferred test was a fecal immunochemical test (FIT)-fecal DNA every three years: 40-49yo—34.6%; ≥50yo—37.3%. When considering only the US MSTF tier 1 tests, most 40-49 (68.9%) and ≥50 year olds (77.4%; p=0.004) preferred an annual FIT over a colonoscopy every 10 years.
CONCLUSIONS:
Our findings suggest that more than a third of people may want to do a FIT-fecal DNA every three years for their CRC screening. When only considering US MSTF tier 1 tests, three-fourths of people may prefer an annual FIT over colonoscopy. Further research examining CRC screening test preferences among broader populations is warranted to inform and enhance screening programs.
Keywords: colorectal cancer screening, patient preferences, fecal immunochemical test, colonoscopy
Graphical Abstract

INTRODUCTION
In 2021, the US Preventive Services Task Force (USPSTF)1 recommended all adults at average risk for colorectal cancer (CRC) start screening at age 45 rather than 50. As there are 19 million people in the US aged 45-49 years who are newly eligible for CRC screening,2 along with millions of 50-75 year olds who remain unscreened,3 it is critical to update our understanding on how they choose among different testing options. Moreover, while prior studies have examined stated preferences for CRC screening tests,4–7 most had limited sample sizes, were performed outside the US, or did not include all currently available screening options (e.g., fecal immunochemical test [FIT]-fecal DNA, colon video capsule, computed tomography [CT] colonography). To address these gaps, we employed conjoint analysis—a method that assesses how people make complex decisions—among a nationwide sample of 1,000 unscreened Americans to quantitatively examine their decision making when selecting among CRC screening tests. Additionally, we determined the proportion of respondents who preferred to do FIT, FIT-fecal DNA, colon video capsule, CT colonography, or colonoscopy.8
METHODS
Study Design and Participant Recruitment
We performed a cross-sectional, self-administered, online survey of a nationwide sample of US adults aged ≥40 years at average risk for CRC and who had not been previously screened. The objective was to understand the tradeoffs they make when choosing among the various CRC screening modalities and determine their preferred test. The study was approved by the Cedars-Sinai Institutional Review Board (STUDY599).
We collaborated with a survey research firm (Cint; Stockholm, Sweden) to recruit respondents. Cint partners with research panels across the US and drew from a sample of over 20 million panelists who agreed to receive survey invitations; see Supplemental File 1 for details about Cint and its participant remuneration policies.
For the overall cohort, we recruited a representative sample with respect to sex and region based on latest US Census data. From April 29, 2021, to June 2, 2021, Cint sent invitation emails to panelists aged ≥40 years, and those who clicked the survey link were informed that the study goal was “to learn how people make certain medical decisions.” Depending on the respondents’ panels, the survey completion incentives ranged from $0.30 to $2.00.
Study Population
All respondents who accessed the survey were first presented with eligibility questions. We included individuals aged ≥40 years and excluded those who had been previously screened for CRC, been diagnosed with colon polyps, Crohn’s disease, or ulcerative colitis, or had a first-degree relative with CRC. Before proceeding with the remaining survey questions, eligible participants reviewed a study information page and provided consent.
Survey Instrument
Supplemental File 2 includes the full survey instrument, which consisted of conjoint analysis exercises and open-ended and multiple-choice questions. Prior to deploying the survey, we pilot tested the instrument with eight patients to ensure its understandability and usability.
Conjoint Analysis Exercises to Assess CRC Screening Test Preferences
Conjoint analysis quantifies how people make tradeoffs when considering competing factors. We describe conjoint analysis in detail elsewhere,9 but in brief this approach is based on the idea that any product (e.g., a test) can be described by its attributes and is valued based on the levels of these attributes. The conjoint analysis exercises are administered via an online program where participants are presented with a series of unique side-by-side profiles (e.g., of tests) and then asked to select their preferred profile, if any, for the stated objective (Figure 1).
FIGURE 1.
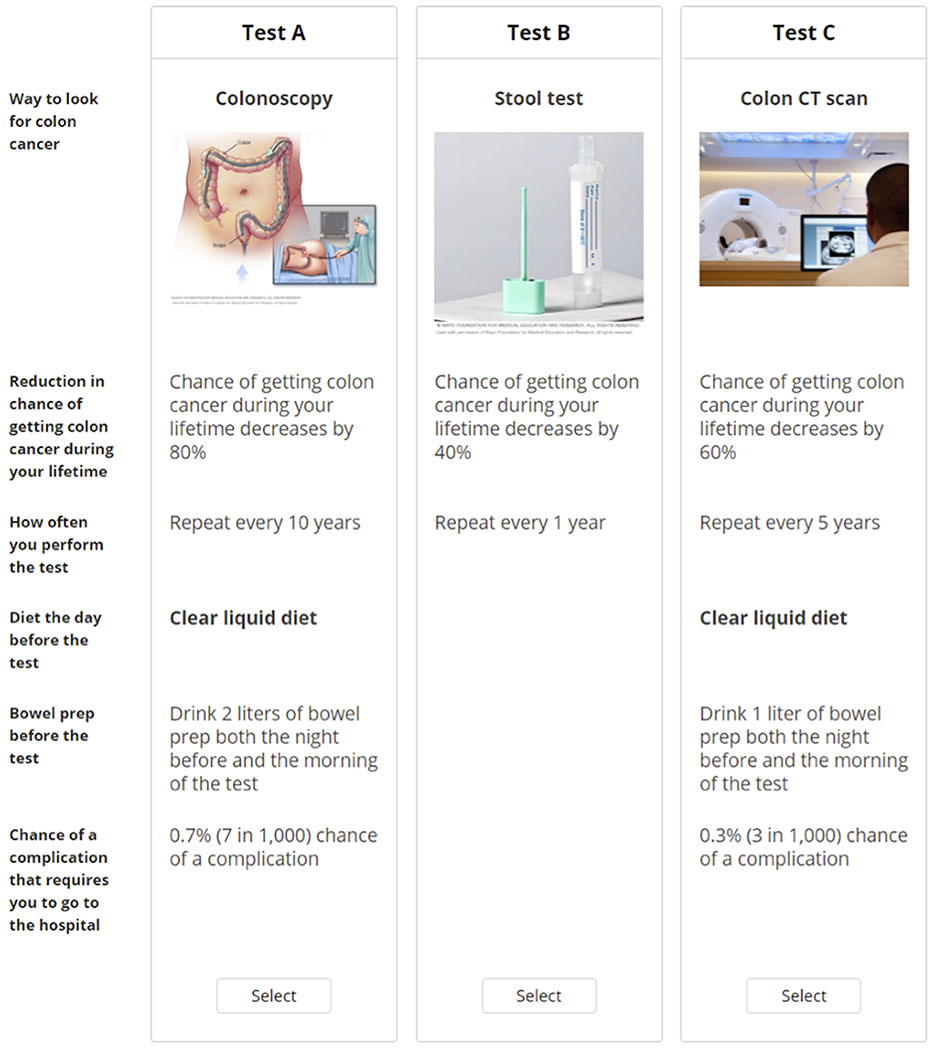
Sample conjoint exercise where participants consider three hypothetical CRC screening tests side by side and decide which one, if any, they would be most likely to do. Participants were shown a total of nine vignettes and they were able to hover their mouse over bolded text for further information. CRC, colorectal cancer; CT, computed tomography.
When developing the conjoint analysis exercises, we followed best practices endorsed by the International Society for Pharmacoeconomic and Outcomes Research.10 Selection of the attributes and levels for the conjoint analysis were informed by findings from our focus groups with 21 patients11 and input from domain experts on the research team (B.M.R.S., C.V.A). Table 1 presents the final attributes and levels that were tested in the survey.
TABLE 1.
Attributes and levels included in the conjoint analysis.
| CRC screening test attribute | Attribute levels |
|---|---|
| Way to look for colon cancer | Colonoscopy |
| Colon video capsule | |
| Colon CT scan | |
| Stool test a | |
| Reduction in chance of getting colon cancer during your lifetime | Chance of getting colon cancer during your lifetime decreases by 20% |
| Chance of getting colon cancer during your lifetime decreases by 40% | |
| Chance of getting colon cancer during your lifetime decreases by 60% | |
| Chance of getting colon cancer during your lifetime decreases by 80% | |
| How often you perform the test | Repeat every 1 year |
| Repeat every 3 years | |
| Repeat every 5 years | |
| Repeat every 10 years | |
| Diet the day before the test b | Low fiber diet |
| Clear liquid diet | |
| Bowel prep before the test b | Drink 1 liter of bowel prep both the night before and the morning of the test |
| Drink 1.5 liters of bowel prep both the night before and the morning of the test | |
| Drink 2 liters of bowel prep both the night before and the morning of the test | |
| Chance of a complication that requires you to go to the hospital b | 0.1% (1 in 1,000) chance of a complication |
| 0.3% (3 in 1,000) chance of a complication | |
| 0.5% (5 in 1,000) chance of a complication | |
| 0.7% (7 in 1,000) chance of a complication | |
| 0.9% (9 in 1,000) chance of a complication |
CRC, colorectal cancer; CT, computed tomography; FIT, fecal immunochemical test.
For stool tests, the survey did not specifically distinguish between FIT and FIT-fecal DNA because the test completion steps for patients are similar for both. Those who preferred a stool test either every year or every three years based on their conjoint analysis-derived data were classified as preferring FIT or FIT-fecal DNA, respectively.
The choice-based conjoint employed an alternative specific design and levels for this attribute were only shown for colonoscopy, colon video capsule, and colon CT scan.
Once the attributes and levels were finalized, they were inputted into a conjoint analysis program (Lighthouse Studio 9.11.0, Sawtooth Software, North Orem, UT). We employed a choice-based conjoint with alternative-specific design, and participants were shown a random set of nine side-by-side profiles (Figure 1) drawn from 300 potential sets generated through a balanced overlap design. Participants were instructed to “choose which [screening test], if any, you would be most likely to do [for CRC screening]” and to “assume that medical insurance will cover each one and that you will not have any out-of-pocket costs.” Prior to completing the conjoint exercises, respondents were provided information on the steps involved with each testing modality (colonoscopy, colon video capsule, colon CT scan, stool test) and their attributes; refer to Supplemental File 2 to see how these were described to participants. The presentation order for the test modality information was randomized among respondents to reduce order bias.
CRC Screening Knowledge, Attitudes, and Beliefs
After respondents completed the conjoint exercises, they were asked “What other considerations might you have when choosing a colon cancer screening test?” We also asked participants whether they planned to get screened for CRC and we adapted the CRC Knowledge, Perceptions, and Screening Survey to gather information about their self-perceived CRC susceptibility, impact of a CRC diagnosis, and benefits and barriers to screening.12 Respondents were also asked how they would prefer to receive information about CRC screening.
Demographics and Comorbidities
The survey collected self-reported sociodemographic information (age, sex, race/ethnicity, education, marital status, total annual household income, employment, insurance, usual source of care, US state). Participants were also asked about their self-reported health status,13 comorbidities,14 and gastrointestinal symptoms in the past three months.
Sample Size and Statistical Analysis
Informed by conjoint analysis sample size precedents and recommendations from the software provider,15 our goal was to recruit at least 300 individuals. However, to improve explanatory power and increase the number of meaningful responses to the open-ended question, we aimed to recruit 1,000 individuals.
After completing recruitment, we used hierarchical Bayes regression to estimate individual-level importance scores and part-worth utilities for each tested attribute and level, respectively; attributes and levels with higher scores were more highly valued in the decision-making process. We then performed simulations using the individual-level part-worth utilities for test modality and frequency and used marginal standardization to adjust for the earlier described covariates in order to estimate the proportion of individuals who would prefer each US Multi-Society Task Force (MSTF) on CRC-recommended test8: FIT every year; FIT-fecal DNA every three years; colon video capsule every 5 years; CT colonography every 5 years; colonoscopy every 10 years.
We performed statistical analyses using SAS version 9.4 (Cary, NC). A two-tailed p<0.05 was considered statistically significant. Analyses were stratified into two age groups, 40-49 year-old (i.e., soon-to-be or newly eligible for CRC screening) and ≥50 year-old (i.e., have been eligible), as these groups were distinct. Most recruited 45-49 year-old respondents likely had not yet received provider recommendations to undergo CRC screening as the USPSTF’s recommendation for lowering the screening age1 was released in close proximity to survey recruitment in early 2021. The ≥50 year olds, on the other hand, may have already discussed CRC screening with their providers and ultimately declined.
We used descriptive and bivariate statistics (Pearson’s chi-squared test) for respondents’ conjoint analysis-derived preferred CRC screening tests when considering (i) all five US MSTF-recommended tests and (ii) the US MSTF tier 1-recommended tests (annual FIT, colonoscopy every 10 years). We then performed multivariable logistic regression, stratified by age group, to identify factors associated with preferring an annual FIT over colonoscopy every 10 years. To adjust for confounding, the regression models included the covariates described earlier. Results were reported as adjusted odds ratios (aOR) with 95% confidence intervals (CI) that accounted for multiple comparisons using the Bonferroni method. For the open-ended question responses, we used summative content analysis to examine participants’ responses; free texts (word, sentence, and paragraph) were coded and organized into categories and subcategories.
RESULTS
Study Population
Invitations were sent to 7,130 individuals and 5,448 (76.4%) accessed the survey. Among those who accessed the survey, we excluded those who met an ineligibility criterion—n=3,749 (68.8%): previously screened for CRC or unsure (n=3,502, 64.3%); first degree relative with CRC (n=861, 15.8%); history of colon polyps (n=600, 11.0%); has Crohn’s disease or ulcerative colitis (n=168, 3.1%); age <40y (n=94, 1.7%). We also excluded the following people: did not finish survey—n=474 (8.7%); had implausible responses (e.g., straight-line or inconsistent responses16 on the conjoint exercises, impossible answer combinations on multi-select multiple choice questions)—n=134 (2.5%); did not provide consent—n=91 (1.7%). Thus, the final analytic set included 1,000 respondents and Table 2 presents their demographics. The mean ages for those in the 40-49 and ≥50 year-old groups were 44.2 (standard deviation [SD], 2.6) and 60.7 (SD, 8.1) years, respectively.
TABLE 2.
Demographics of the study population.
| Variable | Overall cohort (N=1,000) | 40-49 year old (n=456) | ≥50 year old (n=544) |
|---|---|---|---|
| Sex: | |||
| Male | 487 (48.7%) | 279 (61.2%) | 208 (38.2%) |
| Female | 512 (51.2%) | 177 (38.8%) | 335 (61.6%) |
| Prefer not to say | 1 (0.1%) | 0 (0.0%) | 1 (0.2%) |
| Race/ethnicity: | |||
| Non-Hispanic White | 806 (80.6%) | 352 (77.2%) | 454 (83.5%) |
| Non-Hispanic Black | 64 (6.4%) | 31 (6.8%) | 33 (6.1%) |
| Hispanic | 57 (5.7%) | 34 (7.5%) | 23 (4.2%) |
| Non-Hispanic Asian | 41 (4.1%) | 23 (5.0%) | 18 (3.3%) |
| Other | 32 (3.2%) | 16 (3.5%) | 16 (2.9%) |
| Educational attainment: | |||
| High school degree or less | 281 (28.1%) | 127 (27.9%) | 154 (28.3%) |
| Some college education | 248 (24.8%) | 108 (23.7%) | 140 (25.7%) |
| College degree | 347 (34.7%) | 152 (33.3%) | 195 (35.8%) |
| Graduate degree | 124 (12.4%) | 69 (15.1%) | 55 (10.1%) |
| Marital status: | |||
| Married or living with a partner | 529 (52.9%) | 262 (57.5%) | 267 (49.1%) |
| Not married | 471 (47.1%) | 194 (42.5%) | 277 (50.9%) |
| Total household income, $: | |||
| <50,000 | 517 (51.7%) | 209 (45.8%) | 308 (56.6%) |
| 50,000–100,000 | 298 (29.8%) | 134 (29.4%) | 164 (30.1%) |
| ≥100,001 | 161 (16.1%) | 101 (22.1%) | 60 (11.0%) |
| Prefer not to say | 24 (2.4%) | 12 (2.6%) | 12 (2.2%) |
| Employment status: | |||
| Unemployed, on disability, on leave from work, retired, or homemaker | 471 (47.1%) | 137 (30.0%) | 334 (61.4%) |
| Employed or student | 529 (52.9%) | 319 (70.0%) | 210 (38.6%) |
| Has health insurance | 845 (84.5%) | 369 (80.9%) | 476 (87.5%) |
| Has usual source of care | 800 (80.0%) | 367 (80.5%) | 433 (79.6%) |
| Self-reported health status: | |||
| Excellent | 88 (8.8%) | 40 (8.8%) | 48 (8.8%) |
| Very good | 280 (28.0%) | 136 (29.8%) | 144 (26.5%) |
| Good | 407 (40.7%) | 193 (42.3%) | 214 (39.3%) |
| Fair/Poor | 225 (22.5%) | 87 (19.1%) | 138 (25.4%) |
| Number of medical comorbidities a: | |||
| 0 | 252 (25.2%) | 102 (22.4%) | 150 (27.6%) |
| 1 | 225 (22.5%) | 115 (25.2%) | 110 (20.2%) |
| ≥2 | 523 (52.3%) | 239 (52.4%) | 284 (52.2%) |
| Number of GI comorbidities b: | |||
| 0 | 760 (76.0%) | 359 (78.7%) | 401 (73.7%) |
| 1 | 170 (17.0%) | 62 (13.6%) | 108 (19.9%) |
| ≥2 | 70 (7.0%) | 35 (7.7%) | 35 (6.4%) |
| Number of GI symptoms experienced in past 3 months c: | |||
| 0 | 479 (47.9%) | 194 (42.5%) | 285 (52.4%) |
| 1 | 202 (20.2%) | 96 (21.1%) | 106 (19.5%) |
| ≥2 | 319 (31.9%) | 166 (36.4%) | 153 (28.1%) |
| US region: | |||
| Northeast | 225 (22.5%) | 72 (15.8%) | 153 (28.1%) |
| South | 344 (34.4%) | 188 (41.2%) | 156 (28.7%) |
| Midwest | 207 (20.7%) | 102 (22.4%) | 105 (19.3%) |
| West | 224 (22.4%) | 94 (20.6%) | 130 (23.9%) |
Data are presented as n (% of column). GI, gastrointestinal.
Includes anemia or other blood disease, back pain, cancer, depression, diabetes, heart disease, high blood pressure, kidney disease, lung disease, migraines, osteoarthritis or degenerative arthritis, rheumatoid arthritis, or other medical problems.
Includes celiac disease, cirrhosis, diverticulitis, gallstones, gastroenteritis, gastroesophageal reflux disease, gastroparesis, irritable bowel syndrome, liver disease, pancreatitis, or ulcer or stomach disease.
Includes abdominal pain or discomfort, anal or rectal pain, bloating, bowel incontinence, constipation, diarrhea, dysphagia, heartburn, nausea/vomiting, or regurgitation.
CRC Screening Knowledge, Attitudes, and Beliefs
Table 3 presents individuals’ intentions to undergo screening for CRC; 59.0% and 46.0% of 40-49 and ≥50 year-old respondents, respectively, stated that they plan to be tested. Table 3 also shows participants’ self-perceived CRC susceptibility, impact of CRC diagnosis, and benefits and barriers to CRC screening.
TABLE 3.
Knowledge, attitudes, and beliefs on CRC and CRC screening.
| Variable | Overall cohort (N=1,000) | 40-49 year old (n=456) | ≥50 year old (n=544) |
|---|---|---|---|
| Plans to get screened for CRC | 519 (51.9%) | 269 (59.0%) | 250 (46.0%) |
| Has non-first degree relative or friend diagnosed with CRC | 138 (13.8%) | 71 (15.6%) | 67 (12.3%) |
| Self-perceived CRC susceptibility (1-5 scale; higher=more susceptible) | 2.6 [2.0, 3.0] | 2.6 [2.0, 3.0] | 2.4 [1.8, 3.0] |
| Self-perceived impact of CRC diagnosis (1-5 scale; higher=more severe impact) | 3.2 [2.8, 3.7] | 3.3 [2.9, 3.7] | 3.2 [2.8, 3.6] |
| Self-perceived benefits of CRC screening (1-5 scale; higher=more beneficial) | 4.0 [3.6, 4.4] | 4.0 [3.8, 4.6] | 4.0 [3.6, 4.4] |
| Self-perceived barriers to CRC screening (1-5 scale; higher=more barriers) | 2.7 [2.3, 3.1] | 2.7 [2.3, 3.1] | 2.7 [2.3, 3.1] |
Data are presented as n (%) or median [interquartile range]. CRC, colorectal cancer.
Conjoint Analysis to Assess CRC Screening Test Preferences
The mean importance scores among the 40-49 year-old respondents (n=456) were: test modality—46.3% (SD, 19.9%); reduction in chance of getting CRC—27.1% (SD, 18.7%); test frequency—10.0% (SD, 6.2%); chances of a serious complication—9.4% (SD, 5.1%); bowel prep before the test—4.6% (SD, 2.8%); diet changes before the test—2.6% (SD, 2.4%). For the ≥50 year-old respondents (n=544), the mean importance scores were: test modality—53.7% (SD, 17.4%); reduction in chance of getting CRC—21.7% (SD, 14.4%); chances of a serious complication—9.6% (SD, 4.8%); test frequency—8.2% (SD, 5.3%); bowel prep before the test—4.4% (SD, 2.8%); diet changes before the test—2.3% (SD, 2.2%).
Figure 2 shows results from the conjoint analysis-derived simulations—adjusted for covariates in Tables 2 and 3—determining the proportion of respondents who would prefer each CRC screening test. When considering all five US MSTF-recommended tests, the most preferred test among 40-49 year-old respondents (n=456) was a FIT-fecal DNA every three years (34.6%). Colon video capsule every five years was the second most preferred test (28.2%), followed by colonoscopy every 10 years (13.7%), FIT every year (12.2%), then CT colonography every five years (11.3%). For ≥50 year-old respondents (n=544), most also preferred a FIT-fecal DNA every three years (37.3%), followed by colon video capsule every five years (22.9%), FIT every year (18.7%), colonoscopy every 10 years (13.6%), and CT colonography every 5 years (7.6%). The proportion of preferred tests were significantly different between the 40-49 and ≥50 year-old groups (adjusted p=0.019).
FIGURE 2.

Data from simulations using conjoint analysis data assessing the proportion of respondents who would prefer each CRC screening test (N=1,000). Panel A considers all five US MSTF-recommended CRC screening tests while Panel B considers only the US MSTF tier 1-recommended tests. CRC, colorectal cancer; CT, computed tomography; FIT, fecal immunochemical test; MSTF, Multi-Society Task Force. * = adjusted p<0.05; ** = adjusted p<0.01.
When considering only the US MSTF tier 1 CRC screening tests, 68.9% and 77.4% of 40-49 and ≥50 year-old respondents, respectively, preferred an annual FIT over colonoscopy every 10 years (adjusted p=0.004 when comparing preferences between age groups). Table 4 presents results from the logistic regressions on preferring an annual FIT over colonoscopy every 10 years. In the 40-49 year-old group, individuals with ≥2 medical comorbidities were less likely to prefer a FIT when compared to those without comorbidities. For the ≥50 year-old cohort, individuals that planned to get screened for CRC were less likely to prefer a FIT. In both age groups, the remaining variables were not statistically associated with decision making.
TABLE 4.
Regression analysis on preferring a FIT every year over colonoscopy every 10 years for CRC screening; screening test preferences were determined through simulations from conjoint analysis-derived data.
| Variable | Prefers a FIT every year for CRC screening | |
|---|---|---|
| 40-49 year old (n=456) | ≥50 year old (n=543) | |
| Sex: | ||
| Male | reference | reference |
| Female | 1.24 [0.72, 2.11] | 1.59 [0.90, 2.81] |
| Race/ethnicity: | ||
| Non-Hispanic White | reference | reference |
| Non-Hispanic Black | 0.68 [0.26, 1.80] | 1.00 [0.36, 2.79] |
| Hispanic | 0.80 [0.32, 2.01] | 1.13 [0.31, 4.13] |
| Non-Hispanic Asian | 1.44 [0.41, 5.05] | 0.82 [0.20, 3.35] |
| Other | 1.20 [0.28, 5.17] | 0.85 [0.17, 4.20] |
| Educational attainment: | ||
| High school degree or less | reference | reference |
| Some college education | 1.15 [0.57, 2.33] | 0.85 [0.39, 1.83] |
| College degree | 0.68 [0.35, 1.34] | 0.85 [0.41, 1.78] |
| Graduate degree | 0.74 [0.31, 1.79] | 0.84 [0.32, 2.24] |
| Marital status: | ||
| Married or living with a partner | reference | reference |
| Not married | 0.98 [0.57, 1.70] | 1.29 [0.72, 2.30] |
| Total household income, $: | ||
| <50,000 | reference | Reference |
| 50,000–100,000 | 1.54 [0.80, 2.97] | 0.93 [0.48, 1.79] |
| ≥100,001 | 0.77 [0.35, 1.69] | 0.70 [0.29, 1.71] |
| Prefer not to say | 1.86 [0.27, 12.69] | 1.09 [0.15, 7.69] |
| Employment status: | ||
| Unemployed, on disability, on leave from work, retired, or homemaker | reference | reference |
| Employed or student | 0.99 [0.56, 1.76] | 1.25 [0.69, 2.28] |
| Has health insurance | 1.37 [0.67, 2.77] | 0.63 [0.24, 1.69] |
| Has usual source of care | 0.78 [0.39, 1.55] | 0.93 [0.43, 2.04] |
| Self-reported health status: | ||
| Excellent | reference | reference |
| Very good | 0.90 [0.34, 2.37] | 0.80 [0.28, 2.27] |
| Good | 1.18 [0.45, 3.06] | 0.98 [0.34, 2.82] |
| Fair/Poor | 1.46 [0.50, 4.21] | 0.86 [0.26, 2.80] |
| Number of medical comorbidities a: | ||
| 0 | reference | reference |
| 1 | 0.50 [0.23, 1.07] | 2.19 [0.94, 5.09] |
| ≥2 | 0.37 [0.18, 0.76] | 1.91 [0.92, 3.97] |
| Number of GI comorbidities b: | ||
| 0 | reference | reference |
| 1 | 0.67 [0.33, 1.38] | 1.58 [0.74, 3.37] |
| ≥2 | 0.87 [0.35, 2.22] | 1.41 [0.45, 4.45] |
| Number of GI symptoms experienced in past 3 months c: | ||
| 0 | reference | reference |
| 1 | 1.10 [0.57, 2.11] | 0.73 [0.36, 1.49] |
| ≥2 | 1.10 [0.61, 1.99] | 0.82 [0.40, 1.70] |
| US region: | ||
| Northeast | reference | reference |
| South | 1.24 [0.61, 2.55] | 1.40 [0.67, 2.92] |
| Midwest | 0.99 [0.45, 2.18] | 0.88 [0.41, 1.87] |
| West | 1.19 [0.53, 2.65] | 1.08 [0.50, 2.33] |
| Plans to get screened for CRC | 0.75 [0.42, 1.34] | 0.31 [0.16, 0.58] |
| Has non-first degree relative or friend diagnosed with CRC | 0.94 [0.48, 1.83] | 0.87 [0.40, 1.91] |
| Self-perceived CRC susceptibility (1-5 scale; higher=more susceptible) | 0.74 [0.53, 1.04] | 0.79 [0.55, 1.13] |
| Self-perceived impact of CRC diagnosis (1-5 scale; higher=more severe impact) | 0.97 [0.61, 1.54] | 0.82 [0.53, 1.26] |
| Self-perceived benefits of CRC screening (1-5 scale; higher=more beneficial) | 1.03 [0.66, 1.60] | 0.72 [0.42, 1.24] |
| Self-perceived barriers to CRC screening (1-5 scale; higher=more barriers) | 1.25 [0.83, 1.89] | 1.32 [0.82, 2.14] |
Data are presented as aOR [95% CI]. All the variables in the table were included in the multivariable logistic regression model; sex–prefer not to say (n=1) was not included in the regression model as it perfectly predicted the outcome. aOR, adjusted odds ratio; CI, confidence interval; CRC, colorectal cancer; GI, gastrointestinal.
Includes anemia or other blood disease, back pain, cancer, depression, diabetes, heart disease, high blood pressure, kidney disease, lung disease, migraines, osteoarthritis or degenerative arthritis, rheumatoid arthritis, or other medical problems.
Includes celiac disease, cirrhosis, diverticulitis, gallstones, gastroenteritis, gastroesophageal reflux disease, gastroparesis, irritable bowel syndrome, liver disease, pancreatitis, or ulcer or stomach disease.
Includes abdominal pain or discomfort, anal or rectal pain, bloating, bowel incontinence, constipation, diarrhea, dysphagia, heartburn, nausea/vomiting, or regurgitation.
Subgroup Analyses
Supplemental File 3 shows the preferred screening tests among the cohort when stratified by sex, race/ethnicity, and total annual household income. As the American Cancer Society recommended lowering the CRC screening age to 45 years in 2018,17 some 45-49 year olds may have already discussed CRC screening with their physician. Thus, Supplemental File 3 also shows results when comparing the 40-44 and 45-49 year-old age groups. Finally, it also presents the preferred tests for people who plan and do not plan to undergo screening.
Other Considerations When Selecting a CRC Screening Test
Overall, 442 analyzable open-ended responses were provided (Supplemental Table 1). The most cited factor was convenience and ease of use of the test (e.g., travel time, disruption of daily activities, time preparing for the test; n=186, 42.1%). Other common considerations included potential complications (n=105, 23.8%), invasiveness/level of embarrassment (n=74, 16.7%), and financial considerations (out-of-pocket costs, insurance; n=68, 15.4%).
Respondents’ Preferred Way to Receive CRC Screening Information
Among the 1,000 respondents, most (n=647, 64.7%) preferred to receive information about CRC screening through a conversation with a healthcare provider. This was followed by receiving such information through provider-recommended online websites (n=401, 40.1%) and printed information (n=332, 33.2%). We also noted that 295 (29.5%) individuals would prefer to receive such information from websites that they find on their own. Finally, 119 (11.9%) respondents did not want to learn more about screening.
DISCUSSION
Using conjoint analysis, we assessed the tradeoffs that people made when selecting a CRC screening test. Among both the 40-49 (i.e., soon-to-be and newly eligible for CRC screening) and ≥50 year-old groups, test modality was the most important factor in their decision making followed by effectiveness at reducing CRC risk. While direct comparisons with prior stated preferences studies are difficult given the varying designs and framing, most prior studies found that efficacy was the most salient factor when choosing a test.4, 5
When considering all five US MSTF-recommended CRC screening tests, the most preferred test in both the 40-49 and ≥50 year-old groups was FIT-fecal DNA every three years. The next most preferred test for both age groups was colon video capsule every five years, even when informing participants that it required a bowel prep, dietary changes, and additional laxatives and promotility agents after ingesting the capsule. It is important to note, though, that colon video capsule is a tier 3 option according to the US MSTF,8 and the USPSTF does not recommend it due to limited available evidence.1 Nonetheless, as many individuals preferred the colon video capsule, combined with data showing comparable performance to CT colonography,18 further research is needed to understand why some individuals prefer colon video capsule over more established options.
When considering only the US MSTF tier 1 tests,8 both age groups preferred an annual FIT over a colonoscopy every 10 years; 68.9% and 77.4% of 40-49 and ≥50 year-old respondents, respectively, would choose to do a FIT each year. This finding is discordant with current CRC screening utilization in the US where colonoscopy is the most commonly performed test,19 and this may partially explain our suboptimal screening rates.3 Our findings suggest that screening programs should strongly consider a sequential-based strategy where FIT is offered first, and if declined then colonoscopy. This is supported by data from an organized CRC screening program at Kaiser Permanente in Northern California that in 2007 implemented direct-to-patient annual FIT outreach with colonoscopy available by request.20 The percentage of patients up-to-date with screening increased from 38.9% in 2000 to 82.7% in 2015.20 Notably, the proportion of those who preferred FIT over colonoscopy in our study was similar to their distribution of performed tests in 2015: FIT—57.3%; colonoscopy—40.6%; other—2.1%.20 Also, as wait times for colonoscopy are increasing,21 having millions of newly eligible 45-49 year-old patients undergo screening colonoscopy may strain the system and delay access to this finite resource for those with urgent needs. A sequential approach (i.e., offer FIT first, if declines offer colonoscopy) could help accommodate this new increased demand while prioritizing access to colonoscopies for those with surveillance or diagnostic indications.
We also noted that sociodemographics, clinical characteristics, and CRC screening knowledge, attitudes, and beliefs were not predictive of selecting FIT or colonoscopy. This demonstrates the individualized nature of decision making on CRC screening tests. Moreover, as most individuals preferred FIT, it again emphasizes the importance of sequential or choice-based strategies for CRC screening. Further supporting these approaches are data from Pilonis et al. showing that screening uptake was significantly higher with both the sequential (offer colonoscopy first, if declines offer FIT; 25.8%) and choice (offer colonoscopy or FIT; 26.5%) strategies when compared to the colonoscopy only group (17.5%; p<0.001).22 These data also call for the need for modern decision aids to support patients and their clinicians in making shared decisions about CRC screening, particularly at organizations that employ a choice strategy. Of note, our research group is currently developing an online, unbranded, conjoint analysis-based decision aid called Protect Your Colon™ that will be freely available.
Our study has several strengths. First, we recruited a diverse cohort of 1,000 Americans across the country to complete the conjoint analysis; most prior studies were performed outside the US or had small sample sizes.4–7 Second, we separately analyzed screening test preferences for the 40-49 and ≥50 year-old groups, which can inform leadership at CRC screening programs on how and which tests to offer their newly screening eligible and unscreened cohorts, respectively. Third, prior to completing the conjoint exercises, respondents were shown information about each test modality and informed that a positive stool test, CT colonography, or colon video capsule would require a follow-up colonoscopy. This facilitated respondents’ understanding of the pertinent factors to consider when selecting a test, allowing them to make informed decisions. Finally, our study modeled newer screening modalities such as FIT-fecal DNA, colon video capsule, and CT colonography; prior studies performed decades ago focused primarily on endoscopy and fecal occult blood test/FIT.4, 5 This allowed us to assess and understand how people approach all the testing options that are available in 2021.
There were limitations to our study. First, we conducted our study only in the US; our findings may not be generalizable to other countries. Second, we employed an online survey and our results may not generalize to elderly individuals or those who lack basic computing skills. However, in 2021, 96% and 75% of 50-64 and ≥65 year-old individuals, respectively, used the internet.23 Third, we did not assess whether participants previously discussed CRC screening with a provider; comparing test preferences between those who have and have not had such discussions is worthy of further study. Fourth, respondents were not told that identification of adenomatous polyps during a screening colonoscopy would require repeating the procedure sooner than 10 years; it is unclear whether that would lead to more or fewer people favoring the non-invasive tests and that must be formally tested. Fifth, while we recruited 1,000 individuals across the US, our findings may not generalize to groups not as well represented in our study sample; for example, only 19.4% of respondents were racial/ethnic minorities. Sixth, although the survey completion incentive was modest, all respondents were members of paid survey panels which may have introduced selection bias. Seventh, we limited the conjoint analysis to six attributes and did not include some endorsed options such as biennial FIT in the survey.24 However, as conjoint surveys can become unwieldy with too many attributes and levels, we focused on six core attributes identified during our prior patient focus groups11 and opted to only model tests recommended by the US MSTF.8 Finally, our survey was conducted during the COVID-19 pandemic from April 2021 to June 2021; hesitancy to seek care during the pandemic25 may have led more people to prefer at-home stool tests over more invasive options that require visiting healthcare facilities.
In conclusion, when respondents were shown competing CRC screening test options, test modality was the most important factor in their decision making. Our findings suggest—when considering all five US MSTF-recommended tests—that FIT-fecal DNA test may be the most preferred test. When considering only US MSTF tier 1 tests, most people may prefer an annual FIT over a colonoscopy every 10 years. In light of the recently lowered screening age to 45 years,1 further research examining screening test preferences among broader populations is warranted to inform and enhance the effectiveness of CRC screening programs.
Supplementary Material
WHAT YOU NEED TO KNOW.
BACKGROUND:
We used conjoint analysis to update our understanding on people’s colorectal cancer (CRC) screening test preferences in the context of recent guidelines lowering the screening age to 45y.
FINDINGS:
Among 1,000 unscreened participants nationwide, the most preferred test was a fecal immunochemical test (FIT)-fecal DNA every three years: 40-49yo—34.6%; ≥50yo—37.3%. When considering only tier 1 tests, most 40-49 (68.9%) and ≥50 year olds (77.4%) preferred an annual FIT over a colonoscopy every 10 years.
IMPLICATIONS FOR PATIENT CARE:
Our findings suggest that most people prefer non-invasive stool tests for their CRC screening. Further research examining test preferences among broader populations is warranted to inform and enhance screening programs.
GRANT SUPPORT:
This study was supported by a National Cancer Institute K08 CA245033 grant. Dr. Almario was supported by a National Institutes of Health Loan Repayment Program Award (L30 CA265419).
ABBREVIATIONS:
- ACG
American College of Gastroenterology
- aOR
adjusted odds ratio
- CI
confidence interval
- CRC
colorectal cancer
- CT
computed tomography
- FIT
fecal immunochemical test
- GI
gastrointestinal
- MSTF
Multi-Society Task Force
- SD
standard deviation
- USPSTF
US Preventive Services Task Force
Footnotes
Publisher's Disclaimer: This is a PDF file of an unedited manuscript that has been accepted for publication. As a service to our customers we are providing this early version of the manuscript. The manuscript will undergo copyediting, typesetting, and review of the resulting proof before it is published in its final form. Please note that during the production process errors may be discovered which could affect the content, and all legal disclaimers that apply to the journal pertain.
DISCLOSURES: Dr. Spiegel served on an advisory panel with Exact Sciences. The remaining authors have no relevant disclosures.
WRITING ASSISTANCE: No medical writing support was received.
REFERENCES
- 1.Davidson KW, Barry MJ, Mangione CM, et al. Screening for colorectal cancer: US Preventive Services Task Force Recommendation Statement. JAMA. 2021;325(19):1965–77. [DOI] [PubMed] [Google Scholar]
- 2.Piscitello A, Edwards DK 5th. Estimating the screening-eligible population size, ages 45-74, at average risk to develop colorectal cancer in the United States. Cancer Prev Res (Phila). 2020;13(5):443–8. [DOI] [PubMed] [Google Scholar]
- 3.American Cancer Society. Colorectal cancer facts & figures 2020-2022. Atlanta: American Cancer Society; 2020. [Google Scholar]
- 4.Mansfield C, Tangka FK, Ekwueme DU, et al. Stated preference for cancer screening: a systematic review of the literature, 1990-2013. Prev Chronic Dis. 2016;13:E27. [DOI] [PMC free article] [PubMed] [Google Scholar]
- 5.Wortley S, Wong G, Kieu A, et al. Assessing stated preferences for colorectal cancer screening: a critical systematic review of discrete choice experiments. Patient. 2014;7(3):271–82. [DOI] [PubMed] [Google Scholar]
- 6.de Bekker-Grob EW, Donkers B, Veldwijk J, et al. What factors influence non-participation most in colorectal cancer screening? A discrete choice experiment. Patient. 2021;14(2):269–81. [DOI] [PMC free article] [PubMed] [Google Scholar]
- 7.Mansfield C, Ekwueme DU, Tangka FKL, et al. Colorectal cancer screening: preferences, past behavior, and future intentions. Patient. 2018;11(6):599–611. [DOI] [PMC free article] [PubMed] [Google Scholar]
- 8.Rex DK, Boland CR, Dominitz JA, et al. Colorectal cancer screening: recommendations for physicians and patients from the U.S. Multi-Society Task Force on Colorectal Cancer. Am J Gastroenterol. 2017;112(7):1016–30. [DOI] [PubMed] [Google Scholar]
- 9.Almario CV, Keller MS, Chen M, et al. Optimizing selection of biologics in inflammatory bowel disease: development of an online patient decision aid using conjoint analysis. Am J Gastroenterol. 2018;113(1):58–71. [DOI] [PubMed] [Google Scholar]
- 10.Bridges JF, Hauber AB, Marshall D, et al. Conjoint analysis applications in health--a checklist: a report of the ISPOR Good Research Practices for Conjoint Analysis Task Force. Value Health. 2011;14(4):403–13. [DOI] [PubMed] [Google Scholar]
- 11.Makaroff KE, Khalil C, Spiegel B, et al. Fr059 Insights into patients’ knowledge, attitudes, beliefs, and main drivers of decision making when selecting among different colorectal cancer (CRC) screening options: thematic analysis of patient focus groups. Gastroenterology. 2021;160(6):S-201-S-2. [Google Scholar]
- 12.Green PM, Kelly BA. Colorectal cancer knowledge, perceptions, and behaviors in African Americans. Cancer Nurs. 2004;27(3):206–15. [DOI] [PubMed] [Google Scholar]
- 13.Hoffman RM, Koyama T, Albertsen PC, et al. Self-reported health status predicts other-cause mortality in men with localized prostate cancer: results from the Prostate Cancer Outcomes Study. J Gen Intern Med. 2015;30(7):924–34. [DOI] [PMC free article] [PubMed] [Google Scholar]
- 14.Sangha O, Stucki G, Liang MH, et al. The Self-Administered Comorbidity Questionnaire: a new method to assess comorbidity for clinical and health services research. Arthritis Rheumatol. 2003;49(2):156–63. [DOI] [PubMed] [Google Scholar]
- 15.Orme BK. Getting started with conjoint analysis: strategies for product design and pricing research. Research Publishers; 2010. [Google Scholar]
- 16.Orme B Consistency cutoffs to identify “bad” respondents in CBC, ACBC, and MaxDiff. Provo, Utah: Sawtooth Software, Inc.; 2019. [Google Scholar]
- 17.Wolf AMD, Fontham ETH, Church TR, et al. Colorectal cancer screening for average-risk adults: 2018 guideline update from the American Cancer Society. CA Cancer J Clin. 2018;68(4):250–81. [DOI] [PubMed] [Google Scholar]
- 18.Cash BD, Fleisher MR, Fern S, et al. Multicentre, prospective, randomised study comparing the diagnostic yield of colon capsule endoscopy versus CT colonography in a screening population (the TOPAZ study). Gut. 2021;70:2115–2122. [DOI] [PubMed] [Google Scholar]
- 19.Seeff LC, Richards TB, Shapiro JA, et al. How many endoscopies are performed for colorectal cancer screening? Results from CDC’s survey of endoscopic capacity. Gastroenterology. 2004;127(6):1670–7. [DOI] [PubMed] [Google Scholar]
- 20.Levin TR, Corley DA, Jensen CD, et al. Effects of organized colorectal cancer screening on cancer incidence and mortality in a large community-based population. Gastroenterology. 2018;155(5):1383–91.e5. [DOI] [PMC free article] [PubMed] [Google Scholar]
- 21.Hubers J, Sonnenberg A, Gopal D, et al. Trends in wait time for colorectal cancer screening and diagnosis 2013-2016. Clin Transl Gastroenterol. 2020;11(1):e00113. [DOI] [PMC free article] [PubMed] [Google Scholar]
- 22.Pilonis ND, Bugajski M, Wieszczy P, et al. Participation in competing strategies for colorectal cancer screening: a randomized health services study (PICCOLINO Study). Gastroenterology. 2021;160(4):1097–105. [DOI] [PubMed] [Google Scholar]
- 23.Pew Research Center. Internet/broadband fact sheet. 2021. [cited 2021 September 8]; Available from: https://www.pewresearch.org/internet/fact-sheet/internet-broadband/.
- 24.Qaseem A, Crandall CJ, Mustafa RA, et al. Screening for colorectal cancer in asymptomatic average-risk adults: a guidance statement from the American College of Physicians. Ann Intern Med. 2019;171(9):643–54. [DOI] [PMC free article] [PubMed] [Google Scholar]
- 25.Czeisler M, Marynak K, Clarke KEN, et al. Delay or avoidance of medical care because of COVID-19-related concerns - United States, June 2020. MMWR Morb Mortal Wkly Rep. 2020;69(36):1250–7. [DOI] [PMC free article] [PubMed] [Google Scholar]
Associated Data
This section collects any data citations, data availability statements, or supplementary materials included in this article.