

Abstract
Objective
To determine if plasma tau phosphorylated at threonine 181 (p‐tau181) distinguishes pathology‐confirmed Alzheimer's disease (AD) from normal cognition (NC) adults, to test if p‐tau181 predicts cognitive and functional decline, and to validate findings in an external cohort.
Methods
Thirty‐one neuropathology‐confirmed AD cases, participants with clinical diagnoses of mild cognitive impairment (MCI, N = 91) or AD dementia (N = 64), and NC (N = 241) had plasma collected at study entry. The clinical diagnosis groups had annual cognitive (Mini‐Mental State Examination, MMSE) and functional (Clinical Dementia Rating Scale, CDR) measures. NC (N = 70), MCI (N = 75), and AD dementia (N = 50) cases from the Alzheimer's Disease Neuroimaging Initiative (ADNI) were used as a validation cohort. Plasma p‐tau181 was measured using the Quanterix SiMoA HD‐X platform.
Results
Plasma p‐tau181 differentiated pathology‐confirmed AD from NC with negative amyloid PET scans with an AUC of 0.93. A cut point of 3.44 pg/mL (maximum Youden Index) had a sensitivity of 0.77, specificity of 0.96. p‐Tau181 values above the cut point were associated with the faster rate of decline in MMSE in AD dementia and MCI and a shorter time to a clinically significant functional decline in all groups. In a subset of MCI cases from ADNI, p‐tau181 values above the cut point associated with faster rate of decline in MMSE, and a shorter time to a clinically significant functional decline and conversion to dementia.
Interpretation
Plasma p‐tau181 differentiates AD pathology cases from NC with high accuracy. Higher levels of plasma p‐tau181 are associated with faster cognitive and functional decline.
Introduction
Alzheimer's disease (AD) is the most common neurodegenerative disease and the most common cause of dementia affecting over 50 million people worldwide. 1 Postmortem examination of the brains from people with AD during life, show significant cortical and medial temporal lobe atrophy; amyloid‐β (Aβ) plaques and neurofibrillary tangles (NFT) of hyperphosphorylated tau confirm the neuropathological diagnosis. 2
Biofluid and neuroimaging biomarkers of axonal degeneration (cerebrospinal fluid [CSF] or plasma total tau and neurofilament light chain [NFL]), 3 , 4 , 5 , 6 Aβ‐containing plaques (CSF or plasma Aβ and amyloid positron emission tomography [PET] imaging), 7 , 8 and NFT pathology (CSF or plasma phosphorylated tau and tau PET imaging) 8 , 9 are important tools allowing for detection of AD‐related neuropathological and neurodegenerative change during life and for prediction of outcomes. Indeed, CSF measurements of total and phosphorylated‐tau and the ratio of Aβ42/Aβ40 are validated biomarkers of AD pathology that are useful in clinical practice and research applications. 10 , 11 The recent development of plasma measures of p‐tau181 species is a significant advance toward an easily accessible biomarker with minimal patient burden.
Plasma tau phosphorylated at threonine 181, 217, or 231 can discriminate clinically diagnosed AD dementia from both other neurodegenerative diseases and cognitively normal individuals. 12 , 13 , 14 , 15 , 16 Additionally, levels of plasma p‐tau181 associated with AD disease severity, predict brain amyloid and tau pathology captured by PET imaging, and predict AD pathology on autopsy. 17 , 18 In cognitively normal and MCI individuals, higher plasma p‐tau181 is associated with progression to dementia. 15 Furthermore, plasma p‐tau181 is also higher in symptomatic and presymptomatic familial AD carriers of presenilin 1/2 (PSEN1/2) or amyloid precursor protein (APP) variants, up to 16 years before symptom onset. 19
We studied 31 “gold standard” pathology‐confirmed AD cases, and 396 participants with normal cognition (NC) or a clinical diagnosis of MCI or AD dementia who were enrolled in prospective cohort studies at the University of Pennsylvania (UPenn) and were followed for up to 15 years. The ability of p‐tau181 to discriminate NC from pathologically confirmed AD, and clinical diagnoses of AD dementia, MCI, and other non‐AD forms of neurodegeneration were assessed. An optimal cut point value was determined and the association with rate of cognitive decline and time to functional decline was assessed. The diagnostic and prognostic performance of this cut point was then evaluated in an independent replication sample of AD, MCI, and NC cases from the multicenter, longitudinal Alzheimer's Disease Neuroimaging Initiative (ADNI) cohort. Our hypotheses were that p‐tau181 would discriminate NC from pathologically confirmed AD and clinical AD dementia, and that higher p‐tau181 would predict a faster rate of cognitive and functional decline.
Methods
Discovery cohort participants
Patients were enrolled at UPenn. Clinical disease categorization was assigned according to published clinical diagnostic criteria for AD, Parkinson's disease (PD), dementia with Lewy bodies (DLB), mild cognitive impairment (MCI), behavioral variant‐frontotemporal dementia (bvFTD), primary progressive aphasia (PPA), progressive supranuclear palsy (PSP), corticobasal syndrome (CBS), and amyotrophic lateral sclerosis (ALS), as previously reported. 20
AD dementia, MCI, and NC participants enrolled in the UPenn ADRC clinical cohort with a plasma sample available were included in the analysis. Other neurodegenerative disease groups were selected from available plasma samples for exploratory analyses. Where multiple longitudinal samples were available, the earliest available plasma sample was used. Neuropathological cases in the UPenn Center for Neurodegenerative Disease Research (CNDR) brain bank 20 with a primary neuropathological diagnosis of AD (Path+AD) were included if a plasma sample was available within 3 years of death. Cases had an Alzheimer's Disease Neuropathological Change (ADNC) 2 of high (N = 23), intermediate (N = 6), and low (N = 2). Low ADNC cases were included in the analysis to account for the range of AD pathology.
Standard protocol and informed consent
This study was approved by the UPenn Institutional Review Board. Informed consent was obtained at study enrollment, and at time of death by the next of kin for autopsy studies.
Assessments
Clinical assessments were performed by trained research staff. At study entry and at each subsequent visit, clinical information was obtained and the Mini‐Mental State Examination (MMSE) 21 and Clinical Dementia Rating (CDR) Scale were administered at least at yearly intervals after plasma collection. A change in the CDR sum of boxes (CDR‐SB) score by 1.5 points or greater was considered a clinically important difference according to consensus recommendation. 22 18F‐Florbetapir or 18F‐Florbetaben amyloid PET brain scans were performed for a subset of cases and clinical interpretations of negative (PET−) or positive (PET+) were assigned by experienced readers (IMN and DAW).
Replication cohort
Participants in the ADNI were used as a replication cohort. Plasma samples from individuals with clinical diagnoses of AD (N = 50), MCI (N = 70, 35 with positive and 35 with negative amyloid PET scans), and NC (N = 70, 35 with positive and 35 with negative amyloid PET scans) were obtained from the ADNI database. The full protocol details and current enrollment statistics can be found on the ADNI website (adni.loni.usc.edu). A subset of cases from the ADNI cohort were randomly selected if a plasma sample was available at enrollment. At study entry, and at each subsequent visit, clinical information was obtained and the MMSE and CDR Scale were administered at least at yearly intervals after plasma collection. A cognitive categorization of normal, MCI, or dementia was determined by the site investigator for ADRC cases or adjudicated by the clinical core of ADNI. Plasma p‐tau181 was analyzed in the same manner as described below, in the same laboratory, although with a different lot of reagents. Data used in the preparation of this article were obtained from the ADNI database (adni.loni.usc.edu). The ADNI was launched in 2004 as a public‐private partnership, led by principal investigator Michael W. Weiner, MD. The primary goal of ADNI has been to test whether serial magnetic resonance imaging (MRI), positron emission tomography (PET), other biological markers, and clinical and neuropsychological assessment can be combined to measure the progression of MCI and early AD.
Sample analysis
Whole blood samples were collected in EDTA‐tubes, spun‐down, and stored at −80°C. 20 The SiMoA® p‐tau181 V2 Advantage Kit (Quanterix # 103714) is a fully automated two‐step sandwich immunoassay, based on Karikari et al., 16 for human p‐tau181 measurement in plasma with the SiMoA HD‐X analyzer system. In the first step, sample is drawn from the 96‐well plate by the instrument pipettor, and sample, anti‐p‐tau181 (AT270) coated paramagnetic capture beads, and biotinylated detector antibodies are combined in a reaction cuvette and incubated. p‐Tau181 molecules present in the sample are captured by the anti‐p‐tau‐181 coated capture beads and labeled with biotinylated detector (Tau12) antibody. Following the incubation, capture beads are collected with a magnet, and washed. After washing, a conjugate of streptavidin‐ß‐galactosidase (SβG) is mixed with the capture beads for the second assay step, during which SβG binds to the biotinylated detector antibodies, resulting in enzyme labeling of captured p‐tau181. Following a second wash, the capture beads are resuspended in a resorufin β‐d‐galactopyranoside (RGP) substrate solution. Digital processing occurs when beads are transferred to the SiMoA array disc. Individual capture beads are then sealed within microwells in the array. If p‐tau181 has been captured and labeled, the β‐galactosidase hydrolyzes the RGP substrate into a fluorescent product that provides the signal for measurement. The concentration of p‐tau181 in unknown samples is interpolated from a standard curve obtained by four‐parameter logistical regression fitting. Total time to first result is 60 min. Samples and two quality control (QC) pooled sample sets were run in duplicate; the result is the mean of the measurements. For a total of 10 analytical runs, performed on June 2021, the percent coefficient of variation (%CV) for the two included plasma QC pools, with mean ptau‐181 concentration values of 3.3 and 2.3 pg/mL, was 12.0% and 13.1%. In the ADNI plus the UPenn replication samples, a total of seven analytical runs were performed in April 2022 with QC pool results of 3.4 pg/mL (5.5% CV) and 2.4 pg/mL (6.2% CV).
NfL protein was analyzed in plasma samples on the SiMoA platform as previously reported. 23 Cerebrospinal fluid (CSF) p‐tau181 was measured as previously reported 24 , 25 using Innogenetics (INNOBIA AlzBio3) reagent on the xMAP‐Luminex platform.
Statistical analysis
Analyses were conducted in R (http://www.r‐project.org), Prism 9 (http://www.graphpad.com/scientific‐software/prism), and Stata (https://www.stata.com). Statistical tests were two‐sided, and alpha was set at 0.05. All data R‐scripts will be made available upon request. Multiple comparison was accounted for using Dunn's test. Wilcoxon rank‐sum or chi‐squared tests were used to assess differences between clinical variables and p‐tau181 levels. The ability of plasma p‐tau181 to discriminate diagnostic groups was assessed using receiver operating characteristic (ROC) curves, generating an area under the ROC curve (AUC). Cut points of p‐tau181 level were determined using the R‐package cutpointr. 26 At maximum sensitivity or specificity cut points, a minimum allowable sensitivity or specificity was set at 0.70. 27 Linear mixed‐effects models 28 were used to test for associations between a binary p‐tau181 cut point at the maximum Youden Index and MMSE score over time (in years), with covariates of age, sex, and baseline MMSE score. A random intercept was included in each mixed‐effects model to account for correlations among repeated measures. Cox proportional hazards models were used to assess the relationship between a binary p‐tau181 cut point at the maximum Youden Index and time to a clinically significant change in the CDR‐SB. Models were also tested with covariates of age, sex, and baseline CDR‐SB. The proportional hazards assumption was assessed using the Schoenfield residuals global test. In the ADNI replication cohort, we evaluated the association between p‐tau181 cut point and MMSE over time, and time to a clinically significant decline in CDR‐SB. We additionally evaluated the association between p‐tau181 cut point and time to a diagnosis of dementia in the MCI cases from the ADNI cohort using a Cox‐proportional hazards model. To assess relationships between biomarkers, Spearman correlation coefficients were calculated. Lastly, linear‐mixed effects models were used to determine changes in p‐tau181 over time across diagnosis groups and within diagnosis group by amyloid PET status.
Role of the funding source
The funding source did not have any role in the study design, collection, analysis, interpretation of the data, writing the report, or the decision to submit for publication.
Results
Patient cohorts
The clinical cohort consisted of 396 participants enrolled between September 2002 and February 2020. Twenty‐nine NC, 11 MCI, and 16 AD dementia cases also had a lumbar puncture performed within 1 year of plasma collection. Pathology cohort autopsies were completed between January 2016 and July 2020. The average interval from plasma collection to death was 0.98 years (SD 0.84). Demographic summary, amyloid PET status, and baseline characteristics of the clinical and pathology cohorts are shown in Table 1. Cases of clinically diagnosed PD, DLB, ALS, bvFTD, PPA, PSP, and CBS participants were also enrolled, and demographic summaries and baseline characteristics are described in Table 2.
Table 1.
Cohort description at the time of plasma sampling. All values are represented as mean (standard deviation), unless otherwise specified.
| Pathology | Clinical | |||
|---|---|---|---|---|
| Alzheimer's disease | Normal cognition | Mild cognitive impairment | Alzheimer's disease | |
| N | 31 | 241 | 91 | 64 |
| Age, y | 75 (12.5) | 70 (8.3) | 71 (7.9) | 68 (9.8) |
| Sex, N (%) | ||||
| Male | 17 (55) | 87 (36) | 53 (58) | 31 (48) |
| Female | 14 (45) | 254 (64) | 38 (42) | 33 (52) |
| Education, y | 16 (3.2) | 16 (2.6) | 16 (2.8) | 16 (2.7) |
| Race, N (%) | ||||
| Asian | 0 | 2 (1) | 0 | 3 (5) |
| Black | 2 (7) | 63 (26) | 13 (14) | 5 (8) |
| White | 28 (90) | 169 (70) | 78 (86) | 54 (84) |
| >One | 1 (3) | 7 (3) | 0 | 2 (3) |
| Disease duration, y | 6.7 (4.6) | NA | 3.2 (2.1) | 4.0 (2.5) |
| Amyloid PET, N (%) | ||||
| Positive | NA | 33 (14) | 36 (40) | 20 (31) |
| Negative | 96 (40) | 23 (25) | 1 (2) | |
| Missing | 112 (46) | 32 (35) | 43 (67) | |
| MMSE at baseline | NA | 29 (1.0) | 26 (2.6) | 23 (3.7) |
| CDR‐SB at baseline | NA | 0 (0.1) | 1.7 (1.2) | 4.4 (2.1) |
Table 2.
Neurodegenerative disease cohort description at the time of plasma sampling. All values are represented as mean (standard deviation) at the time of plasma sampling, unless otherwise specified.
| PD | DLB | ALS | bvFTD/PPA | PSP/CBS | |
|---|---|---|---|---|---|
| N | 28 | 22 | 11 | 45 | 23 |
| Age, y | 67 (6.7) | 66 (6.7) | 65 (15) | 63 (7.5) | 66 (8.1) |
| Sex N (%) | |||||
| Male | 13 (46) | 19 (86) | 8 (73) | 29 (64) | 10 (43) |
| Female | 15 (54) | 3 (14) | 3 (27) | 16 (36) | 13 (57) |
| Education, y | 16 (2.5) | 15 (2.2) | 14 (2.5) | 16 (2.9) | 15 (2.7) |
| Race, N (%) | |||||
| Asian | 1 (4) | 0 | 0 | 3 (7) | 0 |
| Black | 3 (11) | 0 | 1 (9) | 0 | 1 (4) |
| White | 24 (86) | 22 (100) | 10 (91) | 40 (89) | 22 (96) |
| >one | 0 | 0 | 0 | 0 1 | 0 |
| Disease Duration, y | 5.9 (3.5) | 2.7 (1.6) | 3.9 (3.4) | 3.9 (3.2) | 2.8 (1.7) |
N = 1 Unknown or not reported.
Among the clinical cohort, 111 NC, 46 MCI, and 32 AD dementia participants were administered the MMSE yearly for up to 15 years with a mean follow‐up of 2.74 (SD 2.30). Additionally, 226 NC, 86 MCI, and 54 AD dementia participants were administered the CDR or MMSE yearly for up to 15 years.
Plasma p‐tau181 discriminates NC amyloid PET‐negative participants from pathology confirmed AD, clinically diagnosed AD, and other neurodegenerative disease groups
p‐Tau181 was measured in plasma from the clinical and pathology cohorts. p‐Tau181 level was higher in the pathology confirmed AD (Path+AD, N = 31) group compared to NC with negative amyloid PET scans (NC/PET‐, N = 96) group (U = 218, p < 0.0001, Fig. 1A). Analysis of ROC curves was used to determine the ability of plasma p‐tau181 to discriminate Path+AD from NC/PET− participants (AUC = 0.93, 95%CI = 0.87–0.98, p < 0.0001, Fig. 1B).
Figure 1.

Plasma p‐tau181 level as a binary classifier of disease status. Panels on the left (A, C, E) show the distribution of plasma p‐tau181 values among disease group or cognitively normal individuals. Black bars are inserted to show median and interquartile range. Panels on the right (B, D, F) show receiver operator characteristics (ROC) curves showing the area under the curve (AUC) of each disease group compared to cognitively normal individuals without evidence of amyloid deposition on PET imaging. *p < 0.05, **p < 0.01, ***p < 0.001, ****p < 0.0001. ns, non‐significant; PET, Amyloid positron emission tomography; MCI, Mild cognitive impairment; bvFTD, behavioral variant frontotemporal dementia; PPA, primary progressive aphasia; PD, cognitively normal Parkinson's disease; PSP, progressive supranuclear palsy; CBS, corticobasal syndrome; DLB, dementia with Lewy bodies; ALS, amyotrophic lateral sclerosis.
Among clinically defined cases, p‐tau181 level differed across the NC/PET+, NC/PET−, MCI/PET+, MCI/PET−, and clinically diagnosed AD dementia groups (H = 75.12, p < 0.0001). Post hoc Dunn's test comparing each group to NC/PET− showed higher p‐tau181 in MCI/PET− (p = 0.02), MCI/PET+ (p < 0.0001), and clinically diagnosed AD dementia (p < 0.0001), but not NC/PET+ (Fig. 1C). Analysis of ROC curves was used to determine the ability of plasma p‐tau181 to discriminate NC/PET− from NC/PET+ (AUC = 0.66, 95%CI = 0.56–0.77, p = 0.01), MCI/PET− (AUC = 0.71, 95%CI = 0.58–0.83, p = 0.002), MCI/PET+ (AUC = 0.81, 95%CI = 0.73–0.90, p < 0.0001), and clinically diagnosed AD dementia (AUC = 0.84, 95%CI = 0.77–0.92, p < 0.0001) participants (Fig. 1D). The time from sample collection to sample analysis among the clinical cohort did not affect p‐tau181 level (p < 0.05).
p‐Tau181 levels also differed across the non‐AD neurodegenerative disease groups (H(5) = 30.72, p < 0.0001). Post hoc Dunn's test comparing each group to NC/PET− showed higher p‐tau181 in PSP/CBS (p = 0.01), DLB (p = 0.001), and ALS (p = 0.001), but not bvFTD/PPA or PD (Fig. 1E). Analysis of the ROC curves was used to determine the ability of plasma p‐tau181 to discriminate NC/PET− from bvFTD (AUC = 0.54, 95%CI = 0.43–0.64, p = 0.45), PD (AUC = 0.66, 95%CI = 0.55–0.77, p = 0.01), PSP/CBS (AUC = 0.72, 95%CI = 0.59–0.85, p < 0.001), DLB (AUC = 0.75, 95%CI = 0.62–0.88, p = 0.0003), and ALS (AUC = 0.82, 95%CI = 0.68–0.96, p = 0.0005) groups (Fig. 1F).
Defining cut points in plasma p‐tau181 based on different criteria
We next sought to define a range of p‐tau181 cut point values by maximizing a criterion including sensitivity, specificity, accuracy, Youden Index, or equal sensitivity and specificity. Cut points using these criteria are shown in Figure 2A. The sensitivity and specificity at all levels of p‐tau181 are plotted in Figure 2B. The density plot in Figure 2C shows the distribution of cases in the NC/PET− and Path+AD groups.
Figure 2.

Performance characteristics for cut points of p‐tau181 as a classifier of Alzheimer's disease versus cognitively normal. (A) Cut points of p‐tau181 (pg/mL) and performance characteristics are shown based on a specified criterion. Youden Index = 1‐(sensitivity+specificity). * = Minimum sensitivity set at 0.70. (B) Sensitivity (red) and specificity (blue) are plotted for all cut points. The black bar represents the cut point at the maximum Youden Index (3.44 pg/mL). (C) Distribution of p‐tau181 values and the density of cases in pathology confirmed Alzheimer's disease (Path + AD), and cognitive normal individual without evidence of amyloid deposition on PET imaging. Vertical lines above the x‐axis represent measured p‐tau181 values.
A plasma p‐tau181 cut point of 3.44 pg/mL was identified at the maximum Youden Index in all cases. For all clinically diagnosed NC, MCI, and AD, the number above and below the cut point differed between diagnosis groups (χ 2 = 104.87, p < 0.0001).
p‐Tau181 cut point at the maximum Youden Index predicts rate of change in MMSE in MCI and AD in the UPenn Cohort
Among the clinical groups, inclusive of all amyloid PET status, 111 NC, 46 MCI, and 32 AD dementia participants had longitudinal MMSE assessments for up to 15 years (mean 2.73, SD 2.3). Linear mixed‐effects models were used to assess the relationship between a binary p‐tau181 cut point (above or below 3.44 pg/mL) and change in MMSE over time after plasma collection, adjusting for age, sex, and baseline MMSE score. P‐tau181 cut point exerted a significant effect on MMSE over time in MCI and AD, but not NC participants (Fig. 3A), with those above the cut point declining more rapidly. Prediction curves of MMSE over time for each clinical group are represented in Figure 3B. Covariates were assessed independently using linear mixed‐effects models to examine their association with change in MMSE over time; baseline MMSE positively associated with MMSE rate of decline in the NC, MCI, and AD dementia groups, while age was negatively associated only in the NC group (p < 0.05). A cut point at the maximum sensitivity (2.41 pg/mL) may be useful as a screening test for AD pathology. A cut point at 2.41 exerted a significant effect on MMSE over time in all three groups adjusting for age, sex, and baseline MMSE (p < 0.05).
Figure 3.

Plasma p‐tau181 cut point predicts rate of change in cognitive testing in mild cognitive impairment and Alzheimer’ disease groups. (A) Effects of p‐tau181 on longitudinal Mini Mental State Examination (MMSE) performance in each disease, assessed with linear mixed effects models adjusting for age, sex, and baseline MMSE. Coefficients (β), standard error (SE), and p‐values for p‐tau181 cut point*time interaction shown, with time in years. (B) Predicted MMSE values with 95% confidence intervals across 4 years of follow up in groups defined as above (red) or below (blue) the p‐tau181 cut point of 3.44 pg/mL in clinically defined normal cognition, mild cognitive impairment (MCI), and Alzheimer's disease.
Use of p‐tau181 cut point predicts time to a clinically significant decline in the CDR‐SB in NC, MCI, and AD
Among the clinical groups, inclusive of all amyloid PET status, 226 NC, 86 MCI, and 54 AD dementia participants had longitudinal CDR assessments for up to 15 years (mean 4.46, SD 2.70). Cox proportional hazards models were used to assess the relationship between a binary p‐tau181 cut off (above or below 3.44 pg/mL) and time to a clinically significant change in the CDR‐SB after plasma collection, equivalent to an increase by 1.5 points or more from baseline. 22 Plasma p‐tau181 greater than 3.44 pg/mL was associated with a higher risk of functional decline in NC (HR = 3.91, 95%CI = 1.57–9.73, p = 0.01), MCI (HR = 2.64, 95%CI = 1.46–4.77, p = 0.001), and AD (HR = 2.19, 95%CI = 1.06–4.55, p = 0.03, Fig. 4 ). When covarying for age at study entry, sex, and baseline CDR‐SB score, p‐tau181 cut point was no longer significant for AD (HR = 2.17, 95%CI = 0.97–4.90, p = 0.20), while it was for the NC (HR = 2.44, 95%CI = 1.32–4.51, p = 0.01) and MCI (HR = 2.98, 95%CI = 1.06–8.36, p < 0.01) groups.
Figure 4.
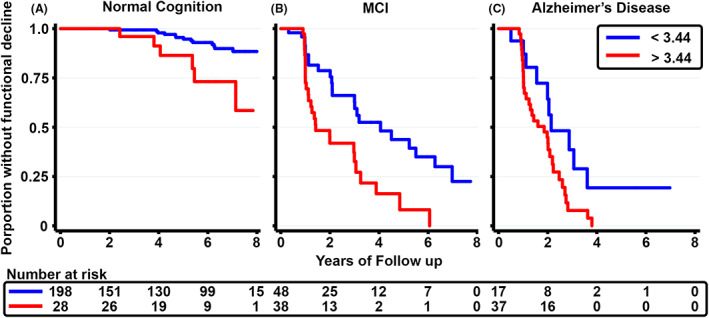
Plasma p‐tau181 cut point predicts time to clinically significant functional decline in cognitively normal, mild cognitive impairment, and Alzheimer’ disease groups. Effects of p‐tau181 on time to a clinically significant decline in the Clinical Dementia Rating Scale Sum of Boxes (CDR‐SB), equivalent to an increase by 1.5 points or more from baseline, in each disease, assessed with Cox proportional hazards models. Lines represent the proportion of individuals without functional decline over 8 years of follow‐up. Groups are defined as above (red) or below (blue) the p‐tau181 cut point of 3.44 pg/mL in clinically defined normal cognition (A), mild cognitive impairment (MCI, B), and Alzheimer's disease (C). The number at risk is shown at the bottom at 2‐year intervals.
We also assessed an alternative cut point (2.41 pg/mL) defined as the p‐tau181 value with maximum sensitivity in our AUC analyses. Individuals with plasma p‐tau181 values higher than a cut point of 2.41 pg/mL had higher risk of functional decline in the MCI, but not AD dementia or NC, groups (p < 0.05).
Plasma p‐tau181 correlates with CSF p‐tau181 and plasma NfL levels, and remains stable over time
We next sought to determine the correlation between plasma p‐tau181 level and CSF p‐tau181 level collected within 1 year of each other in 29 NC, 11 MCI, and 16 AD dementia participants. The mean time between plasma and CSF collection was 0.31 years (SD = 0.35). There was a weak, but positive, correlation between plasma and CSF p‐tau181, (r = 0.30, p = 0.02).
Plasma NfL, from samples collected within 1 year of plasma p‐tau181 samples, was measured in 174 NC, 70 MCI, and 45 AD participants. The mean time between plasma collections for p‐tau181 and NfL measures was 0.06 years (SD = 0.22); all but 18 were samples collected on the same day. There was a stronger, also positive correlation between plasma NfL and plasma p‐tau181, (r = 0.44, p < 0.0001).
To determine if plasma p‐tau181 values change over time, we analyzed 143 NC, 59 MCI, and 21 AD cases with up to four repeated plasma collections at a maximal follow up duration of 5.7 years (average = 2.39, SD = 1.03), using linear mixed‐effects models. P‐tau181 levels differed comparing diagnosis groups (F = 43.94, p < 0.001), but, within each group, p‐tau181 levels did not vary with follow up duration (F = 3.62, p = 0.06). There was no significant interaction between diagnosis and follow up duration (F = 1.52, p = 0.22). To determine if the rate of change in p‐tau181 level over time in MCI and NC participants varied by amyloid PET status, we analyzed 95 NC and 46 MCI participants with amyloid PET data, using linear‐mixed effects models. Amyloid PET status did not affect p‐tau181 values over time in either disease group.
p‐Tau181 cut point at the maximum Youden Index predicts rate of change in MMSE, time to a clinically significant decline in the CDR‐SB, and time to a diagnosis of dementia in a subset of MCI cases from the ADNI Replication Cohort
Sixty‐nine NC, 70 MCI, and 50 AD dementia cases from the ADNI cohort had plasma p‐tau181 measured. A second sample from 100 UPenn clinical cohort cases (39 CN, 30 MCI, and 31 dementia due to AD) were also run alongside these; Test/re‐test performance showed a high regression coefficient (R 2 = 0.953), a high level of agreement in 2022 results versus 2021 results based upon the obtained Passing‐Bablok linear regression analysis Y[2002] = 0.92X[2021] + 0.12 and a standard error of estimate = 0.41. 29 Plasma p‐tau181 differed from NC/PET− in the MCI/PET+ (p = 0.002) and the AD (p < 0.0001) groups. Demographic summary, amyloid PET status, and baseline characteristics of the ADNI cohort is shown in Table 3. The MMSE and CDR Scale was administered at least at yearly intervals for up to 11 years with a mean follow‐up of 3.89 (SD 2.97).
Table 3.
Alzheimer's disease neuroimaging initiative replication cohort baseline characteristics. All values are represented as mean (standard deviation), unless otherwise specified.
| Normal cognition | Mild cognitive impairment | Alzheimer's disease | |
|---|---|---|---|
| N | 69 | 70 | 50 |
| Age, y | 73 (5.9) | 72 (7.4) | 75 (8.7) |
| Sex, N (%) | |||
| Male | 27 (39) | 35 (50) | 30 (60) |
| Female | 42 (61) | 35 (50) | 20 (40) |
| Education, y | 16 (2.5) | 16 (2.5) | 16 (2.8) |
| Race, N (%) | |||
| Asian | 1 (1.5) | 0 (0) | 3 (6) |
| Black | 6 (9) | 2 (3) | 0 (0) |
| Pacific | 0 (0) | 1 (1) | 0 (0) |
| White | 61 (88) | 67 (96) | 47 (94) |
| >one | 1 (1.5) | 0 (0) | 0 (0) |
| Amyloid PET, N (%) | |||
| Positive | 35 (51) | 35 (50) | 7 (14) |
| Negative | 34 (49) | 35 (50) | 43 (86) |
| MMSE at baseline | 29 (1.3) | 28 (1.6) | 23 (2.0) |
| CDR‐SB at baseline | 0 (0.16) | 1.8 (1.2) | 4.5 (1.6) |
In the ADNI cohort, linear mixed‐effects models were used to assess the relationship between a binary p‐tau181 cut point (greater than/equal to versus below 3.44 pg/mL) and change in MMSE over time after plasma collection, adjusting for age, sex, and baseline MMSE score. P‐tau181 cut point exerted a significant effect on MMSE over time in MCI (β = −1.102, SE = 0.189, p < 0.01, Fig. 5A), but not NC or AD participants, with those above the cut point declining more rapidly. Covariates were assessed independently using linear mixed‐effects models to examine their association with change in MMSE over time. Cox proportional hazards models were used to assess the relationship between the p‐tau181 cut point and time to a clinically significant change in the CDR‐SB after plasma collection. In the MCI cases, p‐tau181 cut off was associated with 2.70 times higher risk of functional decline (HR = 2.70, 95%CI = 1.30–5.60, p = 0.01, Fig. 5B); no effect was identified in the CN or AD cases in these exploratory analyses of a subset of ADNI cases. Among cases with MCI at study entry, 31 individuals progressed to a diagnosis of dementia during the study. Cox proportional hazards models were used to assess the relationship between the p‐tau181 cut point and time dementia diagnosis in MCI cases showing a 3.39 times higher risk of conversion to dementia over 8 years of follow up (HR = 3.39, 95%CI = 1.61–7.16, p = 0.002, Fig. 5C).
Figure 5.

Plasma P‐Tau181 cut point predicts rate of change in cognitive testing, time to functional decline, and time to dementia onset in mild cognitive impairment in the Alzheimer's disease neuroimaging initiative cohort. (A) Effect of p‐tau181 cut point on longitudinal Mini Mental State Examination (MMSE) performance, assessed with linear mixed effects models adjusting for age, sex, and baseline MMSE. Coefficient (β) and p‐values for p‐tau181 cut point*time interaction shown, with time in years. (B) Effect of p‐tau181 cut point on time to a clinically significant decline in the Clinical Dementia Rating Scale Sum of Boxes, (CDR‐SB), equivalent to an increase by 1.5 points or more from baseline, assessed with Cox proportional hazards model. (C) Effect of p‐tau181 cut point on time to conversion to Dementia, assessed with Cox proportional hazards model. Groups are defined as above (red) or below (blue) the p‐tau181 cut point of 3.44 pg/mL.
Discussion
We measured plasma p‐tau181 levels in multiple neurodegenerative disease groups comprising a total of 556 individuals, demonstrating an association with AD pathology and an ability to predict longitudinal cognitive and functional decline. We first demonstrated that plasma p‐tau181 discriminates pathologically confirmed AD from amyloid‐negative, cognitively normal individuals with high accuracy. We evaluated a range of plasma p‐tau181 cut points to predict AD pathology for their performance characteristics. We next measured plasma p‐tau181 values in groups of clinically diagnosed AD dementia, MCI, and other neurodegenerative disease groups. We showed that a cut point based on the maximum Youden Index predicts longitudinal change in cognitive performance and functional ability. We replicated these findings in MCI cases in exploratory analyses from the ADNI cohort and further showed an association with shorter time to progression to dementia in participants with elevated p‐tau181.
Prior studies have demonstrated the ability of tau phosphorylated at threonine 181, 217, or 231 to discriminate clinically diagnosed or pathology‐confirmed AD dementia or MCI due to AD from non‐AD or cognitively unimpaired individuals, and between cognitively unimpaired PET‐ positive versus amyloid PET− negative individuals. 15 , 16 , 30 , 31 In particular, Lantero Rodriguez and colleagues 17 showed that plasma p‐tau181, measured by a similar assay with the same capture and detector antibodies with modest differences in buffer and diluents on the SiMoA platform and collected up to 8 years prior to death, discriminates pathology‐confirmed AD cases from cognitively normal adults with high diagnostic accuracy (AUC 0.97). Our findings corroborate this work and define an optimal cut point of p‐tau181, using the Quanterix p‐tau181 assay, proximate to death to discriminate pathology‐confirmed AD from cognitively normal individuals. Furthermore, Moscoso and colleagues showed that plasma p‐tau181 levels associate with degree of Aβ abnormality and reach abnormal levels ~5–6 years after abnormal CSF Aβ and amyloid PET measures. 32 Evidence is emerging about differences between phospho‐tau species. In familial AD, p‐tau217 was shown to be elevated 20 years prior to dementia onset, while p‐tau181 was elevated 16 years before onset. 12 , 19 Additionally, abnormal levels of plasma p‐tau231 were detected in the preclinical phase of AD, prior to the threshold for amyloid PET positivity, 13 suggesting this may be the earliest change in tau phosphorylation. More widespread availability of these assays especially p‐tau217 and p‐tau231 and head‐to‐head studies comparing these different p‐tau species can help to further define differences and similarities for their prediction of amyloid pathology and disease progression. Furthermore, the predictive performance of measures of p‐tau species may be further improved upon when provided in combination with other biomarkers or neuroimaging markers of AD pathology. 31
Plasma p‐tau181 also discriminates AD from FTD and PSP pathology cases with predominant tau or TDP‐43 pathologies, 30 , 33 suggesting specificity for AD pathology. Here, we additionally show that the ability of p‐tau181 to discriminate normal from neurodegenerative disease group is lowest in bvFTD/PPA, and higher among PD, PSP/CBS, DLB, and ALS cases. 16 These findings require validation due to the small sample sizes and lack of pathology confirmation. Co‐occurring neurodegenerative pathologies are an important consideration. We chose AD cases but did not exclude cases with co‐occurring pathologies. Although non‐AD pathologies could influence the p‐tau181 results suggesting a disease‐specific interaction or non‐specificity of the biomarker, we cannot meaningfully determine this effect in this cohort due to sample size.
The ability of p‐tau181 levels to predict cognitive change and functional decline in MCI cases is of particular importance. In both UPenn and ADNI cohorts, high p‐tau181 values are associated with a 1.1 point decline per year in MMSE and within 2 years >50% had a decline in overall function in MCI groups. Furthermore, in the ADNI cohort, > than 50% of MCI cases above the cut point progressed to clinical dementia by 2 years. Clinical trials aimed at slowing progression to dementia have frequently targeted MCI as a prodromal state of AD, often requiring positive amyloid status. 34 , 35 In this context, adding information from p‐tau181 values may offer an even more fine‐grained approach to predicting which individuals within an amyloid+ MCI group might be most likely to experience rapid cognitive decline.
The replication in the ADNI cohort was coupled with a re‐test of 100 samples from the UPenn cohort to evaluate stability across runs and reagent lots. We observed a very high test/re‐test correlation in 100 samples from the UPenn cohort (r 2 = 0.953). The high correlation is based upon Passing‐Bablok regression analysis that compared ptau‐181 results in the 100 samples included in second batch runs performed April 2022 to results for pristine identical aliquots of the 100 samples in the initial batch runs performed June 2021. The obtained linear regression equation Y[2022] = 0.92X[2021] + 0.12 demonstrated a slope value within 10% of 1.0 and an intercept indistinguishable from 0 (95% CI of −0.009 to 0.220). Since these results met our criteria for acceptable lot‐to‐lot performance including the high correlation, slope within 10% of 1 and intercept indistinguishable from 0 we did not re‐scale the 2022 run values to the 2021 data. 36 , 37 No other study has yet to deal with this potential source of error in plasma biomarkers of AD. However, given the observed 5 to 13% CV for the two plasma QC pools further studies will be required to assess for the need for a gray zone around the 3.44 pg/mL cut point concentration value.
Some limitations of our study should be considered. First, while we selected the AD pathology group, using the gold‐standard of post‐mortem analysis, we can only infer that the cognitively normal group represents a minimal neurodegenerative pathology state. We excluded amyloid positive cognitively normal individuals from our ROC analyses to address this limitation. Second, the pathology‐confirmed AD sample is limited in size due to availability of plasma collected prior to autopsy, and the non‐AD neurodegenerative groups are small by design in these exploratory studies. Among the ADNI cases, we find an association between cognitive and functional outcomes only in the MCI group, but not NC or AD, which may relate to the small sample size, or limited follow‐up time. We selected a subset of ADNI cases to evaluate in these exploratory replication analyses. Finally, absolute values of plasma p‐tau181 differ among published reports; a result of methodological differences in p‐tau assays in the absence of standardized conditions. 16 , 38 A widely available platform with standardized conditions will be essential to further clinical translation of p‐tau181 as an AD biomarker.
In summary, we present our findings from 556 individuals comprising multiple neurodegenerative disease groups to demonstrate the ability of plasma p‐tau181 to discriminate pathology‐confirmed AD from cognitively normal individuals. We identify a plasma p‐tau181 cut point that discriminates these groups and predicts cognitive and functional decline. We replicate these results in exploratory analyses of individuals with MCI from the multisite, longitudinal, observational ADNI cohort. These results demonstrate the utility of plasma p‐tau181 as an easily accessible diagnostic biomarker associated with AD neuropathology and as a prognostic biomarker associated with cognitive and functional decline, particularly in MCI cases. These results suggest that plasma p‐tau181 may help aid in participant selection for clinical trials of AD‐directed therapies, or in improving the clinical diagnosis of AD.
Conflict of Interest
The authors report no conflicts of interest.
Author Contributions
Conception and design of the study: TFT, SXX, JQT, MG, DJI, DW, EBL, DAW, ACP, LMS. Acquisition and analysis of data: TFT, TW, SXX, IMN, KQC, JQT, MG, DJI, DW, EBL, DAW, ACP, LMS. Drafting a significant portion of the manuscript or figures: TFT, IMN, KQC, EBL, DAW, ACP, LMS.
Acknowledgments
We would like to dedicate this paper to John Trojanowski for his extraordinary vision in developing biomarkers, biobanks, and investigators, without which this work would not have been possible. The authors would like to acknowledge our patients for their generous participation in this study and the clinical research associates at the University of Pennsylvania.
Funding Information NINDS and NIA (K23 NS114167, P30 AG010124, U19 AG024904, P01 AG066597, R01 AG054519, P30 AG072979, R01 AG055005, R01 NS115139), Alzheimer's Association (AARF‐D‐619473), Michael J. Fox Foundation/Alzheimer's Association/Weston Institute (Biomarkers Across Neurodegenerative Diseases grant). Alice Chen‐Plotkin is additionally supported by the Parker Family Chair, the AHA/Allen Institute Brain Health Initiative, and the Chan Zuckerberg Initiative Neurodegeneration Challenge. Data collection and sharing for this project was funded by the Alzheimer's Disease Neuroimaging Initiative (ADNI) (National Institutes of Health Grant U01 AG024904) ADNI is funded by the National Institute on Aging, the National Institute of Biomedical Imaging and Bioengineering, and through generous contributions from the following: AbbVie, Alzheimer's Association; Alzheimer's Drug Discovery Foundation; Araclon Biotech; BioClinica, Inc.; Biogen; Bristol‐Myers Squibb Company; CereSpir, Inc.; Cogstate; Eisai Inc.; Elan Pharmaceuticals, Inc.; Eli Lilly and Company; EuroImmun; F. Hoffmann‐La Roche Ltd and its affiliated company Genentech, Inc.; Fujirebio; GE Healthcare; IXICO Ltd.; Janssen Alzheimer Immunotherapy Research & Development, LLC; Johnson & Johnson Pharmaceutical Research & Development LLC; Lumosity; Lundbeck; Merck & Co., Inc.; Meso Scale Diagnostics, LLC; NeuroRx Research; Neurotrack Technologies; Novartis Pharmaceuticals Corporation; Pfizer Inc.; Piramal Imaging; Servier; Takeda Pharmaceutical Company; and Transition Therapeutics. The Canadian Institutes of Health Research is providing funds to support ADNI clinical sites in Canada. Private sector contributions are facilitated by the Foundation for the National Institutes of Health (www.fnih.org). The grantee organization is the Northern California Institute for Research and Education, and the study is coordinated by the Alzheimer's Therapeutic Research Institute at the University of Southern California. ADNI data are disseminated by the Laboratory for Neuro Imaging at the University of Southern California.
Funding Statement
This work was funded by Alzheimer's Association grant AARF‐D‐619473; National Institute of Neurological Disorders and Stroke grants K23 NS114167 and R01 NS115139; National Institute on Aging grants P01 AG066597, P30 AG010124, P30 AG072979, R01 AG054519, R01 AG055005, and U19 AG024904; Michael J. Fox Foundation grant AG066597; Weston Institute; Parker Family Chair; AHA; Allen Institute Brain Health Initiative; Chan Zuckerberg Initiative Neurodegeneration Challenge; Alzheimer's Disease Neuroimaging Initiative ; National Institutes of Health grant U01 AG024904; National Institute of Biomedical Imaging and Bioengineering ; AbbVie ; Alzheimer's Drug Discovery Foundation ; Araclon Biotech; BioClinica, Inc.; Biogen ; Bristol‐Myers Squibb Company; CereSpir, Inc.; Cogstate; Eisai Inc.; Elan Pharmaceuticals, Inc.; Eli Lilly and Company ; EuroImmun ; F. Hoffmann‐La Roche Ltd ; Genentech, Inc. ; Fujirebio; GE Healthcare ; IXICO Ltd.; Janssen Alzheimer Immunotherapy Research & Development, LLC; Johnson & Johnson Pharmaceutical Research & Development LLC; Lumosity; Lundbeck ; Merck & Co., Inc. ; Meso Scale Diagnostics, LLC; NeuroRx Research; Neurotrack Technologies; Novartis Pharmaceuticals Corporation ; Pfizer Inc. ; Piramal Imaging; Servier; Takeda Pharmaceutical Company ; Transition Therapeutics; Canadian Institutes of Health Research ; Northern California Institute for Research and Education ; University of Southern California.
References
- 1. Alzheimer's Disease International . World Alzheimer Report 2018 – The State of the Art of Dementia Research: New Frontiers. Alzheimer's Disease International (ADI); 2018. [Google Scholar]
- 2. Montine TJ, Phelps CH, Beach TG, et al. National Institute on Aging‐Alzheimer's Association guidelines for the neuropathologic assessment of Alzheimer's disease: a practical approach NIH public access. Acta Neuropathol. 2012;123(1):1‐11. [DOI] [PMC free article] [PubMed] [Google Scholar]
- 3. Olsson B, Portelius E, Cullen NC, et al. Association of Cerebrospinal Fluid Neurofilament Light Protein Levels with cognition in patients with dementia, motor neuron disease, and movement disorders. JAMA Neurol. 2019;76(3):318‐325. [DOI] [PMC free article] [PubMed] [Google Scholar]
- 4. Wallin ÅK, Blennow K, Zetterberg H, Londos E, Minthon L, Hansson O. CSF biomarkers predict a more malignant outcome in Alzheimer disease. Neurology. 2010;74(19):1531‐1537. [DOI] [PubMed] [Google Scholar]
- 5. Pase MP, Beiser AS, Himali JJ, et al. Assessment of plasma Total tau level as a predictive biomarker for dementia and related endophenotypes supplemental content. JAMA Neurol. 2019;76(5):598‐606. [DOI] [PMC free article] [PubMed] [Google Scholar]
- 6. Zetterberg H, Skillbäck T, Mattsson N, et al. Association of cerebrospinal fluid neurofilament light concentration with Alzheimer disease progression. JAMA Neurol. 2016;73(1):60‐67. [DOI] [PMC free article] [PubMed] [Google Scholar]
- 7. Klunk WE, Engler H, Nordberg A, et al. Imaging brain amyloid in Alzheimer's disease with Pittsburgh compound‐B. Ann Neurol. 2004;55(3):306‐319. [DOI] [PubMed] [Google Scholar]
- 8. Mattsson N, Zetterberg H, Hansson O, et al. CSF biomarkers and incipient Alzheimer disease in patients with mild cognitive impairment. JAMA. 2009;302(4):385‐393. [DOI] [PubMed] [Google Scholar]
- 9. Brier MR, Gordon B, Friedrichsen K, et al. Tau and ab imaging, CSF measures, and cognition in Alzheimer's disease. Sci Transl Med. 2016;8(338):338ra66. [DOI] [PMC free article] [PubMed] [Google Scholar]
- 10. Dubois B, Feldman HH, Jacova C, et al. Advancing research diagnostic criteria for Alzheimer's disease: the IWG‐2 criteria. Lancet Neurol. 2014;13(6):614‐629. [DOI] [PubMed] [Google Scholar]
- 11. Jack CR, Bennett DA, Blennow K, et al. NIA‐AA research framework: toward a biological definition of Alzheimer's disease. Alzheimer's and Dementia. 2018;14(4):535‐562. [DOI] [PMC free article] [PubMed] [Google Scholar]
- 12. Palmqvist S, Janelidze S, Quiroz YT, et al. Discriminative accuracy of plasma Phospho‐tau217 for Alzheimer disease vs other neurodegenerative disorders. JAMA. 2020;324(8):772‐781. [DOI] [PMC free article] [PubMed] [Google Scholar]
- 13. Ashton NJ, Pascoal TA, Karikari TK, et al. Plasma p‐tau231: a new biomarker for incipient Alzheimer's disease pathology. Acta Neuropathol. 2021;141(5):709‐724. [DOI] [PMC free article] [PubMed] [Google Scholar]
- 14. De Meyer S, Vanbrabant J, Schaeverbeke JM, et al. Phospho‐specific plasma p‐tau181 assay detects clinical as well as asymptomatic Alzheimer's disease. Ann Clin Transl Neurol. 2022;9(5):734‐746. [DOI] [PMC free article] [PubMed] [Google Scholar]
- 15. Janelidze S, Mattsson N, Palmqvist S, et al. Plasma P‐tau181 in Alzheimer's disease: relationship to other biomarkers, differential diagnosis, neuropathology and longitudinal progression to Alzheimer's dementia. Nat Med. 2020;26:379‐386. [DOI] [PubMed] [Google Scholar]
- 16. Karikari TK, Pascoal TA, Ashton NJ, et al. Blood phosphorylated tau 181 as a biomarker for Alzheimer's disease: a diagnostic performance and prediction modelling study using data from four prospective cohorts. Lancet Neurol. 2020;19(5):422‐433. [DOI] [PubMed] [Google Scholar]
- 17. Lantero Rodriguez J, Karikari TK, Suárez‐Calvet M, et al. Plasma p‐tau181 accurately predicts Alzheimer's disease pathology at least 8 years prior to post‐mortem and improves the clinical characterisation of cognitive decline. Acta Neuropathol. 2020;140(3):267‐278. [DOI] [PMC free article] [PubMed] [Google Scholar]
- 18. Mielke MM, Hagen CE, Xu J, et al. Plasma phospho‐tau181 increases with Alzheimer's disease clinical severity and is associated with tau‐ and amyloid‐positron emission tomography. Alzheimers Dement. 2018;14(8):989‐997. [DOI] [PMC free article] [PubMed] [Google Scholar]
- 19. O'Connor A, Karikari TK, Poole T, et al. Plasma phospho‐tau181 in presymptomatic and symptomatic familial Alzheimer's disease: a longitudinal cohort study. Mol Psychiatry. 2020;26(10):5967‐5976. [DOI] [PMC free article] [PubMed] [Google Scholar]
- 20. Toledo JB, Van Deerlin VM, Lee EB, et al. A platform for discovery: the University of Pennsylvania Integrated Neurodegenerative Disease Biobank. Alzheimer's Dementia. 2014;10(4):477‐484.e1. [DOI] [PMC free article] [PubMed] [Google Scholar]
- 21. Folstein MF, Folstein SE, McHugh PR. “Mini‐mental state”. A practical method for grading the cognitive state of patients for the clinician. J Psychiatr Res. 1975;12(3):189‐198. [DOI] [PubMed] [Google Scholar]
- 22. Andrews JS, Desai U, Kirson NY, Zichlin ML, Ball DE, Matthews BR. Disease severity and minimal clinically important differences in clinical outcome assessments for Alzheimer's disease clinical trials. Alzheimers Dement. 2019;5:354‐363. [DOI] [PMC free article] [PubMed] [Google Scholar]
- 23. Aamodt WW, Waligorska T, Shen J, et al. Neurofilament light chain as a biomarker for cognitive decline in Parkinson disease. Mov Disord. 2021;36(12):2945‐2950. [DOI] [PMC free article] [PubMed] [Google Scholar]
- 24. Shaw LM, Vanderstichele H, Knapik‐Czajka M, et al. Cerebrospinal fluid biomarker signature in Alzheimer's disease neuroimaging initiative subjects. Ann Neurol. 2009;65(4):403‐413. [DOI] [PMC free article] [PubMed] [Google Scholar]
- 25. Olsson A, Vanderstichele H, Andreasen N, et al. Simultaneous measurement of beta‐amyloid(1‐42), total tau, and phosphorylated tau (Thr181) in cerebrospinal fluid by the xMAP technology. Clin Chem. 2005;51(2):336‐345. [DOI] [PubMed] [Google Scholar]
- 26. Thiele C, Hirschfeld G. Cutpointr: improved estimation and validation of optimal Cutpoints in R. J Stat Softw. 2021;98(11):1‐27. [Google Scholar]
- 27. Lord SJ, St John A, Bossuyt PM, et al. Setting clinical performance specifications to develop and evaluate biomarkers for clinical use. Ann Clin Biochem. 2019;56(5):527‐535. [DOI] [PubMed] [Google Scholar]
- 28. Laird NM, Ware JH. Random‐effects models for longitudinal data. Biometrics. 1982;38(4):963‐974. [PubMed] [Google Scholar]
- 29. Passing H, Bablok W. A new biometrical procedure for testing the equality of measurements from two different analytical methods. Application of linear regression procedures for method comparison studies in clinical chemistry, Part I. J Clin Chem Clin Biochem. 1983;21(11):709‐720. doi: 10.1515/cclm.1983.21.11.709 [DOI] [PubMed] [Google Scholar]
- 30. Thijssen EH, La Joie R, Strom A, et al. Plasma phosphorylated tau 217 and phosphorylated tau 181 as biomarkers in Alzheimer's disease and frontotemporal lobar degeneration: a retrospective diagnostic performance study. Lancet Neurol. 2021;20(9):739‐752. [DOI] [PMC free article] [PubMed] [Google Scholar]
- 31. Meyer P‐F, Ashton NJ, Karikari TK, et al. Plasma p‐tau231, p‐tau181, PET biomarkers, and cognitive change in older adults Presymptomatic evaluation of experimental or novel treatments for Alzheimer disease (PREVENT‐AD) research group. Ann Neurol. 2022;91:548‐560. [DOI] [PubMed] [Google Scholar]
- 32. Moscoso A, Grothe MJ, Ashton NJ, et al. Time course of phosphorylated‐tau181 in blood across the Alzheimer's disease spectrum. Brain. 2021;144(1):325‐339. [DOI] [PMC free article] [PubMed] [Google Scholar]
- 33. Chouliaras L, Thomas A, Malpetti M, et al. Differential levels of plasma biomarkers of neurodegeneration in Lewy body dementia, Alzheimer's disease, frontotemporal dementia and progressive supranuclear palsy. J Neurol Neurosurg Psychiatry. 2022;93:651‐658. [DOI] [PMC free article] [PubMed] [Google Scholar]
- 34. Sevigny J, Chiao P, Bussière T, et al. The antibody aducanumab reduces Aβ plaques in Alzheimer's disease. Nature. 2016;537(7618):50‐56. [DOI] [PubMed] [Google Scholar]
- 35. Sperling RA, Aisen PS, Beckett LA, et al. Toward defining the preclinical stages of Alzheimer's disease: recommendations from the National Institute on Aging‐Alzheimer's Association workgroups on diagnostic guidelines for Alzheimer's disease. Alzheimer's Dementia. 2011;7(3):280‐292. [DOI] [PMC free article] [PubMed] [Google Scholar]
- 36. Niemantsverdriet E, Goossens J, Struyfs H, et al. Diagnostic impact of cerebrospinal fluid biomarker (pre‐)analytical variability in Alzheimer's disease. J Alzheimers Dis. 2016;51(1):97‐106. [DOI] [PMC free article] [PubMed] [Google Scholar]
- 37. Algeciras‐Schimnich A, Bruns DE, Boyd JC, Bryant SC, la Fortune KA, Grebe SKG. Failure of current laboratory protocols to detect lot‐to‐lot reagent differences: findings and possible solutions. Clin Chem. 2013;59(8):1187‐1194. [DOI] [PubMed] [Google Scholar]
- 38. Shen X‐N, Huang Y‐Y, Chen S‐D, et al. Plasma phosphorylated‐tau181 as a predictive biomarker for Alzheimer's amyloid, tau and FDG PET status. Transl Psychiatry. 2021;11:585. doi: 10.1038/s41398-021-01709-9 [DOI] [PMC free article] [PubMed] [Google Scholar]