

Graphical abstract

Keywords: Angelica sinensis polysaccharide, Silver nanoparticles, Ultrasonic degradation, Organic dyes, Ultrasonic cavitation
Highlights
-
•
The angelica polysaccharide was selected to prepare the silver catalytic material.
-
•
The catalytic effect of angelica Ag material with US was greater than Ag material.
-
•
The catalysis mechanism was elucidated by simulation and trapping experiments.
-
•
The degradation intermediates were analyzed and degradation routes were speculated.
-
•
The angelica Ag material still had an excellent catalytic effect after ten cycles.
Abstract
Currently, the polluted wastewater discharged by industry accounts for the major part of polluted bodies of water. As one of the industrial wastewaters, dye wastewater is characterized by high toxicity, wide pollution, and difficulty in decolorization degradation. In this paper, a novel composite nanomaterial catalyst of silver was prepared by using Angelica sinensis polysaccharide (ASP) as a reducing and stabilizing agent. And the optimum reaction conditions explored are VAgNO3 = 5 mL (300 mM) and vASP = 7% (w/v) for 6 h at 90 °C. In addition, the ASP-Ag nanocatalyst was characterized by several techniques. The results demonstrated that ASP-Ag nanoparticles were successfully synthesized. Degradation rate, which provides a numerical visualization of the percentage reduction in pollutant concentration. With the wrapping of ASP, the ultrasonic catalytic degradation rates of different organic dyes including rhodamine B (RB), methylene blue (MB), and methyl orange (MO) were from 88.2%, 88.7%, and 85.2% to 96.1%, 95.2% and 93.5% at room temperature, respectively. After the experiments, when cdyes = 10 mg/L, the highest degradation rate can be observed under cAPS-AgNPs = 10 mg/L with the most powerful cavitation frequency f = 59 kHz. The effect of ultrasonic frequency on the acoustic pressure distribution in the reactor was investigated by using COMSOL Multiphysis@ software to propose the mechanism of ultrasonic degradation and the mechanism was confirmed by OH• radical trapping experiments. It indicates that OH• produced by the ultrasonic cavitation effect plays a determinant role in the degradation. And then, the intermediate products of the dye degradation process were analyzed by gas chromatography and mass spectrometry (GC–MS), and the possible degradation processes of dyes were proposed. The resulting products of degradation are SO42−, NH4+, NO3−, N2, CO2 and H2O. Finally, the recycling degradation experiments showed that catalyst maintains a high degradation rate within reusing 5 cycles. Thus, this catalyst is highly efficient and recyclable.
1. Introduction
Water is one of the most important resources of nature. With the rapid development of modern industrialization, a large amount of polluted water is discharged [1]. Especially, among the various pollutants in the industry of textile processing, the colored wastewater (containing organic dyes) has a prominent demand for treatment and recycling [1]. Most of the dyes in wastewater are composed of heterocyclic and aromatic hydrocarbon toxic organic pollutants containing chromogenic and polar groups. These pollutants are difficult to biodegrade and highly carcinogenic, which also harm human health. So far, the recycling of waste dye liquor is a research hotspot to further reduce the consumption of fresh water and save the cost of wastewater treatment. Treatment technologies, including the Photo-Fenton technique, ozone oxidation, photocatalytic oxidation, electrochemical oxidation, microbial decolorization and advanced oxidation processes (AOPs), are used for the recovery and treatment of wastewater containing organic dyes [2], [3]. However, these methods have different disadvantages, which is time-consuming, costly and inefficient. Ultrasonic degradation, a green and efficient treatment technology [4], [5], [6], has a better application prospect for treating dye wastewater that is hardly treated by conventional methods [7], [8]. Therefore, it has become an important research direction for the treatment of dye wastewater. Ultrasonic cavitation refers to the phenomenon that when the ultrasonic energy is high enough, the tiny bubbles (cavitation nuclei) existing in the liquid vibrate, grow, and continuously gather sound field energy under the action of the ultrasonic field, and when the energy reaches a certain threshold, the cavitation bubbles collapse sharply and close [9], [10], [11].
Due to their large surface area, high adsorption performance [12], low diffusion resistance [13], and fast equilibration rates [14], there has been increasing interest in nanoparticles (including Ag, ZnO, TiO2, etc.) for removing dyes from wastewater over the past decade [15], [16]. In general, many articles usually investigate the ultrasonic catalytic and photocatalytic degradation of organic dye solutions by various nanoparticles at present. Li, Y. et al. synthesized KNbO3/ZnO nanocomposites and used them to simulate the piezoelectric/photocatalytic degradation of MO under sunlight and ultrasonic vibrations [17]. Li, Z. et al. synthesized Ag/PbBiO2I nanocomposites for the first application in the piezoelectric catalytic degradation of RB under ultrasonic vibration [18]. Wang, L. et al. synthesized a novel piezoelectric catalyst CoOx nanoparticles anchored BiFeO3 nanodisk composite by photodeposition and applied it to the piezoelectric catalytic degradation of RB under ultrasonic vibration [19]. Zheng, S. et al. synthesized a novel ternary piezoelectric catalyst MoOx/ZnS/ZnO by a one-step method, and the composite catalyst exhibited excellent piezoelectric catalytic activity under ultrasonic vibration (40 kHz) [20]. In particular, the role of silver nanoparticles (AgNPs) has been exploited in dyes removal. Because of its excellent physical, chemical and biological properties, silver nanoparticles are used in all walks of life [23], [24]. In addition, AgNPs can be used for sterilization and antibacterial, which is beneficial to their application in wastewater treatment [23], [24], [25]. The problem is that the release of AgNPs into the environment during application cannot be completely avoided. After AgNPs enter the organism, the silver ions released from their surface can cause significant toxic damage to cells, tissues and organs [26]. So, it is necessary to reduce the negative impact of AgNPs on biological systems. Green synthesis of nanoparticles using plant polysaccharides to reduce metal salts can produce more highly efficient nanoparticles than other methods [27], [28]. In addition, this method can control the synthesis of nanoparticles to provide suitable nanoparticle shapes and sizes [29], [30]. It eliminates the use of additional stabilizers in the physical and chemical synthesis process, and its most significant advantage is that it allows the continuous production of nanoparticles over a while [31]. To catalyze the degradation of organic dyes in water under sonication conditions, a novel biocompatible composite silver nanomaterial was synthesized by ASP via the hydrothermal method in this paper. As shown in Table 1, ASP-AgNPs worked better than many various catalysts in terms of degradation rates, indicating its great potential power.
Table 1.
Comparison of the ultrasonic degradation performance of different catalysts.
| Catalysts | Dyes | Ultrasound | Time [min] | Degradation rate [%] |
|---|---|---|---|---|
| KNbO3/ZnO [17] | MO | 40 kHz, 120 W | 90 | 49.0 |
| CoOx/BiFeO3[19] | RB | 40 kHz, 120 W | 90 | 82.0 |
| Ag/BiFeO3[18] | RB | 40 kHz, 120 W | 90 | 82.0 |
| BiOBr [22] | RB | 40 kHz, 120 W | 120 | 45.0 |
| ZnO [21] | MB | 40 kHz, 150 W | 120 | 38.0 |
| ASP-AgNPs (Present) |
RB | 59 kHz, 300 W | 120 | 96.1 |
| MB | 59 kHz, 300 W | 120 | 95.2 | |
| MO | 59 kHz, 300 W | 120 | 93.5 |
2. Materials and methods
2.1. Chemicals
Angelica sinensis polysaccharide of 99% purity were purchased from Yuanye Bio ltd. from China. Silver nitrate (AgNO3), sodium citrate and ethanol were purchased from Sinopharm Chemical Reagent Co., ltd. of China. And the deionized water was used for the experiments. The three organic dyes are from Shanghai Macklin Biochemical Co., ltd.
2.2. Apparatus
ASP-AgNPs were prepared by using an electric thermostatic magnetic stirrer (SH21-1, Shanghai Meiyingpu Instrument and Meter Manufacturing Co., ltd.), a vacuum drying oven (DAF, Beijing Kewei Yongxing Instrument Co., ltd.) and a ver-satile compact centrifuge (Himac CF 16RX, Koki Holding Co., ltd.). Field emission scanning electron microscopy (FE-SEM, Nova NanoSEM 450, FEI) and energy dispersive spectroscopy (EDS) were used for observational studies. Dynamic light scattering (DLS) results were measured using a laser particle sizer (Nano Brook Omni, Brookhaven, USA). The UV–vis adsorption parameters were measured by a UV–vis spectrometer (UV1901PC, Austrian Scientific Instruments, Shanghai, China). The FT-IR spectra were measured on a FT-IR spectrometer (Bruker Vertex 70). The XRD patterns were examined by an X-ray diffractometer (Bruker D8 Advance) with a tube current of 30 mA and a voltage of 40 kV (Cu Kα, λ = 0.15418 nm). Digital display electric stirrer (JJ-1A, Xicheng Xinrui Apparatus Factory of Jintan District) and frequency conversion ultrasonic cleaner (SB-5200DTS, Ningbo Scientz Biotechnology Co., ltd.) were used for degradation experiments. The dyes were irradiated by UV lamp (100 W) for photocatalytic reaction. The finite element simulation of acoustics was performed using COMSOL Multiphysics 5.6 ® software on the computer. GC–MS (ISQ Trace 1300, Thermo Fisher Scientific Co., ltd) was used to detect degradation intermediates.
As shown in Fig. 1, the ultrasonic degradation of dyes was carried out in this device. In this experiment, different concentrations of APS-AgNPs catalysts (10 mL) were added into different concentrations of organic dye solutions (250 mL) respectively. After ultrasonic treatment at different frequencies for a certain time, 3 mL of samples were taken out at different time intervals and their UV–vis absorption spectra were measured, and then all the floating catalysts were extracted with a centrifuge. All experimental temperatures were controlled at 20 °C ± 1 °C by the ultrasonic cleaner.
Fig. 1.

The schematic diagram of the ultrasonic degradation device.
In the degradation theory confirmation experiment, the dyes were added to different catalytic materials after a certain time of UV radiation treatment and the samples were taken out separately to measure their UV–vis absorption spectra. The dye solutions after the ultrasonic degradation for 2 h were analyzed by GC–MS with full scan mode and split injection mode (60 m × 0.25 mm × 0.25 μm, 80 ℃ (hold for 2 min) to 240 ℃ (hold for 6 min), 5 ℃/min,). The vaporizer temperature is 250 °C. The split ratio is 1: 100 and a constant flow of nitrogen at 1.0 mL/min. The degraded water samples were extracted by dichloromethane, followed by rotary evaporation, and finally purged with nitrogen and silylated.
In this preparation procedure, plenty of ASP was dissolved in 500 mL deionized water with stirring at ordinary temperature for 30 min to obtain a saturated solution. And then, the ASP solution was subjected to centrifugation to remove excess undissolved solids. Afterwards, 40 mL of freshly prepared aqueous AgNO3 solution (300 mM) was added into the ASP solution. The reactive system was held at a constant temperature with magnetic stirring in a thermostatic water bath. To make further exploration for the optimal reaction conditions, the reaction was systematically studied by varying the initial AgNO3 concentration from 0 to 50 mL, initial ASP concentration from 0 to 7% (w/v), reaction time from 0 to 6 h, reaction temperature from 40 to 90 °C. The resulting solution was dialyzed via MW 1000 dialysis membrane in double-distilled water for 24 h with water replaced every 8 h to remove unreacted AgNO3. And then, the obtained colloidal dispersions were stored at ordinary temperature before use. The resulting colloidal dispersions were centrifuged at 8000 rpm and filtered. Finally, the precipitate was firstly washed with ethanol, and then washed several times with deionized water and collected.
The UV–vis absorption spectra were confirmed using a UV–vis spectrometer which with the quartz and the 1 cm optical path length cuvette. It was used to monitor the progress of the reaction under the different experimental conditions described above. After dropping ASP-AgNPs on silicon wafers, their morphology and structure were recorded by field emission scanning electron microscopy (FE-SEM), and energy dispersive spectroscopy (EDS) was also performed. Use dynamic light scattering (DLS) to measure relevant parameters of ASP-AgNPs. The crystal structure and crystalline phases of ASP-AgNPs were determined using XRD analysis in the wavenumber range of 4000–400 cm−1 with a resolution of 4 cm−1 in the wave number range of 4000–400 cm−1 with a resolution of 4 cm−1。By using FT-IR with a scan speed of 10° min and a 2θ range of 10°–80° angle, the differences between ASP and ASP-AgNPs were further explored from the perspective of functional groups.
3. Result and discussion
3.1. Results of characterization
Polysaccharides are polymers consisting of aldoses or ketoses linked by glycosidic bonds. In this experiment, ASP was used as a reducing agent to reduce silver ions (Ag+) to form stable AgNPs. Fig. 2 shows the stabilization process of silver nanoparticle formation. ASP is composed of homogalactan and homoarabinan containing a large number of hydroxyl groups. Then, after heating, Ag+ is reduced to silver atoms. Immediately, the silver atoms are attracted to each other to form clusters and further aggregate to form nanoparticles, which are subsequently encapsulated by ASP [32], [50].
Fig. 2.

The schematic diagram of the formation process of ASP-AgNPs.
When light is totally reflected on the surface of prism and metal film, it will form evanescent wave and enter into light sparse medium, and there is a certain plasma wave in metal medium. And when the evanescent wave resonates with the surface plasma wave, the detected reflected light intensity will be greatly weakened [33], [34]. So, surface plasmon resonance (SPR) peak can be detected in silver [34]. The SPR peak of synthesis of ASP-AgNPs was confirmed using a UV–vis spectrometer in the range of 300–800 nm and further confirmed by visual observation of color changes [35], [36], [18]. In Fig. 3, all dispersions show characteristic SPR peaks close to 425 nm after a period of reaction between ASP and AgNO3 in different preparation conditions, indicating the formation of smaller suspended particles [37], [38], [39]. The higher the SPR peak, the smaller the particle size of AgNPs and the closer the solution is to the colloid. The color of the dispersions changed significantly and gradually deepened from pale yellow. In Fig. 3a, the initial reaction concentration of Ag+ is variable, which indicates that higher yields of ASP-AgNPs can be obtained at a higher Ag+ concentration [40], [41]. The concentration of ASP was changed in the experiment in Fig. 3b. There was no SPR absorption band when the ASP concentration was zero, indicating that silver nanoparticles could not be formed in the mixed solution without ASP. In the reaction system, the yield of ASP-AgNPs increased with increasing ASP content. In addition, temperature and reaction time also affect the yield of ASP-AgNPs. From the results, the reaction fails to proceed at temperatures below 70 °C (Fig. 3c). Under suitable conditions, ASP-AgNPs appeared after 2 h of reaction (Fig. 3d).
Fig. 3.

UV–vis absorption spectra of ASP-AgNPs for various reaction parameters (a) AgNO3 concentration, (b) ASP concentration, (c) reaction temperature, (d) reaction time. The prepared AgNPs dispersions are shown correspondingly in the upper right inset of the spectra.
The morphology of the ASP-AgNPs was studied by scanning electron microscopy (Fig. 4). The surface morphology of the ASP-AgNPs precipitated was shown to resemble spheres and exhibited nanoparticles with a size of about 10 nm (Fig. 4a). But after dispersing the precipitation of the ASP-AgNPs in deionized water, ASP-AgNPs are gathered into irregular clusters (Fig. 4b) [42], [43], [44], [48]. From Fig. 4c, it can be observed more clearly that the shape of an ASP-AgNPs cluster is irregular. Fig. 4d shows the morphology of the ASP-AgNPs cluster scanned with an electron beam at a lower voltage, which was covered by visible ASP on the external surface [45], [46], [47].
Fig. 4.

Field emission scanning electron microscopy (FE-SEM) images and corresponding size distributions of (a) ASP-AgNPs, (b, c) ASP-AgNPs colloidal dispersions, (d) ASP-AgNPs colloidal dispersions with lower voltage.
The detection results of the energy dispersive spectroscopy (EDS) shows that the point selected in Fig. 4d contains the characteristic X-ray photon energy of Ag (Fig. 5). The results of the elemental tests were listed in Table 2, including the measured percent of elemental mass, the normalized percent of elemental mass, the normalized percent of atoms, and the error in the percent of mass. The presence of carbon, oxygen, and silver elements in the detection point. The trace amounts of carbon and oxygen elements are from the ASP. Table 3 shows the DLS detection results of three samples of ASP-AgNPs from the three separate experiments.
Fig. 5.

Energy dispersive spectroscopy (EDS) analysis image for detecting elements of ASP-stabilized AgNPs.
Table 2.
Energy dispersive spectroscopy (EDS) analysis results for detecting elements of ASP-stabilized AgNPs.
| Element | unn. C [wt.%] | norm. C [wt.%] | Atom. C [at.%] | Error [wt.%] |
|---|---|---|---|---|
| 47Ag | 65.34 | 55.18 | 49.08 | 2.75 |
| 6C | 25.24 | 24.3 | 47.47 | 2.04 |
| 8O | 3.81 | 1.92 | 3.45 | 0.51 |
Table 3.
Summary statistics report on the DLS detection results of ASP-AgNPs.
| Sample | Eff. Diam. (nm) | Polydispersity | Count Rate (kcps) | Data Retained (%) | Diffusion Coeff. (×10−8 cm2/s) |
|---|---|---|---|---|---|
| 1ASP-AgNPs | 95.95 | 0.0214 | 519.0 | 100.00 | 4.846 |
| 2ASP-AgNPs | 90.04 | 0.0300 | 494.1 | 97.21 | 5.164 |
| 3ASP-AgNPs | 98.27 | 0.0221 | 478.6 | 95.87 | 4.732 |
Fig. 6a shows the XRD patterns of ASP-AgNPs. ASP-AgNPs exhibit distinct characteristic peaks at 2θ = 27.4°, 38.1°, 43.5°, 64.1°, and 77.3° corresponding to (4 0 0), (1 1 1), (2 0 0), (2 2 0), and (3 1 1) Miller indices of face-centered cubic AgNPs crystals [49], [52], [40]. The absence of any impurities and diffraction peaks of secondary phases confirms the production of high purity AgNPs [53]. The FT-IR spectra (Fig. 6b) show that the band of ASP-AgNPs is shifted or broadened compared to ASP. In the FT-IR spectra of the synthesized ASP-AgNPs, the main absorption band appears at 3580 cm−1, which proves that hydrogen bonding is responsible for the formation and stabilization of AgNPs. For the ASP-AgNPs nanocomposites, the band belonging to 1721 cm−1 is left-shifted and the intensity increased by comparison with ASP. This conversion indicates that the carbonyl groups of aldehydes and ketones from ASP changed into the carbonyl groups of carboxylic acids from ASP-AgNPs [51], [54], [55].
Fig. 6.

(a) XRD patterns of ASP-AgNPs. (b) FT-IR spectra of AgNPs and ASP-AgNPs.
3.2. Ultrasonic degradation performance
The UV absorption spectra of various dyes after different times of sonication with ASP-AgNPs are demonstrated in Fig. 7a, c and d. The ultrasonic catalytic degradation rate (%) of ASP-AgNPs on dyes was calculated using Equation (1), where η is the degradation rate, C0 is the initial dye concentration and Ct is the residual dye concentration. The Beer-Lambert formula (Eq. (2)) was used to calculate the concentration of the dye solution from the absorbance [56]. Where A is the absorbance and T is the transmittance. K is the molar absorption coefficient, which is related to the properties of the absorbing substance and the wavelength λ of the incident ray. where b is the thickness of the absorbing layer and c is the concentration of the absorbing substance.
| (1) |
| (2) |
Fig. 7.

UV–vis spectra of (a) RB ([RB] = 10 mg/L), (c) MB ([MB] = 10 mg/L), and (e) MO ([MO] = 10 mg/L) of ultrasonic degradation with ASP-AgNPs at different times (From 0 to 2 h, [ASP-AgNPs] = 0.4 g/L, f = 59 kHz). Degradation rates of (b) RB, (d) MB, and (f) MO with different catalytic factors for 2 h (All concentration of catalyst is 0.4 g/L, US frequency is 59 kHz). (g) Degradation rates of RB (Black), MB (Red), and MO (Blue) with different catalyts for 2 h under UV radiation (All concentration of catalyst is 0.4 g/L).
To make the calculated concentrations more reliable, the absorbance comparison method of standard curves of different concentrations of dye solutions was also applied. A certain amount of dye solution with an initial concentration of 1 × 10⁻⁴ mol/L was pipetted and diluted to obtain a series of aqueous solutions with gradient concentrations (2 ∼ 14 μmol/L), and a standard curve was plotted [56].
3.2.1. Sonocatalytic activity of ASP-AgNPs
The catalytic degradation rates of different reactants under ultrasound (US) were compared to evaluate the superiority of the synthesized ASP-AgNPs in terms of catalytic activity. From Fig. 7b, d and f, it can be concluded that the degradation rates of Ag, ASP and ASP-AgNPs were extremely low for all the dye solutions without ultrasonic treatment. The weak adsorption of particles leads to a slight difference in the concentration of the dye solution. And in the presence of ultrasound, all catalytic materials showed promising degradation under the effect of ultrasonic cavitation. In particular, the degradation rate was reduced with ultrasonic adding ASP significantly. And after wrapping AgNPs, APS could enhance the degradation rate of AgNPs. The high antioxidant activity of APS is due to its rich content of aldehyde and ketone groups. After the preparation step of ASP reduced AgNPs with stirring, the aldehyde and ketone groups in APS changed to carboxyl groups. This change increased the concentration of H+ in the reaction system, which promoted the proceeding of Eq. (6). FT-IR spectra (Fig. 6b) also can support this conclusion. So, the ultrasonic degradation activity of APS-AgNPs is higher than that of its synthetic fraction. Photocatalytic experiments (Fig. 7g.) confirmed the catalytic effect of ASP-Ag on the dye solution under UV light irradiation, excluding the interference of the photocatalytic property of ASP itself. The ASP-AgNPs had a degradation effect under UV irradiation for a certain period. And ASP alone showed no significant degradation effect on all three dyes.
With the cavitation bubbles produced by the ultrasonic cavitation effect collapsing instantaneously, the hot-spot and sonoluminescence effect will be generated around themselves. The results of Noltingk and Neppiras' calculations showed that the hot-spot effect reaches a temperature of 10000 K and a pressure of over 50000 kPa in the local area. The H2O cleavage was induced to form OH• radicals by extreme conditions of localized high temperature and pressure of the solution. In the sonoluminescence effect, ASP-AgNPs were photocatalyzed with the excitation of electrons from the valence band to the conduction band, where electron-hole (e−—h+) pairs were generated and reactive oxygen species (ROS) (including OH• and O2−•) were produced through a series of reactions. The specific reaction processes are given by Eqs. (3)-(10) [35]. Through the strong oxidation of OH• radicals, the dye molecules in the wastewater were gradually oxidized and the chemical bonds were broken, and the oxidation products (CO2 and H2O, etc.) were finally obtained, thus realizing the degradation of dyes. The degradation principle described above is shown in Fig. 8 [57].
| (3) |
| (4) |
| (5) |
| (6) |
| (7) |
| (8) |
| (9) |
Fig. 8.

The diagram of degradation mechanism.
To demonstrate that OH• radicals are the main reactants driving the degradation of the dye solution, the radical scavenger isopropanol (IPA) was added into the process of degradation reaction [5]. The results exhibit a significant decrease in the degradation rates with IPA, as shown in Fig. 9. After adding IPA, the degradation rate of the dye solution was significantly reduced, proving that OH• is the dominant oxide [27].
Fig. 9.

Degradation rate of IPA radical trapping experiment.
3.2.2. Effect of reactants concentration
In the system, the degradation speeds of all the dye solutions increased gradually in the presence of ultrasound only. When a small amount of ASP-AgNPs was added to the solution, the concentrations of all three dyes decreased. And the degradation rate of the three dyes was enhanced by continuing to increase the amount of ASP-AgNPs. The higher the amount of ASP-AgNPs, the faster the speed of OH• production by ultrasonic cavitation, which increases the degradation rate of dye molecules [5], [35]. Although the degradation rates of different ASP-AgNPs dosages were different, the degradation speeds of RB, MB and MO (Fig. 10a, c and e) could reach 96.1%, 95.2% and 93.5% after 2 h of reaction, respectively. The relatively low degradation rate of MO may be because MO is an azo-dye, which has N N double bonds inside the molecule that are difficult to oxidize [7]. The reaction continued to increase the amount of ASP-AgNPs, which did not display an improved catalytic efficiency. Because the excessive amount of ASP-AgNPs led to the competition between the generated OH• and the dye molecules for the reactive sites, part of the OH• was not able to decompose the dye molecules before reacting with itself to form O2 and H2O [6], [7], [35]. In addition, as the initial dye concentration increased, the degradation rate and speed were faster for low dye concentration than for high dye concentration (Fig. 10b, d and f). This indicates that the dye concentration also affects the degradation rate and speed. When the concentration of organic dyes is high, they adhere to the surface of ASP-AgNPs, which is not conducive to forming cavitation bubbles, thus reducing the degradation rate and speed.
Fig. 10.

Degradation rates of (a) RB, (c) MB, and (e) MO with different ASP-AgNPs concentration for 4 h (All concentrations of dyes are 10 mg/L, US frequency is 59 kHz). Degradation rates with different (b) RB, (d) MB, and (f) MO concentrations for 2 h (All concentrations of ASP-AgNPs are 0.4 g/L, US frequency is 59 kHz).
3.2.3. Effect of ultrasonic frequency
The cavitation threshold Pc is the minimum sound pressure amplitude that causes the cavitation effect of the liquid and is given by Eq. (10) [58], [59].
| (10) |
where P0 is the static pressure of the liquid, Pυ is the vapor pressure, σ is the surface tension of the liquid, and R0 is the initial radius of the cavitation nucleus.
It is usually dependent on the ultrasonic frequency. Therefore, the ultrasonic frequency is also an essential factor affecting the degradation rate. Generally, the higher the ultrasonic frequency system input, the higher the Pc required, and the harder cavitation appears. In addition, the increased ultrasonic intensity I is also beneficial to cavitation generation. It can be expressed in Eq. (11) [58], [60].
| (11) |
where c0 is the speed of sound in the medium, ε is the average sound energy density, ρ0 is the liquid density, and Pm is the sound pressure amplitude. From Fig. 11a-c, it can be seen that the degradation rate tends to increase gradually with the increase of ultrasonic irradiation time. But the optimal ultrasonic frequency is 59 kHz instead of 20 kHz. For clarification, the sound pressure in the system was calculated using COMSOL Multiphysics 5.6 ® physical field pressure acoustic frequency domain section. The degradation system is composed of a three-necked round-bottom flask (reaction vessel, Rf = 0.045 m) and an ultrasonic cleaner (ultrasonic emission device, with water, 0.3 m × 0.24 m × 0.12 m) (Fig. 11d.). There are 6 ultrasonic probes (the ultrasonic power is 50 W each, Rp = 0.03 m) at the bottom of the ultrasonic cleaner. The liquid level inside and outside the flask is the same. Fig. 11e-h show the results of scanning at different ultrasonic frequencies. Different frequencies of ultrasonic waves can cause positive and negative sound pressure in the flask and the amplitudes of sound pressure all reach 105 orders of magnitude or more. Among them, the sound pressure can reach 106 orders of magnitude when the frequency is 59 kHz. This is consistent with the experimentally obtained results.
Fig. 11.


Degradation rates of (a) RB, (b) MB, and (c) MO with different US frequency for 2 h (All concentrations of dyes are 10 mg/L, concentrations of ASP-AgNPs are 0.4 g/L). (d) Model and boundary conditions for simulation. Sound pressure distribution of the system at different ultrasonic frequencies ((e) 25 kHz, (f) 40 kHz, (g) 59 kHz and (h) 80 kHz).
3.2.4. Potential intermediates and processes
At the set reaction time, the degraded dye solutions were sampled and analyzed by GC–MS. The mass spectral information of some intermediates produced during the ultrasonic degradation of the dye solution is listed in Table 4. All concentrations of dyes are 10 mg/L, concentrations of ASP-AgNPs are 0.4 g/L and US frequency is 59 kHz. The solution after 2 h reaction was pretreated for GC–MS.
Table 4.
Data of mass spectral peaks for some intermediates in ultrasonic degradation process.
| Type | intermediate | Retention time (min) | molecular weight (g/mol) | molecular structure |
|---|---|---|---|---|
| RB | C7H6O2 | 10.50 | 122 |  |
| C7H9ON | 10.61 | 123 |  |
|
| C7H6O3 | 13.27 | 138 |  |
|
| C8H4O3 | 15.64 | 148 |  |
|
| C8H6O4 | 17.88 | 166 |  |
|
| C8H6O4 | 18.67 | 166 |  |
|
| MB | C6H7ON | 9.05 | 109 |  |
| C6H6O2 | 10.21 | 110 |  |
|
| C6H7O2N | 15.85 | 125 |  |
|
| C6H13O2N | 13.32 | 131 |  |
|
| C7H7NS | 16.26 | 137 |  |
|
| C6H6O4 | 15.71 | 142 |  |
|
| MO | C6H6 | 5.39 | 78 |  |
| C6H7N | 7.20 | 93 |  |
|
| C6H6O2 | 8.97 | 110 |  |
|
| C6H6O4 | 16.11 | 142 |  |
|
| C8H11N3 | 16.58 | 149 |  |
According to Table 4, the potential routes for the degradation of the three dyes are presented in Fig. 12. The analytical results of some intermediates and mass spectra confirmed the possibility and rationality of ultrasonic catalytic degradation routes for these three dyes.
Fig. 12.


The potential degradation routes of RB, MB and MO. (Some intermediates and conditions are unknown.).
3.2.5. Recycling capacity of ASP-AgNPs
The recyclability of catalysts is an important indicator of material sustainability. The recyclability of the ASP-AgNPs catalyst was investigated by repeated catalytic degradation tests of the dyes RB, MB and MO in the presence of ultrasound. The degradation rate of ASP-AgNPs catalysts remained 73.1% for RB, 70.5% for MB, and 65.5% for MO after 10 cycles (Fig. 13), which was possible because of trace loss of ASP-AgNPs catalysts during the washing. On the whole, ASP-AgNPs have high stability and recyclability, meeting the requirements for sustainable and recyclable materials [61].
Fig. 13.
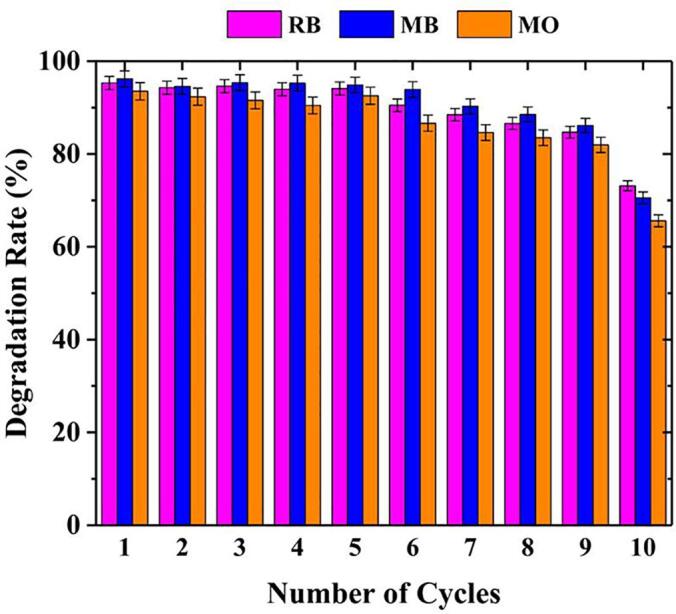
Degradation rates of RB, MB, and MO after 10 cycles for 2 h (All concentrations of dyes are 10 mg/L, concentrations of ASP-AgNPs are 0.4 g/L and US frequency is 59 kHz).
4. Conclusions
In summary, AgNPs were successfully synthesized by a convenient thermochemical method, ASP as a stabilizer and reducing agent. The effect of different initial conditions on the particle size of ASP-AgNPs was explored, and various techniques demonstrated the formation of ASP-AgNPs. In the degradation experiments of three different dyes, both ASP-AgNPs and ultrasound play a significant role in the degradation process. In addition, the presence of ASP enhances the acoustic catalytic degradation efficiency of AgNPs, and the degradation effect of single ASP-AgNPs is much greater than that of a simple mixture of ASP and AgNPs. The optimal conditions for the experimental reactions were derived by specific experiments together with the theoretical analysis of COMSOL Multiphysis@ software simulations. The degradation rates of 0.4 g/L ASP-AgNPs to 10 mg/L dyes were 96.1% (RB), 95.2% (MB) and 93.5% (MO) with an ultrasonic frequency of 59 kHz at 20℃, respectively. It indicates that ASP-AgNPs have good catalytic ability. And then, the mechanism of ultrasonic degradation is the cavitation of the hot-spot effect and sonoluminescence effect. The OH• generated by cavitation can efficiently oxidize the dye molecules and was confirmed by IPA radical trapping experiments. Intermediate products of dyes degradation and possible degradation routes are proposed. Finally, the ASP-AgNPs showed good cyclability for all three dyes after 10 cycles. Therefore, this study provides a new method for the preparation of efficient, environmentally friendly, safe and valuable new bio-substrate composite AgNPs catalytic materials.
Funding
This work was supported by the National Natural Science Foundation of China (No. 11874039), the Natural Science Foundation Xi’an Research Project (No. 22GXFW0019), Shaanxi science and technology plan projects of China (2022KXJ-010), the Fundamental Research Funds for the Central Universities (GK202103012) and Innovation Funds for Graduate Student of Shaanxi Normal University (2021CSLY004).
CRediT authorship contribution statement
Hao Jiang: Conceptualization, Data curation, Validation, Writing – original draft, Methodology. Haonan Lu: Investigation. Yongshan Zhou: Formal analysis. Yongfeng Liu: Methodology, Resources, Supervision. Changchun Hao: Writing – review & editing, Project administration, Funding acquisition.
Declaration of Competing Interest
The authors declare that they have no known competing financial interests or personal relationships that could have appeared to influence the work reported in this paper.
Contributor Information
Yongfeng Liu, Email: biophymed@snnu.edu.cn.
Changchun Hao, Email: haochangchun@snnu.edu.cn.
Data availability
The data that has been used is confidential.
References
- 1.Kanakaraju D., Glass B.D., Oelgemoller M. Advanced oxidation process mediated removal of pharmaceuticals from water: A review. J. Environ. Manage. 2018;219:189–207. doi: 10.1016/j.jenvman.2018.04.103. [DOI] [PubMed] [Google Scholar]
- 2.Esteves B.M., Rodrigues C.S.D., Boaventura R.A.R., Maldonado-Hódar F.J., Madeira L.M. Coupling of acrylic dyeing wastewater treatment by heterogeneous Fenton oxidation in a continuous stirred tank reactor with biological degradation in a sequential batch reactor. J. Environ. Manag. 2016;166:193–203. doi: 10.1016/j.jenvman.2015.10.008. [DOI] [PubMed] [Google Scholar]
- 3.Theron J., Walker J.A., Cloete T.E. Nanotechnology and water treatment: Applications and emerging opportunities. Crit. Rev. Microbiol. 2008;34(1):43–69. doi: 10.1080/10408410701710442. [DOI] [PubMed] [Google Scholar]
- 4.Behnajady M.A., Modirshahla N., Shokri M., Vahid B. Effect of operational parameters on degradation of Malachite Green by ultrasonic irradiation. Ultrason. Sonochem. 2008;15(6):1009–1014. doi: 10.1016/j.ultsonch.2008.03.004. [DOI] [PubMed] [Google Scholar]
- 5.Lan R.-J., Li J.-T., Chen B.-H. Ultrasonic degradation of fuchsin basic in aqueous solution: effects of operating parameters and additives. Internat. J. Photo-energy. 2013;1:1–7. [Google Scholar]
- 6.Moumeni O., Hamdaoui O., Pétrier C. Sonochemical degradation of malachite green in water. Chem. Eng. Process. 2012;62:47–53. [Google Scholar]
- 7.Rehorek A., Tauber M., Gübitz G. Application of power ultrasound for azo dye degradation. Ultrason. Sonochem. 2004;11(3-4):177–182. doi: 10.1016/j.ultsonch.2004.01.030. [DOI] [PubMed] [Google Scholar]
- 8.Pang Y.X., Ruan Y., Feng Y., Diao Z.H., Shih K.M., Hou L.A., Chen D.Y., Kong L.J. Ultrasound assisted zero valent iron corrosion for peroxymonosulfate activation for Rhodamine-B degradation. Chemosphere. 2019;228:412–417. doi: 10.1016/j.chemosphere.2019.04.164. [DOI] [PubMed] [Google Scholar]
- 9.Li M., Liu Z., Yao W., Xu C., Yu Y., Yang M., Chen G. Ultrasonic cavitation-enabled microfluidic approach toward the continuous synthesis of cesium lead halide perovskite nanocrystals. Chin. J. Chem. Eng. 2022 [Google Scholar]
- 10.Moftakhari Anasori Movahed S., Calgaro L., Marcomini A. Trends and characteristics of employing cavitation technology for water and wastewater treatment with a focus on hydrodynamic and ultrasonic cavitation over the past two decades: A Scientometric analysis. Sci. Total Environ. 2023;858:159802. doi: 10.1016/j.scitotenv.2022.159802. [DOI] [PubMed] [Google Scholar]
- 11.Wang Y., An Y., Hou G., Zhao X., Zhou H., Chen J. Effect of cooling rate during annealing on microstructure and ultrasonic cavitation behaviors of Ti6Al4V alloy. Wear. 2023;512-513:204529. [Google Scholar]
- 12.Khataee A., Karimi A., Arefi-Oskoui S., Darvishi Cheshmeh Soltani R., Hanifehpour Y., Soltani B., Joo S.W. Sonochemical synthesis of Pr-doped ZnO nanoparticles for sonocatalytic degradation of Acid Red 17. Ultrason. Sonochem. 2015;22:371–381. doi: 10.1016/j.ultsonch.2014.05.023. [DOI] [PubMed] [Google Scholar]
- 13.Eskandarloo H., Badiei A., Behnajady M.A., Ziarani G.M. Ultrasonic-assisted degradation of phenazopyridine with a combination of Sm-doped ZnO nanoparticles and inorganic oxidants. Ultrason. Sonochem. 2016;28:169–177. doi: 10.1016/j.ultsonch.2015.07.012. [DOI] [PubMed] [Google Scholar]
- 14.Zhang D.R., Liu H.L., Han S.Y., Piao W.X. Synthesis of Sc and V-doped TiO2 nanoparticles and photodegradation of rhodamine-B. J. Ind. Eng. Chem. 2013;19(6):1838–1844. [Google Scholar]
- 15.Khataee A., Kayan B., Gholami P., Kalderis D., Akay S., Dinpazhoh L. Sonocatalytic degradation of Reactive Yellow 39 using synthesized ZrO2 nanoparticles on biochar. Ultrason. Sonochem. 2017;39:540–549. doi: 10.1016/j.ultsonch.2017.05.023. [DOI] [PubMed] [Google Scholar]
- 16.Ajormal F., Moradnia F., Taghavi Fardood S., Ramazani A. Zinc ferrite nanoparticles in photo-degradation of dye: Mini-review. J Chem. Rev. 2020;2(2):90–102. [Google Scholar]
- 17.Li Y., Chen H., Wang L., Wu T., Wu Y., He Y. KNbO3/ZnO heterojunction harvesting ultrasonic mechanical energy and solar energy to efficiently degrade methyl orange. Ultrason. Sonochem. 2021;78 doi: 10.1016/j.ultsonch.2021.105754. [DOI] [PMC free article] [PubMed] [Google Scholar]
- 18.Li Z., Zhang Q., Wang L., Yang J., Wu Y., He Y. Novel application of Ag/PbBiO2I nanocomposite in piezocatalytic degradation of rhodamine B via harvesting ultrasonic vibration energy. Ultrason. Sonochem. 2021;78 doi: 10.1016/j.ultsonch.2021.105729. [DOI] [PMC free article] [PubMed] [Google Scholar]
- 19.Wang L., Wang J., Ye C., Wang K., Zhao C., Wu Y., He Y. Photodeposition of CoOx nanoparticles on BiFeO3 nanodisk for efficiently piezocatalytic degradation of rhodamine B by utilizing ultrasonic vibration energy. Ultrason. Sonochem. 2021;80 doi: 10.1016/j.ultsonch.2021.105813. [DOI] [PMC free article] [PubMed] [Google Scholar]
- 20.Zheng S., Li X., Zhang J., Wang J., Zhao C., Hu X., Wu Y., He Y. One-step preparation of MoOx/ZnS/ZnO composite and its excellent performance in piezocatalytic degradation of Rhodamine B under ultrasonic vibration. J. Environ. Sci. (China) 2023;125:1–13. doi: 10.1016/j.jes.2021.10.028. [DOI] [PubMed] [Google Scholar]
- 21.Ning X., Hao A., Cao Y., Hu J., Xie J., Jia D. Effective promoting piezocatalytic property of zinc oxide for degradation of organic pollutants and insight into piezocatalytic mechanism. J. Colloid Interf. Sci. 2020;577:290–299. doi: 10.1016/j.jcis.2020.05.082. [DOI] [PubMed] [Google Scholar]
- 22.Lei H., Zhang H., Zou Y., Dong X., Jia Y., Wang F. Synergetic photocatalysis/piezocatalysis of bismuth oxybromide for degradation of organic pollutants. J. Alloys Compd. 2019;809 [Google Scholar]
- 23.Kaegi R., Voegelin A., Sinnet B., Zuleeg S., Hagendorfer H., Burkhardt M., Siegrist H. Behavior of metallic silver nanoparticles in a pilot wastewater treatment plant. Environ. Sci. Technol. 2011;45(9):3902–3908. doi: 10.1021/es1041892. [DOI] [PubMed] [Google Scholar]
- 24.Chen Y., Chen H., Zheng X., et al. The impacts of silver nanoparticles and silver ions on wastewater biological phos- phorous removal and the mechanisms. J. Hazard. Mater. 2012;239–240:88–94. doi: 10.1016/j.jhazmat.2012.07.049. [DOI] [PubMed] [Google Scholar]
- 25.Cervantes-Aviles P., Huang Y., Keller A.A., et al. Multi- technique approach to study the stability of silver nanoparti- cles at predicted environmental concentrations in wastewater. Water Res. 2019;166 doi: 10.1016/j.watres.2019.115072. [DOI] [PubMed] [Google Scholar]
- 26.Nayak D., Ashe S., Rauta P.R., Kumari M., Nayak B. Bark extract mediated green synthesis of silver nanoparticles: Evaluation of antimicrobial activity and antiproliferative response against osteosarcoma. Mater Sci. Eng. C. Mater Biol. Appl. 2016;58:44–52. doi: 10.1016/j.msec.2015.08.022. [DOI] [PubMed] [Google Scholar]
- 27.Emam H.E., Ahmed H.B. Polysaccharides templates for assembly of nanosilver. Carbohydr. Polym. 2016;135:300–307. doi: 10.1016/j.carbpol.2015.08.095. [DOI] [PubMed] [Google Scholar]
- 28.Singh P., Kim Y.J., Zhang D., Yang D.C. Biological synthesis of nanoparticles from plants and microorganisms. Trends Biotechnol. 2016;34:588–599. doi: 10.1016/j.tibtech.2016.02.006. [DOI] [PubMed] [Google Scholar]
- 29.Otari S.V., Patil R.M., Ghosh S.J., Pawar S.H. Green phytosynthesis of silver nanoparticles using aqueous extract of Manilkara zapota (L.) seeds and its inhibitory action against Candida species. Mater. Lett. 2014;116:367–369. [Google Scholar]
- 30.Wang J., Ge B., Li Z., Guan F., Li F. Structural analysis and immunoregulation activity comparison of five polysaccharides from Angelica sinensis. Carbohydr. Polym. 2016;140:6–12. doi: 10.1016/j.carbpol.2015.12.050. [DOI] [PubMed] [Google Scholar]
- 31.Hou C., Yin M., Lan P., Wang H., Nie H., Ji X. Recent progress in the research of Angelica sinensis (Oliv.) Diels polysaccharides: extraction, purification, structure and bioactivities. Chem. Biol. Technol. Agricul. 2021;8:1. [Google Scholar]
- 32.Ai S., Fan X., Fan L., Sun Q., Liu Y., Tao X., Dai K. Extraction and chemical characterization of Angelica sinensis polysaccharides and its antioxidant activity. Carbohydr. Polym. 2013;94:731–736. doi: 10.1016/j.carbpol.2013.02.007. [DOI] [PubMed] [Google Scholar]
- 33.Ledesma A.E., Chemes D.M., Frías M.d.l.A., Guauque Torres M.d.P. Spectroscopic characterization and docking studies of ZnO nanoparticle modified with BSA. Appl. Surf. Sci. 2017;412:177–188. [Google Scholar]
- 34.Chan Y.Y., Pang Y.L., Lim S., Chong W.C. Sonocatalytic degradation of Congo red by using green synthesized silver doped zinc oxide nanoparticles. Mater. Today:. Proc. 2021;46:1948–1953. [Google Scholar]
- 35.Jun B.-M., Kim Y., Yoon Y., Yea Y., Park C.M. Enhanced sonocatalytic degradation of recalcitrant organic contaminants using a magnetically recoverable Ag/Fe-loaded activated biochar composite. Ceram. Int. 2020;46:22521–22531. [Google Scholar]
- 36.Li X., Wang J., Zhang J., Zhao C., Wu Y., He Y. Cadmium sulfide modified zinc oxide heterojunction harvesting ultrasonic mechanical energy for efficient decomposition of dye wastewater. J. Colloid. Interface Sci. 2022;607:412–422. doi: 10.1016/j.jcis.2021.09.004. [DOI] [PubMed] [Google Scholar]
- 37.Ping Y., Zhang J., Xing T., Chen G., Tao R., Choo K.-H. Green synthesis of silver nanoparticles using grape seed extract and their application for reductive catalysis of Direct Orange 26. J. Ind. Eng. Chem. 2018;58:74–79. [Google Scholar]
- 38.Rahimi-Nasrabadi M., Pourmortazavi S.M., Shandiz S.A., Ahmadi F., Batooli H. Green synthesis of silver nanoparticles using Eucalyptus leucoxylon leaves extract and evaluating the antioxidant activities of extract. Nat Prod Res. 2014;28:1964–1969. doi: 10.1080/14786419.2014.918124. [DOI] [PubMed] [Google Scholar]
- 39.Andrea T., Chiara P., Ivan D., Eleonora M., Monica B., Tommaso S., Sabrina S., Gianluca T., Renato G., Sergio P. Non-cytotoxic silver nanoparticle-polysaccharide nanocomposites with antimicrobial activity. Biomacromolecules. 2009;10:1429–1435. doi: 10.1021/bm900039x. [DOI] [PubMed] [Google Scholar]
- 40.Siddiquee M.A., Parray M.U.D., Mehdi S.H., Alzahrani K.A., Alshehri A.A., Malik M.A., Patel R. Green synthesis of silver nanoparticles from Delonix regia leaf extracts: In-vitro cytotoxicity and interaction studies with bovine serum albumin. Mater. Chem. Phys. 2020;242 [Google Scholar]
- 41.Ai S., Fan X., Fan L., Sun Q., Liu Y., Tao X., Dai K. Extraction and chemical characterization of Angelica sinensis poly-saccharides and its antioxidant activity. Carbohydr. Polym. 2013;94:731–736. doi: 10.1016/j.carbpol.2013.02.007. [DOI] [PubMed] [Google Scholar]
- 42.Jian W., Zhang L., Siu K.C., Song A., Wu J.Y. Formation and physiochemical properties of silver nanoparticles with various exopolysaccharides of a medicinal fungus in aqueous solution. Molecules. 2016;22:1. doi: 10.3390/molecules22010050. [DOI] [PMC free article] [PubMed] [Google Scholar]
- 43.Ahmed S., Ahmad M., Swami B.L., Ikram S. A review on plants extract mediated synthesis of silver nanoparticles for antimicrobial applications: A green expertise. J. Adv. Res. 2016;7:17–28. doi: 10.1016/j.jare.2015.02.007. [DOI] [PMC free article] [PubMed] [Google Scholar]
- 44.Ma Z., Liu J., Liu Y., Zheng X., Tang K. Green synthesis of silver nanoparticles using soluble soybean polysaccharide and their application in antibacterial coatings. Int. J. Biol. Macromol. 2021;166:567–577. doi: 10.1016/j.ijbiomac.2020.10.214. [DOI] [PubMed] [Google Scholar]
- 45.Du J., Hu Z., Dong W.-J., Wang Y., Wu S., Bai Y. Biosynthesis of large-sized silver nanoparticles using Angelica keiskei extract and its antibacterial activity and mechanisms investigation. Microchem. J. 2019;147:333–338. [Google Scholar]
- 46.Chen X., Yan J.-K., Wu J.-Y. Characterization and antibacterial activity of silver nanoparticles prepared with a fungal exopolysaccharide in water. Food Hydrocoll. 2016;53:69–74. [Google Scholar]
- 47.Singh H., Du J., Singh P., Yi T.H. Ecofriendly synthesis of silver and gold nanoparticles by Euphrasia officinalis leaf extract and its biomedical applications. Artif. Cells Nanomed. Biotechnol. 2018;46:1163–1170. doi: 10.1080/21691401.2017.1362417. [DOI] [PubMed] [Google Scholar]
- 48.Du J., Singh H., Yi T.H. Antibacterial, anti-biofilm and anticancer potentials of green synthesized silver nanoparticles using benzoin gum (Styrax benzoin) extract. Bioprocess Biosyst. Eng. 2016;39:1923–1931. doi: 10.1007/s00449-016-1666-x. [DOI] [PubMed] [Google Scholar]
- 49.Lu W., Senapati D., Wang S., Tovmachenko O., Singh A.K., Yu H., Ray P.C. Effect of surface coating on the toxicity of silver nanomaterials on human skin keratinocytes. Chem. Phys. Lett. 2010;487(1-3):92–96. doi: 10.1016/j.cplett.2010.01.027. [DOI] [PMC free article] [PubMed] [Google Scholar]
- 50.Sharma V.K., Yngard R.A., Lin Y. Silver nanoparticles: green synthesis and their antimicrobial activities. Adv. Colloid. Interface Sci. 2009;145:83–96. doi: 10.1016/j.cis.2008.09.002. [DOI] [PubMed] [Google Scholar]
- 51.Nai J., Zhang C., Shao H., Li B., Li H., Gao L., Dai M., Zhu L., Sheng H. Extraction, structure, pharmacological activities and drug carrier applications of Angelica sinensis polysaccharide. Int. J. Biol Macromol. 2021;183:2337–2353. doi: 10.1016/j.ijbiomac.2021.05.213. [DOI] [PubMed] [Google Scholar]
- 52.De Faria A.F., Martinez D.S.T., Meira S.M.M., De Moraes A.C.M., Brandelli A., Filho A.G.S., et al. Anti-adhesion and antibacterial activity of silver nanoparticles supported on graphene oxide sheets. Colloids. Surf, B. 2014;113:115–124. doi: 10.1016/j.colsurfb.2013.08.006. [DOI] [PubMed] [Google Scholar]
- 53.Liu H., Hao C., Zhang Y., Yang H., Sun R. The interaction of graphene oxide-silver nanoparticles with trypsin: Insights from adsorption behaviors, conformational structure and enzymatic activity investigations. Colloids. Surf. B Biointerfaces. 2021;202 doi: 10.1016/j.colsurfb.2021.111688. [DOI] [PubMed] [Google Scholar]
- 54.Vanaamudan A., Soni H., Sudhakar P.P. Palm shell extract capped silver nanoparticles—as efficient catalysts for degradation of dyes and as SERS substrates. J. Mol. Liq. 2016;215:787–794. [Google Scholar]
- 55.Abd-Elnaby H.M., Abo-Elala G.M., Abdel-Raouf U.M., Hamed M.M. Antibacterial and anticancer activity of extracellular synthesized silver nanoparticles from marine Streptomyces rochei MHM13. Egypt. J. Aquat. Res. 2016;42:301–312. [Google Scholar]
- 56.Veisi H., Moradi S.B., Saljooqi A., Safarimehr P. Silver nanoparticle-decorated on tannic acid-modified magnetite nanoparticles (Fe3O4@TA/Ag) for highly active catalytic reduction of 4-nitrophenol, Rhodamine B and Methylene blue. Mater Sci. Eng. C. Mater Biol. Appl. 2019;100:445–452. doi: 10.1016/j.msec.2019.03.036. [DOI] [PubMed] [Google Scholar]
- 57.Lin H.-P., Chen C.-C., Lee W.W., Lai Y.-Y., Chen J.-Y., Chen Y.-Q., Fu J.-Y. Synthesis of a SrFeO3−x/g-C3N4 heterojunction with improved visible-light photocatalytic activities in chloramphenicol and crystal violet degradation. RSC Adv. 2016;6(3):2323–2336. [Google Scholar]
- 58.Feng H.R., Wang J.A., Wang L., Jin J.M., Wu S.W., Zhou C.C. Study on a novel omnidirectional ultrasonic cavitation removal system for Microcystis aeruginosa. Ultrason. Sonochem. 2022;86 doi: 10.1016/j.ultsonch.2022.106008. [DOI] [PMC free article] [PubMed] [Google Scholar]
- 59.Cao P., Hao C., Li B., Jiang H., Liu Y. Effect of ruptured cavitated bubble cluster on the extent of the cell deformation by ultrasound. Ultrason. Sonochem. 2021;80 doi: 10.1016/j.ultsonch.2021.105843. [DOI] [PMC free article] [PubMed] [Google Scholar]
- 60.Cao P., Hao C., Ma C., Yang H., Sun R. Physical field simulation of the ultrasonic radiation method: An investigation of the vessel, probe position and power. Ultrason. Sonochem. 2021;76 doi: 10.1016/j.ultsonch.2021.105626. [DOI] [PMC free article] [PubMed] [Google Scholar]
- 61.Raza S., Raza M., Zada S., Li X., Liu C. Fabrication of biomass-derived polymer with dopamine and Ag nanoaggregates: Prevention of the biofilm of bacteria and catalytic degradation of organic dyes. Eur. Polym. J. 2021;157:110635. [Google Scholar]
Associated Data
This section collects any data citations, data availability statements, or supplementary materials included in this article.
Data Availability Statement
The data that has been used is confidential.