

Abstract
The dairy goat is one of the earliest dairy livestock species, which plays an important role in the economic development, especially for developing countries. With the development of agricultural civilization, dairy goats have been widely distributed across the world. However, few studies have been conducted on the specific characteristics of dairy goat. In this study, we collected the whole-genome data of 89 goat individuals by sequencing 48 goats and employing 41 publicly available goats, including five dairy goat breeds (Saanen, Nubian, Alpine, Toggenburg, and Guanzhong dairy goat; n = 24, 15, 11, 6, 6), and three goat breeds (Guishan goat, Longlin goat, Yunshang Black goat; n = 6, 15, 6). Through compared the genomes of dairy goat and non-dairy goat to analyze genetic diversity and selection characteristics of dairy goat. The results show that the eight goats could be divided into three subgroups of European, African, and Chinese indigenous goat populations, and we also found that Australian Nubian, Toggenburg, and Australian Alpine had the highest linkage disequilibrium, the lowest level of nucleotide diversity, and a higher inbreeding coefficient, indicating that they were strongly artificially selected. In addition, we identified several candidate genes related to the specificity of dairy goat, particularly genes associated with milk production traits (GHR, DGAT2, ELF5, GLYCAM1, ACSBG2, ACSS2), reproduction traits (TSHR, TSHB, PTGS2, ESR2), immunity traits (JAK1, POU2F2, LRRC66). Our results provide not only insights into the evolutionary history and breed characteristics of dairy goat, but also valuable information for the implementation and improvement of dairy goat cross breeding program.
Keywords: dairy goat, genetic diversity, population structure, selective signal, milk production traits
1 Introduction
The domestication of animals and plants facilitated the emergence of Neolithic agriculture. The goat is one of the oldest livestock species, which was domesticated about 10,000 years ago in the Zagros Mountains of the Fertile Crescent (Zeder and Hesse, 2000). Originally, goats were raised for meat. However, around 5,000 years ago, humans began to obtain secondary products from goats, including wool, skin, and milk (Chessa et al., 2009). With the development of agricultural civilization, humans began to select goat breeds according to the products they needed, such as milk goat, meat goat, and wool goat, and represents the earliest known instance of the breeding of goats (Alberto et al., 2018). The dairy goat is one of the most important dairy livestock species, not only providing humans with nutritious milk, but also meat, wool, and animal hide, as well as playing a vital role in animal husbandry. With the migrations of humans, there are 220 million individuals of over 200 dairy goat breeds are found across the world (FAOSTAT, 2020). After long-term artificial selection, the milk production characteristics of the modern dairy goat has become more significant. Saanen, Alpine, and Toggenburg are famous for high milk yield, with an average milk yield of 900 kg in 305 days, while Indian Beetal milk production in 190 days is 200 kg (Devendra and Haenlein, 2016).
Goats are considered the “cows of the poor.” As early as the Neolithic period, humans began to raise small groups of goats to obtain milk, producing milk much earlier than cow (Zervas and Tsiplakou, 2011). Compared with cow milk, goat milk has a higher content of growth active factors and is more similar to human milk, with the characteristics of small milk fat particles, easy digestion, and hypoallergenic properties (Clark and Mora García, 2017; Gallier et al., 2020). Furthermore, goat milk has a lower concentration of αs1-casein and a higher concentration of β-Casein, and can be used to produces cheese that is softer and higher in moisture than cow’s milk. Thus, goat milk is favored by consumers as a high-quality milk. However, the price of this milk is much higher than cow’s milk because of its high nutritional value and low yield. Furthermore, as the main food source of newborn goats, goat milk plays an important role in the growth and development of offspring. However, the prolific nanny goat is usually unable to feed multiple offspring, which leads to the decline of the survival rate and restricts the development of industry. Therefore, there is a need important to identify the genes related to milk production traits in order to cultivate goat breeds with high milk yields.
Natural and artificial selection have left footprints on the domestic animal genome, and genome-wide selection signal detection has become an important method to explore breed specificity and selection signatures in domestic animals (Qanbari and Simianer, 2014). Milk production traits are important economic traits and the most significant selection characteristics of dairy goat. At present, studies on candidate genes for milk production traits have been carried out in goat and sheep, such as Assaf sheep (Marina et al., 2020), Churra sheep (García-Gámez et al., 2012), Valle del Belice sheep (Di Gerlando et al., 2019), Alpine and Nubian (Scholtens et al., 2020), and some genes related to milk production have been revealed (LALBA, SPP1, ABCG2). However, previous studies have mainly used SNP arrays, which resulted in limited SNP sites and coverage depth, as well as potential deviations in the chip design process. In addition, these studies have used goat and sheep reference genomes rather than dairy goat or sheep reference genomes, which would result in incomplete variation detection. Thus, many selection signals may have remained undiscovered.
In this study, we used high-quality dairy goat reference genome (Saanen_v1) (Li et al., 2021b) and the whole genome re-sequencing data of 89 goats to conduct the comparative genomic analysis of dairy goats and non-dairy goats. We not only investigated the genetic relationships and population structure among dairy goat breeds, but also revealed the genetic diversity of dairy goat breeds. In addition, we applied two different statistics approach, the ratio of nucleotide diversity (θπnon-dairy/dairy) and the fixation index value (F ST), to detect selection signature for populations of dairy goats. We further identified genes related to milk production traits and provided a potential theoretical basis for dairy goat breeding.
2 Materials and methods
2.1 Sample collection, DNA extraction, and sequencing
Eight goat populations were collected from Yunnan and Shanxi provinces as follows: Guishan goat (GS, n = 6), Yunshang Black goat (YSB, n = 6), Toggenburg (TG, n = 6), and Nubian (CNB, n = 6) were collected from Yunnan Province; Guanzhong dairy goat (GZ, n = 6), Australian Saanen (ASN, n = 6), New Zealand Saanen (NSN, n = 6), New Zealand Alpine (NAP, n = 4) and Australian Alpine (AAP, n = 2) were collected from Shanxi Province (Figure 1). We collected 5 ml blood from the jugular vein of each goat. The genomic DNA was extracted from the blood using the standard phenol-chloroform method. The qualified genomic DNA was used to construct a paired-end library with an insert size of 350 bp, which was then sequenced on the Illumina NovaSeq PE150 platform at the Novogene Bioinformatics Technology Company (Beijing, China). In addition, to make the selection analysis between dairy and non-dairy goat more reliable, we also downloaded 41 publicly-available genomes of six populations (Australian Alpine (AAP*, n = 5), Longlin goat (LL, n = 15), Australian Nubian (ANB, n = 5), Chinese Nubian (CNB*, n = 4), Korean Saanen (KSN, n = 10), and Australian Saanen (ASN*, n = 2) from NCBI to increase the sample size.
FIGURE 1.

Sample information and geographic distribution of the 89 goats included in this study. [Guishan goat (GS, n = 6), Yunshang black goat (YSB, n = 6), Toggenburg (TG, n = 6), and Chinese Nubian (CNB, n = 6) were collected from Yunnan Province, Guanzhong dairy goat (GZ, n = 6), Australian Saanen (ASN, n = 6), New Zealand Saanen (NSN, n = 6), Australian Alpine (AAP, n = 2) and New Zealand Alpine (NAP, n = 4) were collected from Shanxi Province. Australian Alpine* (AAP*, n = 5), Longlin goat (LL, n = 15), Australian Nubian (ANB, n = 5), Chinese Nubian* (CNB*, n = 4), Korean Saanen (KSN, n = 10), Australian Saanen* (ASN*, n = 2) were downloaded from NCBI].
2.2 Sequence read mapping and variant annotation
The paired-end reads of the 89 samples were mapped onto the goat reference genome Saanen_v1 (https://www.ncbi.nlm.nih.gov/assembly/GCA_015443085.1) by the Burrows-Wheeler Aligner v.0.7.8 (Li and Durbin, 2009) using the parameters (Parameters: mem-t 4-k 32 -M). The mapped BAM files were sorted SAMtools v.1.3.1 (Li et al., 2009), and duplicate reads were removed using Picard toolkit (http://broadinstitute.github.io/picard). Then SAMtools (mpileup-m 2-F 0.002-d 10000000) and Genome Analysis Toolkit (GATK v.3.7) Unified Genotyper (McKenna et al., 2010) were used to extract the variant, and GATK Variant Filtration was used to detect the SNP of 89 samples to screen for high-quality SNPs. The filter settings were as follows: Quality by Depth (QD) <2.0, SNPs with missing rates (Miss) ≥.1, and minor allele frequencies (MAF) <0.05. All sample sets of filtered variant calls were used for imputation and phasing using Beagle v5.2 software (Browning et al., 2021). All SNPs were annotated using the ANNOVAR (Wang et al., 2010) based on the GFF file of the goat reference genome Saanen_v1.
2.3 Population genetic analysis
We used MEGA X to construct a neighbor-joining (NJ) tree for all samples based on the pairwise Hamming genetic distances matrix supplied by PLINK v1.9 (Purcell et al., 2007). The resulting NJ tree was visualized using Evolview (Subramanian et al., 2019). Principal component analysis (PCA) was performed using PLINK v1.9. In addition, the population structure was assessed using ADMIXTURE v1.3.0 (Alexander et al., 2009) with default setting. The number of assumed ancestry population K ranged from 2 to 8.
2.4 General genomic characteristics
Linkage disequilibrium (LD) coefficients between all pairwise SNPs in each population were calculated using PopLDdecay v3.40 (Zhang et al., 2019). Nucleotide diversity (π) was calculated for each population using a 25-kb sliding window with a 50-kb window size using VCFtools (Danecek et al., 2011). The runs of homozygosity (ROH) of each individual was detected by PLINKv1.9, and the genomic inbreeding coefficient of each individual based on ROH (F ROH) was calculated. Then, one-way ANOVA (analysis of variance) was used to test the significance between nucleotide diversity and inbreeding coefficient of each population. To understand the evolutionary history of the population, SNePv1.1 (Barbato et al., 2015) was used to estimate the effective population size (Ne) of each population before 1,000 generations.
2.5 Detection of selective sweeps
According to goat breed specificity, we divided the 89 goats into dairy goats and non-dairy goats. Then, we compared the genomes of dairy goats to those of the non-dairy goats. Selective signal sweep regions were detected according to the combinations of two parameters: the ratio of nucleotide diversity (θπnon-dairy/dairy) and fixation index value (F ST), which were estimated using VCFtools with a 50 kb sliding window and a 25 kb sliding step. In addition, we also calculated Tajima’s D statistic using VCFtools with a 25-kb window size to confirm the selective signals at chromosome 13. Candidate genes were annotated by the sweep regions detected from the intersection of the two parameters with a top 5% threshold, Bedtools (Quinlan and Hall, 2010) was used to annotate the selected regions for subsequent analysis.
2.6 Functional enrichment analysis
Enrichment analysis was performed using Gene Ontology (GO) and Kyoto Encyclopedia of Genes and Genomes (KEGG) pathway analysis to identify functional clusters of candidate genes. GO and KEGG enrichment analyses were performed using the OmicShare tool (http://www.omicshare.com/tools) and the number of significant genes for each term was determined using p ≤ 0.05 as the significance threshold.
3 Results
3.1 Genome sequence mapping and SNPs
The whole-genome data for 48 goats was generated and publicly available whole genome data for an additional 41 goats was collected. The whole-genome data of the 89 individual goats comprised that of eight goat breeds Guishan goat (GS), Yunshang Black goat (YSB), Longlin goat (LL), Toggenburg (TG), Guanzhong dairy goat (GZ), Nubian, Saanen, Alpine. The Nubian and Alpine breeds consist of three sub-populations [Australia Nubian (ANB), Chinese Nubian (CNB), Chinese Nubian (CNB*), and Australia Alpine (AAP), New Zealand Alpine (NAP), Australia Alpine (AAP*), respectively], while the Saanen breed consists of four sub-populations [New Zealand Saanen (NSN), Korean Saanen (KSN), Australia Saanen (ASN), Australia Saanen (ASN*)]. We generated a total of 4857G of clean data with an average depth of 31.15× for 48 samples using the whole genome sequencing method. The average sequence depth was 12.45× for 41 publicly-available genomes of six goat populations. We aligned the 89 goats 6382.6G of data with the Saanen reference genome (Saanen_v1). The average alignment rate was 99.7% and covered 98% of the reference genome. SNP is the most common genetic variation, after mapping and SNP calling, a total of 1,87,96,804 SNPs were identified from the 89 goat samples. The transitions/transversions ratio was 2.338, which is similar to the results obtained for others goats (Guan et al., 2016). The majority of the SNPs were found in the intergenic (66.05%) and intronic (29.86%) regions, while only a small number of the SNPs (0.407%) with 29,550 non-synonymous SNPs and 46,749 synonymous SNPs were found in the exonic region (Table 1).
TABLE 1.
Summary and annotation of SNPs.
| Category | Number of SNPs | Percentage of total (%) | |
|---|---|---|---|
| Upstream | 1,17,141 | 0.62 | |
| Exonic | Stop gain | 236 | 0.0013 |
| Stop loss | 40 | 0.00021 | |
| Synonymous | 46,749 | 0.25 | |
| Non-synonymous | 29,550 | 0.16 | |
| Intronic | 56,12,654 | 29.86 | |
| Splicing | 290 | 0.0015 | |
| Downstream | 1,23,076 | 0.66 | |
| Upstream/Downstream | 3,906 | 0.02 | |
| Intergenic | 1,24,14,709 | 66.05 | |
| ts | 1,31,65,437 | ||
| tv | 56,30,367 | ||
| ts/tv | 2.338 | ||
| Total | 1,87,95,804 |
3.2 Population structure and relationships
To identify the genetic and evolutionary relationship among the 15 goat populations, neighbor-joining (NJ) tree, principal component analysis (PCA) and population structure analysis were used. Based on autosomal SNPs, we constructed an NJ tree for the 89 individuals. The results showed that the 89 goats were divided into four groups, and the same goats breed from different regions were grouped (Figure 2A). First of all, Saanen (ASN, NSN, KSN, and ASN*), Alpine (AAP, NAP, and AAP*), TG were clustered together, while GZ was closely related to them. Then, Nubian (ANB, CNB, and CNB*) and YSB were clustered. Finally, GS and LL were clustered. To further explore the genetic relationship between goat breeds, we performed principal component analysis (PCA) (Figures 2B, C). The first eigenvector (PC1) explained 53% of the total genetic variation, from which the goat populations were divided into the Asian-African and European goat populations. The second eigenvector (PC2) explained 30% of the total genetic variation and separated the goats into Asian (LL, GS) and African (YSB, ANB, CNB, CNB*) goat populations. The third eigenvector (PC3) explained 17% of the total genetic variation, clearly distinguishing the Saanen (ASN, NSN, KSN, ASN*) and GZ from the European population. In the structure analysis calculated ranging from K = 2 to K = 8, we obtained the most reasonable biological interpretation and minimum crossover error at K = 4. At K = 2, LL, GS, YSB, CNB*, CNB, and ANB were separated with having a common genomic composition (blue color), indicating that the Asian-African and European populations were separated. At K = 4, Saanen (ASN, NSN, KSN, and ASN*) and GZ were further separated, and GZ was found to have a highly mixed genomic composition, which is consistent with the history of breed development (Figure 2D). Based on the results of the population genetic relationship analysis, the same breeds from the same regions were combined to increase the sample size, such as Australian Saanen [ASN (ASN and ASN*)] and Australian Alpine [AAP (AAP and AAP*)].
FIGURE 2.

(A) Neighbor-joining (NJ) tree of the 89 individuals based on the matrix of Hamming genetic distance, different colors represent different populations. (B) Plots of the first and the second principal components for the 89 individuals. (C) Plots of the first and the third principal components for the 89 individuals. (D) Ancestry proportions of each sample using k = 2–4.
3.3 Population genetic diversity genomic characteristics
To evaluate the genetic diversity and genomic characteristics of the studied goat populations, we calculated the linkage disequilibrium decay (LD), nucleotide diversity (π), inbreeding coefficient, and effective population size (Ne) of the different goat populations. LD analysis showed that the average LD (r2) of all populations decreased rapidly at 0–50 kb and reached a plateau at around 200 kb. With distance markers of 300 kb, the average LD (r2) was highest in ANB, followed by TG, NAP, and AAP. However, the average LD (r2) of the LL was the lowest and decayed significantly faster than other populations (Figure 3A). Nucleotide diversity analysis showed that the average nucleotide diversity of ANB was the lowest and was extremely significantly lower than that of other goat populations (p < 0.01). However, the average nucleotide diversity of NSN was the highest, which was significantly higher than all goat populations except KSN and NAP (p < 0.01) (Table 2). In addition, we also calculated the average inbreeding coefficient (F ROH) of each goat population based on ROH (run of homozygosity). The results showed that the average inbreeding coefficient of AAP was the highest, which was significantly higher than that of all goat populations except TG and ANB (p < 0.01). The effective population size of 13 goat populations was predicted, and the results showed that the effective population size of LL was significantly higher than other goat populations, while ANB was significantly lower than the other goat populations (Figure 3B). At 1,000 generations ago, LL (2,491) was the highest, followed by the KSN (2,338) and ASN (1,950), and the ANB (874) the lowest.
FIGURE 3.
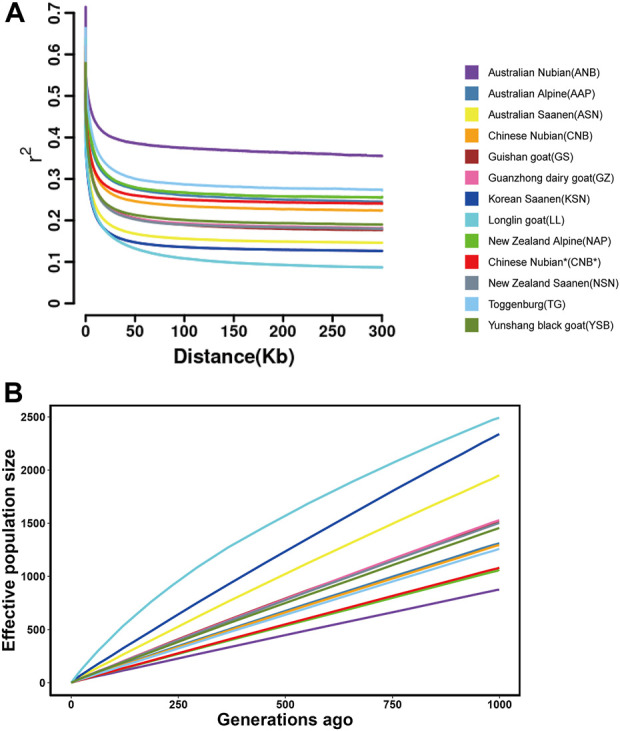
(A) Genome-wide average linkage disequilibrium decay in each population. (B) The effective population size of each population in recent 1,000 generations ago.
TABLE 2.
The summary of nucleotide diversity and inbreeding coefficient for 13 goat populations.
| Population | Abbreviation | Nucleotide diversity | Inbreeding coefficient (F ROH) |
|---|---|---|---|
| Mean ± SE1 | Mean ± SE1 | ||
| Australian Alpine | AAP | 0.00142 ± 0.00000274I | 0.204,257 ± 0.018853A |
| Toggenburg | TG | 0.001449 ± 0.00000275H | 0.16849 ± 0.014867AB |
| Australian Nubian | ANB | 0.001203 ± 0.00000265J | 0.16062 ± 0.032968AB |
| Guanzhong dairy goat | GZ | 0.001692 ± 0.00000287E | 0.136,827 ± 0.022484BC |
| Chinese Nubian | CNB | 0.001676 ± 0.00000285F | 0.131,692 ± 0.014115BC |
| Yunshang Black goat | YSB | 0.001749 ± 0.00000291C | 0.113,076 ± 0.011341BCD |
| New Zealand Alpine | NAP | 0.001783 ± 0.00000304AB | 0.100,103 ± 0.00728CDE |
| New Zealand Saanen | NSN | 0.001785 ± 0.00000296A | 0.093629 ± 0.007288CDE |
| Australian Saanen | ASN | 0.001773 ± 0.00000293B | 0.092642 ± 0.01102CDE |
| Korean Saanen | KSN | 0.001779 ± 0.00000294AB | 0.089476 ± 0.009852CDE |
| Longlin goat | LL | 0.001545 ± 0.00000265G | 0.084156 ± 0.005976CDE |
| Guishan goat | GS | 0.001715 ± 0.00000289D | 0.066048 ± 0.005825DE |
| Chinese Nubian* | CNB* | 0.001752 ± 0.00000288C | 0.041668 ± 0.008752E |
Note: SE is the abbreviation of standard error. Different capital letters in the same column indicate significant differences between populations (p < 0.01), while the same letters indicate no significant differences.
*represents the data downloaded from NCBI. This is to distinguish it from our sequencing data.
3.4 Selective signals in dairy goat
To identify the specificity of dairy goat, we compared the genomes of dairy goats with those of non-dairy goats by calculating the ratio of nucleotide diversity (θπnon-dairy/dairy) and pairwise genetic differentiation (F ST) with a 50 kb sliding window and a 25 kb sliding step. The top 5% threshold outlier windows of the two methods were combined, which was considered to be the specific region of dairy goats under positive selection (F ST = 0.17, θπ ratio = 1.25) (Figures 4A, B). As a result, we identified a total of 1,315 genomic regions under selective sweep covering or being near to 876 candidate genes that were associated with dairy goat specificity traits (Figure 4C). Furthermore, we found that the region of 53.2–53.4 Mb in chromosome 13 showed an extreme F ST, a higher value of the ratio of θπ, and a negative value of Tajima’s D (Figure 4D). This suggests that this region may be associated with the breed-specificity of dairy goat. In this region, 16 candidate genes have been annotated, which are related to reproduction, immunity, growth and development traits.
FIGURE 4.

(A) Identification of selective signals (F ST Manhattan plot). (B) Identification of selective signals (the θπ ratio Manhattan plot). (C) Distribution of log2 (θπ ratios) and F ST values calculated in 50-kb sliding windows between dairy goat and non-dairy goat. (D) Selective sweep on chromosome 13 (53.2–53.4 Mb) (gray area).
The functional enrichment analysis of 876 selected candidate genes showed that 40 GO entries were significantly enriched (p < 0.05), such as protein binding, desmosome, regulation of the cellular metabolic process, regulation of the biological process, and protein catabolic process. In addition, 15 KEGG pathways were found to be significantly enriched (p < 0.05), including GnRH secretion, protein export, and the Hedgehog signaling pathway.
Through selection feature analysis, we found that some regions were strongly selected by positive selection. The candidate genes annotated in these regions included LRRC66, PRPF6, EIF5B, NPBWR2, ZNF512B, AAAS, NRAS, SOX18, RGS19. Based on gene function enrichment and references, we found that some candidate genes were associated with milk production traits, reproductive traits, and immune traits. In addition, we also found that some candidate genes were located on quantitative trait locus (QTLs) related to milk production traits in cattle (Table 3).
TABLE 3.
Candidate genes located on the QTLs of bovine milk production traits.
| Candidate gene | Gene description | Traits | References |
|---|---|---|---|
| GHR | Growth Hormone Receptor | Milk protein, milk yield, milk fat | Jiang et al. (2019b) |
| GLYCAM1 | Glycosylation Dependent Cell Adhesion Molecule 1 | Milk protein, milk yield, milk fat | Jiang et al. (2019b) |
| GSK3A | Glycogen Synthase Kinase 3 | Milk protein, milk fat | Cole et al. (2011) |
| PITRM1 | Pitrilysin Metallopeptidase 1 | Milk protein, milk fat | Cole et al. (2011) |
| APBB2 | Amyloid Beta Precursor Protein Binding Family B Member 2 | Milk protein, milk fat | Cole et al. (2011) |
| ARHGAP22 | Rho GTPase Activating Protein 22 | Milk protein, milk yield, milk fat | Cole et al. (2011) |
| LARP4B | La Ribonucleoprotein 4B | Milk protein | Zhou et al. (2019) |
| NCKAP1L | NCK Associated Protein 1 Like | Milk protein, milk fat | Jiang et al. (2019b) |
| TANK | TRAF Family Member Associated NFKB Activator | Milk protein, milk yield, milk fat | Jiang et al. (2019b) |
| AAAS | Aladin WD Repeat Nucleoporin | Milk protein, milk fat | Jiang et al. (2019b) |
| PRKDC | Protein Kinase, DNA-Activated, Catalytic Subunit | Milk protein, milk yield | Jiang et al. (2019b) |
| SPIDR | Scaffold Protein Involved In DNA Repair | Milk protein | Jiang et al. (2019b) |
| PDE1B | Phosphodiesterase 1B | Milk protein | Jiang et al. (2019b) |
| DGKG | Diacylglycerol Kinase Gamma | Milk yield | Viale et al. (2017) |
| TPD52L2 | TPD52 Like 2 | Milk yield | Jiang et al. (2019b) |
| RASAL1 | RAS Protein Activator Like 1 | Milk yield | Do et al. (2020) |
| SUPT3H | SPT3 Homolog, SAGA And STAGA Complex Component | Milk yield | Jiang et al. (2019b) |
| DNAJC5 | DnaJ Heat Shock Protein Family (Hsp40) Member C5 | Milk yield | Jiang et al. (2019b) |
| PRPF6 | Pre-MRNA Processing Factor 6 | Milk yield | Jiang et al. (2019b) |
| SPIDR | Scaffold Protein Involved In DNA Repair | Milk yield | Jiang et al. (2019b) |
| ABTB2 | Ankyrin Repeat And BTB Domain Containing 2 | Milk fat | Jiang et al. (2019b) |
| ACSBG2 | Acyl-CoA Synthetase Bubblegum Family Member 2 | Milk fat | Jiang et al. (2019a) |
| DNAJC24 | DnaJ Heat Shock Protein Family (Hsp40) Member C24 | Milk fat | Jiang et al. (2019b) |
| ATF7 | Activating Transcription Factor 7 | Milk fat | Jiang et al. (2019b) |
| FA2H | Fatty Acid 2-Hydroxylase | Milk fat | Cole et al. (2011) |
| NFX1 | Nuclear Transcription Factor, X-Box Binding 1 | Milk fat | Jiang et al. (2019a) |
| RFX4 | Regulatory Factor X4 | Milk fat | Cole et al. (2011) |
| STK3 | Serine/Threonine Kinase 3 | Milk fat | Cai et al. (2019) |
| UBE2R2 | Ubiquitin Conjugating Enzyme E2 R2 | Milk fat | Jiang et al. (2019b) |
| CUL3 | Cullin 3 | Milk fat | Cole et al. (2011) |
| RUNX3 | RUNX Family Transcription Factor 3 | Milk fat | Jiang et al. (2019b) |
4 Discussion
With human migration and the development of agricultural trade, dairy goats have been widely distributed all over the world, particularly in Europe and developing countries. They can adapt to harsh climates and living conditions, while contributing to the livelihood of low and middle-income farmers. Europe contains over 187 goat breeds, most of them are high-yield dairy goat breeds (Saanen, Alpine, Toggenburg, Nubian) (Devendra and Haenlein, 2016). However, in developing countries, the milk yield of some dairy goats is very low, which seriously restricts the economic development of developing countries. Therefore, exploring the genetic relationship of dairy goat breeds, revealing the specificity of dairy goat, and identifying candidate genes related to milk production traits will provide theoretical references for improving dairy goat and the implementation of effective crossbreeding programs. In this study, we investigated the genetic relationships and diversity and the signatures of selection in dairy goat populations based on the whole genome re-sequencing data of 89 goats (62 dairy goats and 27 non-dairy goats).
4.1 Population genetic structure and genetic diversity
Genetic diversity in livestock not only outlines the genomic characteristics of a population, but also indirectly reflects various evolutionary events. GS and LL are native to southwest China, and their geographical isolation is relatively weak. In fact, the analysis of, population structure shows that they have close genetic relationship. Due to the geographical location and living environment of LL, it has been in a relatively closed and natural mating state for a long time, with a resulting low intensity of artificial selection. From these results, we also found that LL had the fastest decay in LD, the effective population size was the largest, which was basically consistent with the results of previous studies (Chen et al., 2021). GZ and YSB are crossbred breeds with short breeding times, whose fathers are Saanen and Nubian, respectively. Thus, we found that YSB and Nubian, the GZ and Saanen had a close genetic relationship and similar genetic backgrounds which is consistent with the history of the formation of these breeds. Saanen, Alpine and Toggenburg belong to European dairy goat breeds, which are clustered into a large branch on the NJ tree, and show a similar genetic background.
In this study, we found that the nucleotide diversity of ANB, AAP, and TG was low, which was significantly lower than that of other populations, and the decline of LD was slow, indicating that these populations may have been strong artificial selection. And the results of LD decay of each population were largely consistent with the results of nucleotide diversity and inbreeding coefficient. In addition, genetic diversity showed that there were differences in nucleotide diversity, linkage disequilibrium, effective population size and inbreeding coefficient among Saanen, Alpine, and Nubian populations living in different countries. Kim et al. reported similar results in their study of the genomic characteristics of 14 goat populations, including Saanen (Korea, France, Switzerland, Australia) and Boer goat (Korea, Switzerland, Australia), wherein goats from different countries had differences in genomic characteristics (Kim et al., 2019). These differences in genetic diversity indicate that sub-populations may have been influenced by artificial or environmental selection in each region, thus resulting in different genomic characteristics. The results of this study are of great significance for exploring the genetic relationship among dairy goat breeds and provide a valuable reference for the improvement and cross-breeding of dairy goat breeds.
4.2 Selective sweep analysis
During long-term selection and domestication, humans have bred goat breeds with various production characteristics depending on their production needs. These characteristics have provided an important genetic basis for improving goat breeds and the design of breeding programs. Therefore, to identify these production characteristics, extensive studies on selection signatures have been carried out among various goat breeds: Bore goat (meat) (Yang et al., 2021a), large-tailed Han sheep (tail type) (Yuan et al., 2017), Lacaune sheep (milk) (Yuan et al., 2019), Laoshan dairy goat (reproductive) (Lai et al., 2016), and Inner Mongolia and Liaoning cashmere goats (cashmere) (Li et al., 2017). In the present study, we conducted comparative genomic analysis of five dairy goat breeds and three non-dairy goat breeds to reveal specific selection signatures for dairy goat.
In this study, we used the reference genome of dairy goat (Saanen_v1), with a genome alignment rate of over 99%. However, we found that the stronger selection sweeps regions had no annotated genes, and 202 annotated genes were found that could not be identified (no known orthologs, gene identifier starting with “LOC”). This may be due to the incomplete annotation of the caprine genome. Nevertheless, we still annotated candidate genes related to the specificity of dairy goat, such as milk production, reproduction, and immunity.
4.2.1 Candidate genes associated with milk production traits
Milk production traits are not only the most important economic traits of dairy goat, but also their most significant characteristics. Milk production traits belong to quantitative traits, which are controlled by minor polygenes. The main indicators of these traits include milk yield, milk protein and fat yield, milk protein and fat content.
4.2.1.1 Candidate genes associated with milk proteins
Milk proteins mainly include whey protein and casein, whose synthesis is regulated by a variety of hormones and signaling pathways, including insulin, and the JAK-STAT and mTOR signaling pathways. We identified several genes potentially involved in milk protein synthesis. Among these, EIF4B is key component of eukaryotic translation initiation and plays an important role in the mTOR signaling pathway, accelerating mRNA translation and promoting cell growth and proliferation (Cho et al., 2021). ELF5 is an important regulator of mammary acinar development and milk protein expression, and its expression seems to enhance the activity of STAT5 protein, which may be a major player in activating protein synthesis in the bovine mammary gland (Choi et al., 2009; Guan et al., 2020). IGFs (insulin-like growth factors) are essential for mammalian growth and development, and IGFBPs (IGF-binding proteins) are key regulators of IGF action (Bach et al., 2013). Previous studies have reported that IGF2R can affect milk quality and is an important genetic marker for milk production traits, while IGFBP6 inhibits cell proliferation by specifically binding to IGF2 (Dux et al., 2018; Nishihara et al., 2019).
4.2.1.2 Candidate genes associated with milk fat
Milk fat is a high-quality natural fat that is an important component of milk, 99% of which consists of milk triglycerides (Bionaz and Loor, 2008). Milk triglycerides are mainly derived from mammary epithelial cells (MECs) and blood, and their synthesis and transfer involve several pathways, including the de novo synthesis of fatty acids, the formation of fat droplets, and the uptake and transport of fatty acids. Several genes have been reported to be involved in ruminant milk fat synthesis, including EGFR, ACSS2, ACSL4, PANK3, DGAT2, and SP1. Among these, EGFR plays an important role in the de novo synthesis of fatty acids in mammary epithelial cells by phosphorylating PLC-γ1 and Akt signaling pathways, inducing adipogenesis-related gene expression and increasing intracellular TG content (Huang et al., 2020). ACSS2 (acyl-CoA synthase short-chain family member 2) performs lipogenesis by synthesizing acetyl-CoA from acetate, which is directly regulated by SREBP1 and plays an important role in ruminant milk fat synthesis (Mu et al., 2021). PANK3 is a key enzyme for fatty acid synthesis, which promotes de novo fatty acids synthesis by regulating CoA synthesis (Lin et al., 2013; Subramanian et al., 2016). ACSL4 is a member of the acyl-CoA synthetase long-chain family, and plays a key role in lipid biosynthesis and fatty acid degradation by converting free long-chain fatty acids to fatty acyl-CoA (Mashek et al., 2007; Ren et al., 2022). DGAT2 (diacylglycerol O-Acyltransferase 2) plays a key role in catalyzing the final step of triacylglycerol (TAG) biosynthesis in the Kennedy pathway and can significantly affect milk production and fat content in goats (Wakimoto et al., 2003; An et al., 2011). SP1 (specificity protein 1) is one of the major transcription activators of FASN and may be involved in milk fat metabolism via the control of PPARγ and LXRα (Zhu et al., 2015).
Milk fat globular membrane (MFGM) is an important component of milk fat. CHMP1B belongs to MFGM protein and is highly or uniquely expressed in donkey mature milk (Chang et al., 2019; Li et al., 2019). GlyCAM1 (glycosylation-dependent cell adhesion molecule 1) is one of the mucins produced in the mammary gland, which is a component of the milk fat globule membrane, and is highly and specifically expressed in the mammary glands of lactating bovines (Groenen et al., 1995; Le Provost et al., 2003).
Lipid droplets play an important role in triglyceride storage, lipid metabolism, and fatty acid transport. PLIN4 (Perilipin4) and PLIN5 (Perilipin5) are members of the Perilipin family of lipoproteins (Chen et al., 2013). PLIN4 is involved in the formation of lipid droplets in adipocytes, and the binding of PLIN5 to adipose triglyceride fatty acid enzyme (ATGL) plays a bidirectional regulatory role in lipid metabolism (Najt et al., 2020; Zhang et al., 2022). ACSBG2 belongs to the acyl-CoA synthetase family, which plays a pivotal role in lipid metabolism and lipid droplet formation (Adams et al., 2016). RPTOR is a protein related to mTOR, which interacts with S6K1 to regulate cell growth and plays a role in lipid droplet metabolism (Kim et al., 2002; Zhang et al., 2020).
4.2.1.3 Candidate genes associated with milk production
In addition to this, we also identified several genes related to milk production. Mammary gland development is also an important factor affecting the lactation ability of livestock. Growth hormone plays an important role in mammary gland development (Tucker, 1981; Sejrsen et al., 1986), and GHR (growth hormone receptor) activates mammary gland cell activity, which can significantly affect milk production in buffaloes (El-Komy et al., 2020), dairy cows (Cobanoglu et al., 2021), and sheep (Dettori et al., 2018). LCORL plays an important role in regulating the body size and height of livestock, and previous studies have found that LCORL is associated with milk yield in Latxa sheep, which may affect breast development (Ruiz-Larrañaga et al., 2018; Saif et al., 2020). CPXM2 may play an important role in mammary gland development and involution (Suárez-Vega et al., 2015). Mammary epithelial cells have the function of synthesizing and secreting milk. As such, the genes involved in cell proliferation and differentiation may indirectly affect milk production. CCR6 (chemokine receptor 6) activates multiple signaling kinases and participates in CCL20-induced breast cell proliferation and migration (Marsigliante et al., 2013). NRAS plays an important role in cell proliferation, cell migration, and angiogenesis by activating the PI3K/AKT, MAPK/ERK, and NF-kB signaling pathways (Song et al., 2018). SP7 is a zinc finger transcription factor, which promotes the proliferation and differentiation of osteoblasts and regulates the expression of several osteoblast genes, such as SPP1 and BMP2 (Barbuto and Mitchell, 2013; Hojo and Ohba, 2022). AMPD1 plays an important role in cellular energy metabolism, which is a candidate gene for bovine production traits and porcine growth and carcass traits (Wang et al., 2008; Wei et al., 2015).
4.2.2 Candidate genes associated with reproduction traits
Dairy goat are seasonal breeding livestock within which the hypothalamic-pituitary-thyroid (HPT) axis plays a crucial role in sexual maturation and reproduction (Müller-Fielitz et al., 2017). TSHB is an important component of thyroid stimulating hormone (TSH), deciding the biological specificity and synthesis rate of TSH, and is closely related to the photoperiod of seasonal reproduction in mammals (Huang et al., 2013). TSHR is a thyroid-stimulating hormone receptor that plays an important role in seasonal estrus and reproduction in goats (Yurchenko et al., 2019; Li et al., 2021a). PTGS2, ESR2, and SERPINB11 are relevant to estrogen and follicular growth (Xu et al., 2018). PTGS2 plays a critical role in ovulation by stimulating LH (luteinizing hormone) signaling (Tang et al., 2017) Estrogen receptor 2 (ESR2) plays a critical role in folliculogenesis and ovulation by regulating granulosa cells (Khristi et al., 2018). SERPINB11 is a novel estrogen-inducible gene during chicken fallopian tube development that may be involved in spermatogenesis and apoptosis (Lim et al., 2012; Yang et al., 2015). SPATA22 (spermatogenesis associated 22) was identified as a candidate meiosis-specific gene and plays a crucial role in sperm and oocyte meiosis (Lawson et al., 2011; La Salle et al., 2012). CHMP5 is essential for embryogenesis, and the lack of this gene leads to early embryonic lethality in mice (Shim et al., 2006). Furthermore, previous studies have shown that MSRA is related to productivity traits of Romanov sheep, while AAAS is associated with reproductive traits in Iranian sheep (Xu et al., 2018; Manzari et al., 2019).
4.2.3 Candidate genes related to immunity
Intramammary infections and mastitis lead to reduced milk production and quality in dairy goats. In this study, we identified several immune-related genes. JAK1 is a key effector of proinflammatory cytokine signaling, plays an important role in immune function, and can promote the self-renewal of hematopoietic stem cells (Kleppe et al., 2017; Witalisz-Siepracka et al., 2018). BPIFA1 and BPIFA3 belong to the BPI fold-containing family, which have antibacterial, surfactant, and immunomodulatory properties that prevent bacterial biofilm formation (Britto and Cohn, 2015; Guan et al., 2020). POU2F2 regulates B cell proliferation and differentiation genes by binding to immune proteins to participate in immune responses (Yang et al., 2021c). LRRC66 is a key gene for insulin and plays an important role in the development of innate immunity and the nervous system, which is involved in diverse biological processes, including cell adhesion, cellular trafficking, and hormone-receptor interactions (Ng et al., 2011; Lien et al., 2020). MAP3K1 participates in the MAPK signaling pathway and can inhibit the proliferation of breast cancer cells, playing a vital role in maintaining good breast function (Cuevas et al., 2006; Glubb et al., 2015).
4.2.4 Candidate genes associated with the strongest selection signal
In addition, we found that the 53.2–53.4 Mb region on chromosome 13 was strongly positively selected, and the enriched genes therein were mainly related to reproduction, immunity, growth and development (Table 4). NPBWR2, PRPF6, OPRL1, and SOX18 play essential roles in the germ cells of livestock, while DNAJC5 and ZNF512B play important roles in growth and development, which may be related to the development of mammary glands. In addition, PRPF6 and DNAJC5 are associated with milk production in cows (Jiang et al., 2019b).
TABLE 4.
Genes annotated in the 53.2–53.4 Mb region of chromosome 13.
| Gene | CHROM | BIN_START | BIN_END | F ST | θπ |
|---|---|---|---|---|---|
| NPBWR2 | 13 | 53225001 | 53275000 | 0.349 | 2.848 |
| OPRL1 | 13 | 53250001 | 53300000 | 0.364 | 6.597 |
| LKAAEAR1 | 13 | 53250001 | 53300000 | 0.364 | 6.597 |
| RGS19 | 13 | 53250001 | 53300000 | 0.364 | 6.597 |
| TCEA2 | 13 | 53250001 | 53300000 | 0.364 | 6.597 |
| SOX18 | 13 | 53250001 | 53300000 | 0.364 | 6.597 |
| C13H20orf204 | 13 | 53300001 | 53350000 | 0.321 | 4.189 |
| PRPF6 | 13 | 53300001 | 53350000 | 0.321 | 4.189 |
| LOC114117706 | 13 | 53300001 | 53350000 | 0.321 | 4.189 |
| SAMD10 | 13 | 53300001 | 53350000 | 0.321 | 4.189 |
| LOC114117706 | 13 | 53325001 | 53375000 | 0.354 | 3.788 |
| ZNF512B | 13 | 53325001 | 53375000 | 0.354 | 3.788 |
| LOC114117598 | 13 | 53325001 | 53375000 | 0.354 | 3.788 |
| UCKL1 | 13 | 53325001 | 53375000 | 0.354 | 3.788 |
| LOC114117599 | 13 | 53350001 | 53400000 | 0.365 | 3.577 |
| DNAJC5 | 13 | 53350001 | 53400000 | 0.365 | 3.577 |
NPBWR2 regulates the expression of PRL and GH by mediating neuropeptide W and may play a role in the reproductive activity of pigs (Scanes, 2016; Yang et al., 2018). PRPF6 is a key regulator of androgen receptor (AR), interacts with the N-terminus of AR, and enhances AR-mediated transactivation (Liu et al., 2021). OPRL1 plays an important role in spermatogenesis and meiosis through follicle-stimulating hormone (FSH) (Eto, 2015). SOX18 is an important regulator of vascular development, which is essential in angiogenesis and vascular endothelial cell differentiation (Fontijn et al., 2014). It is also reported to be a specific marker gene for sheep germ cells (Yang et al., 2021b). Puberty is an important period for the growth and development of the body. In this context, DNAJC5 and ZNF512B are developmental regulators and play a role in the puberty development of goats (Yan et al., 2022) and cattle (Nguyen et al., 2017). RGS19 promotes cell proliferation and differentiation, and plays a role in immune processes by regulating the survival of macrophages through the Notch signaling pathway (Sangphech et al., 2014). UCKL1 is a uridine-cytidine kinase that plays a role in cell proliferation and survival and is highly expressed in breast cancer (Ambrose and Kornbluth, 2009; Kovalevska et al., 2021).
5 Conclusion
In this study, the whole-genome resequencing data was used to analyze the population structure and genetic diversity of dairy goats. As a result, the genetic relationships of different dairy goat were revealed. Our results confirmed that differences exist in the genomic characteristics of the Nubian, Alpine, and Saanen subpopulations in different regions. In addition, we identified dairy goat-specific traits and candidate genes associated with milk production, reproductive, and immune traits. Furthemore, we found that chromosome 13 was strongly selected at 53.2–53.4 Mb, which may be a region-specific to dairy goat. We need more studies to verify. To summarized, our findings provide insights into the genetic diversity, population evolution, and important economic traits of dairy goat, as well as a valuable reference for the improvement and development of cross-breeding programs for dairy goat breeds.
Acknowledgments
The author sincerely thanks the farms that provided sampling opportunities and the people who helped with sampling, and thanks to the funding of the above-mentioned project.
Data availability statement
The raw sequence data reported in this paper have been deposited in the Genome Sequence Archive (Genomics, Proteomics and Bioinformatics 2021) in National Genomics Data Center (Nucleic Acids Res 2022), China National Center for Bioinformation/Beijing Institute of Genomics, Chinese Academy of Sciences (GSA: CRA008399) that are publicly accessible at https://ngdc.cncb.ac.cn/gsa.
Ethics statement
The animal study was reviewed and approved by The Animal Care and Use Committee of the Institute of Animal Sciences of the Chinese Academy of Agricultural Sciences (CAAS) and conducted in accordance with animal welfare and ethics guidelines of the academy (Permit number: IAS 2021-101).
Author contributions
LZ designed the study. JX analyzed the data and drafted the manuscript. LZ and MS collected goat samples. JB, LZ, WH, and MS discussed the results of the study and revised the manuscript. All authors read and approved the final manuscript.
Funding
This research was supported by Central Public-interest Scientific Institution Basal Research Fund (Y2018YJ23) and Government Procurement of services (2021-ZF-33-2).
Conflict of interest
The authors declare that the research was conducted in the absence of any commercial or financial relationships that could be construed as a potential conflict of interest.
Publisher’s note
All claims expressed in this article are solely those of the authors and do not necessarily represent those of their affiliated organizations, or those of the publisher, the editors and the reviewers. Any product that may be evaluated in this article, or claim that may be made by its manufacturer, is not guaranteed or endorsed by the publisher.
Supplementary material
The Supplementary Material for this article can be found online at: https://www.frontiersin.org/articles/10.3389/fgene.2022.1044017/full#supplementary-material
References
- Adams H. A., Sonstegard T. S., VanRaden P. M., Null D. J., Van Tassell C. P., Larkin D. M., et al. (2016). Identification of a nonsense mutation in APAF1 that is likely causal for a decrease in reproductive efficiency in Holstein dairy cattle. J. Dairy Sci. 99 (8), 6693–6701. 10.3168/jds.2015-10517 [DOI] [PubMed] [Google Scholar]
- Alberto F. J., Boyer F., Orozco-terWengel P., Streeter I., Servin B., de Villemereuil P., et al. (2018). Convergent genomic signatures of domestication in sheep and goats. Nat. Commun. 9 (1), 813. 10.1038/s41467-018-03206-y [DOI] [PMC free article] [PubMed] [Google Scholar]
- Alexander D. H., Novembre J., Lange K. (2009). Fast model-based estimation of ancestry in unrelated individuals. Genome Res. 19 (9), 1655–1664. 10.1101/gr.094052.109 [DOI] [PMC free article] [PubMed] [Google Scholar]
- Ambrose E. C., Kornbluth J. (2009). Downregulation of uridine-cytidine kinase like-1 decreases proliferation and enhances tumor susceptibility to lysis by apoptotic agents and natural killer cells. Apoptosis 14 (10), 1227–1236. 10.1007/s10495-009-0385-z [DOI] [PubMed] [Google Scholar]
- An X. P., Song S. G., Hou J. X., Zhu C. M., Peng J. X., Liu X. Q., et al. (2011). Polymorphism identification in goat DGAT2 gene and association analysis with milk yield and fat percentage. Small Ruminant Res. 100 (2-3), 107–112. 10.1016/j.smallrumres.2011.05.017 [DOI] [Google Scholar]
- Bach L. A., Fu P., Yang Z. (2013). Insulin-like growth factor-binding protein-6 and cancer. Clin. Sci. (Lond) 124 (4), 215–229. 10.1042/cs20120343 [DOI] [PubMed] [Google Scholar]
- Barbato M., Orozco-terWengel P., Tapio M., Bruford M. W. (2015). SNeP: A tool to estimate trends in recent effective population size trajectories using genome-wide SNP data. Front. Genet. 6, 109. 10.3389/fgene.2015.00109 [DOI] [PMC free article] [PubMed] [Google Scholar]
- Barbuto R., Mitchell J. (2013). Regulation of the osterix (Osx, Sp7) promoter by osterix and its inhibition by parathyroid hormone. J. Mol. Endocrinol. 51 (1), 99–108. 10.1530/jme-12-0251 [DOI] [PMC free article] [PubMed] [Google Scholar]
- Bionaz M., Loor J. J. (2008). Gene networks driving bovine milk fat synthesis during the lactation cycle. BMC Genomics 9, 366. 10.1186/1471-2164-9-366 [DOI] [PMC free article] [PubMed] [Google Scholar]
- Britto C. J., Cohn L. (2015). Bactericidal/Permeability-increasing protein fold-containing family member A1 in airway host protection and respiratory disease. Am. J. Respir. Cell. Mol. Biol. 52 (5), 525–534. 10.1165/rcmb.2014-0297RT [DOI] [PMC free article] [PubMed] [Google Scholar]
- Browning B. L., Tian X., Zhou Y., Browning S. R. (2021). Fast two-stage phasing of large-scale sequence data. Am. J. Hum. Genet. 108 (10), 1880–1890. 10.1016/j.ajhg.2021.08.005 [DOI] [PMC free article] [PubMed] [Google Scholar]
- Cai Z., Guldbrandtsen B., Lund M. S., Sahana G. (2019). Dissecting closely linked association signals in combination with the mammalian phenotype database can identify candidate genes in dairy cattle. BMC Genet. 20 (1), 15. 10.1186/s12863-019-0717-0 [DOI] [PMC free article] [PubMed] [Google Scholar]
- Chang C. L., Weigel A. V., Ioannou M. S., Pasolli H. A., Xu C. S., Peale D. R., et al. (2019). Spastin tethers lipid droplets to peroxisomes and directs fatty acid trafficking through ESCRT-III. J. Cell. Biol. 218 (8), 2583–2599. 10.1083/jcb.201902061 [DOI] [PMC free article] [PubMed] [Google Scholar]
- Chen Q., Huang Y., Wang Z., Teng S., Hanif Q., Lei C., et al. (2021). Whole-genome resequencing reveals diversity and selective signals in Longlin goat. Gene 771, 145371. 10.1016/j.gene.2020.145371 [DOI] [PubMed] [Google Scholar]
- Chen W., Chang B., Wu X., Li L., Sleeman M., Chan L. (2013). Inactivation of Plin4 downregulates Plin5 and reduces cardiac lipid accumulation in mice. Am. J. Physiol. Endocrinol. Metab. 304 (7), E770–E779. 10.1152/ajpendo.00523.2012 [DOI] [PMC free article] [PubMed] [Google Scholar]
- Chessa B., Pereira F., Arnaud F., Amorim A., Goyache F., Mainland I., et al. (2009). Revealing the history of sheep domestication using retrovirus integrations. Science 324 (5926), 532–536. 10.1126/science.1170587 [DOI] [PMC free article] [PubMed] [Google Scholar]
- Cho S., Lee G., Pickering B. F., Jang C., Park J. H., He L., et al. (2021). mTORC1 promotes cell growth via m (6)A-dependent mRNA degradation. Mol. Cell. 81 (10), 2064–2075.e8. 10.1016/j.molcel.2021.03.010 [DOI] [PMC free article] [PubMed] [Google Scholar]
- Choi Y. S., Chakrabarti R., Escamilla-Hernandez R., Sinha S. (2009). Elf5 conditional knockout mice reveal its role as a master regulator in mammary alveolar development: Failure of Stat5 activation and functional differentiation in the absence of Elf5. Dev. Biol. 329 (2), 227–241. 10.1016/j.ydbio.2009.02.032 [DOI] [PubMed] [Google Scholar]
- Clark S., Mora García M. B. (2017). A 100-Year Review: Advances in goat milk research. J. Dairy Sci. 100 (12), 10026–10044. 10.3168/jds.2017-13287 [DOI] [PubMed] [Google Scholar]
- Cobanoglu O., Kul E., Gurcan E. K., Abaci S. H., Cankaya S. (2021). Determination of the association of GHR/AluI gene polymorphisms with milk yield traits in Holstein and Jersey cattle raised in Turkey. Arch. Anim. Breed. 64 (2), 417–424. 10.5194/aab-64-417-2021 [DOI] [PMC free article] [PubMed] [Google Scholar]
- Cole J. B., Wiggans G. R., Ma L., Sonstegard T. S., Lawlor T. J., Jr., Crooker B. A., et al. (2011). Genome-wide association analysis of thirtyone production, health, reproduction and body conformation traits in contemporary U.S. Holstein cows. BMC Genomics 12, 408. 10.1186/1471-2164-12-408 [DOI] [PMC free article] [PubMed] [Google Scholar]
- Cuevas B. D., Winter-Vann A. M., Johnson N. L., Johnson G. L. (2006). MEKK1 controls matrix degradation and tumor cell dissemination during metastasis of polyoma middle-T driven mammary cancer. Oncogene 25 (36), 4998–5010. 10.1038/sj.onc.1209507 [DOI] [PubMed] [Google Scholar]
- Danecek P., Auton A., Abecasis G., Albers C. A., Banks E., DePristo M. A., et al. (2011). The variant call format and VCFtools. Bioinformatics 27 (15), 2156–2158. 10.1093/bioinformatics/btr330 [DOI] [PMC free article] [PubMed] [Google Scholar]
- Dettori M. L., Pazzola M., Paschino P., Amills M., Vacca G. M. (2018). Association between the GHR, GHRHR, and IGF1 gene polymorphisms and milk yield and quality traits in Sarda sheep. J. Dairy Sci. 101 (11), 9978–9986. 10.3168/jds.2018-14914 [DOI] [PubMed] [Google Scholar]
- Devendra C., Haenlein G. (2016). “Dairy goat breeds.” in Reference module in food science. 10.1016/B978-0-08-100596-5.00622-3 [DOI] [Google Scholar]
- Di Gerlando R., Sutera A. M., Mastrangelo S., Tolone M., Portolano B., Sottile G., et al. (2019). Genome-wide association study between CNVs and milk production traits in Valle del Belice sheep. PLoS One 14 (4), e0215204. 10.1371/journal.pone.0215204 [DOI] [PMC free article] [PubMed] [Google Scholar]
- Do D. N., Schenkel F., Miglior F., Zhao X., Ibeagha-Awemu E. M. (2020). Targeted genotyping to identify potential functional variants associated with cholesterol content in bovine milk. Anim. Genet. 51 (2), 200–209. 10.1111/age.12901 [DOI] [PubMed] [Google Scholar]
- Dux M., Muranowicz M., Siadkowska E., Robakowska-Hyżorek D., Flisikowski K., Bagnicka E., et al. (2018). Association of SNP and STR polymorphisms of insulin-like growth factor 2 receptor (IGF2R) gene with milk traits in Holstein-Friesian cows. J. Dairy Res. 85 (2), 138–141. 10.1017/s0022029918000110 [DOI] [PubMed] [Google Scholar]
- El-Komy S. M., Saleh A. A., Abdel-Hamid T. M., El-Magd M. A. (2020). Association of GHR polymorphisms with milk production in buffaloes. Anim. (Basel) 10 (7), 1203. 10.3390/ani10071203 [DOI] [PMC free article] [PubMed] [Google Scholar]
- Eto K. (2015). Nociceptin and meiosis during spermatogenesis in postnatal testes. Vitam. Horm. 97, 167–186. 10.1016/bs.vh.2014.10.003 [DOI] [PubMed] [Google Scholar]
- Fontijn R. D., Favre J., Naaijkens B. A., Meinster E., Paauw N. J., Ragghoe S. L., et al. (2014). Adipose tissue-derived stromal cells acquire endothelial-like features upon reprogramming with SOX18 . Stem Cell. Res. 13 (3), 367–378. 10.1016/j.scr.2014.09.004 [DOI] [PubMed] [Google Scholar]
- Gallier S., Tolenaars L., Prosser C. (2020). Whole goat milk as a source of fat and milk fat globule membrane in infant formula. Nutrients 12 (11), 3486. 10.3390/nu12113486 [DOI] [PMC free article] [PubMed] [Google Scholar]
- García-Gámez E., Gutiérrez-Gil B., Sahana G., Sánchez J. P., Bayón Y., Arranz J. J. (2012). GWA analysis for milk production traits in dairy sheep and genetic support for a QTN influencing milk protein percentage in the LALBA gene. PLoS One 7 (10), e47782. 10.1371/journal.pone.0047782 [DOI] [PMC free article] [PubMed] [Google Scholar]
- Glubb D. M., Maranian M. J., Michailidou K., Pooley K. A., Meyer K. B., Kar S., et al. (2015). Fine-scale mapping of the 5q11.2 breast cancer locus reveals at least three independent risk variants regulating MAP3K1 . Am. J. Hum. Genet. 96 (1), 5–20. 10.1016/j.ajhg.2014.11.009 [DOI] [PMC free article] [PubMed] [Google Scholar]
- Groenen M. A., Dijkhof R. J., van der Poel J. J. (1995). Characterization of a GlyCAM1-like gene (glycosylation-dependent cell adhesion molecule 1) which is highly and specifically expressed in the lactating bovine mammary gland. Gene 158 (2), 189–195. 10.1016/0378-1119(95)00138-v [DOI] [PubMed] [Google Scholar]
- Guan D., Landi V., Luigi-Sierra M. G., Delgado J. V., Such X., Castelló A., et al. (2020). Analyzing the genomic and transcriptomic architecture of milk traits in Murciano-Granadina goats. J. Anim. Sci. Biotechnol. 11, 35. 10.1186/s40104-020-00435-4 [DOI] [PMC free article] [PubMed] [Google Scholar]
- Guan D., Luo N., Tan X., Zhao Z., Huang Y., Na R., et al. (2016). Scanning of selection signature provides a glimpse into important economic traits in goats (Capra hircus). Sci. Rep. 6, 36372. 10.1038/srep36372 [DOI] [PMC free article] [PubMed] [Google Scholar]
- Hojo H., Ohba S. (2022). Sp7 action in the skeleton: Its mode of action, functions, and relevance to skeletal diseases. Int. J. Mol. Sci. 23 (10), 5647. 10.3390/ijms23105647 [DOI] [PMC free article] [PubMed] [Google Scholar]
- Huang D. W., Wang J. X., Liu Q. Y., Chu M. X., Di R., He J. N., et al. (2013). Analysis on DNA sequence of TSHB gene and its association with reproductive seasonality in goats. Mol. Biol. Rep. 40 (2), 1893–1904. 10.1007/s11033-012-2245-0 [DOI] [PubMed] [Google Scholar]
- Huang J., Dai B., Qu H., Zhong Y., Ma Y., Luo J., et al. (2020). Epidermal growth factor stimulates fatty acid synthesis mainly via PLC-γ1/akt signaling pathway in dairy goat mammary epithelial cells. Anim. (Basel) 10 (6), 930. 10.3390/ani10060930 [DOI] [PMC free article] [PubMed] [Google Scholar]
- Jiang J., Liu L., Gao Y., Shi L., Li Y., Liang W., et al. (2019a). Determination of genetic associations between indels in 11 candidate genes and milk composition traits in Chinese Holstein population. BMC Genet. 20 (1), 48. 10.1186/s12863-019-0751-y [DOI] [PMC free article] [PubMed] [Google Scholar]
- Jiang J., Ma L., Prakapenka D., VanRaden P. M., Cole J. B., Da Y. (2019b). A large-scale genome-wide association study in U.S. Holstein cattle. Front. Genet. 10, 412. 10.3389/fgene.2019.00412 [DOI] [PMC free article] [PubMed] [Google Scholar]
- Khristi V., Chakravarthi V. P., Singh P., Ghosh S., Pramanik A., Ratri A., et al. (2018). ESR2 regulates granulosa cell genes essential for follicle maturation and ovulation. Mol. Cell. Endocrinol. 474, 214–226. 10.1016/j.mce.2018.03.012 [DOI] [PubMed] [Google Scholar]
- Kim D. H., Sarbassov D. D., Ali S. M., King J. E., Latek R. R., Erdjument-Bromage H., et al. (2002). MTOR interacts with raptor to form a nutrient-sensitive complex that signals to the cell growth machinery. Cell. 110 (2), 163–175. 10.1016/s0092-8674(02)00808-5 [DOI] [PubMed] [Google Scholar]
- Kim J. Y., Jeong S., Kim K. H., Lim W. J., Lee H. Y., Kim N. (2019). Discovery of genomic characteristics and selection signatures in Korean indigenous goats through comparison of 10 Goat Breeds. Front. Genet. 10, 699. 10.3389/fgene.2019.00699 [DOI] [PMC free article] [PubMed] [Google Scholar]
- Kleppe M., Spitzer M. H., Li S., Hill C. E., Dong L., Papalexi E., et al. (2017). Jak1 integrates cytokine sensing to regulate hematopoietic stem cell function and stress hematopoiesis. Cell. stem Cell. 21 (2), 489–501. 10.1016/j.stem.2017.08.011 [DOI] [PMC free article] [PubMed] [Google Scholar]
- Kovalevska L., Kashuba E., Zadvornyj T., Astrid K., Lukianova N., Chekhun V. (2021). Differential expression patterns of AIP, UCKL1, and PKN1 genes in breast cancer of different molecular subtypes. Exp. Oncol. 43 (4), 298–305. 10.32471/exp-oncology.2312-8852.vol-43-no-4.17067 [DOI] [PubMed] [Google Scholar]
- La Salle S., Palmer K., O'Brien M., Schimenti J. C., Eppig J., Handel M. A. (2012). Spata22, a novel vertebrate-specific gene, is required for meiotic progress in mouse germ cells. Biol. Reprod. 86 (2), 45. 10.1095/biolreprod.111.095752 [DOI] [PMC free article] [PubMed] [Google Scholar]
- Lai F. N., Zhai H. L., Cheng M., Ma J. Y., Cheng S. F., Ge W., et al. (2016). Whole-genome scanning for the litter size trait associated genes and SNPs under selection in dairy goat (Capra hircus). Sci. Rep. 6, 38096. 10.1038/srep38096 [DOI] [PMC free article] [PubMed] [Google Scholar]
- Lawson C., Gieske M., Murdoch B., Ye P., Li Y., Hassold T., et al. (2011). Gene expression in the fetal mouse ovary is altered by exposure to low doses of bisphenol A. Biol. Reprod. 84 (1), 79–86. 10.1095/biolreprod.110.084814 [DOI] [PMC free article] [PubMed] [Google Scholar]
- Le Provost F., Cassy S., Hayes H., Martin P. (2003). Structure and expression of goat GLYCAM1 gene: Lactogenic-dependent expression in ruminant mammary gland and interspecies conservation of the proximal promoter. Gene 313, 83–89. 10.1016/s0378-1119(03)00632-2 [DOI] [PubMed] [Google Scholar]
- Li H., Durbin R. (2009). Fast and accurate short read alignment with Burrows-Wheeler transform. Bioinformatics 25 (14), 1754–1760. 10.1093/bioinformatics/btp324 [DOI] [PMC free article] [PubMed] [Google Scholar]
- Li H., Handsaker B., Wysoker A., Fennell T., Ruan J., Homer N., et al. (2009). The sequence alignment/map format and SAMtools. Bioinformatics 25 (16), 2078–2079. 10.1093/bioinformatics/btp352 [DOI] [PMC free article] [PubMed] [Google Scholar]
- Li M., Zhou Q., Pan Y., Lan X., Zhang Q., Pan C., et al. (2021a). Screen of small fragment mutations within the sheep thyroid stimulating hormone receptor gene associated with litter size. Anim. Biotechnol. 2021, 1–6. 10.1080/10495398.2021.1992415 [DOI] [PubMed] [Google Scholar]
- Li R., Yang P., Dai X., Asadollahpour Nanaei H., Fang W., Yang Z., et al. (2021b). A near complete genome for goat genetic and genomic research. Genet. Sel. Evol. 53 (1), 74. 10.1186/s12711-021-00668-5 [DOI] [PMC free article] [PubMed] [Google Scholar]
- Li W., Li M., Cao X., Yang M., Han H., Kong F., et al. (2019). Quantitative proteomic analysis of milk fat globule membrane (MFGM) proteins from donkey colostrum and mature milk. Food Funct. 10 (7), 4256–4268. 10.1039/c9fo00386j [DOI] [PubMed] [Google Scholar]
- Li X., Su R., Wan W., Zhang W., Jiang H., Qiao X., et al. (2017). Identification of selection signals by large-scale whole-genome resequencing of cashmere goats. Sci. Rep. 7 (1), 15142. 10.1038/s41598-017-15516-0 [DOI] [PMC free article] [PubMed] [Google Scholar]
- Lien Y. C., Wang P. Z., Lu X. M., Simmons R. A. (2020). Altered transcription factor binding and gene bivalency in islets of intrauterine growth retarded rats. Cells 9 (6), 1435. 10.3390/cells9061435 [DOI] [PMC free article] [PubMed] [Google Scholar]
- Lim W., Kim J. H., Ahn S. E., Jeong W., Kim J., Bazer F. W., et al. (2012). Avian SERPINB11 gene: A marker for ovarian endometrioid cancer in chickens. Exp. Biol. Med. (Maywood) 237 (2), 150–159. 10.1258/ebm.2011.011250 [DOI] [PubMed] [Google Scholar]
- Lin X., Luo J., Zhang L., Wang W., Gou D. (2013). MiR-103 controls milk fat accumulation in goat (Capra hircus) mammary gland during lactation. PLoS One 8 (11), e79258. 10.1371/journal.pone.0079258 [DOI] [PMC free article] [PubMed] [Google Scholar]
- Liu W., Wang C., Wang S., Zeng K., Wei S., Sun N., et al. (2021). PRPF6 promotes androgen receptor/androgen receptor-variant 7 actions in castration-resistant prostate cancer cells. Int. J. Biol. Sci. 17 (1), 188–203. 10.7150/ijbs.50810 [DOI] [PMC free article] [PubMed] [Google Scholar]
- Manzari Z., Mehrabani-Yeganeh H., Nejati-Javaremi A., Moradi M. H., Gholizadeh M. (2019). Detecting selection signatures in three Iranian sheep breeds. Anim. Genet. 50 (3), 298–302. 10.1111/age.12772 [DOI] [PubMed] [Google Scholar]
- Marina H., Reverter A., Gutiérrez-Gil B., Alexandre P. A., Porto-Neto L. R., Suárez-Vega A., et al. (2020). Gene networks driving genetic variation in milk and cheese-making traits of Spanish Assaf sheep. Genes. (Basel) 11 (7), 715. 10.3390/genes11070715 [DOI] [PMC free article] [PubMed] [Google Scholar]
- Marsigliante S., Vetrugno C., Muscella A. (2013). CCL20 induces migration and proliferation on breast epithelial cells. J. Cell. Physiol. 228 (9), 1873–1883. 10.1002/jcp.24349 [DOI] [PubMed] [Google Scholar]
- Mashek D. G., Li L. O., Coleman R. A. (2007). Long-chain acyl-CoA synthetases and fatty acid channeling. Future Lipidol. 2 (4), 465–476. 10.2217/17460875.2.4.465 [DOI] [PMC free article] [PubMed] [Google Scholar]
- McKenna A., Hanna M., Banks E., Sivachenko A., Cibulskis K., Kernytsky A., et al. (2010). The genome analysis toolkit: A MapReduce framework for analyzing next-generation DNA sequencing data. Genome Res. 20 (9), 1297–1303. 10.1101/gr.107524.110 [DOI] [PMC free article] [PubMed] [Google Scholar]
- Mu T., Hu H., Ma Y., Feng X., Zhang J., Gu Y. (2021). Regulation of key genes for milk fat synthesis in ruminants. Front. Nutr. 8, 765147. 10.3389/fnut.2021.765147 [DOI] [PMC free article] [PubMed] [Google Scholar]
- Müller-Fielitz H., Stahr M., Bernau M., Richter M., Abele S., Krajka V., et al. (2017). Tanycytes control the hormonal output of the hypothalamic-pituitary-thyroid axis. Nat. Commun. 8 (1), 484. 10.1038/s41467-017-00604-6 [DOI] [PMC free article] [PubMed] [Google Scholar]
- Najt C. P., Khan S. A., Heden T. D., Witthuhn B. A., Perez M., Heier J. L., et al. (2020). Lipid droplet-derived monounsaturated fatty acids traffic via PLIN5 to allosterically activate SIRT1 . Mol. Cell. 77 (4), 810–824. e818. 10.1016/j.molcel.2019.12.003 [DOI] [PMC free article] [PubMed] [Google Scholar]
- Ng A. C., Eisenberg J. M., Heath R. J., Huett A., Robinson C. M., Nau G. J., et al. (2011). Human leucine-rich repeat proteins: A genome-wide bioinformatic categorization and functional analysis in innate immunity. Proc. Natl. Acad. Sci. U. S. A. 108 (1), 4631–4638. 10.1073/pnas.1000093107 [DOI] [PMC free article] [PubMed] [Google Scholar]
- Nguyen L. T., Reverter A., Cánovas A., Venus B., Islas-Trejo A., Porto-Neto L. R., et al. (2017). Global differential gene expression in the pituitary gland and the ovaries of pre- and postpubertal Brahman heifers. J. Anim. Sci. 95 (2), 599–615. 10.2527/jas.2016.0921 [DOI] [PubMed] [Google Scholar]
- Nishihara K., Suzuki Y., Kim D., Roh S. (2019). Growth of rumen papillae in weaned calves is associated with lower expression of insulin-like growth factor-binding proteins 2, 3, and 6. Anim. Sci. J. 90 (9), 1287–1292. 10.1111/asj.13270 [DOI] [PubMed] [Google Scholar]
- Purcell S., Neale B., Todd-Brown K., Thomas L., Ferreira M. A., Bender D., et al. (2007). Plink: A tool set for whole-genome association and population-based linkage analyses. Am. J. Hum. Genet. 81 (3), 559–575. 10.1086/519795 [DOI] [PMC free article] [PubMed] [Google Scholar]
- Qanbari S., Simianer H. (2014). Mapping signatures of positive selection in the genome of livestock. Livest. Sci. 166, 133–143. 10.1016/j.livsci.2014.05.003 [DOI] [Google Scholar]
- Quinlan A. R., Hall I. M. (2010). BEDTools: A flexible suite of utilities for comparing genomic features. Bioinformatics 26 (6), 841–842. 10.1093/bioinformatics/btq033 [DOI] [PMC free article] [PubMed] [Google Scholar]
- Ren H., Zhang H., Hua Z., Zhu Z., Tao J., Xiao H., et al. (2022). ACSL4 directs intramuscular adipogenesis and fatty acid composition in pigs. Anim. (Basel) 12 (1), 119. 10.3390/ani12010119 [DOI] [PMC free article] [PubMed] [Google Scholar]
- Ruiz-Larrañaga O., Langa J., Rendo F., Manzano C., Iriondo M., Estonba A. (2018). Genomic selection signatures in sheep from the Western Pyrenees. Genet. Sel. Evol. 50 (1), 9. 10.1186/s12711-018-0378-x [DOI] [PMC free article] [PubMed] [Google Scholar]
- Saif R., Henkel J., Jagannathan V., Drögemüller C., Flury C., Leeb T. (2020). The LCORL locus is under selection in large-sized Pakistani goat breeds. Genes. (Basel) 11 (2), 168. 10.3390/genes11020168 [DOI] [PMC free article] [PubMed] [Google Scholar]
- Sangphech N., Osborne B. A., Palaga T. (2014). Notch signaling regulates the phosphorylation of Akt and survival of lipopolysaccharide-activated macrophages via regulator of G protein signaling 19 (RGS19). Immunobiology 219 (9), 653–660. 10.1016/j.imbio.2014.03.020 [DOI] [PMC free article] [PubMed] [Google Scholar]
- Scanes C. G. (2016). Opening a New door: Neuropeptide W (NPW) is a novel inhibitory secretagogue for GH and prolactin acting via the gi protein-coupled NPBWR2 . Endocrinology 157 (9), 3394–3397. 10.1210/en.2016-1518 [DOI] [PubMed] [Google Scholar]
- Scholtens M., Jiang A., Smith A., Littlejohn M., Lehnert K., Snell R., et al. (2020). Genome-wide association studies of lactation yields of milk, fat, protein and somatic cell score in New Zealand dairy goats. J. Anim. Sci. Biotechnol. 11, 55. 10.1186/s40104-020-00453-2 [DOI] [PMC free article] [PubMed] [Google Scholar]
- Sejrsen K., Foldager J., Sorensen M. T., Akers R. M., Bauman D. E. (1986). Effect of exogenous bovine somatotropin on pubertal mammary development in heifers. J. Dairy Sci. 69 (6), 1528–1535. 10.3168/jds.S0022-0302(86)80569-0 [DOI] [PubMed] [Google Scholar]
- Shim J. H., Xiao C., Hayden M. S., Lee K. Y., Trombetta E. S., Pypaert M., et al. (2006). CHMP5 is essential for late endosome function and down-regulation of receptor signaling during mouse embryogenesis. J. Cell. Biol. 172 (7), 1045–1056. 10.1083/jcb.200509041 [DOI] [PMC free article] [PubMed] [Google Scholar]
- Song Y. K., Wang Y., Wen Y. Y., Zhao P., Bian Z. J. (2018). MicroRNA-22 suppresses breast cancer cell growth and increases paclitaxel sensitivity by targeting NRAS . Technol. Cancer Res. Treat. 17, 1533033818809997. 10.1177/1533033818809997 [DOI] [PMC free article] [PubMed] [Google Scholar] [Retracted]
- Suárez-Vega A., Gutiérrez-Gil B., Klopp C., Robert-Granie C., Tosser-Klopp G., Arranz J. J. (2015). Characterization and comparative analysis of the milk transcriptome in two dairy sheep breeds using RNA sequencing. Sci. Rep. 5, 18399. 10.1038/srep18399 [DOI] [PMC free article] [PubMed] [Google Scholar]
- Subramanian B., Gao S., Lercher M. J., Hu S., Chen W. H. (2019). Evolview v3: A webserver for visualization, annotation, and management of phylogenetic trees. Nucleic Acids Res. 47 (W1), W270–W275. 10.1093/nar/gkz357 [DOI] [PMC free article] [PubMed] [Google Scholar]
- Subramanian C., Yun M. K., Yao J., Sharma L. K., Lee R. E., White S. W., et al. (2016). Allosteric regulation of mammalian pantothenate kinase. J. Biol. Chem. 291 (42), 22302–22314. 10.1074/jbc.M116.748061 [DOI] [PMC free article] [PubMed] [Google Scholar]
- Tang H., Liu Y., Li J., Li G., Chen Y., Yin Y., et al. (2017). LH signaling induced ptgs2a expression is required for ovulation in zebrafish. Mol. Cell. Endocrinol. 447, 125–133. 10.1016/j.mce.2017.02.042 [DOI] [PubMed] [Google Scholar]
- Tucker H. A. (1981). Physiological control of mammary growth, lactogenesis, and lactation. J. Dairy Sci. 64 (6), 1403–1421. 10.3168/jds.S0022-0302(81)82711-7 [DOI] [PubMed] [Google Scholar]
- Viale E., Tiezzi F., Maretto F., De Marchi M., Penasa M., Cassandro M. (2017). Association of candidate gene polymorphisms with milk technological traits, yield, composition, and somatic cell score in Italian Holstein-Friesian sires. J. Dairy Sci. 100 (9), 7271–7281. 10.3168/jds.2017-12666 [DOI] [PubMed] [Google Scholar]
- Wakimoto K., Chiba H., Michibata H., Seishima M., Kawasaki S., Okubo K., et al. (2003). A novel diacylglycerol acyltransferase (DGAT2) is decreased in human psoriatic skin and increased in diabetic mice. Biochem. Biophys. Res. Commun. 310 (2), 296–302. 10.1016/j.bbrc.2003.09.015 [DOI] [PubMed] [Google Scholar]
- Wang K., Li M., Hakonarson H. (2010). Annovar: Functional annotation of genetic variants from high-throughput sequencing data. Nucleic Acids Res. 38 (16), e164. 10.1093/nar/gkq603 [DOI] [PMC free article] [PubMed] [Google Scholar]
- Wang L., Mo X., Xu Y., Zuo B., Lei M., Li F., et al. (2008). Molecular characterization and expression patterns of AMP deaminase1 (AMPD1) in porcine skeletal muscle. Comp. Biochem. Physiol. B Biochem. Mol. Biol. 151 (2), 159–166. 10.1016/j.cbpb.2008.06.009 [DOI] [PubMed] [Google Scholar]
- Wei C. B., Wang J. Q., Chen F. Y., Niu H., Li K. (2015). DNA sequence polymorphism within the bovine adenosine monophosphate deaminase 1 (AMPD1) is associated with production traits in Chinese cattle. Genet. Mol. Res. 14 (1), 1025–1033. 10.4238/2015.February.6.6 [DOI] [PubMed] [Google Scholar]
- Witalisz-Siepracka A., Klein K., Prinz D., Leidenfrost N., Schabbauer G., Dohnal A., et al. (2018). Loss of JAK1 drives innate immune deficiency. Front. Immunol. 9, 3108. 10.3389/fimmu.2018.03108 [DOI] [PMC free article] [PubMed] [Google Scholar]
- Xu S. S., Gao L., Xie X. L., Ren Y. L., Shen Z. Q., Wang F., et al. (2018). Genome-wide association analyses highlight the potential for different genetic mechanisms for litter size among sheep breeds. Front. Genet. 9, 118. 10.3389/fgene.2018.00118 [DOI] [PMC free article] [PubMed] [Google Scholar]
- Yan X., Gong X., Lin T., Lin M., Qin P., Ye J., et al. (2022). Analysis of protein phosphorylation sites in the hypothalamus tissues of pubescent goats. J. Proteomics 260, 104574. 10.1016/j.jprot.2022.104574 [DOI] [PubMed] [Google Scholar]
- Yang B. G., Yuan Y., Zhou D. K., Ma Y. H., Mahrous K. F., Wang S. Z., et al. (2021a). Genome-wide selection signal analysis of Australian Boer goat reveals artificial selection imprinting on candidate genes related to muscle development. Anim. Genet. 52 (4), 550–555. 10.1111/age.13092 [DOI] [PubMed] [Google Scholar]
- Yang H., Ma J., Wan Z., Wang Q., Wang Z., Zhao J., et al. (2021b). Characterization of sheep spermatogenesis through single-cell RNA sequencing. Faseb J. 35 (2), e21187. 10.1096/fj.202001035RRR [DOI] [PubMed] [Google Scholar]
- Yang R., Wang M., Zhang G., Li Y., Wang L., Cui H. (2021c). POU2F2 regulates glycolytic reprogramming and glioblastoma progression via PDPK1-dependent activation of PI3K/AKT/mTOR pathway. Cell. Death Dis. 12 (5), 433. 10.1038/s41419-021-03719-3 [DOI] [PMC free article] [PubMed] [Google Scholar]
- Yang S., Ma Z., Suo C., Cheng L., Su J., Lei Z. (2018). Cloning and mRNA expression of NPB and its effect on hormone secretion of the reproductive cells in the pig. Gen. Comp. Endocrinol. 261, 97–103. 10.1016/j.ygcen.2018.02.005 [DOI] [PubMed] [Google Scholar]
- Yang Y., Ma W., Ma H., Sun M., Chang Q., Pei X., et al. (2015). The spatiotemporal expression and localization implicates a potential role for SerpinB11 in the process of mouse spermatogenesis and apoptosis. J. Immunoass. Immunochem. 36 (2), 170–181. 10.1080/15321819.2014.917321 [DOI] [PubMed] [Google Scholar]
- Yuan Z., Li W., Li F., Yue X. (2019). Selection signature analysis reveals genes underlying sheep milking performance. Arch. Anim. Breed. 62 (2), 501–508. 10.5194/aab-62-501-2019 [DOI] [PMC free article] [PubMed] [Google Scholar]
- Yuan Z., Liu E., Liu Z., Kijas J. W., Zhu C., Hu S., et al. (2017). Selection signature analysis reveals genes associated with tail type in Chinese indigenous sheep. Anim. Genet. 48 (1), 55–66. 10.1111/age.12477 [DOI] [PubMed] [Google Scholar]
- Yurchenko A. A., Deniskova T. E., Yudin N. S., Dotsev A. V., Khamiruev T. N., Selionova M. I., et al. (2019). High-density genotyping reveals signatures of selection related to acclimation and economically important traits in 15 local sheep breeds from Russia. BMC Genomics 20 (3), 294. 10.1186/s12864-019-5537-0 [DOI] [PMC free article] [PubMed] [Google Scholar]
- Zeder M. A., Hesse B. (2000). The initial domestication of goats (Capra hircus) in the Zagros mountains 10, 000 years ago. Science 287 (5461), 2254–2257. 10.1126/science.287.5461.2254 [DOI] [PubMed] [Google Scholar]
- Zervas G., Tsiplakou E. (2011). The effect of feeding systems on the characteristics of products from small ruminants. Small Ruminant Res. 101 (1-3), 140–149. 10.1016/j.smallrumres.2011.09.034 [DOI] [Google Scholar]
- Zhang C., Dong S. S., Xu J. Y., He W. M., Yang T. L. (2019). PopLDdecay: A fast and effective tool for linkage disequilibrium decay analysis based on variant call format files. Bioinformatics 35 (10), 1786–1788. 10.1093/bioinformatics/bty875 [DOI] [PubMed] [Google Scholar]
- Zhang X., Wu D., Wang C., Luo Y., Ding X., Yang X., et al. (2020). Sustained activation of autophagy suppresses adipocyte maturation via a lipolysis-dependent mechanism. Autophagy 16 (9), 1668–1682. 10.1080/15548627.2019.1703355 [DOI] [PMC free article] [PubMed] [Google Scholar]
- Zhang X., Xu W., Xu R., Wang Z., Zhang X., Wang P., et al. (2022). Plin5 bidirectionally regulates lipid metabolism in oxidative tissues. Oxid. Med. Cell. Longev. 2022, 4594956. 10.1155/2022/4594956 [DOI] [PMC free article] [PubMed] [Google Scholar]
- Zhou C., Li C., Cai W., Liu S., Yin H., Shi S., et al. (2019). Genome-wide association study for milk protein composition traits in a Chinese holstein population using a single-step approach. Front. Genet. 10, 72. 10.3389/fgene.2019.00072 [DOI] [PMC free article] [PubMed] [Google Scholar]
- Zhu J., Sun Y., Luo J., Wu M., Li J., Cao Y. (2015). Specificity protein 1 regulates gene expression related to fatty acid metabolism in goat mammary epithelial cells. Int. J. Mol. Sci. 16 (1), 1806–1820. 10.3390/ijms16011806 [DOI] [PMC free article] [PubMed] [Google Scholar]
Associated Data
This section collects any data citations, data availability statements, or supplementary materials included in this article.
Supplementary Materials
Data Availability Statement
The raw sequence data reported in this paper have been deposited in the Genome Sequence Archive (Genomics, Proteomics and Bioinformatics 2021) in National Genomics Data Center (Nucleic Acids Res 2022), China National Center for Bioinformation/Beijing Institute of Genomics, Chinese Academy of Sciences (GSA: CRA008399) that are publicly accessible at https://ngdc.cncb.ac.cn/gsa.