

Summary
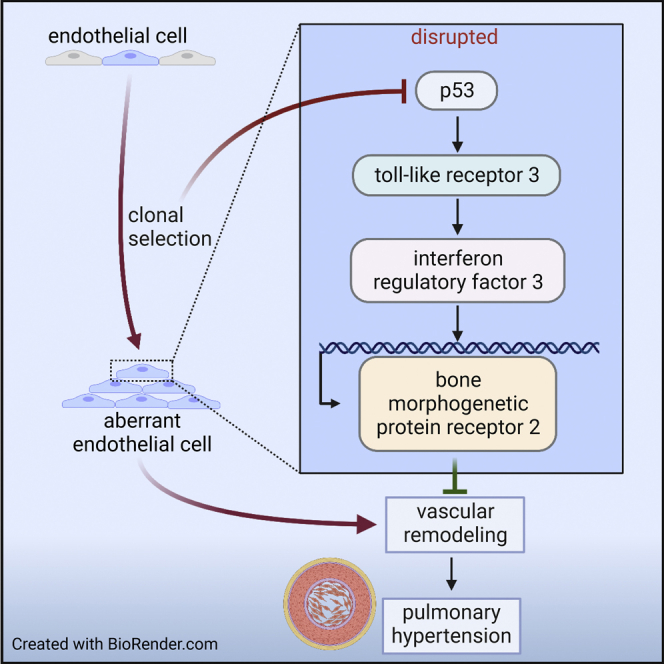
Pulmonary arterial hypertension (PAH) features pathogenic and abnormal endothelial cells (ECs), and one potential origin is clonal selection. We studied the role of p53 and toll-like receptor 3 (TLR3) in clonal expansion and pulmonary hypertension (PH) via regulation of bone morphogenetic protein (BMPR2) signaling. ECs of PAH patients had reduced p53 expression. EC-specific p53 knockout exaggerated PH, and clonal expansion reduced p53 and TLR3 expression in rat lung CD117+ ECs. Reduced p53 degradation (Nutlin 3a) abolished clonal EC expansion, induced TLR3 and BMPR2, and ameliorated PH. Polyinosinic/polycytidylic acid [Poly(I:C)] increased BMPR2 signaling in ECs via enhanced binding of interferon regulatory factor-3 (IRF3) to the BMPR2 promoter and reduced PH in p53−/− mice but not in mice with impaired TLR3 downstream signaling. Our data show that a p53/TLR3/IRF3 axis regulates BMPR2 expression and signaling in ECs. This link can be exploited for therapy of PH.
Subject areas: Biological sciences, Molecular biology, Cell biology
Graphical abstract
Highlights
-
•
Clonal expansion yields p53- and TLR3-deficient endothelial cells
-
•
The TLR3 ligand Poly(I:C) promotes BMPR2 expression endothelial cells
-
•
Poly(I:C) increases binding of IRF3 to the BMPR2 promoter
-
•
Poly(I:C) reduces pulmonary hypertension in p53−/−, but not in TRIFLPS2 mice
Biological sciences; Molecular biology; Cell biology
Introduction
Pulmonary arterial hypertension (PAH) remains a deadly disease, with 5-year survival rates between 27% and 88%.1,2,3 One reason is that current treatments do not sufficiently address the pulmonary arteriopathy, which affects all layers of the pulmonary artery (PA) wall.4 In PAH, endothelial cells (ECs) show an aberrant phenotype similar to cancer cells.5,6,7 One concept suggests that these aberrant ECs emerge from stem-cell-like ECs as survivors of endothelial apoptosis.8,9,10 We have recently shown that primitive ECs promote occlusive pulmonary arteriopathy after clonal selection, supporting the pathogenic role of clonal endothelial growth.11 Clonal expansion is a physiological response of ECs to injury.12 Yet the molecular mechanisms driving clonal selection in PAH are not fully understood.
Bone morphogenic protein receptor 2 (BMPR2) has emerged as a main genetic cause of PAH.13 Functional BMPR2 inhibits PAH, and hence its loss through mutations is a critical factor promoting the disease.14,15,16 Yet BMPR2 mutations have an incomplete penetrance, and all known genetic causes only account for a minority of PAH cases.13 One explanation is negative regulation of BMPR2 in the PAH patients lacking BMPR2 mutations. Loss of p53, a master regulator of the cell cycle, promotes experimental pulmonary hypertension (PH).17,18,19,20 p53 is further reduced in BMPR2 knockout mice following hypoxia-reoxygenation and in the chronic hypoxia and SU5416 (cHx/Su) rat model.17,18,20,21
p53 maintains expression of toll-like receptor 3 (TLR3) in epithelial cells.22 Our recent work showed that TLR3 maintains EC survival, whereas TLR3 deficiency promotes lung vascular remodeling and PH.23 However, the mechanisms connecting TLR3 and EC survival and the regulation of TLR3 in PAH are not well understood. We hypothesized that clonal endothelial growth requires downregulation of p53, which then, in turn, drives aberrant function in surviving ECs via impaired TLR3 and BMPR2 signaling. We also posited that activation of the p53/TLR3 axis restores physiologic BMPR2 signaling and EC function and reduces PAH.
Here we provide results showing that loss of p53 expression as found in PAH ECs leads to TLR3 deficiency. Endothelial p53 knockout exaggerates PH development, and repression of p53 is required for clonal expansion of lung ECs linked to PH. Accordingly, p53 activation decreases PH caused by EC clones. An impaired p53/TLR3 pathway represses BMPR2 expression and signaling and promotes proliferation in surviving ECs. The TLR3 agonist polyinosinic:polycytidylic acid [Poly(I:C)] reduced aberrant proliferation in p53-deficient ECs by direct binding of the transcription factor interferon regulatory factor-3 (IRF3) to the BMPR2 promoter and decreased exaggerated PH in cHx/Su P53 knockout mice. These findings provide a link between p53, TLR3, and BMPR2 and could open a new avenue for treatment of PAH patients without BMPR2 mutations.
Results
Reduced expression of p53, TLR3, and BMPR2 in human PAH ECs
Using immunostaining, we identified a potential relationship between DNA synthesis and expression of TLR3, p53, and BMPR2. We detected a strong immunofluorescent signal for TLR3, p53, and BMPR2 in ECs of PAs from control subjects (Figure 1A). In contrast, we found reduced expression of p53 and BMPR2 in the ECs and intima channels of PAs with occlusive arteriopathy (Figures 1A–1C), consistent with the previously described pattern of reduced TLR3 expression.23 p53 staining in PAs was nuclear and cytoplasmic, which is consistent with wild-type p53.24 Areas with low TLR3 staining had high expression of proliferating cell nuclear antigen (PCNA) staining, a marker of DNA synthesis and proliferation (Figure 1A). These areas were also low on p53 and BMPR2 expression compared with control tissue (Figures 1A–1C). We also found PCNA+ cells among both Lycopersicon esculentum lectin+ (LEL, tomato lectin) ECs and mesenchymal lineage marker fibroblast-specific protein 1 (FSP-1) expressing cells in concentric and plexiform lesions of PAH pulmonary arteries, indicating that ECs, but also mesenchymal marker expressing cells, may have reduced p53, TLR3, and BMPR2 expression (Figure 1D). Further supporting our observations, cultured PAH PAECs showed significantly reduced protein expression of p53 compared with controls (Figures 2A and 2B). Sex and age of the patients are shown in Tables S1 (histological analysis) and S2 (PAEC lines).
Figure 1.

Loss of TLR3, p53, and BMPR2 converge on proliferative endothelial cells in the pulmonary arteriopathy of patients with PAH
(A) Representative confocal microscopy optical sections of double immunofluorescence stainings (pseudo-colored) for proliferating cell nuclear antigen (PCNA)/Toll-like receptor 3 (TLR3), p53/von Willebrand Factor (vWF), and bone morphogenic protein receptor 2 (BMPR2)/vWF. For PCNA/TLR3, white arrows show intima cells in the PAH lesions with low TLR3 staining (red) that are positive for PCNA (green). In the plexiform lesions, asterisks indicate endothelial channels. For the p53/vWF staining, orange arrows show vWF+ ECs with high nuclear p53 staining, whereas for the BMPR2/vWF staining, yellow arrows show vWF+ ECs with high BMPR2 staining.
(B and C) Quantification of mean fluorescence intensity in ECs/intima of representative images of pulmonary arteries from control and PAH patients. Data are shown as single values and mean ± SEM. ∗∗p < 0.01 (t test).
(D) Representative confocal microscopy optical sections show proliferation in ECs and mesenchymal cells in pulmonary arteriopathy of patients with PAH. ECs are indicated by staining with Texas-Red-conjugated Lycopersicon esculentum lectin (tomato lectin, LEL, red pseudocolor), and mesenchymal cells are indicated by staining with fibroblast-specific protein 1 (FSP1, S100A4). Proliferation is indicated by expression of PCNA (gray pseudocolor). White arrows indicate LEL+ PCNA+ cells (proliferating ECs), and orange arrows indicate FSP-1+ PCNA+ cells (proliferating mesenchymal lineage cells). The dotted squares indicate areas that are shown in greater detail in the images as indicated by thick yellow arrows. Nuclear staining with DAPI (blue). Scale bars: 50 μm, except for FSP-1/LEL/PCNA staining images that show more detail on far right, which have a scale bar of 20 μm. Images represent n = 3 control and n = 3 PAH patients.
Figure 2.

Reduced p53 protein level in PAECs from PAH patients and endothelial deletion of p53 exaggerates PH induced by SU5416 and chronic hypoxia
(A and B) Representative western blot (A) and densitometric quantification (B) of p53 in pulmonary artery EC lines from n = 4 control and n = 4 PAH patients. β-actin is loading control. Data were normalized to the arithmetic mean of the control ECs. ∗∗p < 0.01 (t test).
(C) Right ventricular systolic pressure (RVSP) and (D) Fulton index of male and female p53 wt Cdh5-Cre−, p53 wt Cdh5-Cre+, p53flox Cdh5-Cre−, and p53flox Cdh5-Cre+ mice at day 21 after exposure to normoxia or cHx/Su.
(E) Representative images of α-smooth muscle actin immunohistochemistry show increased pulmonary artery media wall thickness in p53flox Cdh5-Cre+ mice exposed to cHx/Su. Counterstaining with Meyer’s hematoxylin.
(F) Media wall thickness (MWT) of pulmonary arteries.
(G and H) Representative images (G) and quantification (H) of immunohistochemistry for proliferating cell nuclear antigen (PCNA). Arrows indicate PCNA+ cells in PAs. Counterstaining with Meyer’s hematoxylin.
(I) Representative optical sections obtained by confocal microscopy show reduced BMPR2 (green pseudocolor) and TLR3 (cyan pseudocolor) expression in Lycopersicon Esculentum lectin+ (LEL, tomato lectin) endothelial cells (ECs) (red pseudocolor) in pulmonary arteries from cHx/Su-treated p53flox Cdh5-Cre+ mice. Arrows show ECs with BMPR2 and TLR3 staining, which is reduced in Cre+ mice. Nuclear staining with DAPI. Overlay with differential interference contrast (DIC) demonstrates tissue structure. Images represent n = 3 per group. Scale bar: 25 μm. (C, D, F, H): ∗p < 0.05, ∗∗p < 0.01, ∗∗∗p < 0.001, ∗∗∗∗p < 0.0001 (two-way ANOVA). All values are expressed as single data points and mean ± SEM.
See also Figure S1.
Endothelial knockout of p53 exaggerates PH in mice treated with chronic hypoxia and SU5416
Then, we tested whether endothelial loss of p53 promotes PH in vivo. We induced PH in p53flox Cdh5-Cre− and p53flox Cdh5-Cre+ mice using the cHx/Su protocol as previously described.23 Normoxic p53flox Cdh5-Cre+ mice had no significant difference in right ventricular systolic pressure (RVSP), Fulton index, echocardiographic pulmonary artery acceleration time (PAAT), the number of PCNA+ mural cells, and media wall thickness (MWT) (Figures 2C–2F and S1). Following 21 days of cHx/Su exposure, p53flox Cdh5-Cre+ mice showed higher RVSP and Fulton index and lower echocardiographic pulmonary artery acceleration time (PAAT) (Figures 2C, 2D, and S1) than p53flox Cdh5-Cre− controls. We also found higher media wall thickness (MWT) and fraction of fully muscularized PAs in cHx/Su p53flox Cdh5-Cre+ mice (Figures 2E, 2F, and S1). cHx/Su p53flox Cdh5-Cre+ mice had a higher proliferation rate (PCNA+ cells) in the PAs (Figures 2G and 2H). There was no significant change in these parameters between p53 wt Cdh5-Cre− and p53 wt Cdh5-Cre+ mice exposed to normoxia or cHx/Su. In addition, cHx/Su p53flox Cdh5-Cre+ mice had less apoptotic mural cells (cleaved caspase 3+) in the PAs (Figure S1). Together, these findings show an overall shift toward proliferation. We further detected reduced expression of TLR3 and BMPR2 in pulmonary artery ECs from p53flox Cdh5-Cre+ mice exposed to cHx/Su compared with Cre− mice (Figure 2I).
Clonal selection requires downregulation of P53
Our previous work has shown that four generations of clonal selection of rat lung CD117+ ECs yield highly proliferative EC clones. Injection of these EC clones induced occlusive arteriopathy in rats exposed to chronic hypoxia.11 We found reduced mRNA expression of Tp53 and Tlr3 in rat lung CD117+ ECs after four generations of clonal expansions (Figures 3A and 3B). Using in silico prediction with the Eukaryotic Promoter Database,25 we identified multiple p53 consensus elements in the TLR3 gene of three species, homo sapiens, rattus norvegicus, and mus musculus (Figure S2). Clonal expansions also increased mono-methylated H2A/H4 histones, an indicator of epigenetic modification, which could in turn contribute to altered mRNA expression in quaternary EC clones26 (Figure S3). To further test the question of changes in histone methylation as a consequence of clonal expansion, we performed in silico modeling using publicly available databases for histone methylation and transcription factor chromatin immunoprecipitation (ChIP) analyses. We compared human umbilical vein endothelial cells (HUVECs), CD34+ common myleloid progenitors (CMP), and K562, an immortalized myelogenous leukemia cell line, which we used as “clonal cell” surrogates for the CD34+ CMPs. For the p53 (TP53) promoter, we detected unique peaks in the “clonal” K562, but not in CD34+ CMPs and HUVECs (Figure S4). These unique peaks were two histone3-lysine36 trimethylation (H3K36me3) peaks and one histone 3 lysine4 trimethylation (H3K4me3) peak. The unique H3K4me3 peak was found at the same location as the second H3K36me3 peak. We further found correlation of SMAD1 and signal transducer and activator of transcription 5A (STAT5A) with a different H3K4me3 peak in all three cell lines and weaker STAT1 and STAT4 peaks within some of the H3K4me3 peaks in K562 cells. For the TLR3 promoter region, we found a H3K27me3 peak in K562, which was not present in CD34+ CMPs and HUVECs (Figure S5). Instead, CD34+ CMPs shared a H3K4m3 peak with HUVECs and had a unique H3K36me3 peak. No clear overlap with transcription factor peaks was found for TLR3. Lastly, a SMAD4 peak in BMPR2 correlated with a H3K4me3 peak in all three cell lines (Figure S6). Hence, based on these findings it is possible that changes in histone methylation may occur during clonal expansion around the p53 and TLR3 promoter and that some transcription factor binding sites around the p53 promoter may be impacted by differences in histone methylation, including SMAD1 and STAT5A. Then we tested whether clonal expansion requires downregulation of p53. Rat lung CD117+ ECs underwent clonal expansion for 14 days in the presence of vehicle or Nutlin 3a. Nutlin 3a is an inhibitor of the E3 ubiquitin protein ligase mouse double minute 2 homolog (MDM2), which targets p53. Nutlin 3a treatment abolished the clonogenic potential (Figure 3C). Silencing of p53 in rat lung CD117+ ECs using siRNA reduced mRNA expression of Tlr3 and the BMPR2 downstream target inhibitor of DNA binding 1 (Id1) (Figure 3D). p53 silencing also increased matrigel network formation (Figures 3E and 3F). Nutlin 3a increased p53 protein level in CD117+ EC clones, as well as mRNA expression of Tlr3, Mdm2 (a p53 target gene), and Id1 (Figures 3G–3I). Nutlin 3a reduced matrigel network formation and 3D spheroid sprouting in fourth generation CD117+ EC clones (Figures 3J, 3K, and S7). To test whether higher p53 protein levels also promote TLR3 and BMPR2 signaling, we treated human PAH PAECs with Nutlin 3a. Nutlin 3a augmented protein levels of p53, TLR3, and BMPR2, as well as phospho-(p)-interferon regulatory factor 3 (IRF3) and phospho-(p)-Smad1/5/9 (Figures 3L–3N). However, Nutlin 3a did not modulate Smad1/5/9 phosphorylation following BMP9 stimulation (Figure S8). Nutlin 3a increased mRNA expression of TLR3 (Figure 3O). Nutlin 3a reduced matrigel network formation in PAH PAECs (Figures 3P and S9). When human PAECs underwent clonal expansion in the presence of Nutlin 3a for 14 days, clonal expansion was prevented, similar to our findings in rat lung CD117+ ECs (Figure 3Q). We further found that 72 h of Nutlin 3a treatment induced DNA synthesis and apoptosis in PAECs (Figure S9). Sex and age of the patients that were used as source for PAECs for the cell culture experiments are shown in Tables S3.
Figure 3.

Clonal expansion requires loss of p53, and p53 regulates TLR3 expression in rat lung CD117+ ECs and EC clones and human pulmonary artery ECs from PAH patients
(A and B) qRT-PCR data show lower Tp53 and Tlr3 expression after four generations of clonal expansion in CD117+ lin− CD31+ rat lung ECs.
(C) Clonal expansion was vastly reduced in CD117+ rat lung ECs when treated for 14 days with Nutlin 3a, which inhibits p53 protein degradation. Figures indicate the number of wells that yielded colonies from a single cell after 14 days. n = 4 per group.
(D) qRT-PCR shows reduced mRNA expression of Tp53, Tlr3, and Id1 following siRNA targeting p53 versus control (scrambled, scrm) siRNA in rat lung CD117+ ECs. n = 5–6.
(E and F) Representative images (scale bar: 250 μm, stitched images) and quantification of total network area and network length from 2D matrigel tube formation assay in CD117+ rat lung ECs after treatment with siRNA targeting p53 or scrambled (scrm) unspecific siRNA. n = 4 per group.
(G and H) Representative western blots (G) and quantification of three independent experiments (H) show p53 protein accumulation following treatment with the MDM2 inhibitor Nutlin 3a. n = 9 per group total.
(I) qRT-PCR shows increased expression of Tlr3, Mdm2, and Id1 following Nutlin 3a treatment. n = 6 per group.
(J and K) Representative images (scale bar: 250 μm, stitched images) and quantification of total network area and network length in rat lung CD117+ fourth generation EC clones after treatment with Nutlin 3a or vehicle. n = 5 per group.
(L and N) Representative western blots of p53, TLR3, BMPR2, phospho-(p)-IRF3, and p-Smad1/5/9 (L) and densitometric quantification of p53, TLR3, and BMPR2 from 2 independent experiments (n = 3 each) in PAECs from PAH patients following Nutlin 3a or vehicle treatment for 24 h.
(O) qRT-PCR shows increased TLR3 mRNA expression following Nutlin 3a treatment in PAH PAECs. n = 5 per group.
(P) Quantification of total network area and network length in PAH PAECs after treatment with Nutlin 3a or vehicle. n = 10 per group. Quantification data are n-fold of the arithmetic mean of veh.
(Q) Clonal expansion was vastly reduced in PAECs following 14 days of treatment with Nutlin 3a. Figures indicate the number of wells that yielded colonies from a single cell after 14 days. n = 4 per group. All values are expressed as mean ± SEM. ∗p < 0.05, ∗∗p < 0.01, ∗∗∗p < 0.001, ∗∗∗∗p < 0.0001 (t test).
See also Figures S2–S9.
Nutlin-3a treatment reduces pulmonary arteriopathy and PH in rats injected with EC clones
We have previously shown that transplantation of rat lung CD117+ EC clones to rats exposed to cHx promotes more severe arteriopathy and PH.11 We found that these EC clones have reduced mRNA expression of Tp53 and Tlr3 (Figures 3A and 3B), and transplantation of these EC clones reduced lung tissue protein levels of p53 and TLR3 compared with rats exposed to cHx + vehicle (Figure S10). To induce p53 protein levels, rats were treated with Nutlin 3a or vehicle after transplantation of CD117+ EC clones and while being exposed to cHx (cHx + EC clone). Nutlin 3a treatment reduced RVSP and increased PAAT, with the Fulton showing a trend toward reduction. We further found reduced PA occlusion and decreased MWT of medium sized PAs (50 μm < ED ≤ 100 μm) (Figures 4A–4H). Using immunofluorescence staining and confocal microscopy, we detected increased p53 protein in PAs from cHx/EC clone rats compared with vehicle treatment (Figure 4I). Nutlin 3a treatment elevated BMPR2 and TLR3 in PA mural cells (Figure 4J). We confirmed these findings with western blot analysis of whole lung protein lysates and found increased protein expression of p53, TLR3, BMPR2, and p-Smad1/5/9, but reduced protein expression of PCNA in the lungs of Nutlin 3a-treated cHx/EC clone rats (Figures 4K and 4L).
Figure 4.

Nutlin 3a treatment decreases pulmonary artery remodeling and PH in chronic hypoxia+CD117+ EC-clone-induced PH
(A) RVSP and (B) RV hypertrophy index following Nutlin 3a or vehicle treatment from day 1–21 in cHx + EC clone PH male rats at day 21.
(C and D) Representative images of von Willebrand factor (vWF) and α-smooth muscle actin (α-SMA) immunohistochemistry. Scale bar: 25 μm.
(E) Echocardiographically measured pulmonary artery acceleration time (PAAT) following Nutlin 3a or vehicle treatment from day 1–21 in chronic hypoxia/EC clone PH male rats at day 21.
(F) Quantification of open, partially occluded, and fully occluded pulmonary arteries in vehicle and Nutlin-3a treated chronic hypoxia/EC clone rats.
(G and H) Media wall thickness (MWT) of small- (G) and medium-sized (H) pulmonary arteries.
(I) Representative optical sections of p53 immunofluorescence staining (green pseudocolor) obtained by confocal microscopy show stronger p53 staining in pulmonary arteries, including nuclear accumulation in an EC (arrow) following Nutlin 3a treatment. Nuclear staining with DAPI. Scale bar: 25 μm.
(J) Representative optical sections obtained by confocal microscopy show reduced BMPR2 (green pseudocolor) and TLR3 (cyan pseudocolor) expression in Lycopersicon Esculentum lectin+ (LEL, tomato lectin) ECs (red pseudocolor) in pulmonary arteries from chronic hypoxia/EC clone + vehicle rats. Nutlin 3a treatment substantially increased BMPR2 and TLR3 staining. Yellow arrows show ECs with strong BMPR2 and TLR3 staining. Nuclear staining with DAPI. Overlay with differential interference contrast (DIC) demonstrates tissue structure. Scale bar: 25 μm. Images represent n = 3 per group.
(K) Western blots from lung tissue homogenate of chronic hypoxia/EC clone rats treated with vehicle or Nutlin 3a demonstrates increased p53, phospho-(p)-Smad1-5-9, TLR3 and BMPR2 protein levels, and reduced PCNA protein expression. β-actin is loading control.
(L) Densitometric quantification of the western blots in Κ versus β-actin. Data are normalized to the arithmetic mean of the vehicle controls. All values are expressed as mean ± SEM. ∗p < 0.05, ∗∗p < 0.01, ∗∗∗p < 0.001 (t test, except for F: one-way ANOVA).
See also Figure S10.
TLR3 agonist promotes BMPR2 signaling in p53-deficient ECs
Next, we tested whether promoting TLR3 signaling will improve BMP signaling and endothelial function in p53-deficient PAECs. p53 expression was silenced in human PAECs by using short hairpin RNA targeting TP53 (sh-TP53). We found that p53 silencing increased DNA synthesis (BrdU incorporation) and matrigel network formation (Figures 5A–5D). The TLR3 agonist Poly(I:C) reduced DNA synthesis and network formation of p53 deficient PAECs to the levels of sh-scrm PAECs. We demonstrated reduced protein level of TLR3, p-IRF3, and p-Smad1/5/9 in sh-TP53 ECs (Figures 5E and 5F). Poly(I:C) elevated protein expression of TLR3, p-IRF3, BMPR2, and p-Smad1/5/9 (Figures 5E and 5F). sh-TP53 reduced mRNA expression of TP53, TLR3, the TLR3/IRF3/type interferon downstream mediator CXC chemokine ligand 10 (CXCL10), and BMP4 (Figure 5G). Poly(I:C) increased mRNA expression of TLR3 and CXCL10. Poly(I:C) further augmented BMP2, but not BMP4 mRNA expression. Hence, the TLR3 agonist Poly(I:C) improves BMPR2 expression and signaling and EC function in p53-deficient ECs.
Figure 5.

Increased TLR3 signaling promotes BMPR2 signaling in p53-deficient PAECs
(A and B) Representative histograms of 5-bromodesoxyuridine (BrdU) pulsed (4h) and BrdU-antibody-stained (AF647) PAECs treated with adenoviruses expressing sh-scrm (control sh RNA), sh-TP53, and sh-TP53 combined with 25 μg/mL Poly(I:C). (B) Quantification from 2 different cell lines (total n = 6 each). Data indicate increased DNA synthesis in sh-TP53 cells, which is reduced by Poly(I:C). Data are shown after normalization to the arithmetic mean of the sh-scrm group.
(C and D) Representative phase contrast images (scale bar: 500 μm, stitched images, C) and quantification of total network area and network length (D) in rat lung CD117+ fourth generation EC clones after treatment with Nutlin 3a or vehicle. Two different cell lines (total n = 12 each). Data are shown after normalization to the arithmetic mean of the sh-scrm group.
(E and F) Western blots (E) and densitometric quantification (F) of TLR3, p-IRF3, BMPR2, p-Smad1/5/9, and Smad1 in PAECs treated with sh-scrm, sh-TP53, and sh-TP53 + Poly(I:C). The results have been expressed as a ratio of the loading control β-actin and normalized to the arithmetic mean of the sh-scrm group.
(G) qRT-PCR quantification of steady-state mRNA levels of TP53, TLR3, CXCL10, BMP2, and BMP4. The results are expressed as a ratio of the housekeeping gene and normalized to the arithmetic mean of the sh-scrm group. The data are shown as single data points and mean ± SEM. Data are shown as single data points and mean ± SEM. ∗p < 0.05, ∗∗p < 0.01, ∗∗∗p < 0.001, ∗∗∗∗p < 0.0001 (one-way ANOVA).
TLR3 signaling regulates endothelial BMPR2 signaling
In silico analysis with the Eukaryotic Promoter Database revealed IRF3 consensus sites in the BMPR2 gene of homo sapiens and mus musculus within a range of 2,000 bp upstream of the transcription start site (TSS) of the BMPR2 genes (Figure S11). The Eukaryotic Promoter Database provided two versions of the human BMPR2 promoter, BMPR2_1 and BMPR2_2. Both share the baseline information (Ensembl: ENSG00000204217 and RefSeq: NM_001204), but BMPR2_1 starts in the genome on Chromosome [NC_000002.12], Strand [+] at position [202376438], whereas BMPR2_2 starts in the genome on Chromosome [NC_000002.12]; Strand [+] at position [202376813]. We then tested whether BMPR2 expression and signaling requires TLR3-IRF3 signaling. We found reduced Bmpr2 mRNA and protein expression, as well as reduced p-Smad1/5/9 protein expression in sh-Tlr3-treated rat lung CD117+ ECs (Figures 6A–6C). DNA synthesis was increased in sh-Tlr3-treated CD117+ rat lung ECs (Figure S12). Following Clustered Regularly Interspaced Short Palindromic Repeats (CRISPR)/Cas9 interference targeting of TLR3, Matrigel network formation and DNA synthesis were increased in human PAECs (Figures 6D–6G and S12). Silencing of IRF3 reduced BMPR2 expression (Figures 6H and 6I). Using ChIP and quantitative real-time PCR (ChIP-PCR), we found that Poly(I:C) treatment promoted binding of IRF3 to all the predicted consensus regions. Because of the number of IRF3 consensus sites, we have integrated all consensus sites for the statistical analysis and detected a significant increase in overall binding of IRF3 to the consensus sites upstream of the BMPR2 TSS for Poly(I:C) treatment versus Control treatment using two-way ANOVA (p = 0.0049) (Figures 6J and 6K). Efficacy of Poly(I:C) treatment was verified by mRNA expression of the downstream mediator CXCL10 (Figure S13). Hence, BMPR2 expression is regulated via TLR3-IRF3 signaling by direct binding of IRF3 to consensus sites upstream of the BMPR2 TSS.
Figure 6.

TLR3/IRF3 signaling maintains lung endothelial BMPR2 expression in vitro
(A and B) Representative western blots (A) and densitometric quantification (B) of TLR3, BMPR2, and p-Smad1/5/9 in rat lung CD117+ ECs treated with sh-scrm (control-shRNA) and sh-Tlr3 (shRNA targeting Tlr3). The results have been expressed as a ratio of the loading control β-actin and normalized to the arithmetic mean of the sh-scrm group. The data are expressed as mean ± SEM.
(C) qRT-PCR shows reduced Tlr3 and Bmpr2 steady-state mRNA level after sh-Tlr3 treatment of rat lung CD117+ ECs. The results have been expressed as a ratio of the housekeeping gene and normalized to the arithmetic mean of the sh-scrm group. The data are shown as mean ± SEM.
(D and E) Representative immunoblot (D) and densitometric quantification (E) confirm the efficiency of the TLR3 CRISPR/cas9 gene editing in human PAECs.
(F and G) Representative differential interference contrast (DIC) images (stitched by software) (F) and quantification of total network area and network length (G) in control PAECs that underwent gene editing using CRISPR/Cas9 technology with sgRNA targeting TLR3 or unspecific (scrm) sgRNA. The results have been normalized to the arithmetic mean of the scrm sgRNA group. Scale bar: 500μm.
(H and I) Representative western blots (H) and densitometric quantification (I) indicate reduced BMPR2 expression in IRF3 siRNA-treated PAECs. The results have been normalized to the arithmetic mean of the si scrm group.
(J) Diagram showing the location targeted by the primers pairs for qPCR amplification after chromatin immunoprecipitation (ChIP) for the predicted IRF3 binding sites (1A-C and 2A-C) upstream of the human BMPR2 TSS. The Eukaryotic Promoter Database, which was used for consensus site prediction, provided two version of the human BMPR2 promoter, BMPR2_1 and BMPR2_2, with different starting positions on the chromosome.
(K) ChIP qPCR indicates IRF3 chromatin immunoprecipitation and amplification of predicted consensus sites with the specific IRF3 antibody, but not with IgG control antibody, suggesting specific binding of IRF3 at the predicted consensus sites. In addition, Poly(I:C) treatment (25 μg/mL, 24h) promoted IRF3 binding (=amplification) at all consensus sites upstream of BMPR2 TSS. Because of the number of potential consensus sites, data from all consensus sites were integrated for analysis using two-way ANOVA, demonstrating a significant increase in IRF3 binding with Poly(I:C) treatment [p = 0.0049 Poly(I:C) versus control]. Data are shown as single data points and mean ± SEM. ∗p < 0.05, ∗∗p < 0.01, ∗∗∗p < 0.001 (t test).
See also Figures S11–S13.
The TLR3 agonist Poly(I:C) reduces PH in wild type and p53−/− mice, but not in TRIFLPS2 mice
We then tested if the TLR3 agonist Poly(I:C) also reduces PH in p53 knockout or wild-type mice exposed to cHx/Su. p53−/− cHx/Su mice had higher RVSP than WT cHx/Su mice (Figure 7A). Preventive treatment of WT and p53−/− cHx/Su mice with Poly(I:C) reduced RVSP, MWT, and RV cardiomyocyte (CM) crossectional area (CSA), but increased PAAT, consistent with reduced PH (Figures 7A–7F). We found no difference in RVSP, PAAR, and RV CM CSA between WT and p53−/− mice housed in normoxia and treated with vehicle or Poly(I:C) (Figure S14). However, we found a small but significant increase in MWT in p53−/− mice under normoxia that was not responsive to Poly(I:C). We have previously shown increased MWT, but not RVSP, in normoxia exposed rats treated with Poly(I:C).23 We further tested whether the protective effects of Poly(I:C) depend on TLR3 signaling in vivo. We used mice with mutation of the TLR3 downstream adapter protein TRIF, rendering it nonfunctional (TRIFLPS2). The protective effect of Poly(I:C) on RVSP, PAAT, MWT, and RV CM CSA was abolished in TRIFLPS2 mice exposed to cHx/Su (Figures 7A–7F). Interestingly, normoxic TRIFLPS2 mice had elevated RVSP and RV CM CSA that was not responsive to Poly(I:C), suggesting spontaneous PH with functional TRIF deficiency (Figure S14). Hence, the TLR3 agonist Poly(I:C) reduces PH in the context of p53 deficiency, but the protective effects of Poly(I:C) require functional TLR3-TRIF signaling.
Figure 7.

Poly(I:C) treatment reduces PH in p53−/− mice, but not in TRIFLPS2 mice
(A) RVSP and (B) PAAT of wild-type (WT), p53−/−, and TRIFLPS2 mice treated with cHx/Su and Poly(I:C) or vehicle.
(C and D) Representative images (C, hematoxylin-eosin) and quantification of MWT (D) show increased media thickness in p53−/− mice following cHx/Su exposure and that Poly(I:C) reduced media thickness in WT and p53−/− mice.
(E and F) Representative images (E, Masson Trichrome) and quantification of RV cardiomyocyte (CM) cross-sectional area (CSA) show reduced CSA following Poly(I:C) treatment in cHx/Su exposed WT and p53−/− mice, but not in TRIFLPS2 mice. TRIFLPS2 mice had increased CSA compared with WT mice following vehicle treatment. Scale bars: 25 μm. Data are shown as single data points and mean ± SEM. ∗p < 0.05, ∗∗p < 0.01, ∗∗∗p < 0.001, ∗∗∗∗p < 0.0001 (two-way ANOVA).
See also Figure S14.
Discussion
PAH remains a devastating disease with a 5-year survival below 50% in patients with poor functional class.3 The pulmonary arteriopathy advances in PAH patients despite current treatment options.4 This dilemma motivates research into pulmonary vascular remodeling in PAH patients. Loss-of-function mutations of BMPR2 are major contributors to vascular remodeling in PAH. Yet the penetrance of these mutations is low, and most PAH patients are lacking BMPR2 mutations.13 Although multiple additional mechanisms may reduce BMPR2 expression in the remodeled pulmonary arteries without mutations,13 we need a better understanding of the origin of reduced BMPR2 expression.
Here, we have tested the hypothesis that clonal endothelial growth depends on the downregulation of the cell-cycle regulator p53, leading to loss of TLR3 and BMPR2, which drives aberrant function in surviving ECs and PH. Induction of p53 and TLR3 restores EC function via BMPR2. The main findings of our studies were as follows: (1) PAH ECs had reduced p53, TLR3, and BMPR2 expression and evidence for increased proliferation. (2) Endothelial-specific KO of p53 in mice amplified lung vascular remodeling and PH and reduced endothelial expression of TLR3 and BMPR2. (3) Clonal expansion of CD117+ ECs reduced p53 expression, whereas reducing p53 degradation blocked clonal expansion of ECs. (4) Expression of TLR3 in ECs was directly regulated by p53. (5) In vivo, p53 accumulation prevented pulmonary arteriopathy and PH in chronic hypoxic rats injected with CD117+ EC clones. (6) The TLR3 agonist Poly(I:C) induced BMPR2 expression and downstream signaling in p53-deficient ECs. (7) The transcription factor IRF3 binds to multiple consensus sites upstream of the BMPR2 TSS, and this binding is enhanced by Poly(I:C). (8) Poly(I:C) ameliorated PH in p53−/− mice but not in TRIFLPS2 mice, suggesting that TLR3-TRIF signaling is required for the protective effects of Poly(I:C) downstream of p53.
Under homeostatic conditions, p53 is activated following DNA damage to promote cell-cycle arrest and apoptosis.27 This mechanism prevents the accumulation of DNA mutations. p53 is frequently mutated and inactivated in cancer cells, and this deficient p53 protein then accumulates in the cell nucleus without exerting its regulatory function.27 Mutations of p53 have so far not been detected in PAH, but the lung tissue of rodents with hypoxia-induced PH shows reduced expression of p53.20,21 Here, we show reduced endothelial p53 expression in occluded pulmonary arteries and PAECs from PAH patients. Further, we reveal loss of p53 expression following repeated clonal expansion of primitive CD117+ rat lung ECs. These findings provide a potential mechanism for the unchecked proliferation, which we have recently described in these EC clones.11 Clonal selection has emerged as a potential mechanism for aberrant ECs in plexiform lesions of PAH patients, but the exact function and mechanism is not understood.8 Our in-silico modeling suggests that clonal expansion could change the histone methylation pattern upstream of the p53 promoter, hence regulating p53 transcription. Changes in histone methylation and acetylation have been studied as potential drivers of endothelial dysfunction in some forms of PH.28 Further, we show here that reducing p53 degradation with Nutlin 3a abolished clonal expansion in rat lung CD117+ ECs and human PAECs. These findings suggest that p53 downregulation is necessary for clonal expansion, likely because loss of p53 provides ECs with a selection advantage similar to cancer cells. Knockout or inactivation of p53 indeed promotes PH.19,29 Our current data show that endothelial-specific knockout of p53 suffices to exaggerate cHx/Su PH in mice. Hence endothelial p53 has an important role for the response of the lung vasculature to injury, such as in PH. Despite agreement that p53 activity affects PAH pathogenesis, there is some controversy on p53 in PAH: PAECs from mice with hypoxia-induced PH show increased levels of p53,30 consistent with hypoxia-induced cell-cycle arrest. Another study found context-dependent changes of p53 expression in PAECs with reduced BMPR2 expression, inducing either apoptosis or a proinflammatory environment with altered mitochondrial metabolism.17 p53 further protects ECs from DNA damage-induced stress by inducing protective gene expression, suggesting that the role of p53 may be more complex and context dependent in ECs.18
An important question is how p53 contributes to the profound changes in EC function and health in PAH. We show here that p53 regulates TLR3 mRNA expression in ECs, similar to a previous report in epithelial cells.22 We further found in vivo that p53 regulates endothelial TLR3 protein expression and signaling and that knockdown of p53 and TLR3 permits enhanced angiogenesis and proliferation in vitro consistent with a more aggressive endothelial phenotype. These data and our in-silico modeling suggest that repression of TLR3 through altered histone methylation and p53 reduction could explain reduced TLR3 expression. In addition, the TLR3 agonist Poly(I:C) restored baseline angiogenesis and DNA synthesis in ECs after p53 knockdown. These results provide a new angle on the regulatory function of p53 and TLR3 on cell function in ECs. Based on our findings, TLR3 repression mediates many effects of deficient p53 signaling. Our previous data showed induction of apoptosis in ECs with loss of TLR3,23 but our current study demonstrates that loss of TLR3 also enhances angiogenic network formation in vitro. Increased angiogenic network formation may potentially be driven by the enhanced proliferation of surviving ECs as shown in our current work, because we found reduced migration following loss of TLR3.23 One explanation for this paradox is the concept of apoptosis-induced selection pressure on ECs during the development of PAH.8 The surviving p53- and TLR3-deficient ECs may exhibit a proliferative phenotype. Indeed, highly angiogenic CD117+ EC clones promote occlusive pulmonary arteriopathy,11 and these clones have reduced TLR3 expression. This concept may explain how TLR3-deficient hyperproliferative ECs emerge during the development of lung vascular remodeling in PAH. Based on our previous findings,23 reduced TLR3 expression may also cause ongoing apoptosis in apoptosis-prone ECs, which could be progeny of the surviving hyperproliferative ECs. This process may cause continuous selection pressure that maintains p53- and TLR3-deficient, hyperproliferative ECs.
When we used the TLR3 agonist Poly(I:C), we found reduced severe occlusive arteriopathy, mural cell apoptosis and proliferation, and PH in rats.23 These data support our concept that TLR3 deficiency may drive both apoptosis and proliferation, potentially in different subsets of ECs. Our concept is further backed by the finding that Poly(I:C) decreases PH in p53-deficient PH mice in our current study. After transplanting CD117+ clonal ECs, we saw a dramatic reduction in TLR3 expression in the lung tissue. We propose that this finding may be caused by a combination of transplanting TLR3-deficient CD117+ EC clones, a general loss of endothelial TLR3 expression in lung vascular remodeling (for example, by downregulating p53 as part of a proliferative phenotype), and changes in TLR3 expression in other cell types by the transplanted CD117+ EC clones. We have already shown that growth factor signaling can be modulated by CD117+ EC clones in a paracrine way.11 Overall, our data support a role of TLR3 as a regulator of angiogenesis, cell proliferation, and apoptosis and indicates a tightly regulated and essential p53-TLR3 signaling axis in ECs.23,31,32,33,34,35
We have recently shown that increasing TLR3 signaling reverses pulmonary arteriopathy,23 lacking knowledge of the full protective mechanism. Several studies have connected dysfunctional BMPR2 signaling to impaired endothelial function and PH.18,36,37 Here, we show that clonal expansion results in ECs deficient in p53 and TLR3, repressing BMPR2 expression likely via reduced IRF3 signaling. This finding alternatively explains reduced BMPR2 expression and signaling in ECs of PAH patients without BMPR2 mutations.38,39 Our results also provide a more comprehensive mechanism for the therapeutic effects of Poly(I:C). We have previously shown that Poly(I:C) induces TLR3 via interleukin-10 (IL-10).23 According to our data, Poly(I:C) also increases binding of the transcription factor IRF3 to multiple consensus sites upstream of the TSS of the BMPR2 gene. Such interaction further increases our knowledge on the connection of innate RNA signaling downstream of TLR3 and a key growth factor receptor for lung vascular homeostasis. Our findings provide one potential explanation for the hyperproliferative, yet dysfunctional EC phenotype: according to our data, this may occur because of reduced p53, TLR3, and BMPR2 expression and signaling.40 Besides our findings, negative regulators of BMPR2 expression have been identified in PAH, such as hypoxia,41,42,43 TLR4 signaling,44 IL-6,45 and tumor necrosis factor alpha.39 Interestingly, non-IRF3-dependent branches of TLR3 signaling induce some of these negative regulators, such as nuclear factor κB, indicating a complex context-dependent role of TLR3 signaling in PAH.46
In conclusion, our data show an interaction between clonal expansion in CD117+ ECs and negative regulation of a p53/TLR3 pathway in PAH. Further, loss of p53/TLR3 signaling results in decreased BMPR2 expression at least partially via IRF3 and reduced BMPR2 expression, and PH is reversed by Poly(I:C) treatment in p53-deficient ECs and cHx/Su p53 knockout mice.
Limitations of the study
The limitations of our study include that we did not test whether increasing BMPR2 expression following TLR3 agonist treatment is indeed responsible for the reduction in pulmonary vascular remodeling and PH. In addition, we cannot completely exclude the possibility that embolization occurs in our chronic hypoxia + CD117+ EC clone model. Consistent with the magnitude of the change of RVSP in Figure 4, RV hypertrophy was not significantly changed by Nutlin 3a treatment. Further, the comparison of CD34+ CMPs and K562 immortalized myelogenous cancer cell line must be interpreted with caution, as this comparison may not be fully representative of the differences between clonally expanded ECs and non-clonally expanded ECs. Also, even though we have shown that PAH lung vascular lesions contain PCNA+ ECs and that an impaired p53-TLR3 axis plays a role in increased DNA synthesis in ECs, other cell types may also be involved in the formation of lung vascular lesions in PAH. Lastly, it is important to note that for the data in Figure 7 whole-body p53−/− mice were used, whereas endothelial-specific p53 knockout mice (p53flox Cdh5-Cre+) mice were used for the experiments shown in Figure 2.
STAR★Methods
Key resources table
| REAGENT or RESOURCE | SOURCE | IDENTIFIER |
|---|---|---|
| Antibodies | ||
| PCNA | Cell Signaling technology | 2586; RRID:AB_2160343 |
| TLR3 | Cell Signaling technology | 6961; RRID:AB_10829166 |
| TLR3 | Abcam | ab62566; RRID:AB_956368 |
| p53 | Cell Signaling technology | 2527; RRID:AB_10695803 |
| p53 | Sigma Aldrich | MABE283 |
| p53 | Proteintech | 21891-1-AP; RRID:AB_10896826 |
| vWF | DAKO | A0082 |
| vWF | Millipore Sigma | MAB3442; RRID:AB_2216703 |
| Histones H2A (monomethyl R3)+H4 (monomethyl R3) | Abcam | ab177186 |
| FSP-1 | Abcam | ab27957; RRID:AB_2183775 |
| BMPR2 | Abcam | ab130206; RRID:AB_11155873 |
| p-IRF3 | Abnova | PAB25053 |
| p-IRF3 | Cell Signaling technology | 29047; RRID:AB_2773013 |
| IRF3 | Cell Signaling technology | 4302; RRID:AB_1904036 |
| IRF3 | Active Motif | 39371; RRID:AB_2793232 |
| Rabbit-IgG | Diagenode | C15410206; RRID:AB_2722554 |
| p-Smad 1/5/9 | Cell Signaling technology | 9511; RRID:AB_331671 |
| Smad 1 | Cell Signaling technology | 9743; RRID:AB_2107780 |
| α-smooth muscle actin | DAKO | M0851 |
| β-actin | Millipore Sigma | A5441; RRID:AB_476744 |
| Cleaved caspase 3 | Cell Signaling Technology | 9661; RRID:AB_2341188 |
| anti-mouse HRP-conjugated | Cell Signaling Technology | 7076; RRID:AB_330924 |
| anti-rabbit HRP-conjugated | Cell Signaling Technology | 7074; RRID:AB_2099233 |
| anti-rabbit biotin conjugated | Millipore Sigma | AP132B; RRID:AB_90264 |
| anti-mouse biotin conjugated | Millipore Sigma | AP307P |
| anti-mouse IgG2a AF647 linked | Invitrogen | A21241 |
| anti-rabbit IgG AF488 linked | Invitrogen | A21441 |
| anti-mouse IgG2a AF488 linked | Invitrogen | A21131 |
| anti-mouse IgG1 AF594 linked | Invitrogen | A21125 |
| anti-rabbit IgG AF594 linked | Invitrogen | A21442 |
| Biological samples | ||
| CD117+ rat lung ECs and EC clones | Isolated in lab | Bhagwani et al.11 |
| Human pulmonary artery endothelial cells | University of Pittsburgh Cell Processing Core and PHBI | N/A |
| Human lung tissue sections | PHBI tissue core | N/A |
| Lung tissue (rat and mouse) | this study | N/A |
| heart tissue (rat and mouse) | this study | N/A |
| Chemicals, peptides, and recombinant proteins | ||
| Nutlin-3a | Adooq Bioscience | A11501 |
| SU5416 | Millipore-Sigma | S8442 |
| Poly(I:C) | Tocris | 4287 |
| Poly(I:C) | Invivogen | tlrl-pic |
| Genemute | SignaGen Laboratories | SL100568 |
| APC BrdU flow kit (includes anti-BrdU APC-conjugated antibody and BrdU) | BD Pharmingen | 51-9000019AK |
| Lycopersicon Esculentum (LEL, Tomatolectin) conjugated with Texas Red | Vector Laboratories | TL-1176-1 |
| DAPI | Invitrogen | D1306 |
| miRNAeasy RNA isolation kit | Qiagen | 217084 |
| HRP conjugated Streptavidin | Vector Laboratories | SA-5004 |
| RIPA buffer | Millipore Sigma | R0278 |
| nitrocellulose membrane | Biorad | 1620094 |
| Proteinase K | DAKO | S3004 |
| SlowFade Gold | ThermoFisher | S36936 |
| DPX Mountant for Microscopy | Electron Microscopy Science | 13510 |
| DNAse I, Amplification Grade | Invitrogen | 18068015 |
| High capacity cDNA reverse transcription kit | Applied Biosystems | 4368813 |
| iTaq SYBR Green master mix | Biorad | 1725120 |
| Westernbright Sirius HRP substrate | Advansta | K-12043 |
| Protein G Dynabeads | Invitrogen | 10004D |
| Deposited data | ||
| ENCODE: ENCSR038DJJ | ENCODE portal | https://www.encodeproject.org |
| ENCODE: ENCSR189PYJ | ENCODE portal | https://www.encodeproject.org |
| ENCODE: ENCSR376XAV | ENCODE portal | https://www.encodeproject.org |
| ENCODE: ENCSR109SJT | ENCODE portal | https://www.encodeproject.org |
| ENCODE: ENCSR000BRR | ENCODE portal | https://www.encodeproject.org |
| ENCODE: ENCSR663NFC | ENCODE portal | https://www.encodeproject.org |
| ENCODE: ENCSR668LDD | ENCODE portal | https://www.encodeproject.org |
| ENCODE: ENCSR000APE | ENCODE portal | https://www.encodeproject.org |
| ENCODE: ENCSR000AKQ | ENCODE portal | https://www.encodeproject.org |
| ENCODE: ENCSR000AKR | ENCODE portal | https://www.encodeproject.org |
| ENCODE: ENCSR000AKX | ENCODE portal | https://www.encodeproject.org |
| ENCODE: ENCSR045QJH | ENCODE portal | https://www.encodeproject.org |
| ENCODE: ENCSR979RHZ | ENCODE portal | https://www.encodeproject.org |
| ENCODE: ENCSR038GYF | ENCODE portal | https://www.encodeproject.org |
| ENCODE: ENCSR106VNH | ENCODE portal | https://www.encodeproject.org |
| ENCODE: ENCSR578QSO | ENCODE portal | https://www.encodeproject.org |
| ENCODE: ENCSR000ATB | ENCODE portal | https://www.encodeproject.org |
| ENCODE: ENCSR000AKK | ENCODE portal | https://www.encodeproject.org |
| ENCODE: ENCSR000ALC | ENCODE portal | https://www.encodeproject.org |
| ENCODE: ENCSR000ALF | ENCODE portal | https://www.encodeproject.org |
| Experimental models: Organisms/strain | ||
| Sprague Dawley rats | Envigo laboratories | 002 |
| P53-/- mice | Jackson laboratories | B6.129S2-Trp53tm1Tyj/J |
| P53flox mice | Jackson laboratories | B6.129P2-Trp53tm1Brn/J |
| Cdh5-Cre mice | Jackson laboratories | B6;129-Tg(Cdh5-cre)1Spe/J |
| TRIFLPS2 mice | Jackson laboratories | C57BL/6J-Ticam1Lps2/J |
| Wild type mice | Jackson laboratories | C57/BL6J |
| Tp53floxCdh5-Cre+ mice | This study - crossbreeding | N/A |
| Tp53floxCdh5-Cre- mice | This study - crossbreeding | N/A |
| CD117+ rat lung EC clones | Rat Research & Resource Center | SD-Tg(UBC-EGFP)2BalRrrc |
| Oligonucleotides | ||
| Human TP53 | Millipore-Sigma | forward FH_TP53_1 reverse RH_TP53_1 |
| Human TLR3 | Millipore-Sigma | forward FH_TLR3_2 reverse RH_TLR3_24 |
| Human CXCL10 | Qiagen | Hs_CXCL10_1_SG |
| Human IRF3 forward | IDT | TCG TGA TGG TCA AGG TTG TG |
| Human IRF3 reverse | IDT | ATG TGC AGG TCC ACA GTA TTC |
| Human ID1 | Qiagen | Hs_ID1_va.1_SG |
| Human BMP2 forward | IDT | CTA CCA GAA ACG AGT GGG AAA |
| Human BMP2 reverse | IDT | GAA GCT CTG CTG AGG TGA TAA A |
| Human BMP4 | Millipore-Sigma | forward FH_BMP4_1 reverse RH_BMP4_1 |
| Human BMPR2 | Qiagen | QT02317196 |
| Human GUSB | Millipore Sigma | forward FH1_GUSB reverse RH1_GUSB |
| Human TBP | Millipore Sigma | forward FH1_TBP reverse RH1_TBP |
| Human BMPR2_1-1600-1800 forward | IDT | AGGTTCAGGCCGGAGAAT |
| Human BMPR2_1-1600-1800 reverse | IDT | TTTATTTATTTATTGAGGCGGAGT |
| Human BMPR2_2-900-1100 forward | IDT | GTCCAGACTTCCGATCATGG |
| Human BMPR2_2-900-1100 reverse | IDT | CTGGTTTGTACAAGCGACCA |
| Human BMPR2_3-500-700 forward | IDT | CGCATCCTTGCAAATACTCA |
| Human BMPR2_3-500-700 reverse | IDT | GCTCCCCTCTGACTCAAACA |
| Human BMPR2_1-1300-1500 forward | IDT | TCTTAGAATCCGGGGTTGGT |
| Human BMPR2_1-1300-1500 reverse | IDT | CATGCTCTGCTTGCTTCTTCT |
| Human BMPR2_2-1000-1200 forward | IDT | TCAGTCCAGACTTCCGATCA |
| Human BMPR2_2-1000-1200 reverse | IDT | TGGTTTGTACAAGCGACCAG |
| Human BMPR2_3-800-1000 forward | IDT | AATCCTTGGAAACTGCGGTA |
| Human BMPR2_3-800-1000R | IDT | TTTTTAGGGCACGTGAAAGG |
| Rat Bmpr2 | Millipore Sigma | forward FR1_BMPR2 reverse RR1_BMPR2 |
| Rat Id1 | Qiagen | Rn_Id1_1-SG |
| Rat Mdm2 | Millipore Sigma | forward FR_MDM2_1 reverse RR_MDM2_1 |
| Rat Tp53 | Millipore Sigma | forward FR_Tp53_1 reverse RR_Tp53_1 |
| Rat Tlr3 forward | IDT | GCT-CCA-TCT-AAT-GTC-CAA-CTC A |
| Rat Tlr3 reverse | IDT | CCC-AAG-TTC-CCA-ACT-TTG-TAG-A |
| Rat Gusb | Millipore Sigma | forward FR1_Gusb reverse RR1_Gusb |
| Rat Tbp | Millipore Sigma | forward FR1_Tbp reverse RR1_Tbp |
| Ad-CMV-Cas9 | Vector Biolabs | 1900 |
| Ad-TLR3-sgRNACRISPRi | Applied Biological Materials | C070 (42159) (custom) |
| Ad-scrm-sgRNA-CRISPRi | Applied Biological Materials | C070 (42159) (custom) |
| Ad-h-TP53-shRNA | Vector Biolabs | 1854 |
| Ad-scrm-shRNA | Vector Biolabs | 1122 |
| siRNA targeting rat Tp53 | IDT | rn.Ri.Tp53 13.2 |
| siRNA targeting human IRF3 | IDT | hs.Ri.IRF3 13.3 |
| Software and algorithms | ||
| GraphPad Prism 9.0 | GraphPad | N/A |
| Fiji | https://fiji.sc | |
| CellSens | Olympus | N/A |
| Celeste | ThermoFisher | N/A |
| ggplot2 | https://ggplot2.tidyverse.org | |
| Eukaryotic Promoter Database | Transcription factor consensus site prediction for promoters | https://epd.epfl.ch//index.php |
| ImageLab | BioRad | N/A |
Resource availability
Lead contact
Further information and requests for resources and reagents should be directed to and will be fulfilled by the lead contact, Laszlo Farkas (laszlo.farkas@osumc.edu).
Materials availability
This study did not generate new and unique reagents. All reagents were purchased commercially from vendors listed in the key resources table. P53flox Cdh5-Cre mice have been crossbred from p53flox mice and Cdh5-Cre mice (both available from Jackson Labs) and are made available from the lead contact depending on restrictions set forth in the “General Terms and Conditions” for modified products of mice purchased from Jackson Labs. All experiments met regulatory standards upon submission. Clonally expanded CD117+ endothelial cells were generated from EGFP+ rats. Rat and mouse studies were conducted according to protocols and approved by the IACUC.
Experimental models and subject details
Human tissue samples and cell lines
De-identified formalin-fixed and paraffin-embedded human lung tissue was obtained from the tissue repository of the Pulmonary Hypertension Breakthrough Initiative (PHBI) as 5 μm histological sections. Male and female PAH and failed donor patients were included. PAECs were isolated by the University of Pittsburgh Cell Processing Core and the PHBI in a de-identified manner under PHBI-approved protocols. The University of Pennsylvania (PHBI cell core), the University of Alabama Birmingham (PHBI tissue core) and University of Pittsburgh institutional review boards, in accordance with the revised ethical guidelines of the Declaration of Helsinki of 1983. Informed consent was waived by these institutional review boards. Control samples and cells were from failed donor lungs. PAECs from male and female patients was included. The Institutional Review Boards have approved the tissue collection at the respective institutions. The use of de-identified tissues and cells was deemed non-human subjects research by the Office of Research Subjects Protection at the Ohio State University (OSU). Sex and age of the patients are shown in Tables S1 (histological analysis), S2 (PAEC lines for immunoblot in Figure 2A) and S3 (PAEC lines for experiments in Figures 3, 5, and 6). PAECs were grown in complete Endothelial Cell growth medium-2MV (EGM-2MV) including 5% fetal bovine serum, hydrocortisone, basic human fibroblast growth factor-2, vascular endothelial growth factor, insulin-like growth factor-1, ascorbic acid, human epidermal growth factor (EGF) and gentamicin-sulfate-amphotericin as supplied by the manufacturer in a temperature and CO2 regulated incubator at 37°C with 100% humidity and 5% CO2. The cells were used for experiments in passages 5–9. The cells were grown to subconfluency for further passaging and experimentation.
Rat lung CD117+ ECs and fourth generation clones from rat lung CD117+ ECs
Isolation of rat lung CD117+ ECs from male EGFP+ rats and the process of four generations of clonal expansion have been previously described.11 In short, CD117+ ECs were isolated from single cell suspensions of the lungs of male EGFP+ rats [SD-Tg(UBC-EGFP)2BalRrrc, RRRC] by positive selection for CD117, followed by negative selection to exclude hematopoietic lineages (pan-CD45, CD5, CD11b/c), and positive selection for EC marker CD31. For clonal expansion, rat lung CD117+ ECs were seeded in 96 well plates coated with rat tail type I collagen at single cell density/well. After 14 days, the largest colonies with typical endothelial appearance were again seeded at single cell density in 96 well plates. This process was repeated for four generations of clonal expansion to obtain quaternary CD117+ EC clones. The characterization of CD117+ ECs and CD117+ EC clones has been performed as previously described.11,23 Rat lung CD117+ ECs and CD117+ EC clones were cultured in complete EGM-2MV growth medium (Lonza) with 5% fetal bovine serum, hydrocortisone, basic human fibroblast growth factor-2, vascular endothelial growth factor, insulin-like growth factor-1, ascorbic acid, human epidermal growth factor (EGF) and gentamicin-sulfate-amphotericin as supplied by the manufacturer in a temperature and CO2 regulated incubator at 37°C with 100% humidity and 5% CO2 on rat tail type I collagen coated cell culture dishes. The cells were used for experiments in passages 3–10. The cells were grown to subconfluency for further passaging and experimentation.
Animal models
All animal experiments were approved by the Institutional Animal Care and Utilization Committee at OSU in accordance with the Health Research Extension Act (Public Law 99-158). The procedures followed the "Guide for the Care and Use of Laboratory Animals", National Academy Press, Washington, D.C. 1996. Animals were randomly assigned to the treatment groups. The animals were used at age 7 weeks to 3 months.
Male and female P53floxCdh5-Cre+ mice were generated by crossbreeding of p53flox mice (B6.129P2-Trp53tm1Brn/J) and Cdh5-Cre+ mice [B6; 129-Tg(Cdh5-cre)1Spe/J] (both Jackson Labs). Floxed and Cre genotypes were verified by commercial services through Transnetyx (Cordova, TN), including an excision probe to verify excision of Tp53 gene. For experiments, littermate male and female p53flox Cdh5-Cre- mice of same age range (7 weeks–3 months) were used run as controls in the experiments. We further studied male and female p53 wt Cdh5-Cre+ mice, which have no loxP sites flanking the Tp53 gene, but express the Cre recombinase with a Cdh5 promoter, and compared these to p53 wt Cdh5-Cre- mice to exclude that expression of Cre recombinase in ECs promotes PH by itself.
Male C57BL/6 wildtype (WT) mice, P53−/− mice (B6.129S2-Trp53tm1Tyj/J; P53 knockout mice on a C57Bl/6 background) and homozygous TRIFLPS2 mice (C57BL/6J-Ticam1Lps2/J, encoding a single nucleotide deletion in the Ticam1/TRIF gene, resulting in a frameshift mutation) were obtained from Jackson Labs at age of 7 weeks.47,48 The controls recommended by the supplier (Jackson Labs) for both knockouts are wildtype C57BL/6 mice, which we used in our study.
Animal experiments
For induction of PH, we used two models: the chronic hypoxia and SU5416 model (cHx/Su) in mice and the chronic hypoxia + EC clone model in rats. Chronic hypoxia exposure was accomplished in a Biospherix normobaric nitrogen dilution chamber (inspiratory oxygen fraction 10%) for 21 days. For the chronic hypoxia and SU5416 model (cHx/Su), mice were housed in cHx for 21 days with weekly s.c. injections of SU5416 (20 mg/kg, Millipore-Sigma, St. Louis, MO) as published previously.23 Animals were randomly assigned to treatment groups and treatment and husbandry were performed in a blinded manner. For treatment with Poly(I:C), mice were treated with 10 mg/kg Poly(I:C) or vehicle (0.9% saline) three times a week from day 1–21 by intraperitoneal injection.
The cHx+CD117+ EC clone rat model of PH was employed as published previously by us11: quaternary CD117+ male rat lung EC clones (1 × 10⁶ cells) were injected in male Sprague Dawley rats by tail vein, followed by exposure to chronic hypoxia for 21 days. Nutlin-3a (Adooq Bioscience, Irvine, CA) or vehicle was given at 25 mg/kg 5x/week from day 1–21 by intraperitoneal injection.
At the endpoints, mice and rats underwent echocardiography using a Vevo 2100 system (Visual Sonics, Toronto, ON, Canada) under isoflurane anesthesia or a GE Vivid IQ Premium system (GE Healthcare, Chicago, IL) under ketamine/xylazine anesthesia. The Vevo system was located in the Small Animal Imaging Facility at OSU.
Invasive hemodynamics were measured using a 1.4F Millar catheter and Powerlab acquisition system (AD Instruments, Colorado Springs, CO) under ketamine/xylazine anesthesia as published previously.11,23 In brief, anesthesized animals ventilated with a small animal ventilator (RoVent, Kent Scientific Corporation, Torrington, CT) via tracheostomy and the chest cavity was opened by median sternotomy. A 1.4F Millar pressure-volume-catheter was inserted through a small hole in the right ventricle and right ventricular hemodynamics were recorded over at least 5 min for steady state readings. Acquisition and analysis of echocardiographic and hemodynamic data was performed in a blinded manner (numerical coding).
Cell culture experiments
Clustered regularly interspaced short palindromic (CRISPR)/Cas9 interference targeting TLR3 in human PAECs was performed as described previously.23 In brief, PAECs were co-transfected with 100 multiplicities of infection (MOI) of an adenovirus encoding the Cas9 nuclease (Ad-CMV-Cas9, Vector Biolabs, Malvern, PA) and MOI 100 of adenovirus encoding a single guidance RNA (sgRNA, sequence CGGGTACCTGAGTCAACTTC) targeting human TLR3 at a 20-base sequence in exon 2 (Ad-TLR3-sgRNA-CRISPRi) or scrambled control sgRNA (Ad-scrm-sgRNA-CRISPRi) (Applied Biological Materials, Richmond, BC, Canada). We confirmed the knockout using immunoblot, and we performed no selection of knockout clones to avoid growth arrest due to passage number in primary human PAECs as described previously by us.23
For siRNA-mediated gene knockdown, GeneMute (SignaGen Laboratories, Frederick, MA) siRNA transfection reagent was used and siRNAs were from Integrated DNA Technologies (IDT, Coralville, IA): rn.Ri.Tp53 13.2, hs.Ri.IRF3 13.3 (for interferon regulatory factor, IRF). For transfection, siRNAs (50 nM) were incubated with the cells for 24h, media was changed afterward, and experiments were performed at 48h after transfection. Single hairpin-RNA (shRNA) mediated knockdown of p53 was performed using MOI of 50 Ad-h-TP53-shRNA (adenovirus encoding shRNA targeting human TP53, Vector Biolabs, Malvern, PA) or Ad-scrm-shRNA (control shRNA) as described previously.23 Single hairpin-RNA (shRNA) mediated knockdown of rat Tlr3 was performed as described previously.23 Ad-scrm-shRNA (Vector Biolabs), an adenovirus encoding scrambled, unspecific shRNA, was used as a control. Poly(I:C) (Invivogen, San Diego, CA) was used at 25 μg/mL for 24h in cell culture experiments. For Nutlin 3a treatment, clonal expansion of human PAECs and rat lung CD117+ ECs was performed after single cell sorting in the OSU Flow core as described previously.11 During the 14-day expansion period, Nutlin 3a was added at 10 μM (human PAECs) and 20 μΜ (rat lung CD117+ ECs). These concentrations were used for all subsequent in vitro experiments using Nutlin 3a.
Fluorescence staining for histones H2A (mono methyl R3) + H4 (mono methyl R3) was performed as published previously using ab177186 (Abcam, Cambridge, MA).23,49 In brief, the were seeded on LabTek chamber slides (Nalgene NUNC, ThermoFisher Scientific, Rochester, NY). Fixation was performed with 10% formalin for 10 min, followed by permeabilization of the cells with 0.5 Triton X- for 10 min and blocking with 1% bovine serum albumin (BSA) for 30 min. Incubation with the primary antibody (ab177186) was done overnight at 4°C in 1% BSA. Incubation with an AF594-labeled secondary antibody was performed for 1h and DAPI was used for counterstaining (5 min at room temperature). The chamber slides were mounted with Slowfade gold and stored at −20°C protected from light until imaging.
DNA synthesis analysis was performed by 5-bromodeoxyuridine (BrdU) incorporation as described previously.49 In brief, cells were pulsed for 4h prior to removing the cells with 10 μM 5-Bromodeoxyuridine (BrdU). Flow cytometry analysis of BrdU+ cells was done with the APC BrdU flow kit following fixation and permeabilization (Cytofix/cytoperm, BD, Franklin Lakes, NJ), DNAsa digestion and staining with APC-labeled anti-BrdU antibody and 7-aminoactinomycin D (7-AAD) (BD 51-9000019AK). The cells were analyzed with a FACSCanto II flow cytometer, a Acuri 6 Plus flow cytometer or a FACSSymphony A1 flow cytometer (BD Biosciences) and FlowJo Software (FlowJo, LLC, Ashland, OR).
Apoptosis was analyzed by Annexin V staining as previously published.23 In brief, 105 cells were dissolved in 100 μL of binding buffer, followed by incubation for 15 min at room temperature with 5 μL of allophycocyanin (APC) Annexin V (BD Biosciences) and 5 μL of 7-AAD. After dilution with 400 μL binding of buffer, cells were analyzed using a BD FACSSymphony A1 flow cytometer and quantified using FlowJo Software.
2D Matrigel network formation was performed as previously published.11 In brief, 5×10⁴ cells were seeded in Ibidi μ-Slide for angiogenesis (Ibidi, Gräfelfing, Germany) on growth factor-reduced Matrigel (CLS354230, Corning, Corning, NY) with EGM-2MV media. After 20h, images were acquired with an an inverted IX70 microscope and XM10 camera (Olympus, Waltham, MA) or an inverted automated EVOS M7000 microscope (ThermoFisher, Cincinnati, OH). Following acquisition with a 4× objective, images were assembled using the stitching function of Celeste software (ThermoFisher). Angiotool software (National Cancer Institute) was used to quantify network formation.50
A three-dimensional spheroid sprouting assay was performed as described previously.11 In brief, spheroids were generated by culturing the cells in low attachment 24 well plates (NUNC, ThermoFisher, Waltham, MA). For sprouting, spheroids were embedded in a 1:1 volume mixture of Matrigel and EGM-2MV media. Sprouting from the spheroids was assessed by imaging with an EVOS M7000 microscope and quantification using Fiji software.51
Histology
Immunohistochemistry and double immunofluorescence stainings were performed as published previously.11,23
For immunohistochemistry, slides underwent rehydration followed by antigen retrieval (20 min heating in boiling citrate buffer pH 6.0 for most stainings, except for vWF, which used proteinase K 1:50 for 5 min). Following blocking of endogenous peroxidase (H2O2) and blocking of unspecific binding with 1% normal swine serum (NSS)/PBS for 15 min, slides were incubated with primary antibodies (diluted in 1% NSS/PBS) overnight at 4°C. Incubation with secondary biotin-labeled antibody (1 h, diluted in 1% NSS/PBS) was followed by incubation with HRP conjugated Streptavidin for 1 h). Then slides were developed with diaminobenzidine solution and counterstained with Mayer’s hematoxylin. After dehydration, slides were mounted with coverslip and permanent mounting medium.
For immunofluorescence, slides underwent rehydration followed by antigen retrieval (20 min heating in boiling citrate buffer pH 6.0). Following blocking of unspecific binding with 1% normal swine serum (NSS)/PBS for 15 min, slides were incubated with primary antibodies (diluted in 1% NSS/PBS) overnight at 4°C.Lycopersicon Esculentum (Tomato) Lectin (LEL) conjugated with DyLight 594 (DL-1177-1, Vector Laboratories, Burlingame, CA) was used at 1:50 overnight for staining of ECs in histological sections. Incubation with secondary fluorescence-labeled antibody (1 h, diluted in 1% NSS/PBS) was followed by nuclear staining with DAPI for 5 min. Then, slides were mounted with coverslip and SlowFade Gold.
Analysis of media wall thickness was done in sections stained for α-SMA immunohistochemistry or Hematoxylin-eosin and morphometric analysis as described previously.11,49 In brief, images of pulmonary arteries were acquired with an EVOS M7000 automated microscope. Treatment groups were masked by numerical coding. Media thickness (MT) and external diameter (ED) were measured and media wall thickness (MWT) was calculated as MWT = [(2×MT)÷ED]×100%. Pulmonary arteries were categorized as small-sized 25μm < ED < 50 m and medium-sized 50μm ≤ ED < 100 μm. For each animal, 30–40 pulmonary arteries were measured in two orthogonal directions using Fiji image analysis software. Percentage of non-muscularized, partially and fully muscularized arteries was calculated in α-SMA stained sections by categorizing pulmonary arteries according to external diameter and determining the extent of muscularization according to published protocols.23 PA occlusion in rats was analyzed as published previously by us using slides stained for vWF immunohistochemistry using anti-vWF antibody (A0082, DAKO) and identifying the fraction of small-sized pulmonary arteries that were classified as ‘patent’, ‘partially occluded’ and ‘completely obstructed’.11,23
For analysis of cardiomyocyte crossectional area (CM CSA), Masson Trichrome images were randomly taken at 40× magnification from previously scanned whole slides provided by Histowiz. CM CSA was measured using Fiji by an investigator blinded to the treatment groups.
For analysis of PCNA+ per pulmonary artery, images of pulmonary arteries were randomly acquired from transversal sections stained for PCNA immunohistochemistry at 40× magnification. The number of PCNA+ cells was divided by the number of nuclei/pulmonary artery to calculate the fraction of PCNA+ cells.
For analysis of mean fluorescence intensity in confocal images, ECs and intima were identified by co-staining with the EC marker vWF. Then, mean fluorescence intensity of p53 and BMPR2 staining was measured using ImageJ. Background mean fluorescence intensity was obtained in an area without positive staining. To calculate the normalized mean fluorescence intensity, background intensity was subtracted from staining intensity and the remaining fluorescence intensity was normalized to the average of the control samples.
For all histomorphometric analyses, objectivity was ensured by masking treatment groups through numerical coding and an investigator unaware of the treatment groups.
Microscopy
Light microscopy images were acquired using an EVOS M7000 automated microscope (Thermo Fisher Scientific, Waltham, MA). Immunofluorescence images were acquired using an inverted Olympus FV3000 confocal microscope system located at the OSU Campus Microscopy and Imaging Facility. The images were assembled with Fiji software.
RNA isolation and quantitative real-time PCR
RNA isolation, cDNA preparation and quantitative real-time PCR were performed as published previously.11,23,49 RNA was isolated using the miRNAeasy kit (Qiagen) according to the manufacturer’s instructions. For reverse transcriptase (RT) reaction, DNAase I treatment was performed at 0.1 U/μL final activity for 15 min at room temperature, followed by addition of 25 mM EDTA to inactive DNase and incubation at 65°C for 10 min. For the reverse transcriptase (RT) reaction, a mastermix was prepared of 10× RT buffer, dNTP mix, RT random primers and RNAse free water and added to the RNA samples. RT reaction was run with the following steps: 10 min at 25°C, 120 min at 37°C and 5 min at 85°C in a Thermocycler (T100, BioRad). For real-time amplification, cDNA samples were diluted 1:10 in nuclear free water. A mastermix was prepared for each well (384 well plate) consisting of 1 μL of forward and reverse primer mix, 5 μL SYBR Green mastermix (iTaq, Biorad) and 4 μL cDNA. QRT-PCR was run in a CFX384 touch qRT-PCR system (Biorad) with the following program: initial step at 95°C for 30 s. Then, 45 cycles of 95.0°C for 5 s and 60.0°C for 30 s. After a final step of 95°C for 10s, a melting curve was obtained by raising the temperature from 65.0 to 95.0°C in 0.5°C increments/5 s. The analysis was performed by using the method published in52
Protein isolation and Western blot
Protein isolation and Western blotting were performed as published previously.11,23,49 Following lysis with Radio immunoprecipitation buffer (RIPA) with proteinase and phosphatase inhibitors, 10–20 μg protein (cell lysate) and 40 μg protein (whole lung lysate) was resolved by SDSPAGE at 90 V for 60–80 min. Then, protein was blotted at 270 mA for 2 h onto a nitrocellulose membrane for antibody staining and chemiluminiscence detection (ECL). Membranes were blocked with 5% bovine serum albumin/0.5% Tween 20/TBS for 1 h. Primary antibody incubation was performed in 5% bovine serum albumin/0.5% Tween 20/TBS overnight at 4°C, followed by secondary antibody incubation in 5% bovine serum albumin/0.5% Tween 20/TBS for 1h (horseradish peroxidase conjugated secondary antibodies). Images were obtained by developing with ECL solution and image acquisition with a Biorad ChemiDoc gel imager with ImageLab software (Biorad, Hercules, CA). Densitometry with automated background substraction was performed with ImageLab (Biorad, Hercules, CA).
In silico promoter analysis
To identify potential transcription factor consensus sites in TLR3 and BMPR2 promoters, promoter information was retrieved from the Eukaryotic Promoter Database.25 In this database, analysis was performed in the range of −2000b to +100b of the genes of interest. The analysis was based on validated consensus site motif predictions from the JASPAR promoter database.53 Prediction sites were chosen with a p = 0.001.
Generation of transcription factor and histone modification plots
Experimental datasets of ChIP-Histone and ChIP-Transcription Factor (ChIP-TF) fold changes and irreproducible-discovery rate (IDR) thresholded peaks were obtained from the Encyclopedia of DNA Elements (ENCODE) portal54,55 in cell types K562 (SMAD1: ENCODE: ENCSR038DJJ, SMAD2: ENCODE: ENCSR189PYJ, SMAD3: ENCODE: ENCSR376XAV, SMAD4: ENCODE: ENCSR109SJT, STAT5A: ENCODE: ENCSR000BRR, STAT5B: ENCODE: ENCSR663NFC, H3K4me3: ENCODE: ENCSR668LDD, H3K9me3: ENCODE: ENCSR000APE, H3K27me3: ENCODE: ENCSR000AKQ, H3K36me3: ENCODE: ENCSR000AKR, H4K20me1: ENCODE: ENCSR000AKX), CD34+ common myeloid progenitors (CD34+ CMP; H3K4me3: ENCODE: ENCSR045QJH, H3K9me3: ENCODE: ENCSR979RHZ, H3K27me3: ENCODE: ENCSR038GYF, H3K36me3: ENCODE: ENCSR106VNH), and human umbilical vein microvascular endothelial cells (HUVEC; H3K4me3: ENCODE: ENCSR578QSO, H3K9me3: ENCODE: ENCSR000ATB, H3K27me3: ENCODE: ENCSR000AKK, H3K36me3: ENCODE: ENCSR000ALC, H4K20me1: ENCODE: ENCSR000ALF). Fold change values and IDR thresholded peaks for each histone modification or TF were plotted against genomic positions using human reference genome hg38 coordinates. Plots were generated in R v4.1.2 using the ggplot2 package.56,57
Chromatin immunoprecipitation
Chromatin immunoprecipitation (ChIP) was performed as previously described.58,59 Briefly, control or Poly(I:C) stimulated PAECs (24h, 25 μg/mL) were fixed with 1% PFA for 8 min at room temperature. Cells were lysed and chromatin was sonicated with the Bioruptor Pico (Diagenode) to obtain chromatin fragments of 200–500 base pairs. Chromatin was immunoprecipitated with Protein G Dynabeads (Invitrogen, 10004D) conjugated with IRF-3 antibody (4 μL, Active motif 39371, RRID:AB_2793232) or rabbit IgG (Diagenode, C15410206) overnight at 4°C. Following incubation, genomic DNA from immunoprecipitated (IP) and non-immunoprecipitated (INPUT) samples was eluted from chromatin by reverse crosslinking and proteinase K digestion. Eluted DNA was purified by phenol-chloroform extraction. IRF-3 enrichment was measured by qPCR using primer sets targeting putative IRF-3 binding motifs within BMPR2_1 and BMPR2_2 promoter regions as predicted using the Eukaryotic Promoter Database. Results were expressed as percent IP/INPUT.
Quantification and statistical analysis
Data were compared using Student’s t-test (2 groups), or one or two-way ANOVA(more than 2 groups), following by multiple comparison correction using the Holm-Sidak or Sidak tests. The calculations were performed using Prism 9.0 (GraphPad Software Inc., San Diego, CA). A p value of <0.05 was considered significant. p values were indicated as follows: ∗p < 0.05, ∗∗p < 0.01, ∗∗∗p < 0.001, ∗∗∗∗p < 0.0001.
Acknowledgments
The authors acknowledge the expert technical help of Pranav Gunturu. The study was supported by grants from the NIH/NHLBI (HL123044, HL139881) to L.F., (HL130261, HL113178, HL159638, and HL103455) E.A.G., and (HL124021 and HL122596) S.Y.C. S.Y.C. was also supported by the AHA grant 18EIA33900027. A.R.B. was supported by a Fulbright Scholarship. A.A.R.T. was supported by a British Heart Foundation Intermediate Fellowship FS/18/13/33281. Data/Tissue samples are provided by PHBI under the Pulmonary Hypertension Breakthrough Initiative (PHBI). Funding for the PHBI is provided under an NHLBI R24 grant, R24HL123767, and by the Cardiovascular Medical Research and Education Fund (CMREF). The authors acknowledge resources for confocal microscopy from the Campus Microscopy and Imaging Facility (CMIF) and the OSU Comprehensive Cancer Center (OSUCCC) Microscopy Shared Resource (MSR) at the Ohio State University with NIH S10 OD025008 and NIH NCI P30CA016058. Echocardiography was performed in the Small Animal Imaging Core at OSU. Flow Cytometry was performed in the Flow Cytometry Shared Resource at OSU. These facilities are supported in part by grant P30 CA016058, National Cancer Institute, Bethesda, MD. The content is solely the responsibility of the authors and does not necessarily represent the official views of the National Institutes of Health.
Author contributions
Conceptualization, A.R.B., E.A.G., and L.F.; Methodology and Investigation, A.R.B., M.A., J.H., M.L., N.K., B.P., S.B., J.D.L., J.S.B., D.F., and L.F.; Visualization, A.R.B., M.A., H.Y., J.H., M.L., J.D.L., J.S.B., D.F., R.K.M., M.R.N., J.J.R., S.Y.C., D.A.G., A.A.R.T., E.A.G., and L. F.; Writing—Original Draft, A.R.B., M.A., J.H., M.L., S.B., B.P., N.K., S.Y.C., D.A.G., A.A.R.T., E.A.G., and L. F.; Writing—Review & Editing, A.R.B., M.A., J.H., M.L., N.K., H.Y., J.D.L., J.S.B., D.F., R.K.M., M.R.N., J.J.R., S.Y.C., D.A.G., A.A.R.T., E.A.G., and L. F.
Declaration of interests
S.Y.C. has served as a consultant for Acceleron Pharma and United Therapeutics. S.Y.C. is a director, officer, and shareholder in Synhale Therapeutics. S.Y.C. has held research grants from Actelion, Bayer, and Pfizer. S.Y.C. has filed patent applications regarding the targeting of metabolism in pulmonary hypertension. The other authors declare no competing interest.
Published: February 17, 2023
Footnotes
Supplemental information can be found online at https://doi.org/10.1016/j.isci.2023.105935.
Supplemental information
Data and code availability
This paper analyzes existing, publicly available data. The accession numbers for the datasets are listed in the key resources table.
This paper does not report original code.
Any additional information required to reanalyze the data reported in this paper is available from the lead contact upon request.
References
- 1.Humbert M., Guignabert C., Bonnet S., Dorfmüller P., Klinger J.R., Nicolls M.R., Olschewski A.J., Pullamsetti S.S., Schermuly R.T., Stenmark K.R., Rabinovitch M. Pathology and pathobiology of pulmonary hypertension: state of the art and research perspectives. Eur. Respir. J. 2019;53:1801887. doi: 10.1183/13993003.01887-2018. [DOI] [PMC free article] [PubMed] [Google Scholar]
- 2.Simonneau G., Montani D., Celermajer D.S., Denton C.P., Gatzoulis M.A., Krowka M., Williams P.G., Souza R. Haemodynamic definitions and updated clinical classification of pulmonary hypertension. Eur. Respir. J. 2019;53:1801913. doi: 10.1183/13993003.01913-2018. [DOI] [PMC free article] [PubMed] [Google Scholar]
- 3.Farber H.W., Miller D.P., Poms A.D., Badesch D.B., Frost A.E., Muros-Le Rouzic E., Romero A.J., Benton W.W., Elliott C.G., McGoon M.D., Benza R.L. Five-Year outcomes of patients enrolled in the REVEAL Registry. Chest. 2015;148:1043–1054. doi: 10.1378/chest.15-0300. [DOI] [PubMed] [Google Scholar]
- 4.Stacher E., Graham B.B., Hunt J.M., Gandjeva A., Groshong S.D., McLaughlin V.V., Jessup M., Grizzle W.E., Aldred M.A., Cool C.D., Tuder R.M. Modern age pathology of pulmonary arterial hypertension. Am. J. Respir. Crit. Care Med. 2012;186:261–272. doi: 10.1164/rccm.201201-0164OC. [DOI] [PMC free article] [PubMed] [Google Scholar]
- 5.Fijalkowska I., Xu W., Comhair S.A.A., Janocha A.J., Mavrakis L.A., Krishnamachary B., Zhen L., Mao T., Richter A., Erzurum S.C., Tuder R.M. Hypoxia inducible-factor1alpha regulates the metabolic shift of pulmonary hypertensive endothelial cells. Am. J. Pathol. 2010;176:1130–1138. doi: 10.2353/ajpath.2010.090832. [DOI] [PMC free article] [PubMed] [Google Scholar]
- 6.Masri F.A., Xu W., Comhair S.A.A., Asosingh K., Koo M., Vasanji A., Drazba J., Anand-Apte B., Erzurum S.C. Hyperproliferative apoptosis-resistant endothelial cells in idiopathic pulmonary arterial hypertension. Am. J. Physiol. Lung Cell Mol. Physiol. 2007;293:L548–L554. doi: 10.1152/ajplung.00428.2006. [DOI] [PubMed] [Google Scholar]
- 7.Xu W., Koeck T., Lara A.R., Neumann D., DiFilippo F.P., Koo M., Janocha A.J., Masri F.A., Arroliga A.C., Jennings C., et al. Alterations of cellular bioenergetics in pulmonary artery endothelial cells. Proc. Natl. Acad. Sci. USA. 2007;104:1342–1347. doi: 10.1073/pnas.0605080104. [DOI] [PMC free article] [PubMed] [Google Scholar]
- 8.Lee S.D., Shroyer K.R., Markham N.E., Cool C.D., Voelkel N.F., Tuder R.M. Monoclonal endothelial cell proliferation is present in primary but not secondary pulmonary hypertension. J. Clin. Invest. 1998;101:927–934. doi: 10.1172/jci1910. [DOI] [PMC free article] [PubMed] [Google Scholar]
- 9.Taraseviciene-Stewart L., Kasahara Y., Alger L., Hirth P., Mc Mahon G., Waltenberger J., Voelkel N.F., Tuder R.M. Inhibition of the VEGF receptor 2 combined with chronic hypoxia causes cell death-dependent pulmonary endothelial cell proliferation and severe pulmonary hypertension. FASEB J. 2001;15:427–438. doi: 10.1096/fj.00-0343com. [DOI] [PubMed] [Google Scholar]
- 10.Sakao S., Taraseviciene-Stewart L., Wood K., Cool C.D., Voelkel N.F. Apoptosis of pulmonary microvascular endothelial cells stimulates vascular smooth muscle cell growth. Am. J. Physiol. Lung Cell Mol. Physiol. 2006;291:L362–L368. doi: 10.1152/ajplung.00111.2005. [DOI] [PubMed] [Google Scholar]
- 11.Bhagwani A.R., Farkas D., Harmon B., Authelet K.J., Cool C.D., Kolb M., Goncharova E., Yoder M.C., Clauss M., Freishtat R., Farkas L. Clonally selected primitive endothelial cells promote occlusive pulmonary arteriopathy and severe pulmonary hypertension in rats exposed to chronic hypoxia. Sci. Rep. 2020;10:1136. doi: 10.1038/s41598-020-58083-7. [DOI] [PMC free article] [PubMed] [Google Scholar]
- 12.Manavski Y., Lucas T., Glaser S.F., Dorsheimer L., Günther S., Braun T., Rieger M.A., Zeiher A.M., Boon R.A., Dimmeler S. Clonal expansion of endothelial cells contributes to ischemia-induced neovascularization. Circ. Res. 2018;122:670–677. doi: 10.1161/CIRCRESAHA.117.312310. [DOI] [PubMed] [Google Scholar]
- 13.Morrell N.W., Aldred M.A., Chung W.K., Elliott C.G., Nichols W.C., Soubrier F., Trembath R.C., Loyd J.E. Genetics and genomics of pulmonary arterial hypertension. Eur. Respir. J. 2019;53:1801899. doi: 10.1183/13993003.01899-2018. [DOI] [PMC free article] [PubMed] [Google Scholar]
- 14.Aldred M.A., Vijayakrishnan J., James V., Soubrier F., Gomez-Sanchez M.A., Martensson G., Galie N., Manes A., Corris P., Simonneau G., et al. BMPR2 gene rearrangements account for a significant proportion of mutations in familial and idiopathic pulmonary arterial hypertension. Hum. Mutat. 2006;27:212–213. doi: 10.1002/humu.9398. [DOI] [PubMed] [Google Scholar]
- 15.Hopper R.K., Moonen J.R.A.J., Diebold I., Cao A., Rhodes C.J., Tojais N.F., Hennigs J.K., Gu M., Wang L., Rabinovitch M. Pulmonary arterial hypertension, reduced BMPR2 promotes endothelial-to-mesenchymal transition via HMGA1 and its target slug. Circulation. 2016;133:1783–1794. doi: 10.1161/CIRCULATIONAHA.115.020617. [DOI] [PMC free article] [PubMed] [Google Scholar]
- 16.Tian W., Jiang X., Sung Y.K., Shuffle E., Wu T.H., Kao P.N., Tu A.B., Dorfmüller P., Cao A., Wang L., et al. Phenotypically-silent bone morphogenetic protein receptor 2 (Bmpr2) mutations predispose rats to inflammation-induced pulmonary arterial hypertension by enhancing the risk for neointimal transformation. Circulation. 2019;140:1409–1425. doi: 10.1161/CIRCULATIONAHA.119.040629. [DOI] [PMC free article] [PubMed] [Google Scholar]
- 17.Diebold I., Hennigs J.K., Miyagawa K., Li C.G., Nickel N.P., Kaschwich M., Cao A., Wang L., Reddy S., Chen P.I., et al. BMPR2 preserves mitochondrial function and DNA during reoxygenation to promote endothelial cell survival and reverse pulmonary hypertension. Cell Metab. 2015;21:596–608. doi: 10.1016/j.cmet.2015.03.010. [DOI] [PMC free article] [PubMed] [Google Scholar]
- 18.Hennigs J.K., Cao A., Li C.G., Shi M., Mienert J., Miyagawa K., Körbelin J., Marciano D.P., Chen P.I., Roughley M., et al. PPARγ-p53-Mediated vasculoregenerative program to reverse pulmonary hypertension. Circ. Res. 2021;128:401–418. doi: 10.1161/CIRCRESAHA.119.316339. [DOI] [PMC free article] [PubMed] [Google Scholar]
- 19.Mizuno S., Bogaard H.J., Kraskauskas D., Alhussaini A., Gomez-Arroyo J., Voelkel N.F., Ishizaki T. p53 Gene deficiency promotes hypoxia-induced pulmonary hypertension and vascular remodeling in mice. Am. J. Physiol. Lung Cell Mol. Physiol. 2011;300:L753–L761. doi: 10.1152/ajplung.00286.2010. [DOI] [PubMed] [Google Scholar]
- 20.Mouraret N., Marcos E., Abid S., Gary-Bobo G., Saker M., Houssaini A., Dubois-Rande J.L., Boyer L., Boczkowski J., Derumeaux G., et al. Activation of lung p53 by Nutlin-3a prevents and reverses experimental pulmonary hypertension. Circulation. 2013;127:1664–1676. doi: 10.1161/CIRCULATIONAHA.113.002434. [DOI] [PMC free article] [PubMed] [Google Scholar]
- 21.Farkas D., Alhussaini A.A., Kraskauskas D., Kraskauskiene V., Cool C.D., Nicolls M.R., Natarajan R., Farkas L. Nuclear factor κB inhibition reduces lung vascular lumen obliteration in severe pulmonary hypertension in rats. Am. J. Respir. Cell Mol. Biol. 2014;51:413–425. doi: 10.1165/rcmb.2013-0355OC. [DOI] [PMC free article] [PubMed] [Google Scholar]
- 22.Taura M., Eguma A., Suico M.A., Shuto T., Koga T., Komatsu K., Komune T., Sato T., Saya H., Li J.D., Kai H. p53 regulates Toll-like receptor 3 expression and function in human epithelial cell lines. Mol. Cell Biol. 2008;28:6557–6567. doi: 10.1128/MCB.01202-08. [DOI] [PMC free article] [PubMed] [Google Scholar]
- 23.Farkas D., Thompson A.A.R., Bhagwani A.R., Hultman S., Ji H., Kotha N., Farr G., Arnold N.D., Braithwaite A., Casbolt H., et al. Toll-like receptor 3 is a therapeutic target for pulmonary hypertension. Am. J. Respir. Crit. Care Med. 2019;199:199–210. doi: 10.1164/rccm.201707-1370OC. [DOI] [PMC free article] [PubMed] [Google Scholar]
- 24.Nakayama M., Sakai E., Echizen K., Yamada Y., Oshima H., Han T.S., Ohki R., Fujii S., Ochiai A., Robine S., et al. Intestinal cancer progression by mutant p53 through the acquisition of invasiveness associated with complex glandular formation. Oncogene. 2017;36:5885–5896. doi: 10.1038/onc.2017.194. [DOI] [PMC free article] [PubMed] [Google Scholar]
- 25.Dreos R., Ambrosini G., Groux R., Cavin Périer R., Bucher P. The eukaryotic promoter database in its 30th year: focus on non-vertebrate organisms. Nucleic Acids Res. 2017;45:D51–D55. doi: 10.1093/nar/gkw1069. [DOI] [PMC free article] [PubMed] [Google Scholar]
- 26.Ancelin K., Lange U.C., Hajkova P., Schneider R., Bannister A.J., Kouzarides T., Surani M.A. Blimp1 associates with Prmt5 and directs histone arginine methylation in mouse germ cells. Nat. Cell Biol. 2006;8:623–630. doi: 10.1038/ncb1413. [DOI] [PubMed] [Google Scholar]
- 27.Pilley S., Rodriguez T.A., Vousden K.H. Mutant p53 in cell-cell interactions. Genes Dev. 2021;35:433–448. doi: 10.1101/gad.347542.120. [DOI] [PMC free article] [PubMed] [Google Scholar]
- 28.Manz X.D., Szulcek R., Pan X., Symersky P., Dickhoff C., Majolée J., Kremer V., Michielon E., Jordanova E.S., Radonic T., et al. Epigenetic modification of the von Willebrand factor promoter drives platelet aggregation on the pulmonary endothelium in chronic thromboembolic pulmonary hypertension. Am. J. Respir. Crit. Care Med. 2022;205:806–818. doi: 10.1164/rccm.202109-2075OC. [DOI] [PubMed] [Google Scholar]
- 29.Jacquin S., Rincheval V., Mignotte B., Richard S., Humbert M., Mercier O., Londoño-Vallejo A., Fadel E., Eddahibi S. Inactivation of p53 is sufficient to induce development of pulmonary hypertension in rats. PLoS One. 2015;10:e0131940. doi: 10.1371/journal.pone.0131940. [DOI] [PMC free article] [PubMed] [Google Scholar]
- 30.Wang Z., Yang K., Zheng Q., Zhang C., Tang H., Babicheva A., Jiang Q., Li M., Chen Y., Carr S.G., et al. Divergent changes of p53 in pulmonary arterial endothelial and smooth muscle cells involved in the development of pulmonary hypertension. Am. J. Physiol. Lung Cell Mol. Physiol. 2019;316:L216–L228. doi: 10.1152/ajplung.00538.2017. [DOI] [PMC free article] [PubMed] [Google Scholar]
- 31.Kleinman M.E., Yamada K., Takeda A., Chandrasekaran V., Nozaki M., Baffi J.Z., Albuquerque R.J.C., Yamasaki S., Itaya M., Pan Y., et al. Sequence- and target-independent angiogenesis suppression by siRNA via TLR3. Nature. 2008;452:591–597. doi: 10.1038/nature06765. [DOI] [PMC free article] [PubMed] [Google Scholar]
- 32.Cole J.E., Navin T.J., Cross A.J., Goddard M.E., Alexopoulou L., Mitra A.T., Davies A.H., Flavell R.A., Feldmann M., Monaco C. Unexpected protective role for Toll-like receptor 3 in the arterial wall. Proc. Natl. Acad. Sci. USA. 2011;108:2372–2377. doi: 10.1073/pnas.1018515108. [DOI] [PMC free article] [PubMed] [Google Scholar]
- 33.Galli R., Paone A., Fabbri M., Zanesi N., Calore F., Cascione L., Acunzo M., Stoppacciaro A., Tubaro A., Lovat F., et al. Toll-like receptor 3 (TLR3) activation induces microRNA-dependent reexpression of functional RARbeta and tumor regression. Proc. Natl. Acad. Sci. USA. 2013;110:9812–9817. doi: 10.1073/pnas.1304610110. [DOI] [PMC free article] [PubMed] [Google Scholar]
- 34.Liu L., Botos I., Wang Y., Leonard J.N., Shiloach J., Segal D.M., Davies D.R. Structural basis of toll-like receptor 3 signaling with double-stranded RNA. Science. 2008;320:379–381. doi: 10.1126/science.1155406. [DOI] [PMC free article] [PubMed] [Google Scholar]
- 35.Matijevic Glavan T., Cipak Gasparovic A., Vérillaud B., Busson P., Pavelic J. Toll-like receptor 3 stimulation triggers metabolic reprogramming in pharyngeal cancer cell line through Myc, MAPK, and HIF. Mol. Carcinog. 2017;56:1214–1226. doi: 10.1002/mc.22584. [DOI] [PubMed] [Google Scholar]
- 36.Atkinson C., Stewart S., Upton P.D., Machado R., Thomson J.R., Trembath R.C., Morrell N.W. Primary pulmonary hypertension is associated with reduced pulmonary vascular expression of type II bone morphogenetic protein receptor. Circulation. 2002;105:1672–1678. doi: 10.1161/01.cir.0000012754.72951.3d. [DOI] [PubMed] [Google Scholar]
- 37.Fessel J.P., Hamid R., Wittmann B.M., Robinson L.J., Blackwell T., Tada Y., Tanabe N., Tatsumi K., Hemnes A.R., West J.D. Metabolomic analysis of bone morphogenetic protein receptor type 2 mutations in human pulmonary endothelium reveals widespread metabolic reprogramming. Pulm. Circ. 2012;2:201–213. doi: 10.4103/2045-8932.97606. [DOI] [PMC free article] [PubMed] [Google Scholar]
- 38.Liu D., Yan Y., Chen J.W., Yuan P., Wang X.J., Jiang R., Wang L., Zhao Q.H., Wu W.H., Simonneau G., et al. Hypermethylation of BMPR2 promoter occurs in patients with heritable pulmonary arterial hypertension and inhibits BMPR2 expression. Am. J. Respir. Crit. Care Med. 2017;196:925–928. doi: 10.1164/rccm.201611-2273LE. [DOI] [PubMed] [Google Scholar]
- 39.Hurst L.A., Dunmore B.J., Long L., Crosby A., Al-Lamki R., Deighton J., Southwood M., Yang X., Nikolic M.Z., Herrera B., et al. TNFalpha drives pulmonary arterial hypertension by suppressing the BMP type-II receptor and altering NOTCH signalling. Nat. Commun. 2017;8:14079. doi: 10.1038/ncomms14079. [DOI] [PMC free article] [PubMed] [Google Scholar]
- 40.Theilmann A.L., Hawke L.G., Hilton L.R., Whitford M.K.M., Cole D.V., Mackeil J.L., Dunham-Snary K.J., Mewburn J., James P.D., Maurice D.H., et al. Endothelial BMPR2 loss drives a proliferative response to BMP (bone morphogenetic protein) 9 via prolonged canonical signaling. Arterioscler. Thromb. Vasc. Biol. 2020;40:2605–2618. doi: 10.1161/ATVBAHA.119.313357. [DOI] [PMC free article] [PubMed] [Google Scholar]
- 41.Reynolds A.M., Xia W., Holmes M.D., Hodge S.J., Danilov S., Curiel D.T., Morrell N.W., Reynolds P.N. Bone morphogenetic protein type 2 receptor gene therapy attenuates hypoxic pulmonary hypertension. Am. J. Physiol. Lung Cell Mol. Physiol. 2007;292:L1182–L1192. doi: 10.1152/ajplung.00020.2006. [DOI] [PubMed] [Google Scholar]
- 42.Wu X., Chang M.S., Mitsialis S.A., Kourembanas S. Hypoxia regulates bone morphogenetic protein signaling through C-terminal-binding protein 1. Circ. Res. 2006;99:240–247. doi: 10.1161/01.RES.0000237021.65103.24. [DOI] [PubMed] [Google Scholar]
- 43.Yang S., Banerjee S., Freitas A.d., Cui H., Xie N., Abraham E., Liu G. miR-21 regulates chronic hypoxia-induced pulmonary vascular remodeling. Am. J. Physiol. Lung Cell Mol. Physiol. 2012;302:L521–L529. doi: 10.1152/ajplung.00316.2011. [DOI] [PMC free article] [PubMed] [Google Scholar]
- 44.Wang J., Tian X.T., Peng Z., Li W.Q., Cao Y.Y., Li Y., Li X.H. HMGB1/TLR4 promotes hypoxic pulmonary hypertension via suppressing BMPR2 signaling. Vascul. Pharmacol. 2019;117:35–44. doi: 10.1016/j.vph.2018.12.006. [DOI] [PubMed] [Google Scholar]
- 45.Brock M., Trenkmann M., Gay R.E., Michel B.A., Gay S., Fischler M., Ulrich S., Speich R., Huber L.C. Interleukin-6 modulates the expression of the bone morphogenic protein receptor type II through a novel STAT3-microRNA cluster 17/92 pathway. Circ. Res. 2009;104:1184–1191. doi: 10.1161/CIRCRESAHA.109.197491. [DOI] [PubMed] [Google Scholar]
- 46.Ben-Neriah Y., Karin M. Inflammation meets cancer, with NF-κB as the matchmaker. Nat. Immunol. 2011;12:715–723. doi: 10.1038/ni.2060. [DOI] [PubMed] [Google Scholar]
- 47.Hoebe K., Du X., Georgel P., Janssen E., Tabeta K., Kim S.O., Goode J., Lin P., Mann N., Mudd S., et al. Identification of Lps2 as a key transducer of MyD88-independent TIR signalling. Nature. 2003;424:743–748. doi: 10.1038/nature01889. [DOI] [PubMed] [Google Scholar]
- 48.Marino S., Vooijs M., van Der Gulden H., Jonkers J., Berns A. Induction of medulloblastomas in p53-null mutant mice by somatic inactivation of Rb in the external granular layer cells of the cerebellum. Genes Dev. 2000;14:994–1004. [PMC free article] [PubMed] [Google Scholar]
- 49.Bhagwani A.R., Hultman S., Farkas D., Moncayo R., Dandamudi K., Zadu A.K., Cool C.D., Farkas L. Endothelial cells are a source of nestin expression in pulmonary arterial hypertension. PLoS One. 2019;14:e0213890. doi: 10.1371/journal.pone.0213890. [DOI] [PMC free article] [PubMed] [Google Scholar]
- 50.Zudaire E., Gambardella L., Kurcz C., Vermeren S. A computational tool for quantitative analysis of vascular networks. PLoS One. 2011;6:e27385. doi: 10.1371/journal.pone.0027385. [DOI] [PMC free article] [PubMed] [Google Scholar]
- 51.Schindelin J., Arganda-Carreras I., Frise E., Kaynig V., Longair M., Pietzsch T., Preibisch S., Rueden C., Saalfeld S., Schmid B., et al. Fiji: an open-source platform for biological-image analysis. Nat. Methods. 2012;9:676–682. doi: 10.1038/nmeth.2019. [DOI] [PMC free article] [PubMed] [Google Scholar]
- 52.Pfaffl M.W. A new mathematical model for relative quantification in real-time RT-PCR. Nucleic Acids Res. 2001;29:e45. doi: 10.1093/nar/29.9.e45. [DOI] [PMC free article] [PubMed] [Google Scholar]
- 53.Fornes O., Castro-Mondragon J.A., Khan A., van der Lee R., Zhang X., Richmond P.A., Modi B.P., Correard S., Gheorghe M., Baranašić D., et al. Jaspar 2020: update of the open-access database of transcription factor binding profiles. Nucleic Acids Res. 2020;48:D87–D92. doi: 10.1093/nar/gkz1001. [DOI] [PMC free article] [PubMed] [Google Scholar]
- 54.Davis C.A., Hitz B.C., Sloan C.A., Chan E.T., Davidson J.M., Gabdank I., Hilton J.A., Jain K., Baymuradov U.K., Narayanan A.K., et al. The Encyclopedia of DNA elements (ENCODE): data portal update. Nucleic Acids Res. 2018;46 doi: 10.1093/nar/gkx1081. D794-d801. [DOI] [PMC free article] [PubMed] [Google Scholar]
- 55.ENCODE Project Consortium An integrated encyclopedia of DNA elements in the human genome. Nature. 2012;489:57–74. doi: 10.1038/nature11247. [DOI] [PMC free article] [PubMed] [Google Scholar]
- 56.Wickham H. 2nd edition. Springer International Publishing: Imprint: Springer; 2016. ggplot2 : Elegant Graphics for Data Analysis. Use R! [Google Scholar]
- 57.R Core Team . R: A Language and Environment for Statistical Computing. R Foundation for Statistical Computing; Vienna: 2020. https://www.r-project.org [Google Scholar]
- 58.Dahl J.A., Collas P. A rapid micro chromatin immunoprecipitation assay (microChIP) Nat. Protoc. 2008;3:1032–1045. doi: 10.1038/nprot.2008.68. [DOI] [PubMed] [Google Scholar]
- 59.Liu M., Espinosa-Diez C., Mahan S., Du M., Nguyen A.T., Hahn S., Chakraborty R., Straub A.C., Martin K.A., Owens G.K., Gomez D. H3K4 di-methylation governs smooth muscle lineage identity and promotes vascular homeostasis by restraining plasticity. Dev. Cell. 2021;56:2765–2782.e10. doi: 10.1016/j.devcel.2021.09.001. [DOI] [PMC free article] [PubMed] [Google Scholar]
Associated Data
This section collects any data citations, data availability statements, or supplementary materials included in this article.
Supplementary Materials
Data Availability Statement
This paper analyzes existing, publicly available data. The accession numbers for the datasets are listed in the key resources table.
This paper does not report original code.
Any additional information required to reanalyze the data reported in this paper is available from the lead contact upon request.