

Abstract
T cell proliferation and cytokine production are bioenergetically and biosynthetically costly. The inability to meet these metabolic demands results in altered differentiation, accompanied by impaired effector function, and attrition of the immune response. IL-17-producing CD4 T cells (TH17s) are mediators of host defense, autoimmunity, and anti-tumor immunity in the setting of adoptive T cell therapy. TH17s are long-lived cells that require mitochondrial oxidative phosphorylation (OXPHOS) for effector function in vivo. Considering TH17s polarized under standardized culture conditions are predominately glycolytic, little is known of how OXPHOS regulates TH17 processes, such as their ability to persist and thus contribute to protracted immune responses. Here, we modified standardized culture media and identified a culture system that reliably induces OXPHOS dependence in TH17s. We found that TH17s cultured under OXPHOS conditions metabolically resembled their in vivo counterparts whereas glycolytic cultures were notably dissimilar. OXPHOS TH17s exhibited increased mitochondrial fitness, glutamine anaplerosis, and an anti-apoptotic phenotype marked by high BCL-XL and low BIM. Limited mitophagy, mediated by mitochondrial fusion regulator OPA-1, was critical to apoptotic resistance in OXPHOS TH17s. By contrast, glycolytic TH17s exhibited more mitophagy and an imbalance in BCL-XL to BIM, thereby priming them for apoptosis. Additionally, through adoptive transfer experiments, we demonstrated that OXPHOS protected TH17s from apoptosis while enhancing their persistence in the periphery and tumor microenvironment in a murine model of melanoma. Together, our work demonstrates how metabolism regulates TH17 cell fate and highlights the potential for therapies that target OXPHOS in TH17-driven diseases.
One sentence summary:
OXPHOS promotes apoptotic resistance and persistence in TH17s by restricting mitophagy-mediated degradation of apoptotic regulators.
Introduction
IL-17-producing CD4 T cells (TH17s) are a subset of CD4 T cells critical for host-defense and mucosal immunity. TH17s are long-lived cells that exhibit the capacity to self-renew and establish tissue residency following antigen clearance (1–5). These features facilitate their role in autoimmunity and anti-tumor immunity in the setting of adoptive T cell therapy (3, 4, 6–9). Additionally, these features suggest that TH17s evade mechanisms that would otherwise lead to their deletion following antigen clearance, such as apoptosis which is a type of programmed cell death. Although, the factors that enable TH17s to evade apoptotic cell death and be maintained as long-lived cells have yet to defined.
Glycolysis and mitochondrial oxidative phosphorylation (OXPHOS) are the two principal bioenergetic pathways in a cell, and their differential activity has major impacts on virtually all aspects of cellular metabolism. Predictably, each of these have similarly been implicated in controlling T cell fate and function. Recent studies have further refined our understanding of the metabolic programs that regulate T cells, which have revealed that T cell subsets adopt distinct and often times unique metabolic dependencies to execute subset-specific functions (10). Nevertheless, the majority of immunometabolism studies have focused on the effects of metabolism at the outset of an immune response. Metabolic inhibition during T cell activation can override cytokine-mediated differentiation, impair effector cytokine production, and thus alter the type and magnitude of an immune response (11–15). It remains an outstanding question how metabolic activity during the effector phase regulates T cell fate during subsequent phases, such as the contraction and memory phases.
Furthermore, our knowledge of TH17 metabolism largely relies on in vitro studies that identified TH17s as predominately glycolytic, resulting in the presumption that TH17s in vivo would also be glycolytic. However, growing evidence now indicate that in vivo TH17s require OXPHOS for lineage specification and pathogenicity, indicating that OXPHOS plays a critical role during TH17 effector phases (16–18). Considering standardized culture practices generate TH17s that do not metabolically resemble their physiological counterparts, the role of OXPHOS in regulating TH17 processes has been largely unexplored.
In this study, we developed a cell culture system amenable to manipulation and capable of retaining features of naturally arising TH17s. With this, we interrogated the physiological role of OXPHOS in TH17 biology. We demonstrated that OXPHOS provided considerable resistance to apoptotic cell death, characteristics consistent with long-lived TH17s from in vivo systems. We found that an anti-apoptotic program intrinsic of OXPHOS TH17s led to enhanced persistence in the periphery and tumor microenvironment, suggesting that OXPHOS polarization provides TH17s with a survival advantage in vivo.
Results
OXPHOS promotes metabolic fitness in TH17 cells
In vivo, TH17s adapt an oxidative phenotype and require OXPHOS for cytokine production during effector phases, chronic inflammation, and infection (16–19). It remains unclear why in vivo TH17s require OXPHOS instead of glycolysis. This is cofounded by the observation that in vitro TH17s are highly glycolytic. Current techniques are limited in their ability to study TH17 metabolism in vivo (20); rapid ex vivo analysis is bounded by cell number, and TH17 expansion in culture leads to changes in both the metabolic and functional phenotype. To overcome these limitations, we developed a cell culture system in which we could maintain TH17s in their native metabolic state during expansion, allowing for adequate cell numbers for detailed metabolic and molecular analysis.
To this end, we compared media formulations known to promote OXPHOS activity in vitro. Murine naïve CD4 T cells were activated under TH17-polarizing conditions in glucose-free media supplemented with either an equimolar concentration of galactose (i.e. 10mM), a low concentration of glucose, or 10mM glucose in the presence of 2-deoxyglucose (2-DG) (Fig. S1A). As a structural isomer of glucose, galactose inefficiently enters glycolysis through the Leloir pathway, which is thought to impede glycolytic generation of ATP (21–23). In this way, cells are forced to utilize mitochondrial OXPHOS to generate ATP. Similarly, media that contains a low concentration of glucose is expected to restrict glucose consumption, resulting in decreased glycolytic activity (24, 25). Culture in the presence of 2-DG perturbs glycolytic activity through inhibition of hexokinase, the rate-limiting enzyme of glycolysis (26, 27). In parallel, TH17s were polarized using the conventional paradigm: standardized media that contained 10mM glucose.
Seahorse flux analysis was used to compare the metabolic phenotype induced by each culture method. Media containing galactose, low glucose, or 2-DG were capable of increasing oxygen consumption rates (OCR) and lowering extracellular acidification rates (ECAR), compared to that of cells in glucose-containing media (Fig. 1A, 1B). Additionally, cells from galactose and low glucose cultures exhibited higher spare respiratory capacities (SRC), which has been suggested to be a measurement of the reserved energy in a cell for responses to stress, also referred to as metabolic fitness (28) (Fig. 1C). Thus, there are various ways to manipulate culture conditions that can achieve an oxidative phenotype in vitro (Fig. 1D). However, flow cytometry analysis of cell viability and proliferation revealed that for TH17s cultured in low glucose or 2-DG, this was at the expense of cellular quality and quantity (Fig. 1E, 1F, S1B). Considering, galactose culture robustly increased OXPHOS activity without negatively impacting cellular yield, it was selected as our primarily method to model OXPHOS activity in vitro. We herein refer to cells differentiated in galactose-containing media as OXPHOS TH17s and those differentiated in glucose as glycolytic TH17s.
Figure 1: Comparison of culture methods that promote an oxidative phenotype.
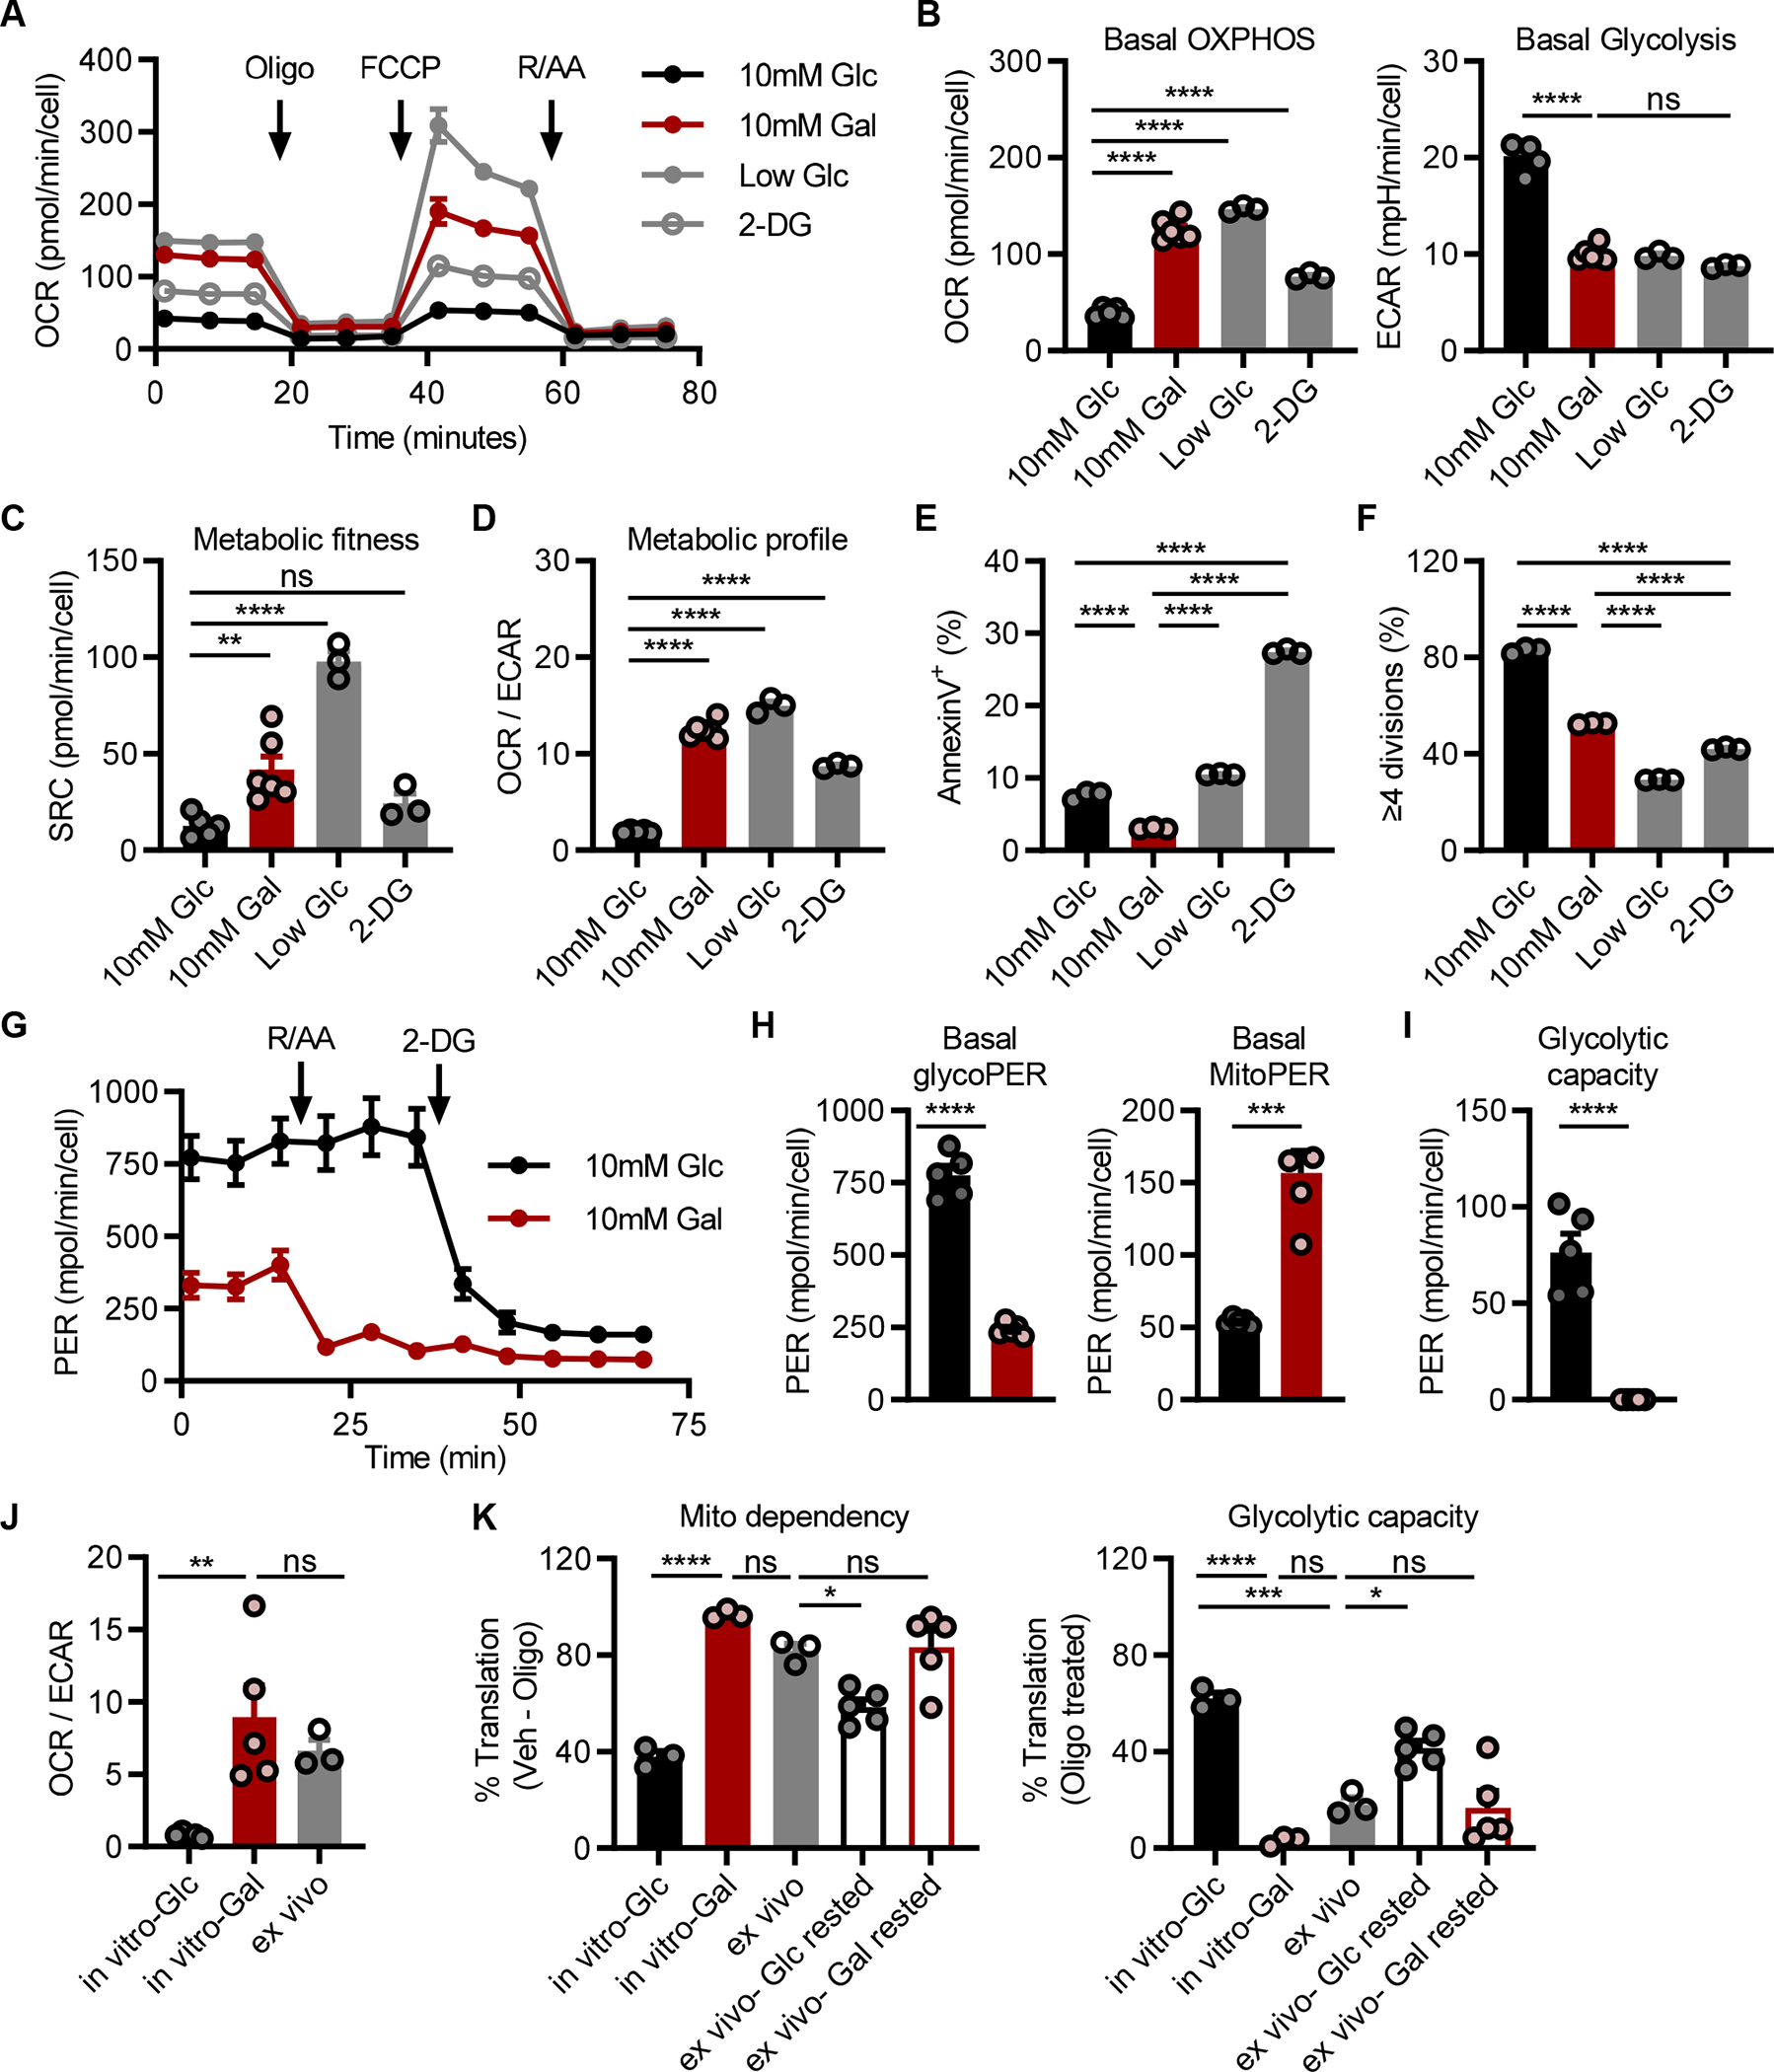
(A-D) Seahorse analysis to assess OXPHOS activity in TH17s following polarization in glucose-free RPMI supplemented with either 10mM glucose, 10mM galactose, 0.1mM glucose, or 10mM glucose and 2-deoxyglucose; 2-DG. (A) TH17s were subject to the mitostress test to quantify the (B) basal oxygen consumption rate; OCR, extracellular acidification rate; ECAR, (C) spare respiratory capacity; SRC, and (D) OCR/ECAR ratio. Parallel analysis of (E) cell death or (F) proliferation in cell trace violet-stained cells were quantified by flow cytometry (n=3–6).
(G-I) Seahorse analysis to examine glycolytic activity in TH17s polarized under glycolytic or OXPHOS conditions. (G) TH17s were subject to the glycolytic rate assay to assess the proton efflux rate; PER (H) at baseline due to either glycolysis (left) or mitochondrial activity (right) or (I) upon treatment with OXPHOS inhibitors rotenone and antimycin to assess glycolytic capacity (n=5).
(J) Seahorse analysis comparing the metabolic phenotype of in vitro glycolytic and OXPHOS TH17 vs. ex vivo cells activated in vivo (n=5 in vitro; n=3 ex vivo, each point represents pooled samples from 5 mice)
(K) SCENITH analysis of in vitro cells vs. ex vivo cells activated in vivo vs. CD4+GFP+ cells isolated from IL-17-GFP mice and rested in either glucose- or galactose-containing media for 2hrs prior to analysis. Mitochondrial dependency (left) was based on the amount of protein translation that was inhibited upon oligomycin treatment and glycolytic capacity (right) represents the amount of translation sustained upon OXPHOS inhibition (n=3 in vitro; n=3 mice ex vivo; n=5 mice ex vivo IL-17-GFP).
All data are graphed as mean ±SEM and data represent one of two independent experiments. Statistical significance was determined using (B-F, J, K) one-way ANOVA or (H, I) two-tailed unpaired t-test (*p<0.05; **p<0.01; ***p<0.001; ****p<0.0001).
Standardized culture conditions promote maximal glycolysis in TH17s
Galactose carbon, after phosphorylation and isomerization, enters glycolysis as glucose 6-phosphate, in a manner akin to glucose. Thus, to study the bioenergetic use of glycolysis between OXPHOS and glycolytic TH17s, the glycolysis rate assay was performed. Specifically, we employed the proton efflux rate (PER), which differentiates media acidification produced by glycolytic or mitochondrial activity (Fig. 1G). Glycolytic TH17s exhibited higher basal glycolysis compared to OXPHOS TH17s, and mitochondrial activity was the major contributor to media acidification in OXPHOS TH17s (Fig. 1H). To assess glycolytic capacity, cells were co-treated with the mitochondrial poisons rotenone and antimycin A to inhibit the electron transport chain (ETC) and promote the use of glycolysis as the main source of energy. OXPHOS TH17s were unable to upregulate glycolysis to compensate for ETC inhibition (Fig. 1I). In contrast, glycolytic TH17s exhibited a modest increase in PER upon ETC inhibition, relative to baseline, suggesting that TH17s cultured in standardized media already exhibited near maximal glycolytic activity.
To evaluate how the metabolic phenotype of in vitro-generated OXPHOS TH17s compared to that of in vivo TH17s, we performed a side-by-side metabolic analysis. In brief, in vivo cells were activated and generated as previously described (18), purified by flow sorting, rested for 2 hours in standardized media, and then examined ex vivo by Seahorse (Fig. 1J, S1C). In parallel, in vitro glycolytic and OXPHOS TH17s were generated and similarly processed. From this analysis, we found that the metabolic phenotype of ex vivo cells is well-reflected by in vitro TH17s cultured under OXPHOS conditions, but not glycolytic conditions.
To validate these findings, the metabolic state was characterized by SCENITH, a flow-cytometry based platform that measures protein translation as a surrogate readout of bioenergetic capacity (29). As proteins are biosynthetic end-products of metabolism, the metabolic phenotype is inferred by the ability to translate protein upon inhibition of glycolysis or OXPHOS (Fig. S1D). Importantly, SCENITH has been adapted for rare immune populations, and thus allows for rapid metabolic profiling ex vivo, a limitation with other methods that assess metabolism (30, 31).
SCENITH analysis of TH17 cultures reproduced our findings using Seahorse. Namely, in vitro OXPHOS TH17s exhibited maximal mitochondrial dependency and no glucose capacity; whereas, glycolytic TH17s had greater glucose capacity and lower mitochondrial dependency (Fig. 1K; see solid black and red). When TH17s were activated in vivo, as in Fig. 1J, lymphoid tissues were harvested and immediately subjected to SCENITH. Comparison of the metabolic states between in vitro and ex vivo TH17s revealed that OXPHOS TH17s were more similar to that of ex vivo cells, as compared to their glycolytic counterpart (Fig. 1K; see grey vs. solid black and red). To examine whether OXPHOS conditions could maintain the native metabolic state of TH17s, lymphoid tissues were harvested from IL-17-GFP mice and rested in either glucose or galactose media for 2 hours prior to SCENITH (Fig. 1K; see outlined black and red). Analysis of CD4+GFP+ TH17s revealed that cells rested under OXPHOS conditions metabolically resembled their ex vivo and in vitro counterparts. In all, these findings are in line with our prior report demonstrating that the metabolic phenotype of in vitro TH17s cultured in standardized media is not representative of in vivo cells (18). By contrast, we now show that in vitro TH17s cultured under OXPHOS conditions better model the metabolic state of those derived in vivo.
Aerobic glycolysis is not required for TH17 differentiation or effector function
Numerous studies have demonstrated how the metabolic state of a cell can also play a crucial role in regulating T cell identity (32, 33). To examine whether the predominate use of OXPHOS alters TH17 differentiation, cells were intracellularly stained for the TH17 lineage-defining transcription factor RORγt (Fig. 2A, S1E). Since TH17s have been observed to transdifferentiate under certain circumstances in vivo, the expression of Tbet or Foxp3 were also examined to assess whether OXPHOS induces TH1 or Treg transdifferentiation, respectively. Relative to TH1 or Treg controls, TH17s retained their TH17 identity, irrespective of metabolic phenotype (Fig. 2B, 2C). Further, glycolytic and OXPHOS TH17s expressed their effector cytokine IL-17 at comparable levels, a reflection of expression of the lineage-defining transcription factor RORγt, and were low-producers of IFNγ (Fig. 2D, 2E).
Figure 2: Aerobic glycolysis is not required for TH17 differentiation or function.

(A) Representative flow histogram of RORγt expression (left) and accompanying quantification (right) expressed as the percentage of CD4+RORγt+ cells (n=4).
(B) Representative flow histogram of Tbet expression (left) and accompanying quantification (right) of the percentage of CD4+Tbet+ cells in glycolytic and OXPHOS TH17s, compared to TH1 controls (n=3).
(C) Representative flow histogram of Foxp3 expression (left) and accompanying quantification (right) of the percentage of CD4+Foxp3+ cells in glycolytic and OXPHOS TH17s, compared to Treg controls (n=3).
(D-E) Comparison of effector function between glycolytic and OXPHOS TH17s following PMA/ionomycin restimulation. (D) Representative flow plots (left) and accompanying quantification (right) IL-17A+ expression in glycolytic and OXPHOS TH17s (n=8). (E) Quantification of IFNγ+ in TH17s, relative to TH1 controls (n=3). Expression of intracellular markers were live-gated on CD4+ single cells.
All results represent at least 3 independent experiments and all data are mean ±SEM. Statistical significance was determined using (A, D) paired t test or (B, C, E) one-way ANOVA.
Cell proliferation is intimately linked to metabolic activity, as glycolysis and OXPHOS produce the energy and biosynthetic intermediates needed for cell growth. Cell Trace Violet (CTV)-dilution experiments revealed that TH17s proliferated at a slower rate in OXPHOS conditions compared to that of glycolytic TH17s (Fig. 1F). To examine whether the proliferative phenotype induced by the metabolic state is fixed, OXPHOS TH17s were subcultured in glucose-containing media in an effort to promote the use of glycolysis (Fig. S1F). We found that the decreased proliferative rate of OXPHOS TH17s persisted following subculture in glucose-containing media for 48 hours; likewise, the proliferative rate of glycolytic TH17s was unperturbed when pressured to use OXPHOS through subculture in galactose-containing media. Parallel analyses using Seahorse or SCENITH revealed that OXPHOS TH17s subcultured in glucose-containing media metabolically resembled their glycolytic controls, and a corresponding switch in metabolic state was observed in glycolytic subcultures (Fig. S1G–J). Together, these findings suggest that functional properties, such as proliferation, are established by the metabolic conditions during differentiation and that this predominates over subsequent metabolic adaptation.
Profiling analyses reveal differential glutamine metabolism between glycolytic and OXPHOS TH17s
Our data indicated that the predominate use of glycolysis or OXPHOS does not alter the differentiation of TH17s. This uniformity in TH17 differentiation and effector function between otherwise metabolically distinct TH17 cell types allowed for the examination into cellular processes—regulated by metabolism—but uncoupled to differences in cellular identity and functionality.
To this end, we profiled TH17 cultures by bulk RNA sequencing (RNA-seq) and liquid chromatography-coupled tandem mass spectrometry (LC-MS/MS)-based metabolomics. First, RNAseq analysis revealed that nearly 17% of detected genes were differentially expressed (Fig. 3A). Of the top 500 most significantly changed genes, Gene Ontology analysis revealed enrichment in processes involved in immune differentiation and cytokine production, metabolism, regulatory activity, and cell death (Fig. 3B). Gene set enrichment analysis identified pathways associated with various signaling events, hypoxia, inflammation, and apoptosis in glycolytic TH17s (Fig. S2A). Direct examination of genes required for ETC activity, as well as some involved in glycolysis, revealed that these were upregulated in OXPHOS TH17s (Fig. S2B).
Figure 3: Transcriptomic and metabolomic profiling of OXPHOS and glycolytic TH17s.

(A) Venn diagram depicting the number of differentially expressed genes (log2 fold change>|0.5|, adjusted p-value<0.05) between glycolytic (black) and OXPHOS (red) TH17s analyzed by RNA-seq.
(B) Gene Ontology analysis of the top 500 significantly changed genes from (A).
(C) Venn diagram depicting the number of differential metabolites (log2 fold change>|1|, p-value<0.1) between glycolytic and OXPHOS TH17s analyzed by metabolomics.
(D) Differential metabolite levels of intermediates in glycolysis or galactose metabolism in TH17s.
(E) Volcano plot of metabolites based on fold change (FC) and corresponding significance. Each circle represents a metabolite, significantly changed metabolites (log2FC >|1|, p-value<0.1) are depicted as solid circles.
(F and G) [U]13C glutamine tracing metabolomics in (F) glycolytic vs. OXPHOS TH17s or (G) in vitro vs. ex vivo TH17s. Fractional labeling pattern of isotopologues for TCA cycle metabolites (mass+0–5; m+): 13C glutamine-derived glutamate (13C-Glu), malate (13C-Mal), and aspartate (13C-Asp).
(H) [U]13C glucose incorporation in glycolytic TH17s was compared to [U]13C galactose incorporation in OXPHOS TH17s. Fractional labeling pattern of TCA cycle metabolites.
All data are mean ±SEM (n=2–3; biological replicates). Statistical analysis was determined by (D, F-H) two-way ANOVA or (E) two-tailed unpaired t-test (*p<0.05; **p<0.01; ***p<0.001; ****p<0.0001). Glucose-6-phosphate (G6P), fructose-6-phosphate (F6P), fructose-1,6-bisphosphate (FBP), dihydroxyacetone phosphate (DHAP), pyruvate (Pyr), lactate (Lac), galactose-1-phosphate (Gal1P), glucose-1-phosphate (G1P), reduced glutathione (GSH), glutamate (Glu), malate (Mal), aspartate (Asp).
As metabolic pathway activity is influenced by numerous factors (e.g., nutrient uptake, metabolic gene and protein expression) and culminates in the production of metabolites, we next examined our metabolomics dataset to compare the metabolite profiles between glycolytic and OXPHOS TH17s. Approximately 23% of central carbon metabolites were differentially enriched between TH17 types (Fig. 3C). In agreement with our Seahorse analysis, we found that the intermediates of glycolysis were more abundant in glycolytic TH17s, while intermediates of galactose metabolism were enriched in OXPHOS TH17s (Fig. 3D, 3E). These data reproduced our previous metabolomics analysis on in vitro- vs. in vivo-derived TH17s (18), wherein the in vivo cells have much smaller glycolytic pools, further substantiating the culture system being explored herein. In fact, carbohydrate metabolism was among the most distinguishing features according to metabolic pathway analysis (Fig. S2C).
Despite setting the carbohydrate content in our TH17 cultures, glutamine metabolism and related pathways (e.g., glutathione, non-essential amino acid metabolism, pyrimidine metabolism) were even more enriched than carbohydrate metabolism-related pathways (Fig. S2C–S2F). Indeed, TH17s rely on glutamine metabolism to support differentiation. Glutamine serves as one of the major carbon sources for the tricarboxylic acid (TCA) cycle, the products of which mediate TH17 lineage specification (14). Glutamate, the product of glutamine deamidation, is also required for the synthesis of reduced glutathione (GSH), which is critical in TH17s to limit redox stress during differentiation (12, 34, 35). While we found that glycolytic and OXPHOS cultures supported TH17 differentiation equivalently (Fig. 2), our metabolomics analysis indicated that glutamine, glutamate, and αKG were depleted in OXPHOS TH17s, with similar trends for most of the other TCA cycle intermediates, as compared to those in glycolytic TH17s (Fig. S2D). Furthermore, GSH was among the most differentially regulated metabolites, being enriched >10-fold in the OXPHOS cultures (Fig. 3E).
Thus, to compare how glycolytic and OXPHOS TH17s use glutamine, we performed stable isotope tracing metabolomics by culturing TH17s in the presence of uniformly 13-carbon-labeled ([U]13C)-glutamine and analyzed label incorporation as a function of time. This [U]13C-glutamine tracer molecule employs the stable carbon-13 isotope that is 1 Dalton heavier than naturally occurring carbon-12. Glutamine has five carbon atoms. Thus, metabolites downstream of glutamine that incorporate glutamine-derived 13C can be identified by a shift in mass; m+1 for 1 carbon atom; m+2 for 2 carbons, etc. From this kinetic analysis, we found that OXPHOS cultures incorporated more glutamine-derived carbon into TCA cycle intermediates and de novo GSH biosynthesis over time (Fig. 3F, S3A). In line with this, by 24hrs, these metabolite pools were enriched with a diversity of isotopologues (m+1, m+2, m+3, m+4 species), indicative of glutamine anaplerosis and oxidative TCA cycling. By contrast, glycolytic TH17s exhibited higher levels of both unlabeled (m+0) TCA cycle metabolites, illustrating that the utilization of glutamine as an anaplerotic substrate occurs to a lesser degree in glycolytic TH17s. To corroborate these findings, we compared [U]13C-glutamine labeling patterns in TH17s derived under glycolytic conditions in vitro to those derived in vivo and then cultured/labeled ex vivo for 3hours. Here again, we see an enrichment of glutamine-derived carbon in the TCA cycle intermediates from the oxidative in vivo cells, relative to the in vitro glycolytic cells (Fig. 3G, S3B).
In parallel with the glutamine tracing studies above, we also traced carbohydrate metabolism in our TH17 cultures using [U]13C-glucose for the glycolytic TH17s and [U]13C-galactose for the OXPHOS TH17s. The results from this experiment revealed that the glycolytic cells incorporate more carbohydrate-derived carbon into the TCA cycle than do the OXPHOS cultures (Fig. 3H). Together with our data above, this suggests that the OXPHOS cells require more glutamine-derived carbon to fill the TCA cycle to account for the limited entry of galactose carbon. To ascertain that differential glutamine utilization results in distinct bioenergetic activities, TH17s were acutely starved of glutamine prior to Seahorse analysis (Fig. S3C). Glutamine depletion decreased basal OCR in OXPHOS TH17s, with a similar trend in glycolytic cells, albeit smaller in magnitude. Notably, SRC was diminished in OXPHOS TH17s upon glutamine depletion (Fig. S3D). In all, these data show that glutamine critically supports TCA cycling and bioenergetic activity in OXPHOS TH17s.
OXPHOS TH17s are resistant to apoptotic cell death
As indicated above, the predominate use of glycolysis or OXPHOS has widespread impacts on central carbon metabolism. One of the most significantly altered metabolites between glycolytic and OXPHOS TH17s was GSH (Fig. 3E, S3E). GSH is an antioxidant that detoxifies reactive oxygen species (ROS) through the conversion of reduced GSH to oxidized glutathione (GSSG). Comparison of the ratio of reduced to oxidized glutathione and the levels of mitochondrial and intracellular ROS revealed that OXPHOS TH17s had increased antioxidant capacity (Fig. S3E, S3F).
To test whether this baseline difference in antioxidant profile had a functional role, TH17s were treated with cell-permeable hydrogen peroxide (tert-butyl hydrogen peroxide; TBHP) as an oxidative challenge. Quantification of cell viability revealed that glycolytic TH17s were more susceptible to oxidant-induced cell death (Fig. 4A, 4B). These results prompted us to investigate whether differences in metabolic activity differentially sensitized TH17s to other stimuli that cause cell death. Several lines of evidence led us to focus on apoptosis. First, apoptosis is an immune tolerance mechanism that eliminates T cells in nearly all phases of their life span. TH17s have been observed to be long-lived cells (2–4), indicating that they escape numerous tolerance mechanisms that would result in apoptotic cell death. Second, our transcriptomics analysis revealed differences in apoptotic signaling between glycolytic and OXPHOS TH17s, linking metabolism to TH17 apoptotic sensitivity (Fig. 3B, S2A). Third, analysis of the frequency of apoptotic cells following treatment with TBHP identified that glycolytic cells underwent apoptosis to a greater extent than their OXPHOS counterparts (Fig. 4C). Thus, to determine if glycolytic and OXPHOS TH17s were indeed differentially sensitized to apoptosis, cells were treated with staurosporine to induce the intrinsic apoptotic pathway or Fas to activate the extrinsic pathway. The percentage of apoptotic cells was significantly greater in glycolytic TH17s than OXPHOS TH17s (Fig. 4D, 4E). Together, these data revealed that OXPHOS TH17s were more resistant to apoptotic cell death.
Figure 4: Glycolysis sensitizes TH17s to apoptosis.

(A-C) Examination of apoptotic sensitivity in TH17s treated with tert-butyl H2O2 (TBHP). (A) Representative flow plots of Annexin V vs. 7-AAD staining of TH17s following treatment with 0.5μM TBHP. Accompanying quantification of the frequency of (B) viable or (C) apoptotic cells (n=3).
(D and E) Quantification of apoptosis (AnnexinV+ 7-AAD− cells) following treatment with (D) staurosporine or (E) anti-Fas (n=3).
(F-H) Expression of anti- and pro-apoptotic regulators in TH17s. Intracellular staining of anti-apoptotic regulators (F) BCL-XL, (G) BCL-2 or pro-apoptotic regulators (H) BIM were examined in live-gated CD4+ TH17s by flow cytometry. Representative flow histograms (left) with numbers in histograms representing the median fluorescent intensity (MFI ±SEM) of 3 technical replicates and quantification of MFI (right) from (F, G) n= 5 experiments or (H) n=2 experiments.
(I and J) Representative western blots of apoptotic regulators in TH17s. (I) Anti-apoptotic regulators BCL-XL, MCL-1, BCL-2 (left panel), pro-apoptotic regulators BIM and BID (right panel), or (J) apoptotic inducers BAX and cleaved caspase 3, accompanied with caspase-target PARP, were examined in Glycolytic TH17s; G and OXPHOS TH17s; O.
(K) TH17s were treated with ABT-263 and/or S63845, followed by staurosporine (STA). Frequency of cell death was based on Annexin V+ 7-AAD+ detection by flow cytometry (n=4, 2 experiments).
(L and M) TH17s transduced with retrovirus expressing empty vector; EV (L) BCL-XL or (M) BIM were challenged with STA and cell death was quantified in transduced cells (n=3).
All data are mean ±SEM and all data represent at least one of two independent experiments. Statistical significance was determined by (B-E, K-M) two-way ANOVA or (F-H) two-tailed paired t-test (*p<0.05; **p<0.01; ***p<0.001; ****p<0.0001).
OXPHOS alters the expression of anti- and pro-apoptotic proteins in TH17s
Significant differences in apoptosis were observed between glycolytic and OXPHOS TH17s, both at baseline (see vehicle-treated controls) and following apoptotic challenge (Fig. 4C–E). This indicated that the predominant use of glycolysis and OXPHOS may induce different apoptotic thresholds, which would prime TH17s to respond accordingly, irrespective of which apoptotic pathway is activated. Consequently, we queried our RNA-seq dataset for key apoptotic genes and found that glycolytic TH17s predominately expressed pro-apoptotic genes (Fig. S4A).
Next, we compared the levels of the BCL-2 family proteins to examine the balance of pro- vs. anti-apoptotic factors, which dictates apoptotic sensitivity. Consistent with the observed differences in cell viability, OXPHOS TH17s expressed higher levels of the anti-apoptotic regulators BCL-XL and MCL-1, and lower levels of the pro-apoptotic activator BIM, compared to glycolytic TH17s (Fig. 4F–I). We also observed that cleaved caspase 3 (CC3) was higher in resting glycolytic TH17s (Fig. 4J), yet concurrent analysis showed that these cells were ~90% viable (Fig. 4B–E). This was further confirmed by the lack of PARP cleavage, which is a product of irreversible apoptotic cell death. These findings are in agreement with the notion that caspase 3 is activated upon T cell activation and serves as a self-limiting mechanism that predestines effector T cells for apoptotic cell death (36). Thus, these observations suggested that glycolytic TH17s are molecularly primed to die. By contrast, OXPHOS TH17s were intrinsically more resistant to apoptosis through downregulated expression of BIM and upregulated expression of BCL-XL and MCL-1.
We next assessed whether the anti-apoptotic profile of OXPHOS TH17s generated in vitro matched that of in vivo TH17 cells. Indeed, analysis of publicly available transcriptome data from TH17s generated using comparative in vivo vs. in vitro models revealed that in vivo TH17s exhibited an anti-apoptotic gene expression profile, compared to that of in vitro (glycolytic) TH17s (Fig. S4B). In addition, we tested the generality of OXPHOS culture in promoting apoptotic resistance by polarizing CD4 and CD8 subsets under glycolytic or OXPHOS conditions. We found that OXPHOS upregulated the expression of BCL-XL within the CD4 subsets, but distinctly modulated the expression of BIM, which limited their ability to resist apoptotic challenge (Fig. S4C, S4D). Conversely, polarization of effector and memory CD8 T cells under OXPHOS conditions revealed distinct molecular patterns relative to those observed in TH17s (Fig. S4E, S4F), suggesting that CD8 T cells employ distinct cell death mechanisms.
BCL-XL is required to mediate apoptotic resistance in TH17s
Considering OXPHOS TH17s predominately upregulated BCL-XL and MCL-1, we next tested whether apoptotic resistance in OXPHOS TH17s was mediated through their anti-apoptotic activity. To this end, TH17s were treated with ABT-263, which is a pan-inhibitor of BCL-2, BCL-XL, and BCL-W; S63845 to selectively inhibit MCL-1; or the combination. ABT-263 treatment alone only modestly increased spontaneous apoptosis in OXPHOS TH17s, presumably due to the inherent low BIM expression (Fig. S4G). However, this modest induction of cell death mediated by ABT-263 treatment brought OXPHOS TH17s to the same level of cell death as vehicle-treated glycolytic cells. In contrast, ABT-263 treatment enhanced spontaneous apoptosis in glycolytic TH17s, underscoring the importance of BCL-XL, BCL-2, and BCL-W in TH17 survival. Treatment with S63845 neither had a significant effect as a single agent nor potentiated the effects of ABT-263 in either glycolytic or OXPHOS TH17s (Fig. S4G). These results suggested that MCL-1 was not a critical regulator of TH17 cell survival.
We next assessed the impact of these anti-apoptotic proteins in protection from instructed apoptotic cell death using the pharmacological inhibitors noted above. TH17s were pretreated individually or in combination with ABT-263 and S63845, and then challenged with the apoptotic stimuli staurosporine (STA) or TBHP. ABT-263 potentiated the effects of STA in both glycolytic and OXPHOS TH17s, and S63845 again had no impact (Fig. 4K). These results further underscored the roles of the BCL-2 family members in TH17 apoptosis. In contrast to the results with STA, ABT-263 treatment sensitized OXPHOS TH17s to the cytotoxic effects of TBHP to the same degree as glycolytic cultures, suggesting a differential role for BCL-2/BCL-XL in TBHP-mediated apoptosis (Fig. S4H).
Based on these results, we then sought to determine if BCL-XL was sufficient to protect TH17s from cell death. TH17s were retrovirally transduced with empty vector or BCL-XL and treated with STA. BCL-XL expression rescued spontaneous and STA-induced cell death in glycolytic TH17s, while having no significant impact on OXPHOS TH17s (Fig. 4L). Conversely, retroviral-mediated expression of BIM sensitized both OXPHOS and glycolytic TH17s to spontaneous and STA-induced cell death (Fig. 4M). Together, these data show that the OXPHOS-mediated induction of BCL-XL and repression of BIM facilitated survival and protection from apoptotic cell death, relative to glycolytic controls.
Mitophagy regulates apoptotic resistance in TH17s
Mitochondrial integrity is central to cell survival, and manipulation of mitochondrial mass in activated CD8 T cells can alter their functionality and persistence in vivo (28, 37, 38). With these concepts in mind, we next examined whether differences in mitochondrial mass between glycolytic and OXPHOS TH17s were responsible for the observed differences in cell survival. Quantification of mitochondrial mass using MitoTracker Green (MTG) indicated that OXPHOS TH17s had more mitochondria than glycolytic cultures (Fig. 5A). Since BCL-XL is localized to and functions in the mitochondria, we hypothesized that the greater mitochondrial content in OXPHOS cultures was responsible for the elevated expression of BCL-XL. To test this hypothesis, TH17s were stained with MitoTracker Green, the top and bottom 20% of stained cells were sorted into mitochondrial high and low fractions, and then stained for BCL-XL and BIM. OXPHOS TH17s with more mitochondria expressed the highest levels of BCL-XL (Fig. 5B). We also observed a modest but significant increase in BIM expression in the MTG high cultures, which was comparable between the glycolytic and OXPHOS cultures (Fig. S5A). We validated that increased mitochondrial mass and BCL-XL were general features of oxidative TH17s by examining cells polarized under low glucose conditions, as in Fig. 1A (Fig. S5B). Together, these results indicated that TH17s that predominately use OXPHOS have greater mitochondrial mass, and this correlates with more BCL-XL.
Figure 5: Mitophagy regulates apoptotic resistance in TH17s.
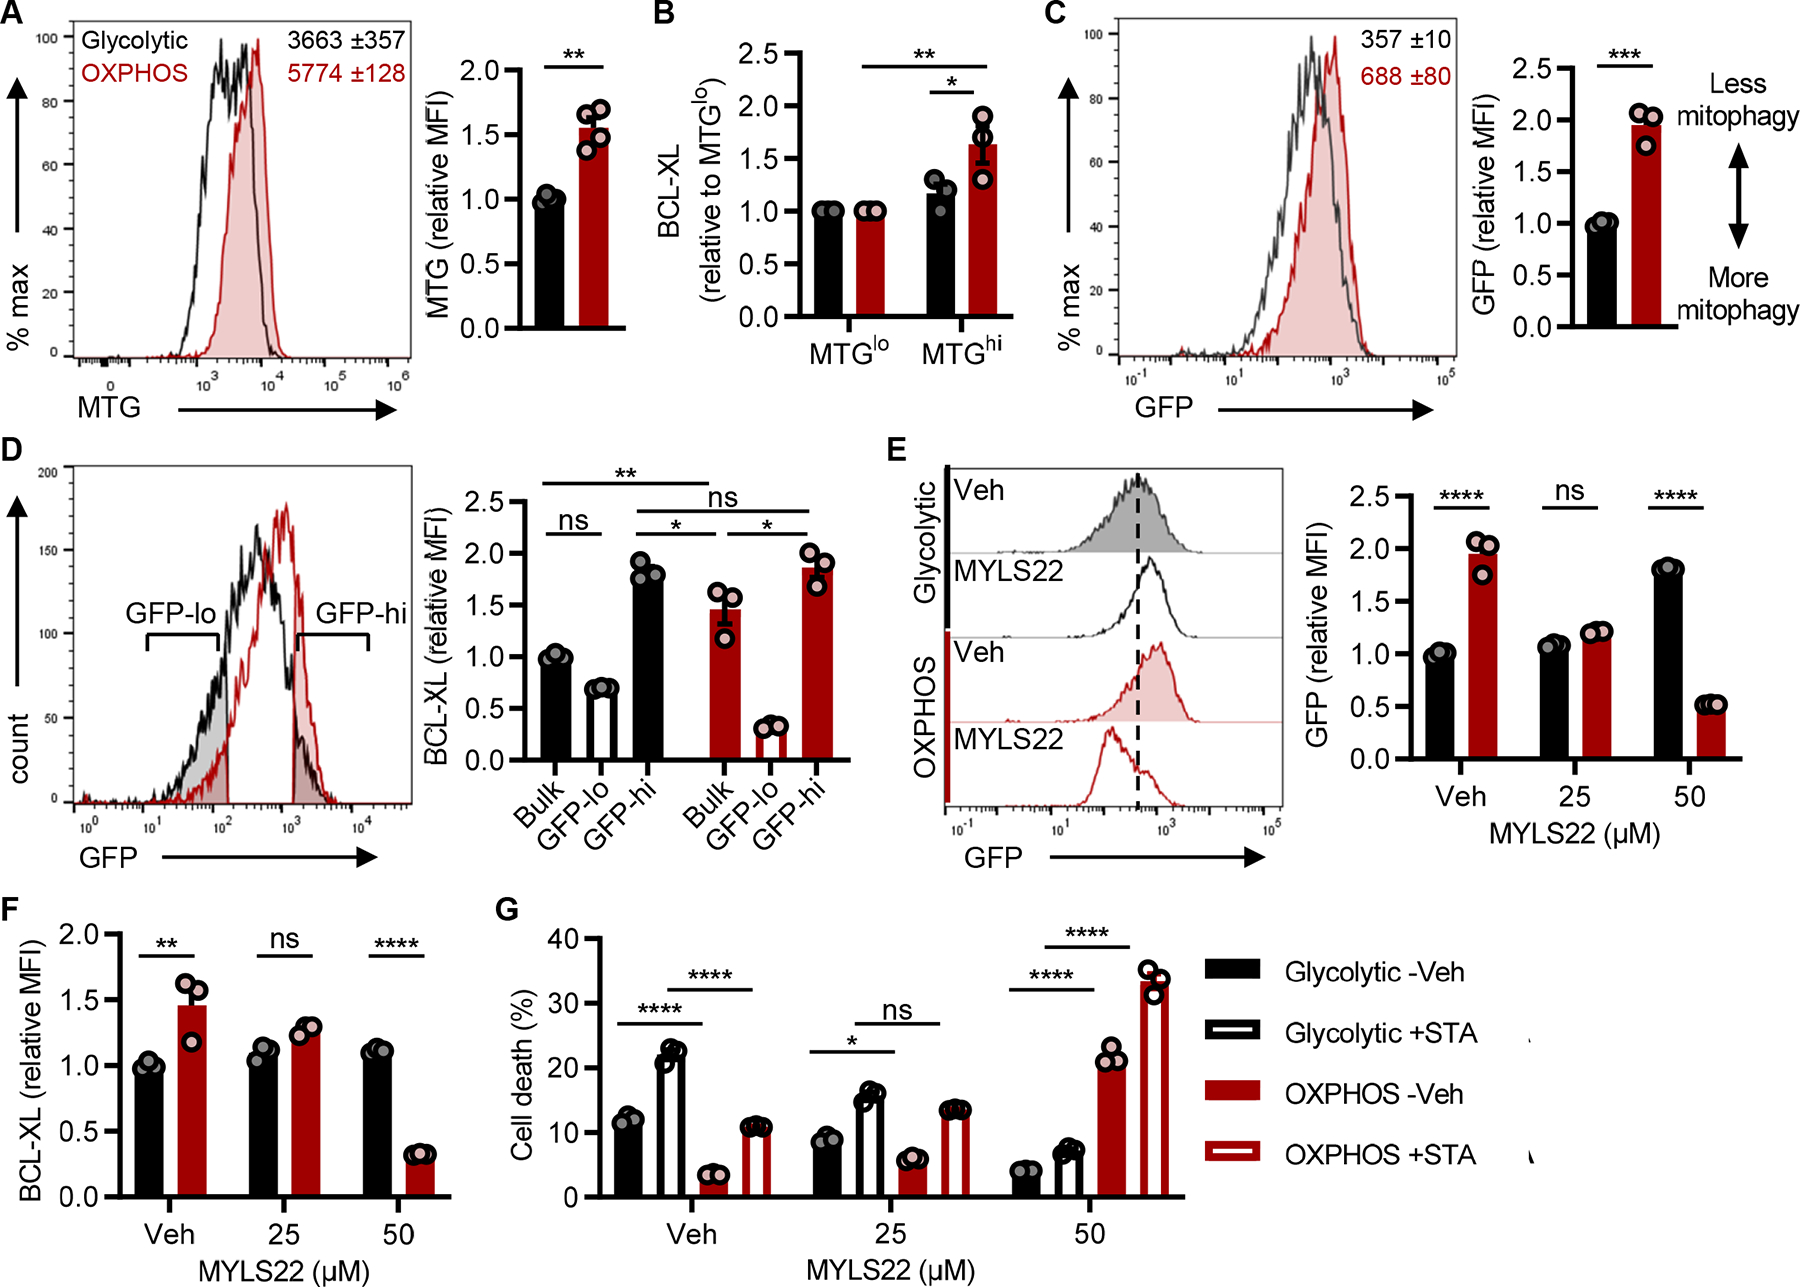
(A) MitoTracker Green (MTG) staining in TH17s to assess mitochondrial mass. Representative flow histogram (left) includes MFI ±SEM of 3 technical replicates and accompanying quantification (right) of MTG in live-gated CD4+ TH17s from n=4 experiments.
(B) BCL-XL expression in TH17s with the least or most amount of mitochondrial mass. MTG-stained TH17s were flow sorted based on the 20% lowest and highest MFI, and then stained for BCL-XL (n=3).
(C-G) Naïve CD4 T cells were isolated from lymphoid tissues of mitoQC mice and polarized to the TH17 lineage under glycolytic or OXPHOS conditions. (C) Mitophagy activity was based on the loss of GFP detection which was quantified by flow cytometry. Representative flow histogram (left) includes MFI ±SEM of 3 technical replicates and accompanying quantification (right) in live-gated CD4+ TH17s from n=3 experiments.
(D) BCL-XL expression in bulk cultures or in the cells undergoing the most vs. least mitophagy. GFP-lo and GFP-hi gates were based on the 25% lowest and highest GFP MFI populations in glycolytic and OXPHOS MitoQC TH17s, respectively. Representative flow histogram (left) illustrates GFP gating strategy and accompanied by quantification of relative BCL-XL (right) from n=3 experiments.
(E and F) MitoQC TH17s were polarized +/− MYLS22 for 4 days to inhibit OPA1-mediated mitochondrial fusion. (E) Representative flow histogram (left) and accompanying quantification (right) of mitophagy activity was based on GFP MFI in live-gated TH17s. (F) Parallel analysis of BCL-XL expression in TH17s +/− MYLS22 (n=3).
(G) MitoQC TH17s were polarized +/− MYLS22 for 4 days and then challenged with 2μM staurosporine (STA) for 4hrs to induce apoptosis. Frequency of cell death (AnnexinV+7-AAD+) was quantified by flow cytometry (n=3).
All data are mean ±SEM and data represent at least one of two independent experiments. Statistical significance was determined by (A, C) two-tailed unpaired t-test or (B, D-G) two-way ANOVA (*p<0.05; **p<0.01; ***p<0.001; ****p<0.0001).
Total mitochondrial number is regulated by the dueling processes of mitochondrial biogenesis and turnover and is further fine-tuned by mitochondrial fission and fusion. At this stage, an outstanding question was whether the regulation of mitochondrial content in glycolytic TH17s was responsible for decreased BCL-XL and thus its apoptotic sensitivity. To address this question, we first examined the expression of the master regulator of mitochondrial biogenesis PGC1α, which was found to be downregulated in glycolytic TH17s (Fig. S5C). Next, we assessed the expression of Dynamin-related Protein 1 (DRP1), which drives mitochondrial fission and subsequent turnover, and observed that glycolytic TH17s exhibited greater phosphorylated (active) DRP1 (Fig. S5D).
Following fission, damaged mitochondria are targeted for degradation by mitophagy. To delineate if differences in mitophagy activity regulated apoptotic resistance in TH17s, we utilized mitoQC mice, which express a functionally inert, tandem mCherry-GFP tag targeted to mitochondria (39). At steady-state, mitochondria fluorescence both mCherry and GFP. When mitochondria undergo mitophagy, mCherry fluorescence is retained, while GFP is quenched by the acidic environment of the lysosome prior to degradation. Naïve CD4 T cells were isolated from MitoQC mice, polarized into TH17s, and mitophagy was quantified by flow cytometry. From this analysis, we found that glycolytic TH17s underwent more mitophagy than OXPHOS TH17s at baseline (Fig. 5C), and mitophagy activity inversely correlated with mitochondrial mass and BCL-XL (Fig. 5D, S5E, S5F). Additionally, glycolytic cells that underwent the most mitophagy contained comparable levels of BCL-XL as bulk cultures (Fig. 5D; see glycolytic GFP-lo vs. bulk); whereas, glycolytic TH17s that underwent less mitophagy contained similar levels of BCL-XL as their OXPHOS counterparts (Fig. 5D; see GFP-hi). This suggested that lower expression of BCL-XL in glycolytic TH17s was driven by the removal of mitochondria, the subcellular location of BCL-XL.
In CD8 T cells, genetic deletion of Optic Atrophy-1 (OPA1), the primary mediator of mitochondrial fusion, inhibits the generation of CD8 memory (38). While we did not observe a difference in baseline expression of OPA1 between TH17 types (Fig. S5D), we nevertheless opted to examine the activity of OPA1, the inhibition of which promotes mitochondrial fission and induces mitophagy. Indeed, we observed that OXPHOS TH17s treated with the OPA1 inhibitor MYLS22 exhibited increased mitophagy, decreased mitochondrial mass, and lower BCL-XL levels, which led to sensitization to cell death (Fig. 5E–G, S5G). Strikingly, despite the similarity in expression level of OPA1 among the TH17 cultures, OPA1 inhibition in glycolytic cultures had a limited impact on mitochondrial mass and mitophagy, providing a notable contrast in mitochondrial programs and properties between glycolytic and OXPHOS TH17s. In all, these data revealed that glycolytic TH17s undergo more basal mitophagy, leading to less BCL-XL; whereas, OXPHOS TH17s required mitochondrial fusion for increased mitochondrial mass and BCL-XL.
OXPHOS promotes TH17 persistence in vivo
In the periphery, T cell numbers remain relatively constant in the absence of infection (40, 41). T cell survival is mediated by sustained expression of anti-apoptotic proteins and survival signals. Apoptosis executes the deletion of T cells that fail to compete for limited resources, by way of maintaining immune homeostasis. To examine whether the use of glycolysis vs. OXPHOS in TH17s conferred differential cell survival and persistence in vivo, we performed competitive co-transfer experiments. First, congenically distinct glycolytic and OXPHOS TH17s were generated in culture, mixed in equal proportion (1:1), and adoptively transferred into lymphopenic mice. Recovery of transferred cells 28 days post-transfer revealed that a greater frequency of cells derived from the OXPHOS fraction persisted in the blood, peripheral lymph nodes (pLN), spleen, and lamina propria (LP) (Fig. 6A). Importantly, viability analysis measured by flow cytometry indicated that the cells that had originated from the glycolytic fraction underwent more cell death (Fig. 6B). Together, these data indicated that OXPHOS polarization imparts greater persistence of TH17s in vivo.
Figure 6: OXPHOS promotes TH17 survival and persistence in vivo.
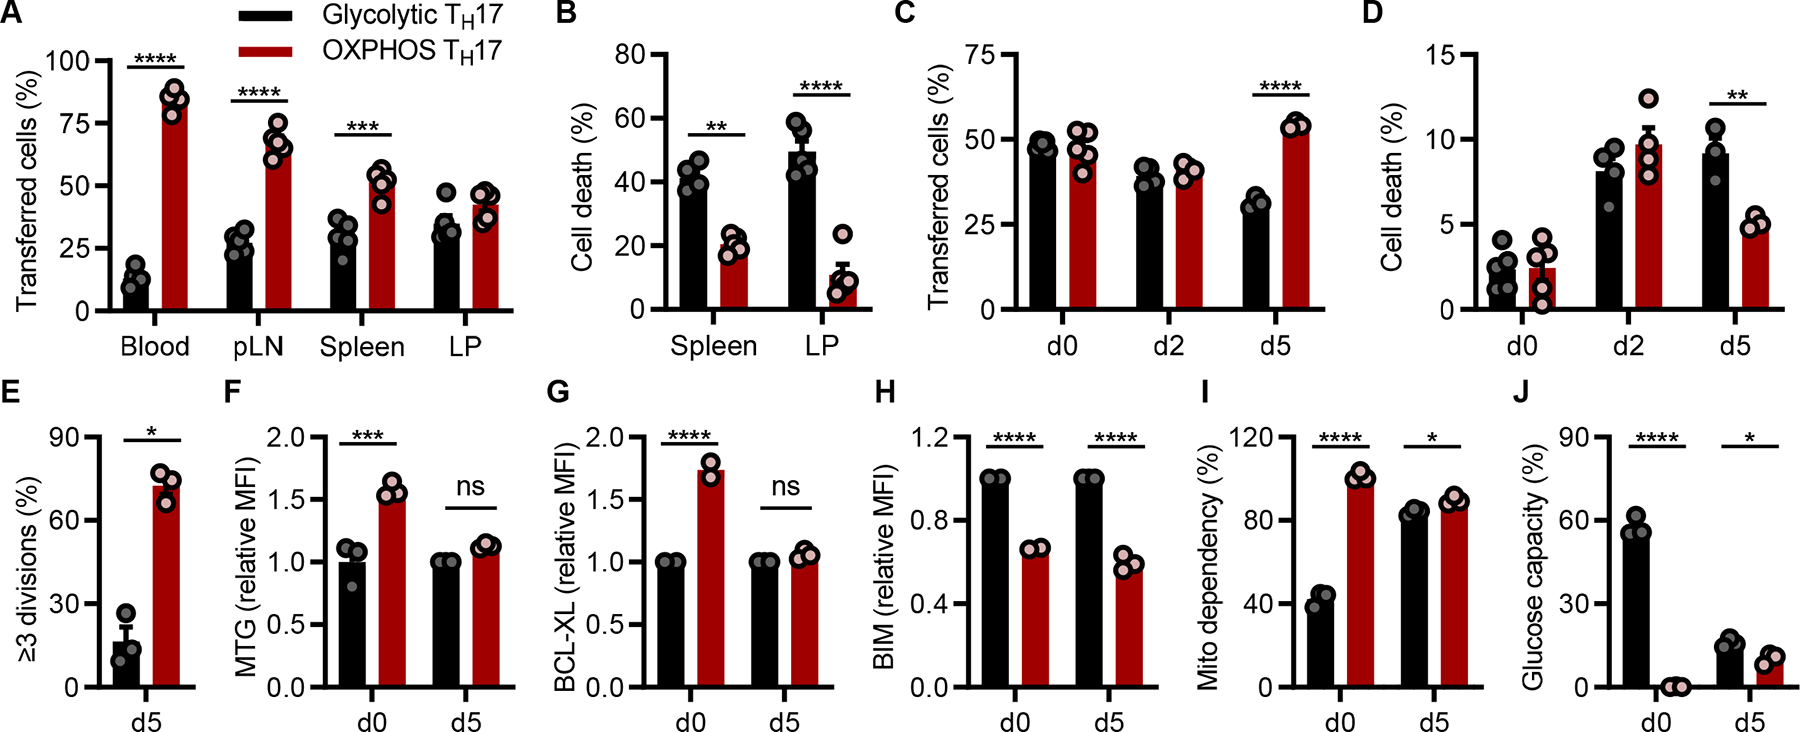
(A and B) TH17s cultured under glycolytic (CD45.2+) or OXPHOS (CD45.1+) conditions were equally mixed, and transferred into lymphodeplete recipient mice. After 28 days, transferred cells were recovered from the indicated tissues and the frequency of CD45.2+ vs. CD45.1+ cells A) in live-gated CD4+ TCRβ+ cells or B) cell death in CD4+ TCRβ+ cells was measured by flow cytometry (n=5 mice).
(C-E) Glycolytic (CD45.2+) or OXPHOS (CD45.1+) TH17s were CTV labeled, equally mixed, then transferred into C57Bl/6 recipient mice. The frequency of transferred cells in (C) live-gated or (D) dying CD45.2+ vs. CD45.1+ CTV+-gated cells was quantified by flow cytometry. (E) Proliferation was based on CTV dye dilution staining and assessed in CD45.2+ vs. CD45.1+ CTV+-gated cells (n=3–4 mice).
(F-J) CTV-stained glycolytic (CD45.2+) or OXPHOS (CD45.1+) TH17s were equally mixed and transferred into C57Bl/6 mice. (F) MitoTracker Green (MTG), (G) BCL-XL, (H) BIM, or (I, J) metabolic phenotype using SCENITH were assessed in CTV+ vs. CD45.1+ live-gated cells (n=3 mice).
All data are mean ±SEM. Data represent one of two independent experiments. Statistical analysis was determined by two-way ANOVA (*p<0.05; **p<0.01; ***p<0.001; ****p<0.0001).
Next, to distinguish the relative contribution of cell death and homeostatic proliferation from the persistence of transferred cells, congenically distinct glycolytic and OXPHOS TH17s were generated, stained with CTV, mixed in 1:1 proportion, and adoptively transferred into lymphoreplete mice. Between day 2 and 5 post co-transfer, we observed an enhanced contraction of cells that were polarized under glycolytic conditions (Fig. 6C). By day 5 post co-transfer, cells that originated from OXPHOS conditions exhibited better survival, less cell death, and more proliferation than cells that were polarized under glycolytic conditions (Fig. 6C–E). Together, these data suggested that TH17s polarized under OXPHOS conditions persisted better than their glycolytic counterparts due to their capacity to proliferate and resist cell death.
To examine how distinct metabolic and mitochondrial programs established by the use of glycolysis and OXPHOS affected TH17 persistence in vivo, we performed co-transfer experiments, as in (Fig. 6C), and characterized cells that escaped the contraction phase. Despite prominent differences in metabolism, mitochondrial content, and BCL-XL expression between glycolytic and OXPHOS TH17s at the time of co-transfer, recovered cells now had comparable levels of mitochondrial content and BCL-XL, although BIM levels remained low in the OXPHOS fraction (Fig. 6F–H). In addition, they appeared similar in metabolic phenotype; i.e., heightened dependency on mitochondrial metabolism and low glycolytic capacity (Fig. 6I, 6J). Together, these in vivo data illustrated that OXPHOS TH17s maintained their metabolic and survival phenotype in vivo. In contrast, glycolytic TH17s exhibited a metabolic disadvantage. In order to survive, they adapted or were selected to be more dependent on mitochondrial metabolism, the preferred in vivo metabolic phenotype.
Adoptive transfer of OXPHOS TH17s promotes anti-tumor immunity
In preclinical studies of adoptive T cell transfer-based immunotherapy (ACT), transfer of tumor-specific TH17s enhances anti-tumor immunity due, in part, to their ability to persist long-term (3, 4, 6, 7). To examine whether OXPHOS activity during TH17 polarization facilitated anti-tumor immunity by supporting persistence in vivo, we adoptively transferred tumor-specific glycolytic or OXPHOS TH17s into tumor-bearing mice. In brief, we subcutaneously injected congenically distinct mice with Yumm5.2 melanoma cells that stably expressed the ovalbumin antigen (OVA). We employed OT-II T cell receptor transgenic mice as the source of naïve CD4 T cells to generate OVA-specific, glycolytic and OXPHOS TH17s. 5 days following tumor injection, glycolytic and OXPHOS OT-II TH17s were individually transferred into tumor-bearing mice. Tumors in mice that received OXPHOS TH17 cultures grew slower than those that received glycolytic TH17 cultures (Fig. 7A), and differences in tumor growth correlated with the abundance of transferred cells in the tumor draining lymph node (TDLN) and tumor (Fig. 7B, S6A). Analysis of the tumor microenvironment identified that, at endpoint, the transferred cells were similar in their identity, functionality, metabolism, and BCL-XL levels (Fig. 7C, S6B–D). Like our in vivo competition studies, BIM remained modestly downregulated in cells that originated from OXPHOS cultures. Notably, transfer of OXPHOS TH17s led to more IFNγ-expressing CD8 T cells and less immunosuppressive Tregs (Fig. 7D). This indicated that transferring cells with a greater capacity to persist modulated the composition and effector function of tumor infiltrating T cells. In all, these data illustrated that the metabolic phenotype of TH17s regulated their persistence in vivo, which helped to sustain the anti-tumor immune response.
Fig 7: TH17 persistence promotes anti-tumor immunity in vivo.

(A) Tumor growth following adoptive transfer of glycolytic or OXPHOS CD45.2+ OT-II TH17s into CD45.1+ mice bearing yumm5.2-OVA subcutaneous tumors (PBS control n=10 mice; Glycolytic TH17s n=9 mice; OXPHOS TH17s n=8 mice). Data represent one of two independent experiments
(B and C) Analysis of transferred cells recovered from tumor draining lymph nodes (TDLN) or tumors at endpoint. (B) Quantification of transferred cells was based on the frequency of CD90+CD45.1−CD45.2+ cells and further (C) characterized based on the expression of Foxp3 or IFNγ.
(D) Parallel analysis of host (CD45.1+) T cells recovered from the TDLN or tumor at endpoint. Representative flow plots (left) and accompanying quantification of IFNγ+ or Foxp3+ expression in CD90+CD45.2−CD45.1+ host T cells (right).
All data are mean ±SEM. Statistical analysis was determined by (A-D) two-way ANOVA (*p<0.05; **p<0.01; ***p<0.001; ****p<0.0001).
Discussion
Naturally arising TH17s require OXPHOS (16–18), a metabolic dependency that is not readily observed in vitro and, thus, has limited our understanding of TH17 metabolism. In the present study, we identified that OXPHOS activity in TH17s induces an anti-apoptotic program, resulting in greater persistence and enhanced anti-tumor immunity. Integral to TH17 survival was mitochondrial activity and dynamics. Degradation of mitochondria via mitophagy deceased the expression of BCL-XL, the critical anti-apoptotic regulator in TH17s, and sensitized cells to apoptosis. We propose that TH17s that adapt an oxidative phenotype exhibit limited mitophagy to regulate the expression of anti-apoptotic regulators that localize to the mitochondria.
Herein, we first found that OXPHOS culture was far superior to standard glycolytic conditions for generating in vitro TH17s with in vivo metabolic profiles. Seahorse analysis, metabolomics, and single-cell analysis using the flow cytometry-based platform SCENITH revealed that our in vitro OXPHOS culture system produced cells with limited glycolytic capacity. Thus, they were largely reliant on OXPHOS, mirroring the metabolic profile of in vivo cells. Under this backdrop, we found that OXPHOS could support TH17 differentiation and effector function to a similar degree as cells that predominately use glycolysis. These results are in agreement with studies demonstrating that in vivo TH17s rely on OXPHOS for effector cytokine production and barrier protection (16–19). It is important to note that our findings do not negate the use of glycolysis in TH17s. Instead, they highlight the need to consider the metabolic phenotype that is physiologically relevant. At present, a physiological setting in which TH17s predominately use glycolysis instead of OXPHOS has not been observed in vivo.
Second, we demonstrated that OXPHOS activity in TH17s promoted apoptotic resistance. Chemical and genetic manipulation of BCL-2 family proteins confirmed that glycolysis and OXPHOS establish distinct apoptotic thresholds that differentially sensitize to cell death. Indeed, prior work has shown that sensitivity to apoptosis is linked to glycolytic activity in T cells and influenced by the availability of survival signals (42, 43). Using MitoQC mice to quantify active mitophagy, we showed that a feature intrinsic to glycolytic activity is increased mitophagy, which removed more mitochondria containing BCL-XL. By contrast, OXPHOS TH17s underwent less mitophagy, allowing for the amassing of more mitochondria and thus elevated levels of BCL-XL.
Third, we found that OXPHOS culture provides TH17s with greater persistence potential in vivo. Through adoptive transfer experiments, we showed that OXPHOS TH17s with more mitochondria, higher BCL-XL, and lower BIM exhibited better persistence in vivo, relative to their glycolytic counterparts. This is in agreement with prior observations that T cells from BIM−/− mice or mice that constitutively express BCL-XL have defects in cell death that lead to an accumulation in cell number and autoimmunity (44–46). Furthermore, we showed that OXPHOS TH17s exhibited the desired features of CD8 T cells that improve anti-tumor activity, namely low oxidative stress, high proliferative potential, and enhanced persistence (47). This knowledge will be of interest for ACT immunotherapy. The efficacy of which is dependent on the cytotoxic function and persistence of infused T cells, qualities established during in vitro expansion and determined by their cellular and metabolic state prior to transfer (48–53).
Additionally, analysis of TH17s post-transfer revealed three important findings. (i) Cells that survived the contraction phase exhibited similar metabolic profiles and BCL-XL levels, while BIM remained downregulated in the enriched fraction. This observation suggests that only those cells that are metabolically primed (i.e., in vitro OXPHOS culture) or that can metabolically adapt to conditions that require higher levels of BCL-XL to BIM, are ultimately able to survive. (ii) BIM levels were set during TH17 activation and suppressed by OXPHOS activity. T cell fate/identity can be imprinted during TH17 activation and modulated by metabolic activity and cytokine signaling (11). Further work is warranted to understand how OXPHOS activity decreases the expression of BIM and how its levels are retained during in vivo expansion and restimulation. (iii) The frequency of transferred TH17s in the tumor microenvironment correlated with the recruitment of more cytotoxic CD8 T cells and less Tregs. We found that the identity/functionality of transferred cells were comparable, supporting the notion that the frequency of persisting cells indirectly altered tumor kinetics. Although, how TH17s in the tumor and TDLN influence the innate immune response remains an unexplored question.
Lastly, our study highlights the need to study TH17s in their native metabolic state. Recent technological advances have set the stage for in vivo and ex vivo metabolic profiling in immune cells (20). For instance, SCENITH has increased the feasibility and depth of immunometabolism studies by employing a flow cytometry-based readout, enabling analysis of sparce immune cell populations (54). In vivo isotope tracing metabolomics is an area of active development that will enhance our understanding of immunometabolism in situ (55, 56). However, there remains considerable challenges to studying metabolism in CD4 T cell subsets in vivo, as they lack unique surface receptors that would otherwise enable their rapid isolation necessary for metabolic studies. In addition, naturally arising TH17s are cellularly heterogenous (1). The phenotypes of which are dependent on tissue context, activating stimuli, and disease state. While our culture system did not generate glycolytic and OXPHOS TH17s with drastic differences in cellular properties, this was not surprising as they were activated identically and in isolation, using media that lacked tissue-specific factors. Instead, we highlight the adaptability and robustness of our culture system, which could serve as a platform to examine the interplay between tissue-specific factors and TH17 metabolism. In all, we provide evidence that a physiological role of OXPHOS in TH17s is to control the apoptotic threshold in favor of cellular persistence in vivo, which may be leveraged in the setting of ACT or TH17 pathology.
Materials and Methods
Study design
This study investigates the role of OXPHOS activity in TH17s. We utilized a culture method that robustly induces the use of OXPHOS in TH17s, relative to standard culture practices that generate glycolytic TH17s. Metabolomics, seahorse, and SCENITH analysis revealed that OXPHOS culture facilitates the generation of in vitro TH17s that metabolically resemble their in vivo counterpart. With this, we examined the physiological role of OXPHOS in TH17 biology using genetic and pharmacological approaches. For each experiment, “n” values, representing the number of experimental replicates, are detailed in the corresponding figure legend.
Mice
All animal studies were performed in accordance with the Institutional Animal Care and Use Committee at the University of Michigan. All mice were on a C57BL/6 background, used at age 6–8 weeks, and maintained under specific pathogen-free housing. Wild type C57BL/6, B6.SJL (CD45.1), B6.Cg-Tg(TcraTcrb)425Cbn/J (OT-II), IL-17-GFP and RAG2−/− mice were obtained from the Jackson Laboratories. MitoQC mice were generated by Dr. Ian G. Ganley (University of Dundee) and obtained under MTA.
In vitro T cell culture
Naïve CD4 T cells were isolated from mouse spleens and lymph nodes by magnetic bead separation (Miltenyi Biotec) following the manufacturers’ protocols. Cells were cultured in glucose-free RPMI (Gibco) supplemented with 10% heat-inactivated FBS (Corning), 1% penicillin/streptomycin (Gibco), 50μM 2-Mercaptoethanol (Gibco), and either 10mM glucose (Sigma) or 10mM galactose (Sigma). Naïve CD4 T cells were activated with plate-bound anti-CD3e (5μg/ml) and soluble anti-CD28 (2μg/ml) in the presence of mIL-1β (10 ng/ml; R&D Systems), mIL-23 (10ng/ml; R&D Systems), mIL-6 (50ng/ml; R&D Systems), and hTGF-β (5ng/ml; Peprotech) for TH17 cell polarization; mIL-12 (10ng/ml; R&D Systems) for TH1 cell polarization, or TGF-β (10ng/ml; Peprotech) and mIL-2 (10ng/ml; R&D Systems) for Treg polarization. All cells were cultured at 37°C and 5% CO2. TH17 differentiation was verified on day 3 or 4, and cytokine expression on day 5, at which point cells were used for subsequent assays.
In vivo mouse experiments
For all transfer experiments, donor and recipient female mice were used at ages 6–8 weeks. For persistence studies, CD45.2+ glycolytic and CD45.1+ OXPHOS TH17s were PBS washed, mixed in equal proportions, and a total of 106 TH17s were transferred into RAG2−/− mice through tail vein injection. For competition studies, CD45.2+ glycolytic and CD45.1+ OXPHOS TH17s were stained with Cell Trace Violet, washed with PBS, mixed in equal proportions, and then a total of 4×10⁶ TH17s were transferred into C57BL/6 mice via tail vein injection. For tumor studies, CD45.1 mice were s.c. injected with 75,000 Yumm5.2-OVA melanoma cells prepared in a 1:1 mixture of growth factor reduced matrigel (Corning) and PBS. 107 OT-II (CD45.2+) glycolytic or OXPHOS TH17s were transferred via tail vein injection. Tumors were measured every 3 days using digital calipers and tumor volumes were calculated based on the formula (length × width × width)/2.
Flow cytometry
For live cell staining, TH17s (1 × 10⁶ cells/ml) were washed and incubated with MitoTracker Green, MitoSox Red, or H2DCFDA in serum-free media for 20 minutes at 37°C, followed by antibody surface staining in fluorescence-activated cell sorting (FACS) buffer (PBS +2% HI FBS and 2mM EDTA). For apoptosis detection, TH17s (1 × 10⁶ cells/mL) were plated in triplicate into a 96-well plate and treated with a cell death stimulus for 6–24 hours. Cells were washed and resuspended in 1X Annexin Binding Buffer. Annexin V was added and allowed to incubate for 20 minutes at room temperature in the dark. Cells were washed, resuspended in 7-AAD staining solution, and immediately analyzed.
For intracellular staining, cells were surface stained, fixed and permeabilized using Foxp3/Transcription Factor Fixation/Permeabilization Concentrate and Diluent, and then intracellularly stained. For cytokine staining, cells were stimulated with PMA (10ng/mL) and ionomycin (0.5μg/mL;) in the presence of brefeldin A (1:1,000) and monensin (1:1,000) for 4 hours prior to intracellular staining.
For co-transfer experiments, peripheral (axillary, brachial, inguinal) lymph nodes and spleens were homogenized and passed through a 40μm cell strainer to create single cell suspensions. Splenocytes and blood samples were incubated in red blood cell lysis buffer for 5 minutes at room temperature, washed in PBS, and resuspended in FACS buffer prior to staining. For isolation of lamina propria lymphocytes, harvested colons were cut longitudinally, washed in PBS, dissected into small pieces, washed in HBSS media supplemented with 2.5% HI FBS and 1% penicillin/streptomycin, and then incubated in the presence of 1mM DTT for 15 minutes at 37°C with 200rpm shaking to remove mucus. Then intestinal pieces were incubated in supplemented HBSS media containing 1mM EDTA for 30 minutes at 37°C with 200rpm shaking, washed, and 1mM EDTA incubation repeated, followed by further digestion with 1mM collagenase type III (Sigma) and DNase for 2 hours. Digested tissues were washed, filtered, resuspended in 40% Percoll, layered onto 75% Percoll, and centrifuged for 20 minutes at 2,000rpm. Lamina propria lymphocytes in the interphase were collected and washed prior to flow staining.
For tumor in vivo experiments, single cell suspensions were prepared from mouse tumor tissue and tumor draining lymph node (TDLN). Tumor infiltrating lymphocytes were enriched by density gradient centrifugation prior to intracellular cytokine staining, as detailed above.
The following antibodies were from BD Biosciences, eBioscience, or Biolegend: anti-mouse CD90 (clone 53-2.1), anti-mouse CD45.1 (clone A20), anti-mouse CD45.2 (clone 104), anti-mouse TCRβ (clone H57-597), anti-mouse CD4 (clone GK1.5 and RM4-5), anti-mouse CD8 (clone 53-6.7), anti-mouse RORγt (clone AFKJS-9), anti-mouse Foxp3 (clone FJK-16s), anti-mouse Tbet (clone 4B10), anti-mouse IL-17A (clone TC11-18H10), anti-mouse IFN-γ (clone XMG1.2), anti-Bcl-2 (clone BCL/10C4), and goat anti-Rabbit IgG (H+L) Highly Cross-Absorbed Secondary Antibody (2μg/mL). Annexin V, 7-AAD, Live/dead fixable viability dye, H2DCFDA (1μM), MitoSOX Red Mitochondrial Superoxide Indicator (5μM), MitoTracker Green FM (20nM), and CellTrace Violet Cell Proliferation (5μM) were purchased from ThermoFisher Scientific. Anti-Bcl-xL (54H6; 1:800) and anti-Bim (C34C5; 1:400) were purchased from Cell Signaling Technology. Flow samples were acquired using a Fortessa analyzer (BD Biosciences), MoFlow Cell Sorter (Beckman Coulter), or ZE5 Cell Analyzer (Bio-Rad). Data were analyzed with DIVA software (BD Biosciences) or FlowJo software (TreeStar).
Seahorse
Seahorse assays were performed using a XF-96 Extracellular Flux Analyzer (Agilent). The day before the assay, sensor cartridges were incubated in dH2O overnight then hydrated in XF calibrant (Agilent) for 1 hour in a non-CO2 incubator at 37°C on the day of the assay. Cartridges were loaded with oligomycin (1–2μM), FCCP (1μM), and rotenone/antimycin A (1μM) for the mitostress test; or rotenone/antimycin A (1μM), and 2-DG (50mM) for the glycolytic rate assay. Differentiated TH17s were washed and resuspended in Seahorse XF RPMI media (Agilent;103576) supplemented with XF Glutamine (Agilent;103579) and either 10mM glucose or 10mM galactose. For glutamine dropout experiments, TH17s were resuspended in glucose or galactose XF RPMI that lacked glutamine for acute starvation prior to the assay. For in vivo vs. in vitro experiments, in vivo cells were generated as previously described (18). On the day of the assay, lymph nodes were collected, pooled, and subjected to magnetic bead isolation to enrich for CD4 T cells. In vivo-generated cells were then purified by flow sorting. In parallel, glycolytic and OXPHOS TH17s were generated in vitro and processed in parallel with their in vivo counterparts. Following purification, cells were rested in complete media (in vivo and in vitro glycolytic TH17s: 10mM glucose RPMI; in vitro OXPHOS TH17s: 10mM galactose RPMI), and then washed and resuspended in their respective XF RPMI media. 2–3×10⁵ cells per well were seeded on poly-L-lysine-coated plates and allowed to equilibrate for 30 minutes in a non-CO2 incubator at 37°C. After the assay, measurements were normalized based on cell seeding density using CyQuant (Invitrogen). For the mitostress test, the metabolic phenotype was determined based on basal OCR and ECAR measurements (i.e., prior to inhibitor treatment). SRC was determined by subtracting basal OCR from maximal OCR measurements. For the glycolytic rate assay, PER measurements were calculated by the GRA Report Generator using Wave 2.3 software.
SCENITH
SCENITH was performed as described in (29). SCENITH reagents kit (inhibitors, puromycin, and antibodies) were obtained from www.scenith.com/try-it and used according to the provided protocol for T cells. In brief, in vitro TH17s were resuspended in RPMI containing 10% HI FBS and either 10mM glucose or 10mM galactose and plated in a 96-well plate at 1×10⁶ cells/mL in triplicate. Cells were pretreated with 2-DG (50mM), oligomycin (1μM), or in combination for 15 minutes, followed by treatment with puromycin (10μg/mL) for 30 minutes at 37°C. After drug treatments, samples were surface stained and intracellularly stained with anti-puromycin (1:500; clone R4743L-E8). For ex vivo analysis, lymph nodes were harvested, homogenized to generate single-cell suspensions and equally split into flow tubes containing prewarmed media (10mM glucose RPMI+10% HI FBS), metabolic inhibitors, and puromycin. Samples were incubated at 37°C for 45 minutes, followed by flow staining as described above. For analysis of tumor infiltrating T cells, harvested tumors were homogenized, passed through a 70μm strainer, and tumor infiltrating T cells were enriched by density gradient centrifugation. Enriched fractions from 1–2 tumors were pooled and treated as described above.
Metabolomics
Metabolites were extracted from TH17s by adding cold 80% methanol, incubating at −80°C for 10 minutes, followed by centrifugation at 10,000g for 10 minutes at 4°C. The resulting metabolite supernatants were collected. Metabolite extracts were normalized to protein concentration determined using a parallel replicate, and the normalized fraction was transferred to a fresh 1.5mL tube and lyophilized by speedvac. Dried metabolite pellets were resuspended in a 50:50 mixture of MeOH and water. Liquid chromatography-based targeted tandem mass spectrometry (LC-MS/MS)-based metabolomics were performed and the data analyzed as previously described (57–59).
For isotope tracing metabolomics of in vitro cells, TH17s (106 cells/ml) were reseeded in glutamine-free RPMI supplemented with 2mM unlabeled glutamine or [U]13C-glutamine (Cambridge) and allowed to incubate for the indicated amount of time prior to metabolite extraction. Alternatively, glycolytic TH17s were reseeded in glucose-free RPMI supplemented with 10mM unlabeled glucose or [U]13C-glucose (Cambridge). In parallel, OXPHOS TH17s were reseeded in glucose-free RPMI supplemented with 10mM unlabeled galactose or [U]13C-galactose (Cambridge). For [U]13C-glutamine tracing of TH17 cells generated in vivo vs in vitro, TH17s were activated and purified as previously described (18), and cultured for 3 hours in RPMI containing either unlabeled glutamine or [U]13C-glutamine. Metabolite extracts were normalized to cell number.
Immunoblotting
Cells were lysed in cell lysis buffer supplemented with protease and phosphatase inhibitors, and protein concentrations were determined with BCA Protein Assay (Pierce). Proteins were separated by SDS-PAGE followed by immunoblotting with the following Cell Signaling antibodies: anti-Bcl-2 (3498), anti-Bcl-xL (2764), anti-Mcl-1 (5453), anti-Bim (2933), anti-Bid (2003), anti-Bak (12105), anti-caspase 3 (9662), anti-cleaved caspase 3 (9664), anti-PARP (9542), anti-p-DRP1 (3455), anti-DRP1 (8570), anti-OPA1 (80471), anti-vinculin (13901), anti-tubulin (2144), and HRP-conjugated anti-Rabbit IgG (7074). PCG1α (ab54481) was from Abcam.
Viral plasmids, transfection, and transduction
pMIG (empty vector control; 9044), pMIG Bcl-XL (8790), and pMIG Bim (8786) retroviral constructs were purchased from Addgene. Retroviruses were produced by the Vector Core at the University of Michigan. Naïve CD4 T cells were activated under glycolytic or OXPHOS conditions and in the presence of TH17 polarizing cytokines for 48 hours. Retroviral supernatants were loaded by centrifugation (2,000×g for 2 hours at 30°C) onto non-tissue culture treated 6-well plates pre-coated with RetroNectin (20μg/mL; Takara). Activated T cells were added and spin-transduced for 30 minutes at 1,000×g, 30°C. Cells were expanded and transduced GFP+ cells were gated and used for analysis.
Parental Yumm5.2 melanoma cells were obtained from ATCC and transduced with lentivirus containing pLVX-puro-OVA. Lentivirus was produced by transfecting 293FT cells and viral supernatant was collected and passed through a 0.45um filter. Following transduction, stable cell lines were established post-puromycin selection. Cell lines were cultured in DMEM F-12 media (Gibco), supplemented with 10% FBS (Corning), HEPES (Gibco), and 1% NEAA (Gibco), and regularly tested for mycoplasma contamination using MycoAlert (Lonza). pLVX-puro-OVA (Addgene; 135073) was a generous gift from Dr. Maria Castro.
RNAseq
Total RNA was extracted from Glycolytic and OXPHOS TH17s using RNeasy Plus Micro Kit (Qiagen). Strand-specific, polyA selected libraries were prepared and paired-end, 100-base reads were sequenced using NovaSeq-6000 (Illumina).
Statistical analysis
Statistical analyses were performed using GraphPad Prism software and statistical significance was determined using the following analyses: paired t-tests (to compare two matched experimental groups from pooled independent experiments), unpaired t-test (to compare two experiment groups performed in technical triplicates), or one-way/two-way ANOVA (to compare among three groups or more) using Turkey’s/Šídák’s multiple comparisons test. P-value>0.05 was considered not significant. Explanation of significant values and number of experimental replicates are presented within the legends. All data are shown as means ±SEM. For flow cytometry analysis, median fluorescent intensity was determined by FlowJo software and used for analyses.
Supplementary Material
Acknowledgements:
The authors would like to thank Dr. Kathryn V. Tormos at Agilent for helpful resources and experimental support. SCENITH FACS kits are available from Dr. Rafael J. Argüello under a material transfer agreement with the Institut national de la sante et de la recherche medicale. MitoQC mice are available from Dr. Ian Ganley under a material transfer agreement with the University of Dundee.
Funding
HSH was supported by 2T32AI007413 and T32DK094775. CAL was supported the NCI (R37CA237421) and UMCCC Core Grant (P30CA046592). LOC was supported by T32CA140044 and T32AI007413; YLL by NIH grant DE026728. Metabolomics studies performed at the University of Michigan were supported by NIH grant DK097153, the Charles Woodson Research Fund, and the UM Pediatric Brain Tumor Initiative.
Footnotes
Competing Interests
C.A.L. has received consulting fees from Astellas Pharmaceuticals, Odyssey Therapeutics, and T-Knife Therapeutics, and is an inventor on patents pertaining to Kras regulated metabolic pathways, redox control pathways in pancreatic cancer, and targeting the GOT1-pathway as a therapeutic approach (US Patent No: 2015126580-A1, 05/07/2015; US Patent No: 20190136238, 05/09/2019; International Patent No: WO2013177426-A2, 04/23/2015).
A.W.O. and L.F. have ownership interests in First Wave BioPharma and are currently affiliated with Odyssey Therapeutics. N.K. is a member of the WPI Immunology Frontier Research Center at Osaka University, Suita, Japan. All other authors declare no competing interests.
Data and materials availability
RNA-seq data have been deposited at GEO under the accession number GSE185478. All data needed to evaluate the conclusions in this paper are present in the paper or the supplementary methods.
References and notes
- 1.Schnell A, Huang L, Singer M, Singaraju A, Barilla RM, Regan BML, Bollhagen A, Thakore PI, Dionne D, Delorey TM, Pawlak M, Meyer Zu Horste G, Rozenblatt-Rosen O, Irizarry RA, Regev A, Kuchroo VK, Stem-like intestinal Th17 cells give rise to pathogenic effector T cells during autoimmunity. Cell 184, 6281–6298 e6223 (2021). [DOI] [PMC free article] [PubMed] [Google Scholar]
- 2.Amezcua Vesely MC, Pallis P, Bielecki P, Low JS, Zhao J, Harman CCD, Kroehling L, Jackson R, Bailis W, Licona-Limon P, Xu H, Iijima N, Pillai PS, Kaplan DH, Weaver CT, Kluger Y, Kowalczyk MS, Iwasaki A, Pereira JP, Esplugues E, Gagliani N, Flavell RA, Effector TH17 Cells Give Rise to Long-Lived TRM Cells that Are Essential for an Immediate Response against Bacterial Infection. Cell 178, 1176–1188 e1115 (2019). [DOI] [PMC free article] [PubMed] [Google Scholar]
- 3.Kryczek I, Zhao E, Liu Y, Wang Y, Vatan L, Szeliga W, Moyer J, Klimczak A, Lange A, Zou W, Human TH17 cells are long-lived effector memory cells. Sci Transl Med 3, 104ra100 (2011). [DOI] [PMC free article] [PubMed] [Google Scholar]
- 4.Muranski P, Borman ZA, Kerkar SP, Klebanoff CA, Ji Y, Sanchez-Perez L, Sukumar M, Reger RN, Yu Z, Kern SJ, Roychoudhuri R, Ferreyra GA, Shen W, Durum SK, Feigenbaum L, Palmer DC, Antony PA, Chan CC, Laurence A, Danner RL, Gattinoni L, Restifo NP, Th17 cells are long lived and retain a stem cell-like molecular signature. Immunity 35, 972–985 (2011). [DOI] [PMC free article] [PubMed] [Google Scholar]
- 5.Karmaus PWF, Chen X, Lim SA, Herrada AA, Nguyen TM, Xu B, Dhungana Y, Rankin S, Chen W, Rosencrance C, Yang K, Fan Y, Cheng Y, Easton J, Neale G, Vogel P, Chi H, Metabolic heterogeneity underlies reciprocal fates of TH17 cell stemness and plasticity. Nature 565, 101–105 (2019). [DOI] [PMC free article] [PubMed] [Google Scholar]
- 6.Martin-Orozco N, Muranski P, Chung Y, Yang XO, Yamazaki T, Lu S, Hwu P, Restifo NP, Overwijk WW, Dong C, T helper 17 cells promote cytotoxic T cell activation in tumor immunity. Immunity 31, 787–798 (2009). [DOI] [PMC free article] [PubMed] [Google Scholar]
- 7.Muranski P, Boni A, Antony PA, Cassard L, Irvine KR, Kaiser A, Paulos CM, Palmer DC, Touloukian CE, Ptak K, Gattinoni L, Wrzesinski C, Hinrichs CS, Kerstann KW, Feigenbaum L, Chan CC, Restifo NP, Tumor-specific Th17-polarized cells eradicate large established melanoma. Blood 112, 362–373 (2008). [DOI] [PMC free article] [PubMed] [Google Scholar]
- 8.Shi G, Ramaswamy M, Vistica BP, Cox CA, Tan C, Wawrousek EF, Siegel RM, Gery I, Unlike Th1, Th17 cells mediate sustained autoimmune inflammation and are highly resistant to restimulation-induced cell death. J Immunol 183, 7547–7556 (2009). [DOI] [PMC free article] [PubMed] [Google Scholar]
- 9.Knochelmann HM, Dwyer CJ, Smith AS, Bowers JS, Wyatt MM, Nelson MH, Rangel Rivera GO, Horton JD, Krieg C, Armeson K, Lesinski GB, Rubinstein MP, Li Z, Paulos CM, IL6 Fuels Durable Memory for Th17 Cell-Mediated Responses to Tumors. Cancer Res 80, 3920–3932 (2020). [DOI] [PMC free article] [PubMed] [Google Scholar]
- 10.Geltink RIK, Kyle RL, Pearce EL, Unraveling the Complex Interplay Between T Cell Metabolism and Function. Annu Rev Immunol 36, 461–488 (2018). [DOI] [PMC free article] [PubMed] [Google Scholar]
- 11.Roy DG, Chen J, Mamane V, Ma EH, Muhire BM, Sheldon RD, Shorstova T, Koning R, Johnson RM, Esaulova E, Williams KS, Hayes S, Steadman M, Samborska B, Swain A, Daigneault A, Chubukov V, Roddy TP, Foulkes W, Pospisilik JA, Bourgeois-Daigneault MC, Artyomov MN, Witcher M, Krawczyk CM, Larochelle C, Jones RG, Methionine Metabolism Shapes T Helper Cell Responses through Regulation of Epigenetic Reprogramming. Cell Metab 31, 250–266 e259 (2020). [DOI] [PubMed] [Google Scholar]
- 12.Johnson MO, Wolf MM, Madden MZ, Andrejeva G, Sugiura A, Contreras DC, Maseda D, Liberti MV, Paz K, Kishton RJ, Johnson ME, de Cubas AA, Wu P, Li G, Zhang Y, Newcomb DC, Wells AD, Restifo NP, Rathmell WK, Locasale JW, Davila ML, Blazar BR, Rathmell JC, Distinct Regulation of Th17 and Th1 Cell Differentiation by Glutaminase-Dependent Metabolism. Cell 175, 1780–1795 e1719 (2018). [DOI] [PMC free article] [PubMed] [Google Scholar]
- 13.Gerriets VA, Kishton RJ, Nichols AG, Macintyre AN, Inoue M, Ilkayeva O, Winter PS, Liu X, Priyadharshini B, Slawinska ME, Haeberli L, Huck C, Turka LA, Wood KC, Hale LP, Smith PA, Schneider MA, MacIver NJ, Locasale JW, Newgard CB, Shinohara ML, Rathmell JC, Metabolic programming and PDHK1 control CD4+ T cell subsets and inflammation. J Clin Invest 125, 194–207 (2015). [DOI] [PMC free article] [PubMed] [Google Scholar]
- 14.Xu T, Stewart KM, Wang X, Liu K, Xie M, Ryu JK, Li K, Ma T, Wang H, Ni L, Zhu S, Cao N, Zhu D, Zhang Y, Akassoglou K, Dong C, Driggers EM, Ding S, Metabolic control of TH17 and induced Treg cell balance by an epigenetic mechanism. Nature 548, 228–233 (2017). [DOI] [PMC free article] [PubMed] [Google Scholar]
- 15.Berod L, Friedrich C, Nandan A, Freitag J, Hagemann S, Harmrolfs K, Sandouk A, Hesse C, Castro CN, Bahre H, Tschirner SK, Gorinski N, Gohmert M, Mayer CT, Huehn J, Ponimaskin E, Abraham WR, Muller R, Lochner M, Sparwasser T, De novo fatty acid synthesis controls the fate between regulatory T and T helper 17 cells. Nat Med 20, 1327–1333 (2014). [DOI] [PubMed] [Google Scholar]
- 16.Shin B, Benavides GA, Geng J, Koralov SB, Hu H, Darley-Usmar VM, Harrington LE, Mitochondrial Oxidative Phosphorylation Regulates the Fate Decision between Pathogenic Th17 and Regulatory T Cells. Cell Rep 30, 1898–1909 e1894 (2020). [DOI] [PMC free article] [PubMed] [Google Scholar]
- 17.Kaufmann U, Kahlfuss S, Yang J, Ivanova E, Koralov SB, Feske S, Calcium Signaling Controls Pathogenic Th17 Cell-Mediated Inflammation by Regulating Mitochondrial Function. Cell Metab, (2019). [DOI] [PMC free article] [PubMed] [Google Scholar]
- 18.Franchi L, Monteleone I, Hao LY, Spahr MA, Zhao W, Liu X, Demock K, Kulkarni A, Lesch CA, Sanchez B, Carter L, Marafini I, Hu X, Mashadova O, Yuan M, Asara JM, Singh H, Lyssiotis CA, Monteleone G, Opipari AW, Glick GD, Inhibiting Oxidative Phosphorylation In Vivo Restrains Th17 Effector Responses and Ameliorates Murine Colitis. J Immunol 198, 2735–2746 (2017). [DOI] [PMC free article] [PubMed] [Google Scholar]
- 19.Omenetti S, Bussi C, Metidji A, Iseppon A, Lee S, Tolaini M, Li Y, Kelly G, Chakravarty P, Shoaie S, Gutierrez MG, Stockinger B, The Intestine Harbors Functionally Distinct Homeostatic Tissue-Resident and Inflammatory Th17 Cells. Immunity 51, 77–89 e76 (2019). [DOI] [PMC free article] [PubMed] [Google Scholar]
- 20.Voss K, Hong HS, Bader JE, Sugiura A, Lyssiotis CA, Rathmell JC, A guide to interrogating immunometabolism. Nat Rev Immunol, (2021). [DOI] [PMC free article] [PubMed] [Google Scholar]
- 21.Bustamante E, Pedersen PL, High aerobic glycolysis of rat hepatoma cells in culture: role of mitochondrial hexokinase. Proc Natl Acad Sci U S A 74, 3735–3739 (1977). [DOI] [PMC free article] [PubMed] [Google Scholar]
- 22.Chang CH, Curtis JD, Maggi LB Jr., Faubert B, Villarino AV, O’Sullivan D, Huang SC, van der Windt GJ, Blagih J, Qiu J, Weber JD, Pearce EJ, Jones RG, Pearce EL, Posttranscriptional control of T cell effector function by aerobic glycolysis. Cell 153, 1239–1251 (2013). [DOI] [PMC free article] [PubMed] [Google Scholar]
- 23.Reitzer LJ, Wice BM, Kennell D, Evidence that glutamine, not sugar, is the major energy source for cultured HeLa cells. J Biol Chem 254, 2669–2676 (1979). [PubMed] [Google Scholar]
- 24.Wang T, Gnanaprakasam JNR, Chen X, Kang S, Xu X, Sun H, Liu L, Rodgers H, Miller E, Cassel TA, Sun Q, Vicente-Munoz S, Warmoes MO, Lin P, Piedra-Quintero ZL, Guerau-de-Arellano M, Cassady KA, Zheng SG, Yang J, Lane AN, Song X, Fan TW, Wang R, Inosine is an alternative carbon source for CD8(+)-T-cell function under glucose restriction. Nat Metab 2, 635–647 (2020). [DOI] [PMC free article] [PubMed] [Google Scholar]
- 25.Klein Geltink RI, Edwards-Hicks J, Apostolova P, O’Sullivan D, Sanin DE, Patterson AE, Puleston DJ, Ligthart NAM, Buescher JM, Grzes KM, Kabat AM, Stanczak M, Curtis JD, Hassler F, Uhl FM, Fabri M, Zeiser R, Pearce EJ, Pearce EL, Metabolic conditioning of CD8(+) effector T cells for adoptive cell therapy. Nat Metab 2, 703–716 (2020). [DOI] [PMC free article] [PubMed] [Google Scholar]
- 26.Sukumar M, Liu J, Ji Y, Subramanian M, Crompton JG, Yu Z, Roychoudhuri R, Palmer DC, Muranski P, Karoly ED, Mohney RP, Klebanoff CA, Lal A, Finkel T, Restifo NP, Gattinoni L, Inhibiting glycolytic metabolism enhances CD8+ T cell memory and antitumor function. J Clin Invest 123, 4479–4488 (2013). [DOI] [PMC free article] [PubMed] [Google Scholar]
- 27.Shi LZ, Wang R, Huang G, Vogel P, Neale G, Green DR, Chi H, HIF1alpha-dependent glycolytic pathway orchestrates a metabolic checkpoint for the differentiation of TH17 and Treg cells. J Exp Med 208, 1367–1376 (2011). [DOI] [PMC free article] [PubMed] [Google Scholar]
- 28.van der Windt GJ, Everts B, Chang CH, Curtis JD, Freitas TC, Amiel E, Pearce EJ, Pearce EL, Mitochondrial respiratory capacity is a critical regulator of CD8+ T cell memory development. Immunity 36, 68–78 (2012). [DOI] [PMC free article] [PubMed] [Google Scholar]
- 29.Arguello RJ, Combes AJ, Char R, Gigan JP, Baaziz AI, Bousiquot E, Camosseto V, Samad B, Tsui J, Yan P, Boissonneau S, Figarella-Branger D, Gatti E, Tabouret E, Krummel MF, Pierre P, SCENITH: A Flow Cytometry-Based Method to Functionally Profile Energy Metabolism with Single-Cell Resolution. Cell Metab 32, 1063–1075 e1067 (2020). [DOI] [PMC free article] [PubMed] [Google Scholar]
- 30.Binek A, Rojo D, Godzien J, Ruperez FJ, Nunez V, Jorge I, Ricote M, Vazquez J, Barbas C, Flow Cytometry Has a Significant Impact on the Cellular Metabolome. J Proteome Res 18, 169–181 (2019). [DOI] [PubMed] [Google Scholar]
- 31.Llufrio EM, Wang L, Naser FJ, Patti GJ, Sorting cells alters their redox state and cellular metabolome. Redox Biol 16, 381–387 (2018). [DOI] [PMC free article] [PubMed] [Google Scholar]
- 32.Zaslona Z, O’Neill LAJ, Cytokine-like Roles for Metabolites in Immunity. Mol Cell 78, 814–823 (2020). [DOI] [PubMed] [Google Scholar]
- 33.Mehta MM, Weinberg SE, Chandel NS, Mitochondrial control of immunity: beyond ATP. Nat Rev Immunol 17, 608–620 (2017). [DOI] [PubMed] [Google Scholar]
- 34.Mak TW, Grusdat M, Duncan GS, Dostert C, Nonnenmacher Y, Cox M, Binsfeld C, Hao Z, Brustle A, Itsumi M, Jager C, Chen Y, Pinkenburg O, Camara B, Ollert M, Bindslev-Jensen C, Vasiliou V, Gorrini C, Lang PA, Lohoff M, Harris IS, Hiller K, Brenner D, Glutathione Primes T Cell Metabolism for Inflammation. Immunity 46, 675–689 (2017). [DOI] [PubMed] [Google Scholar]
- 35.Lian G, Gnanaprakasam JR, Wang T, Wu R, Chen X, Liu L, Shen Y, Yang M, Yang J, Chen Y, Vasiliou V, Cassel TA, Green DR, Liu Y, Fan TW, Wang R, Glutathione de novo synthesis but not recycling process coordinates with glutamine catabolism to control redox homeostasis and directs murine T cell differentiation. Elife 7, (2018). [DOI] [PMC free article] [PubMed] [Google Scholar]
- 36.Garrod KR, Moreau HD, Garcia Z, Lemaitre F, Bouvier I, Albert ML, Bousso P, Dissecting T cell contraction in vivo using a genetically encoded reporter of apoptosis. Cell Rep 2, 1438–1447 (2012). [DOI] [PubMed] [Google Scholar]
- 37.van der Windt GJ, O’Sullivan D, Everts B, Huang SC, Buck MD, Curtis JD, Chang CH, Smith AM, Ai T, Faubert B, Jones RG, Pearce EJ, Pearce EL, CD8 memory T cells have a bioenergetic advantage that underlies their rapid recall ability. Proc Natl Acad Sci U S A 110, 14336–14341 (2013). [DOI] [PMC free article] [PubMed] [Google Scholar]
- 38.Buck MD, O’Sullivan D, Klein Geltink RI, Curtis JD, Chang CH, Sanin DE, Qiu J, Kretz O, Braas D, van der Windt GJ, Chen Q, Huang SC, O’Neill CM, Edelson BT, Pearce EJ, Sesaki H, Huber TB, Rambold AS, Pearce EL, Mitochondrial Dynamics Controls T Cell Fate through Metabolic Programming. Cell 166, 63–76 (2016). [DOI] [PMC free article] [PubMed] [Google Scholar]
- 39.McWilliams TG, Prescott AR, Allen GF, Tamjar J, Munson MJ, Thomson C, Muqit MM, Ganley IG, mito-QC illuminates mitophagy and mitochondrial architecture in vivo. J Cell Biol 214, 333–345 (2016). [DOI] [PMC free article] [PubMed] [Google Scholar]
- 40.Jameson SC, Maintaining the norm: T-cell homeostasis. Nat Rev Immunol 2, 547–556 (2002). [DOI] [PubMed] [Google Scholar]
- 41.Surh CD, Sprent J, Homeostasis of naive and memory T cells. Immunity 29, 848–862 (2008). [DOI] [PubMed] [Google Scholar]
- 42.Rathmell JC, Vander Heiden MG, Harris MH, Frauwirth KA, Thompson CB, In the absence of extrinsic signals, nutrient utilization by lymphocytes is insufficient to maintain either cell size or viability. Mol Cell 6, 683–692 (2000). [DOI] [PubMed] [Google Scholar]
- 43.Larsen SE, Bilenkin A, Tarasenko TN, Arjunaraja S, Stinson JR, McGuire PJ, Snow AL, Sensitivity to Restimulation-Induced Cell Death Is Linked to Glycolytic Metabolism in Human T Cells. J Immunol 198, 147–155 (2017). [DOI] [PMC free article] [PubMed] [Google Scholar]
- 44.Bouillet P, Metcalf D, Huang DC, Tarlinton DM, Kay TW, Kontgen F, Adams JM, Strasser A, Proapoptotic Bcl-2 relative Bim required for certain apoptotic responses, leukocyte homeostasis, and to preclude autoimmunity. Science 286, 1735–1738 (1999). [DOI] [PubMed] [Google Scholar]
- 45.Grillot DA, Merino R, Nunez G, Bcl-XL displays restricted distribution during T cell development and inhibits multiple forms of apoptosis but not clonal deletion in transgenic mice. J Exp Med 182, 1973–1983 (1995). [DOI] [PMC free article] [PubMed] [Google Scholar]
- 46.Issazadeh S, Abdallah K, Chitnis T, Chandraker A, Wells AD, Turka LA, Sayegh MH, Khoury SJ, Role of passive T-cell death in chronic experimental autoimmune encephalomyelitis. J Clin Invest 105, 1109–1116 (2000). [DOI] [PMC free article] [PubMed] [Google Scholar]
- 47.Gurusamy D, Henning AN, Yamamoto TN, Yu Z, Zacharakis N, Krishna S, Kishton RJ, Vodnala SK, Eidizadeh A, Jia L, Kariya CM, Black MA, Eil R, Palmer DC, Pan JH, Sukumar M, Patel SJ, Restifo NP, Multi-phenotype CRISPR-Cas9 Screen Identifies p38 Kinase as a Target for Adoptive Immunotherapies. Cancer Cell 37, 818–833 e819 (2020). [DOI] [PMC free article] [PubMed] [Google Scholar]
- 48.Kishton RJ, Sukumar M, Restifo NP, Metabolic Regulation of T Cell Longevity and Function in Tumor Immunotherapy. Cell Metab 26, 94–109 (2017). [DOI] [PMC free article] [PubMed] [Google Scholar]
- 49.Chang CH, Pearce EL, Emerging concepts of T cell metabolism as a target of immunotherapy. Nat Immunol 17, 364–368 (2016). [DOI] [PMC free article] [PubMed] [Google Scholar]
- 50.Chan JD, Lai J, Slaney CY, Kallies A, Beavis PA, Darcy PK, Cellular networks controlling T cell persistence in adoptive cell therapy. Nat Rev Immunol, (2021). [DOI] [PubMed] [Google Scholar]
- 51.Sukumar M, Liu J, Mehta GU, Patel SJ, Roychoudhuri R, Crompton JG, Klebanoff CA, Ji Y, Li P, Yu Z, Whitehill GD, Clever D, Eil RL, Palmer DC, Mitra S, Rao M, Keyvanfar K, Schrump DS, Wang E, Marincola FM, Gattinoni L, Leonard WJ, Muranski P, Finkel T, Restifo NP, Mitochondrial Membrane Potential Identifies Cells with Enhanced Stemness for Cellular Therapy. Cell Metab 23, 63–76 (2016). [DOI] [PMC free article] [PubMed] [Google Scholar]
- 52.Horton BL, Williams JB, Cabanov A, Spranger S, Gajewski TF, Intratumoral CD8(+) T-cell Apoptosis Is a Major Component of T-cell Dysfunction and Impedes Antitumor Immunity. Cancer Immunol Res 6, 14–24 (2018). [DOI] [PMC free article] [PubMed] [Google Scholar]
- 53.Bowers JS, Nelson MH, Majchrzak K, Bailey SR, Rohrer B, Kaiser AD, Atkinson C, Gattinoni L, Paulos CM, Th17 cells are refractory to senescence and retain robust antitumor activity after long-term ex vivo expansion. JCI Insight 2, e90772 (2017). [DOI] [PMC free article] [PubMed] [Google Scholar]
- 54.Lopes N, McIntyre C, Martin S, Raverdeau M, Sumaria N, Kohlgruber AC, Fiala GJ, Agudelo LZ, Dyck L, Kane H, Douglas A, Cunningham S, Prendeville H, Loftus R, Carmody C, Pierre P, Kellis M, Brenner M, Arguello RJ, Silva-Santos B, Pennington DJ, Lynch L, Distinct metabolic programs established in the thymus control effector functions of gammadelta T cell subsets in tumor microenvironments. Nat Immunol 22, 179–192 (2021). [DOI] [PMC free article] [PubMed] [Google Scholar]
- 55.Ma EH, Verway MJ, Johnson RM, Roy DG, Steadman M, Hayes S, Williams KS, Sheldon RD, Samborska B, Kosinski PA, Kim H, Griss T, Faubert B, Condotta SA, Krawczyk CM, DeBerardinis RJ, Stewart KM, Richer MJ, Chubukov V, Roddy TP, Jones RG, Metabolic Profiling Using Stable Isotope Tracing Reveals Distinct Patterns of Glucose Utilization by Physiologically Activated CD8(+) T Cells. Immunity 51, 856–870 e855 (2019). [DOI] [PubMed] [Google Scholar]
- 56.Glick GD, Rossignol R, Lyssiotis CA, Wahl D, Lesch C, Sanchez B, Liu X, Hao LY, Taylor C, Hurd A, Ferrara JL, Tkachev V, Byersdorfer CA, Boros L, Opipari AW, Anaplerotic metabolism of alloreactive T cells provides a metabolic approach to treat graft-versus-host disease. J Pharmacol Exp Ther 351, 298–307 (2014). [DOI] [PMC free article] [PubMed] [Google Scholar]
- 57.Lee HJ, Kremer DM, Sajjakulnukit P, Zhang L, Lyssiotis CA, A large-scale analysis of targeted metabolomics data from heterogeneous biological samples provides insights into metabolite dynamics. Metabolomics 15, 103 (2019). [DOI] [PMC free article] [PubMed] [Google Scholar]
- 58.Yuan M, Kremer DM, Huang H, Breitkopf SB, Ben-Sahra I, Manning BD, Lyssiotis CA, Asara JM, Ex vivo and in vivo stable isotope labelling of central carbon metabolism and related pathways with analysis by LC-MS/MS. Nat Protoc 14, 313–330 (2019). [DOI] [PMC free article] [PubMed] [Google Scholar]
- 59.Halbrook CJ, Pontious C, Kovalenko I, Lapienyte L, Dreyer S, Lee HJ, Thurston G, Zhang Y, Lazarus J, Sajjakulnukit P, Hong HS, Kremer DM, Nelson BS, Kemp S, Zhang L, Chang D, Biankin A, Shi J, Frankel TL, Crawford HC, Morton JP, Pasca di Magliano M, Lyssiotis CA, Macrophage-Released Pyrimidines Inhibit Gemcitabine Therapy in Pancreatic Cancer. Cell Metab 29, 1390–1399 e1396 (2019). [DOI] [PMC free article] [PubMed] [Google Scholar]
Associated Data
This section collects any data citations, data availability statements, or supplementary materials included in this article.
Supplementary Materials
Data Availability Statement
RNA-seq data have been deposited at GEO under the accession number GSE185478. All data needed to evaluate the conclusions in this paper are present in the paper or the supplementary methods.