Abstract
Channelrhodopsins are used widely for optical control of neurons, in which they generate photoinduced proton, sodium or chloride influx. Potassium (K+) is central to neuron electrophysiology, yet no natural K+-selective light-gated channel has been identified. Here, we report kalium channelrhodopsins (KCRs) from Hyphochytrium catenoides. Previously known gated potassium channels are mainly ligand- or voltage-gated and share a conserved K+-selectivity filter. KCRs differ in that they are light-gated and have independently evolved an alternative K+ selectivity mechanism. The KCRs are potent, highly selective of K+ over Na+, and open in less than 1 ms following photoactivation. The permeability ratio PK/PNa of 23 makes H. catenoides KCR1 (HcKCR1) a powerful hyperpolarizing tool to suppress excitable cell firing upon illumination, demonstrated here in mouse cortical neurons. HcKCR1 enables optogenetic control of K+ gradients, which is promising for the study and potential treatment of potassium channelopathies such as epilepsy, Parkinson’s disease and long-QT syndrome and other cardiac arrhythmias.
Potassium (K+) channels are found ubiquitously in all domains of life. They are recognized easily by their highly conserved K+ channel signature sequence1,2 that encodes a K+-selectivity filter that strongly favors conductance of K+ over Na+. We report here a unique class of K+ channels, the members of which (1) lack the ‘K+ channel signature sequence’ T(S)VGY(F)G that forms a tetrameric selectivity filter in previously known K+ channels and (2) are channelrhodopsins (ChRs)—retinylidene proteins gated by light.
ChRs are light-gated ion channels first discovered in Chlamydomonas reinhardtii3-5. They are used to manipulate the membrane potential of excitable animal cells with light (optogenetics)6. Cation conductive ChRs (CCRs) are primarily proton channels, some of which also conduct metal cations5,7. Photoactivation of CCRs depolarizes the neuronal membrane and stimulates spiking8. Anion conductive ChRs (ACRs) conduct halides and nitrate9 and generate hyperpolarizing or depolarizing photocurrents depending on the electrochemical potential of Cl−. ACRs suppress neuron excitability with hyperpolarizing currents or by shunting inhibition when illuminated at the Cl− reversal potential10,11.
The dissipation of the K+ electrochemical gradient causes membrane hyperpolarization in neurons, which has stimulated efforts to engineer light-gated K+ channels. The K+/Na+ permeability ratio (PK/PNa) of C. reinhardtii ChR2 (CrChR2) is 0.3–0.5 (refs. 5,12) and could be increased no more than twice by mutation12. Alternatively, neuronal K+ channels have been modified by the addition of synthetic photoswitches or photoactive protein domains13, or controlled indirectly by coexpressing with a photosensitive adenylyl cyclase14,15. Both approaches are promising for some applications, but are limited by slow kinetics and possible cAMP-induced side effects. Here, we show that two ChRs from Hyphochytrium catenoides, which we named HcKCR1 and HcKCR2 (for Hyphochytrium catenoides kalium channelrhodopsins), are highly specific, robust light-gated K+ channels with rapid kinetics.
Results
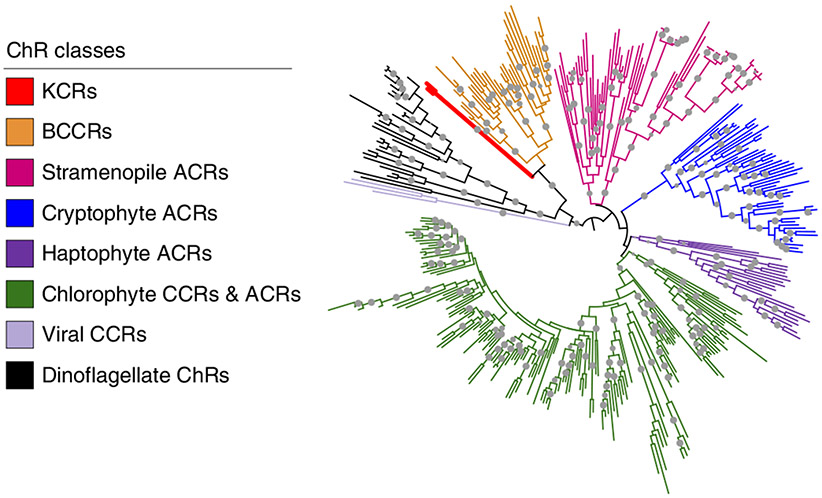
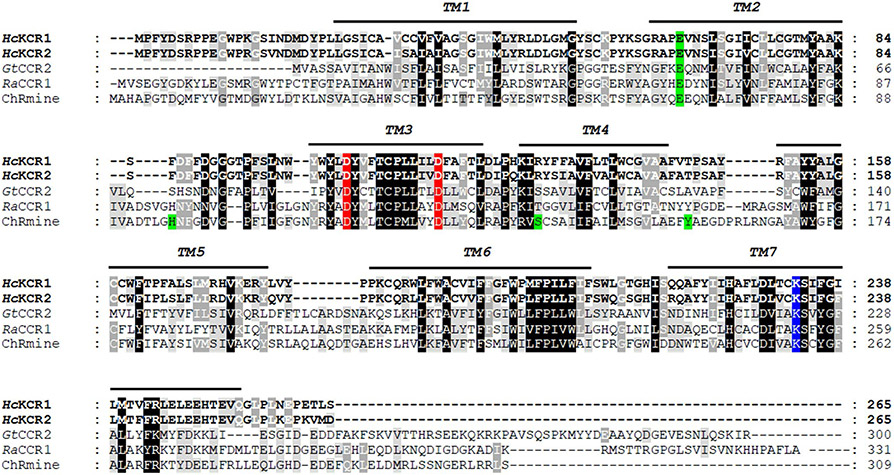
H. catenoides is a heterotrophic organism with a sequenced genome16. Two predicted H. catenoides proteins show homology to bacteriorhodopsin-like CCRs (BCCRs) from cryptophyte algae (Fig. 1). In contrast to other known ChRs, BCCRs contain two Asp residues in helix 3 (ref. 7) that are conserved in the H. catenoides homologs (Extended Data Fig. 1). Recent high-resolution structures of a BCCR known as ChRmine revealed its trimeric organization17,18, in contrast to other ChRs that form dimers. However, out of the residues implicated in trimer formation in ChRmine, only Glu68 is conserved in the H. catenoides homologs (Extended Data Fig. 1). We synthesized mammalian-codon adapted versions of the polynucleotides encoding the heptahelical transmembrane (rhodopsin) domains and expressed them in human embryonic kidney (HEK293) cells as C-terminal mCherry fusions. Both were photoactive; the action spectra of their photocurrents are shown in Fig. 2a. We assigned the number 1 to the more red-shifted paralog (spectral maximum 540 nm) and the number 2 to the blue-absorbing pigment (spectral maximum 490 nm).
Fig. 1 ∣. Phylogenetic relations of KCRs with other known ChRs.
Branches are colored to distinguish between different ChR families. Leaves corresponding to the KCRs characterized in this study are shown as thick red lines. A full list of other ChR sequences used to create the tree can be found in ref. 42. The gray circles show ultrafast bootstrap support values above 95%.
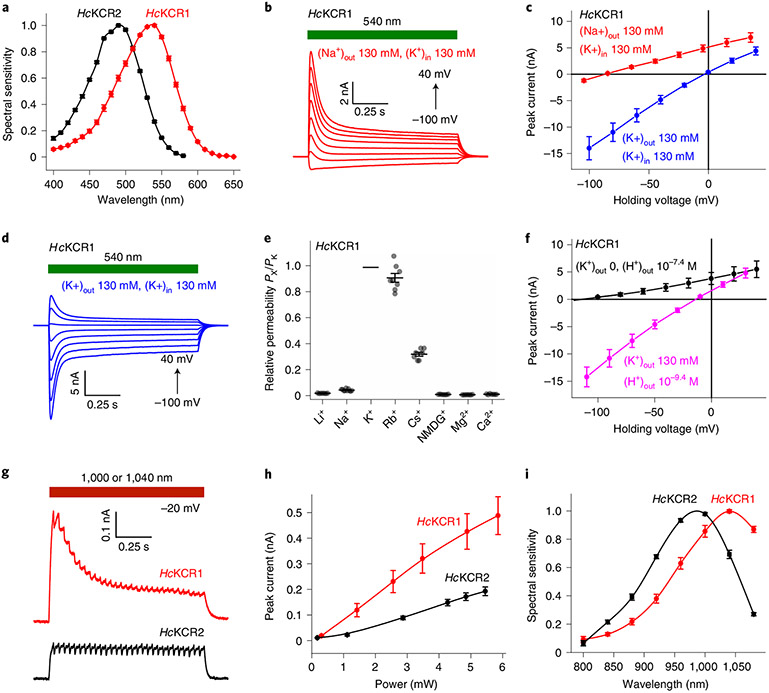
Fig. 2 ∣. KCR photocurrents evoked by continuous light and 2P excitation.
a, Action spectra of photocurrents in the visible range (mean ± s.e.m., n = 6 and n = 10 cells for HcKCR1 and HcKCR2, respectively) constructed from measurements of their initial slopes (Methods). b, Photocurrent traces recorded from HcKCR1 in response to 1-s light pulses (540 nm, 6.3 mW mm−2) upon 20-mV voltage increments in the Na+ bath. d, Photocurrent traces recorded from HcKCR1 as in b but in the K+ bath. c, IV curves (mean ± s.e.m., n = 7 cells from three independent experiments) in the Na+ (red) and K+ (blue), pH 7.4. f, IV curves (mean ± s.e.m., n = 7 cells from three independent experiments) in the NMDG+ bath, pH 7.4 (black) and K+ bath, pH 9.4 (magenta). e, Relative permeabilities (PX/PK); lines, mean ± s.e.m. (n = 7 cells from three independent experiments for Li+, Cs+, NMDG+, Mg2+ and Ca2+, n = 8 cells for Rb+ and n = 10 cells for Na+, each from four independent experiments); symbols, data from individual cells. g, Photocurrent traces recorded upon 2P excitation (HcKCR1, 1,040 nm, 3.8 mW; HcKCR2, 1,000 nm, 3.5 mW). h, Dependence of 2P photocurrents on the laser power (mean ± s.e.m., n = 7 and n = 8 cells for HcKCR1 and HcKCR2, respectively; each from three independent experiments). i, Action spectra of photocurrents under 2P excitation (mean ± s.e.m., n = 6 and n = 10 cells, each from three independent experiments, for HcKCR1 and HcKCR2, respectively). Source data are provided.
Photocurrents in response to continuous light.
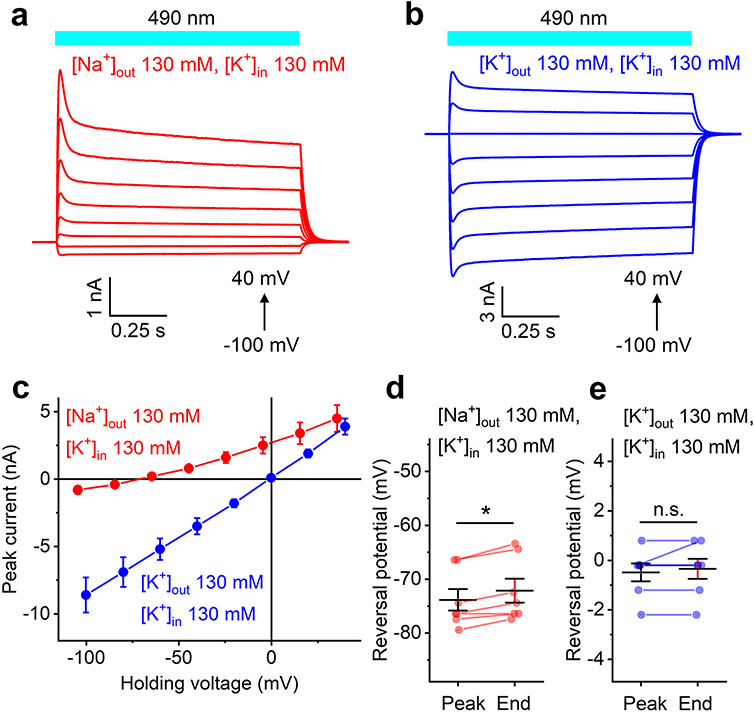
A series of photocurrents generated by HcKCR1 in response to 1-s illumination under physiological ionic conditions (Supplementary Table 1) is shown in Fig. 2b. The voltage dependence of the peak current (IV curve) showed a slight inward rectification and a reversal potential (Vrev) of −85 ± 2 mV (mean ± s.e.m., n = 10 cells) (Fig. 2c, red). Such behavior has not been observed in any previously tested ChRs and could be explained only by selectivity for K+ over Na+, as the concentration of Cl− was nearly identical on the two sides of the membrane. This conclusion was confirmed by the shift of the Vrev to −3 ± 1 mV (mean ± s.e.m., n = 7 cells) measured when Na+ in the bath was replaced with K+ (Fig. 2c,d, blue). The PK/PNa permeability ratio of HcKCR1 calculated using the modified Goldman-Hodgkin-Katz (GHK) voltage equation19 was 23, that is, 60 times greater than that of CrChR2. We obtained similar results with HcKCR2 (Extended Data Fig. 2.), except that the PK/PNa value of HcKCR2 was 17.
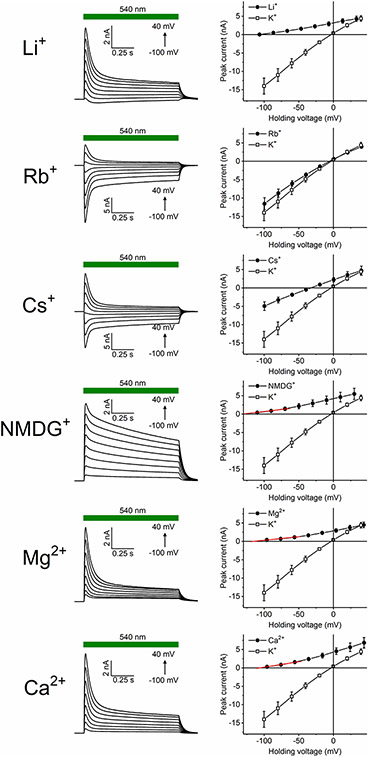
As HcKCR1 exhibited a more red-shifted spectrum, larger current amplitude and higher selectivity for K+ than HcKCR2, we chose this channel for a more detailed characterization. Using a similar procedure as described above for Na+, we determined the PX/PK ratios for other metal cations and N-methyl-d-glucamine (NMDG+). Representative series of photocurrent traces and mean IV curves are shown in Extended Data Fig. 3, and the PX/PK values, in Fig. 2e. The permeability sequence of HcKCR1 was K+ > Rb+ > Cs+ > Na+ > Li+ > NMDG+ ≅ Mg2+ ≅ Ca2+, like most voltage- and ligand-gated K+ channels20. The upper limit of the PH/PK ratio calculated from the experiment shown in Fig. 2f was around 3 × 10⁴, which is roughly 80 times lower than that of CrChR2 (refs. 5,12).
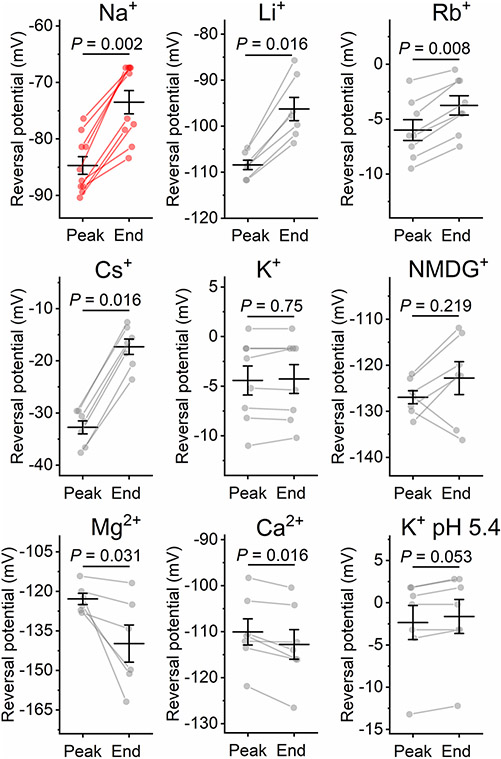
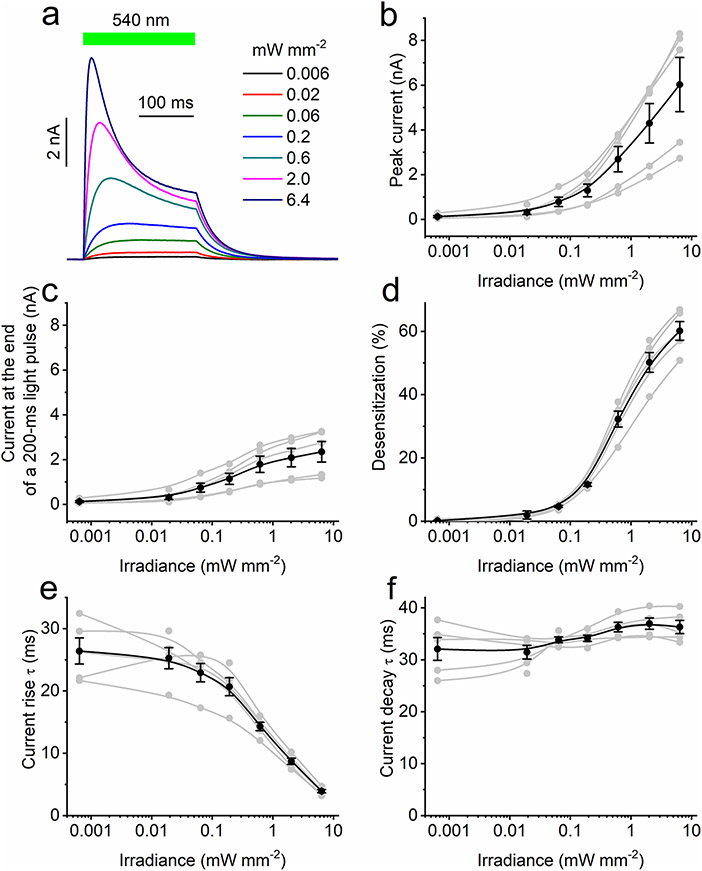
HcKCR1 and HcKCR2 photocurrents decreased to a lower stationary level during illumination (a phenomenon known as desensitization; Fig. 2b and Extended Data Fig. 2a, respectively). At 0 mV in the Na+ bath, desensitization of HcKCR2 after 1-s illumination (490 nm, 7.9 mW mm−2) was only 32 ± 3% (n = 7 cells), whereas that of HcKCR1 (540 nm, 6.4 mW mm−2) was 77 ± 2% (n = 9 cells). In the Na+ bath, the Vrev of the desensitized HcKCR1 photocurrent was shifted by around 10 mV to more positive values from that of the peak current (Extended Data Fig. 4). Positive Vrev shifts during illumination were also observed with Li+, Rb+ or Cs+ in the bath, but not with other cations tested (Extended Data Fig. 4). Extended Data Fig. 5a shows a series of HcKCR1 traces recorded at different stimulus intensities. Desensitized currents exhibited an earlier light saturation than the peak currents (Extended Data Fig. 5b,c, respectively), as observed in other ChRs9. Extended Data Fig. 5d-f shows the dependence of photocurrent desensitization, rise and decay on the light intensity.
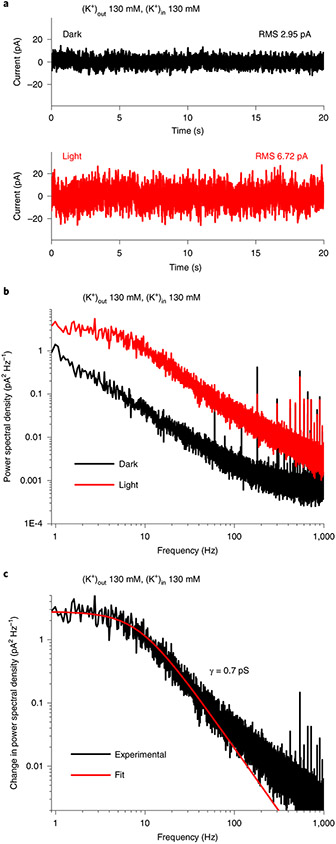
ChRs are not suitable for single-channel recording, but their unitary conductance can be estimated by stationary noise analysis9,21. The noise recorded from HcKCR1-transfected cells increased under continuous illumination, compared with dark conditions (Fig. 3a). The power density spectra for the light and dark noise are shown in Fig. 3b. The unitary conductance (γ), derived from fitting of a Lorentzian function to the light-minus-dark difference spectrum (Fig. 3c), was around 0.7 pS.
Fig. 3 ∣. Determination of HcKCR1 unitary conductance.
a, Current noise in the dark (black) and under 540 nm, 60 μW mm−2 illumination (red) recorded from a HcKCR1-transfected HEK293 cell. RMS, root mean square. b, Power spectra of the noise in the dark (black) and under illumination (red). c, Difference (light minus dark) power spectrum (black) and its Lorenzian fit (red). γ, unitary conductance. For more detail, see Methods.
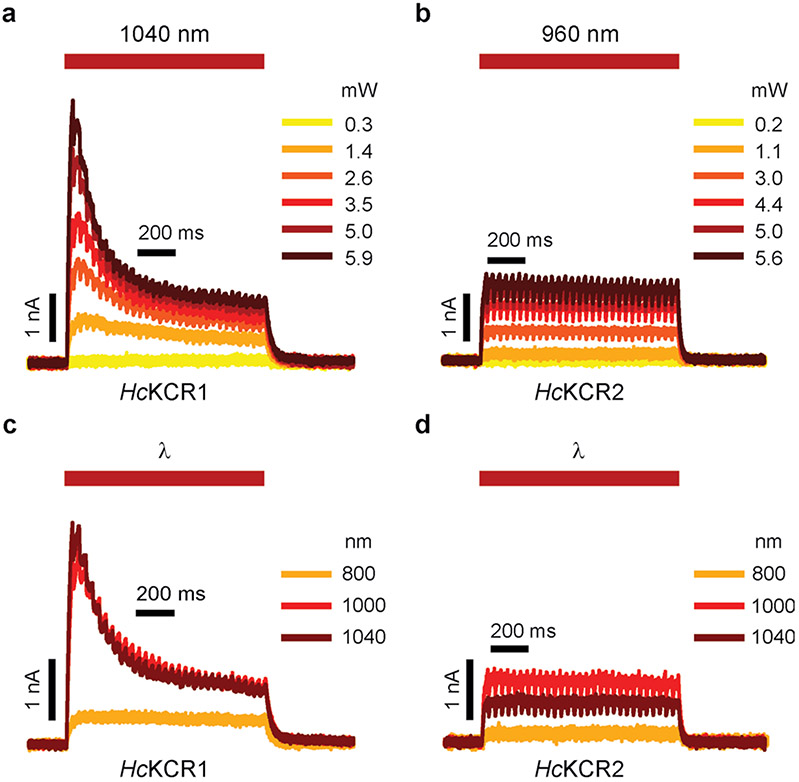
Some rhodopsins absorbing visible light can be excited by infrared (IR) illumination owing to absorption of a second quantum by a virtual energy state generated by absorption of the first photon. After nonradiative deexcitation, the molecule returns to the same excited state independently of the wavelength of the absorbed photon(s). Therefore, a high-frequency pulsed IR stimulation is equivalent to stimulation with continuous visible light. We conducted raster scanning with a conventional two-photon (2P) laser to determine whether HcKCRs can be activated by 2P illumination. As expected, 2P-evoked photocurrent traces (Fig. 2g and Extended Data Fig. 6a,b) were similar to those recorded under continuous one-photon (1P) illumination in the visible range (Fig. 2b and Extended Data Fig. 2a). At the maximal power tested, the peak current amplitude did not saturate (Fig. 2h). We varied the laser wavelength between 800 and 1,080 nm while keeping the power constant (Extended Data Fig. 6c,d). The 2P action spectra obtained by measuring the slope of the current rise exhibited maxima at ~1,040 and ~990 nm for HcKCR1 and HcKCR2, respectively (Fig. 2i).
Characterization of HcKCR1 under single-turnover conditions.
Photocurrent kinetics measured under continuous illumination reflects the timecourse of ChR molecules photoactivated at different times during illumination, rather than simultaneously photoactivated ChRs needed to measure the kinetics of channel gating. Furthermore, during continued illumination, photoactive intermediates of the photocycle may absorb a second photon and initiate their own photocycle, the intermediates of which may have different ion selectivity than those of the primary photocycle. Also, the fluence rate of continuous light is insufficient to resolve fast charge displacements within ChR molecules, which can be monitored by a single-turnover laser flash22.
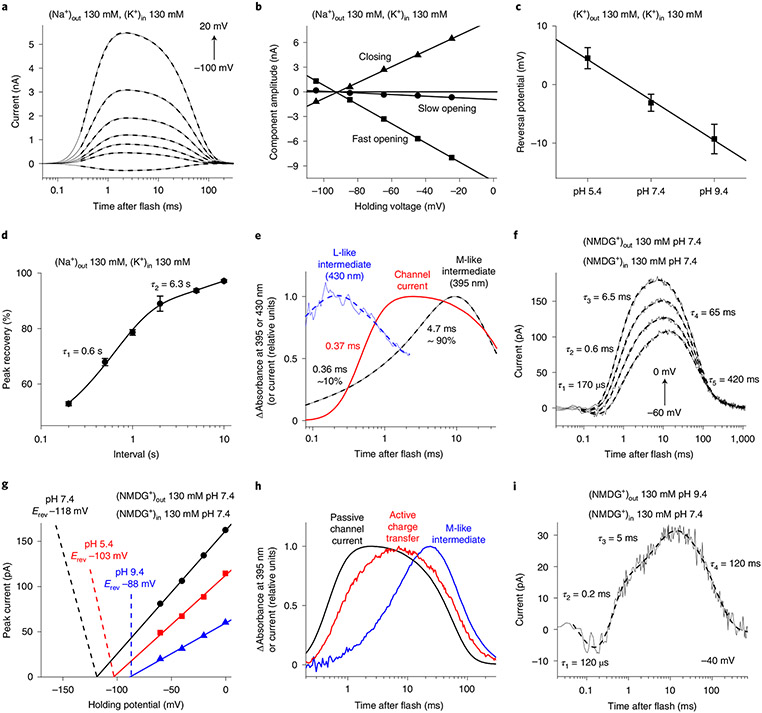
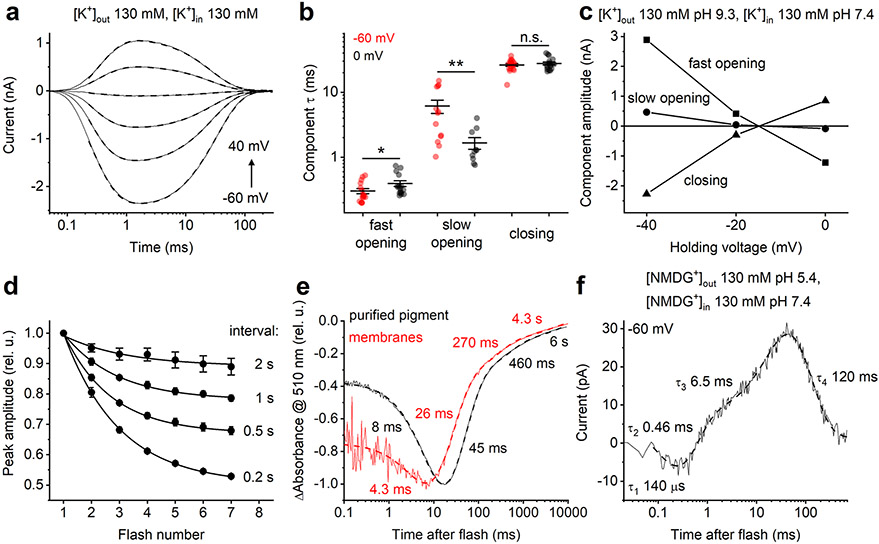
Accordingly, we used 6-ns laser flash excitation, thereby avoiding second-photon photoproducts, to follow the kinetics of channel gating by monitoring passive channel flux and probe for active (that is, driven by the energy of the absorbed photon rather than the electrochemical gradient) charge movements within the protein. Regardless of ionic gradients, channel currents could be fit with three exponentials (Fig. 4a and Extended Data Fig. 7a). Channel opening was biphasic, as in GtACR1 (ref. 23) and CrChR2 (ref. 24), but channel closing monophasic. The fast opening accelerated, and the slow opening slowed upon depolarization (Extended Data Fig. 7b). The Vrev of the amplitudes of the three kinetics components were the same in all experimental conditions (Fig. 4b and Extended Data Fig. 7c), indicating that the relative permeability does not change during the channel cycle. Under symmetrical ionic conditions (130 mM KCl in the bath and pipette) the Vrev depended only weakly on bath pH (Fig. 4c), which confirmed the low permeability of HcKCR1 for protons detected under continuous illumination (Fig. 2f). The photocurrent recovery was biphasic with τ = 0.6 and 6.6 s (Fig. 4d and Extended Data Fig. 7d).
Fig. 4 ∣. Photocurrents and photochemical conversion upon single quantum excitation.
a, Photocurrent traces (thin solid lines) recorded from HcKCR1 in response to laser flashes upon 20-mV voltage increments superimposed with their multiexponential approximations (thick dashed lines). b, Voltage dependence of the three kinetic components of channel currents. c, Dependence of the channel current Vrev with 130 mM KCl in the bath and pipette on bath pH (mean ± s.e.m., n = 3, 8 and 6 cells from three independent experiments for pH 5.4, 7.4 and 9.4, respectively). d, Timecourse of the peak current recovery (mean ± s.e.m., n = 5 cells from three independent experiments). e, Transient absorbance changes (blue and black) and channel current (red). f, Photocurrent traces in the absence of permeant metal cations at bath pH 7.4. g, Voltage dependence of active current at different bath pH in the absence of permeant metal cations. h, Transient absorbance changes at 400 nm (blue), compared with active and passive (channel) currents (red and black, respectively). i, Photocurrent traces in the absence of permeant metal cations at bath pH 9.4. Source data are provided.
Photoactivated rhodopsins undergo a cycle of chemical conversions through a series of spectrally distinct intermediates25,26 usually named K, L, M and N/O, following the nomenclature initiated by research in bacteriorhodopsin27. Identification of these intermediates and their kinetics is essential for elucidation of molecular mechanisms of ChR function. For analysis of photochemical conversions, we expressed HcKCR1 in Pichia and purified it in nondenaturing detergent. In both detergent-purified pigment and Pichia membranes we observed multiphasic recovery of the initial unphotolyzed state (Extended Data Fig. 7e) with τ values similar to those determined electrophysiologically (Fig. 4d). Absorbance at 430 nm dropped concomitant with an increase at 395 nm, characteristic of a transition from an L-like to an M-like intermediate (Fig. 4e). The large blue-shift defining the L to M transition results from proton transfer from the protonated retinylidene Schiff base to the proton acceptor26,27. Opening of the channel was observed upon transition from the late L to the early M intermediate, which implies that the Schiff base deprotonation and channel opening are correlated, but does not necessarily mean a causal relationship. The M rise was biphasic, and τ of the fast component was similar to that of channel opening, unlike GtACR1, in which channel opening takes place in the L state23,28, and chlorophyte CCRs, in which M rise precedes channel opening22,29.
In addition to passive ion conductance, photoactivation of ChRs results in active intramolecular charge displacements, most notably charge movement caused directly by photoisomerization of all-trans to 13-cis retinal and proton transfers between the retinylidene Schiff base and carboxylates or water molecules in its vicinity22. Both the acceptor and the donor of the Schiff base proton in the proton pump bacteriorhodopsin are conserved in KCRs, as in cryptophyte BCCRs (Extended Data Fig. 1). In previously characterized BCCRs, channel activity is tightly coupled to vectorial active translocation of protons within the molecule7. We probed for intramolecular charge displacements in HcKCR1 by recording photocurrents in the absence of permeable metal cations (Fig. 4f). The initial unresolved negative component of charge movement is a typical reflection of retinal isomerization22. The voltage dependence of the positive peak crossed the x axis at large negative values characteristic of active charge movement (Fig. 4g). These values remained close when the extracellular pH was varied over 4 units (that is, 240 mV), indicating that the photoactive site was barely accessible to protons from outside. The rise of positive photocurrent was biphasic, with τ values similar to those of the components of M rise, indicating active proton transfer from the Schiff base to an outwardly located acceptor (Fig. 4e,f). Both passive channel current and active charge transfer peaked before maximal M accumulation, and decayed in the time window of the M decrease (Fig. 4h). This observation suggests that reprotonation of the Schiff base at least partially takes place from an initially protonated acceptor, and there is no proton pumping across the membrane. At pH 9.4 the rates of both positive rise components only slightly increased (Fig. 4i). The decay of active charge movement could be fit with two exponentials with τ = 65 and 420 ms (Fig. 4f), or a single one with τ ~120 ms (Fig. 4i and Extended Data Fig. 7f).
Neuronal inhibition using HcKCRs.
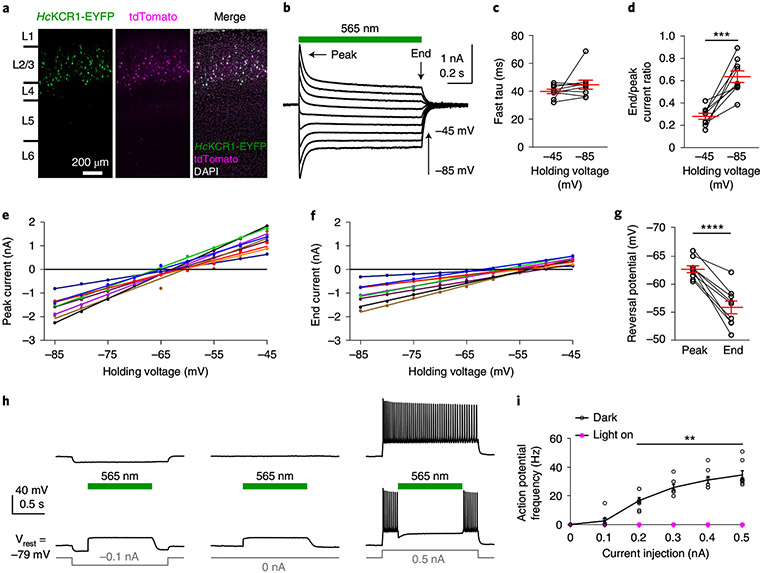
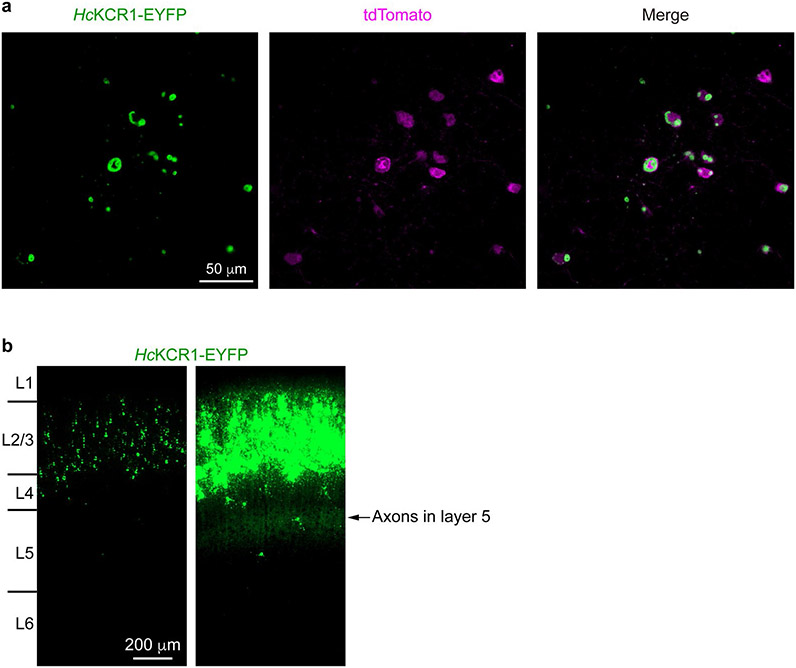
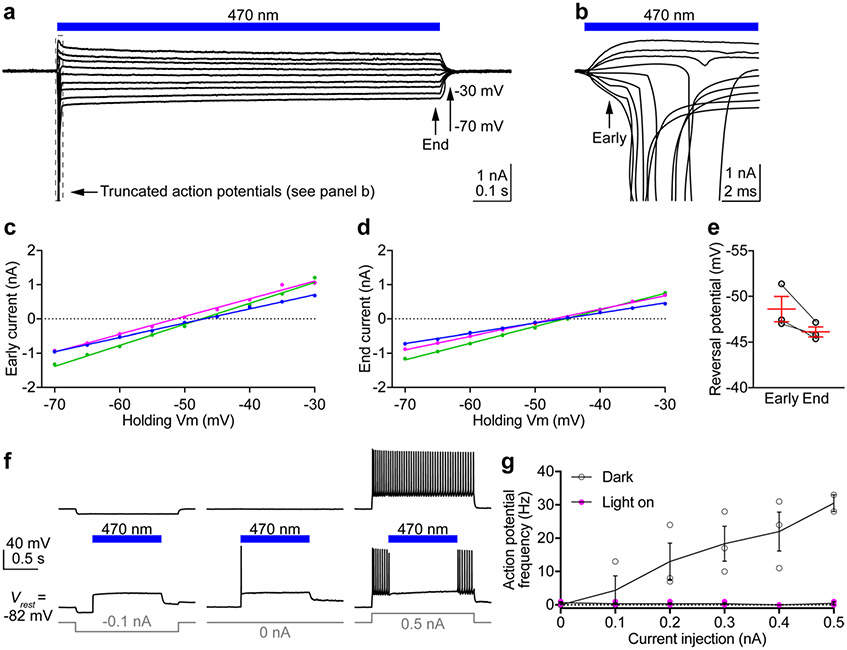
Having characterized HcKCRs in HEK293 cells, we next sought to determine the applicability of HcKCRs for optogenetic silencing in neurons. We selectively expressed HcKCR1 or HcKCR2 fused with EYFP in layer 2/3 pyramidal neurons of the mouse somatosensory cortex by in utero electroporation at embryonic day 14.5 or 15 (Fig. 5a). HcKCRs-EYFP were expressed in neurons at high levels and were present in the somata (Extended Data Fig. 8a), dendrites and axons (Extended Data Fig. 8b). Like many native ChRs, they formed some intracellular aggregates (Extended Data Fig. 8a), indicating incomplete membrane trafficking. We prepared acute brain slices from 3- to 4-week-old mice and performed whole-cell voltage clamp recordings from HcKCR1- or HcKCR2-expressing neurons (for solution compositions, see Methods). Consistent with its lower PK/PNa value, photoactivation of HcKCR2 sometimes induced an action potential at the onset of illumination (Extended Data Fig. 9). Therefore, we focused on HcKCR1 and further characterized its properties in neurons.
Fig. 5 ∣. Photoactivation of HcKCR1 in neurons generates robust photocurrents and efficiently suppresses neuronal firing.
a, Fluorescent images of a cortical slice showing HcKCR1-EYFP and tdTomato expression in layer 2/3 neurons. Similar results were observed in 14 slices from two male and two female mice at the age of 3–4 weeks. Cortical layers were identified by 4′,6-diamidino-2-phenylindole staining. L, layer. b, Photocurrents traces of a HcKCR1-expressing neuron in response to a 1-s 565 nm light pulse (13.1 mW mm−2) at holding voltages increased in 5-mV steps. c, The fast τ of photocurrent desensitization at the indicated voltages. P = 0.2 by the two-tailed Wilcoxon test. d, Ratios of photocurrent at the end of illumination to the peak photocurrent. ***P = 0.0004 by the two-tailed paired t-test. e,f, IV curves of peak photocurrent (e) and photocurrent at the end of illumination (f) in individual neurons indicated by different colors. P < 0.0001, R2 > 0.98 for all linear regressions. g, Reversal potentials calculated from the data in e and f. ****P < 0.0001 by the two-tailed paired t-test. h, Membrane voltage traces of a HcKCR1-expressing neuron in response to 0.2 (left) or 0.5 nA (right) current injections without (top) and with (bottom) 565 nm light pulses. i, The frequencies of action potentials evoked by different current injections with (magenta) and without (black) photoactivation. P > 0.9999 for 0.1 nA and **P = 0.039 for 0.2–0.5 nA by the multiple Wilcoxon matched-pairs signed rank test with Bonferroni–Dunn multiple corrections. Data in c,d,g and i are expressed as mean ± s.e.m., n = 9 neurons in c,d and g and n = 8 neurons in i from one male and one female mouse at the age of 3–4 weeks. Statistics source data are provided.
In response to pulses of green light (13.1 mW mm−2), HcKCR1 generated robust photocurrents (Fig. 5b) that recovered quickly in the dark (Extended Data Fig. 10). The desensitization of photocurrents was best fit by two exponentials with a fast τ of ~40 ms (Fig. 5c) and a slow τ of 0.6 ± 0.1 and 0.5 ± 0.2 s at −45 and −85 mV, respectively (mean ± s.e.m., n = 9 neurons from one male and one female mouse, 3–4 weeks old). The ratio of the photocurrent amplitude at the end of 1-s illumination to the peak amplitude increased when the membrane was hyperpolarized (Fig. 5d). The IV curves showed a reversal potential of −63 mV for peak photocurrents and −56 mV for end photocurrents (Fig. 5e-g), indicating that channel states formed upon absorption of a second photon under continuous light stimulation alter the relative permeability in favor of Na+.
We next performed current clamp recordings to test HcKCR1 as a neuronal silencing tool. HcKCR1-expressing neurons showed resting membrane potentials of −77.2 ± 1.3 mV, input resistances of 133.7 ± 11.3 MΩ and action potential thresholds of −37.7 ± 0.7 mV (mean ± s.e.m., n = 8 neurons from one male and one female mouse, 3–4 weeks old). When the membrane potential was at rest, photoactivation of HcKCR1 depolarized the membrane to −57.9 ± 1.4 mV (mean ± s.e.m.) at the end of 1-s illumination (Fig. 5h). When the membrane potential was hyperpolarized to −90.0 ± 1.4 mV (mean ± s.e.m.) by injecting −0.1 nA current, photoactivation of HcKCR1 depolarized the membrane to a similar value of −58.6 ± 2.1 mV (mean ± s.e.m.) at the end of illumination (Fig. 5h). These results indicate that the photocurrents are sufficient to bring the membrane potential to the reversal potential of HcKCR1 (Fig. 5f,g). When current injections depolarized the membrane potential to evoke action potentials, photoactivation of HcKCR1 inhibited all action potentials during illumination (Fig. 5h,i), demonstrating that HcKCR1 is a potent optogenetic silencer of mouse cortical neurons.
Discussion
Among currently known ChRs, KCR sequences are most closely related to those of cryptophyte BCCRs (Fig. 1). However, out of the 15 BCCRs so far tested that are functional in heterologous systems, none exhibits K+ selectivity30-32. Therefore, KCRs can be regarded as a separate functional class of ChRs for their unique selectivity properties. The discovery of KCRs reveals an alternative mechanism for K+ selection, compared with that of the well-characterized voltage- and ligand-gated K+ channels, and our analysis of KCR photocurrents under single-turnover conditions lays the basis for its elucidation.
The relationship between Schiff base protonation, active proton transfers and passive conductance of ChRs is one of the key questions in ChR research. By kinetic comparison of single-turnover photocurrents and transient absorption changes, we show that opening of the HcKCR1 channel takes place upon transition of the pigment from the late L-like intermediate to the early M-like intermediate (with the deprotonated Schiff base) (Fig. 4e). This is a basic difference of HcKCR1 from both classical CCRs and ACRs. HcKCR1 also differs from these ChRs by a strong isolation of the photoactive site from protons in the external aqueous phase (Fig. 4g).
Another important finding is that the selectivity of the channel does not change during the single-turnover photocycle (Fig. 4b). This means that the Vrev shift observed under continuous illumination in the Na+ bath (Fig. 5g and Extended Data Fig. 4) is caused by the absorption of a second quantum by photocycle intermediates. Among physiological cations, only Na+ caused such a Vrev shift (Extended Data Fig. 4), which means that the relative permeability for K+ is reduced in favor of Na+. Previous studies have shown that different long-lived photocycle intermediates accumulate upon prolonged illumination in different ChRs24,32,33. Characterization of the photocycle intermediates and their conductance, vital for engineering of KCRs with better characteristics (for example, less desensitization), is in progress.
Red light better penetrates biological tissue and therefore red-shifted tools are desirable for optogenetic applications. The HcKCR1 absorption maximum is 540 nm, but ChRs, such as Chrimson34 and RubyACRs35, with even more red-shifted spectra (590–610 nm) are known. The absorption wavelength in rhodopsins is determined mostly by residues of the retinal-binding pocket. Comparison of the pockets (Supplementary Table 2) suggests residue positions, mutations at which are likely to shift the spectrum of HcKCR1 to longer wavelengths. For example, Gly158 in HcKCR1 corresponds to Ser141 in bacteriorhodopsin, which is Ser also in Chrimson and RubyACRs. This polar Ser, located near the β-ionone ring of the retinal chromophore, causes a red spectral shift by electrostatic interaction36.
HcKCR1 expands the optogenetic toolbox with a natural K+-selective tool that benefits from the high efficiency provided by evolution, enabling direct, rapid and potent photocontrol of K+ transmembrane gradients in mouse cortical neurons (Fig. 5). Its major advantage is the 1,000 times faster current kinetics than those of other optogenetic (Supplementary Table 3) and photopharmacogenetic tools (reviewed in ref. 37) available for manipulation of the K+ gradients. The unitary conductance of HcKCR1 measured under prolonged illumination (that is, in a desensitized state) is similar to that of GtACRs9 and around 20 times higher than that of CrChR2 (ref. 21). The PK/PNa of HcKCR1 (~23) is higher than that of the viral potassium channel KCV (~9)38, but smaller than that of mammalian voltage-gated K+ channels (100–1,000)2. Residual permeability for Na+ shifts the Vrev of HcKCR1 photocurrents to more depolarized values from the Nernst equilibrium potential for K+. This could lead to photoinduced depolarization in some neuronal types and/or activity states, which needs to be tested in future experiments. Mechanistic understanding of HcKCR1 conductance may help engineer this channel for better K+ selectivity to avoid this potential problem. The intracellular aggregation of HcKCRs in neurons is likely to affect cell health, particularly in long-term experiments. Research is in progress to test whether this is the case, and whether additional trafficking motifs will reduce intracellular aggregation and improve membrane targeting of HcKCRs.
Using 2P illumination with IR light is the method of choice for optogenetic stimulation or inhibition with single-cell resolution in three-dimensional tissues in vivo39,40. Our experiments show that both KCRs can be activated using 2P illumination (Fig. 2g-i and Extended Data Fig. 6), paving the way for their deployment for in vivo optogenetic silencing experiments targeting individual cells or neuronal processes41. The 2P spectra of both KCRs are well matched to the excitation wavelengths of common (Ti:Sapphire) lasers used in neuroscience laboratories, which can typically be tuned from ~700 nm to ~1,020–1,300 nm. The most powerful commercially available 2P lasers, which excite at ~1,040 nm, enable simultaneous 2P illumination of large ensembles of single neurons in rodents40. Given its peak excitation at ~1,040 nm, HcKCR1 is expected to be ideally suited for such applications. As 2P photocurrents did not saturate at the highest tested laser power (Fig. 2h), larger currents should be achievable. Alternatively, more efficient illumination methods such as scanless 2P excitation41 can be used.
Conclusions
HcKCRs are the first known ChRs highly selective for K+ over Na+. They present an alternative mechanism for K+ selectivity, compared with voltage- and ligand-gated K+ channels. Owing to its higher K+ selectivity, larger photocurrents and more red-shifted absorption, HcKCR1 is better suited as a tool for optogenetic neuronal silencing than HcKCR2. We anticipate that HcKCRs will be useful for manipulation of K+ gradients in various cell types with high spatio-temporal precision, and for the study, and potentially treatment, of K+ channelopathies.
Methods
Bioinformatics and molecular biology.
Initially, the predicted protein sequences encoded by the genes Hypho2016_00006030 and Hypho2016_00006031 (395 and 383 amino acid residues, respectively) were obtained from the database provided by ref. 16 (https://www.ebi.ac.uk/biostudies/studies/S-BSST46), in the file hyphochytrium_catenoides_predicted_proteins_renamed_modified.fasta. However, a large part of TM6 was missing from the Hypho2016_00006030 prediction. Therefore, we corrected its transmembrane (TM) domain by performing TBLASTN search of the WGS data for H. catenoides strain ATCC 18719 (accession numbers FLMG00000000.1 and CAFC00000000.2) at the National Center for Biotechnology Information (NCBI), using the sequence provided16 as a query. The resultant alignment allowed us to recover the full sequence (401 residues). DNA polynucleotides encoding the corrected TM domains (residues 1–265) of Hypho2016_00006030 (HcKCR2) and Hypho2016_00006031 (HcKCR1) were optimized for human codon usage and synthesized at Genscript Biotech Corporation. The truncation points (20 residues after the end of helix 7) were determined by prediction of protein topology using the TMHMM v.2.0 server43. The sequence information was deposited with GenBank (accession numbers MZ826862 and MZ826861, respectively).
Rhodopsin sequences were aligned using MUSCLE as implemented in MegAlign Pro software v.17.1.1 (DNASTAR Lasergene) with default parameters. Phylogeny was analyzed with IQ-TREE v.2.1.2 (ref. 44) using automatic model selection and ultrafast bootstrap approximation (1,000 replicates)45. The best tree was visualized and annotated with iTOL v.6.3 (ref. 46).
For expression in HEK293/HEK293A (human embryonic kidney) cells, the polynucleotides encoding the transmembrane domains of HcKCR1 and HcKCR2 were cloned into the mammalian expression vector pcDNA3.1 (Life Technologies) in frame with a C-terminal mCherry tag. For expression in Pichia pastoris, the polynucleotide encoding the TM domain of HcKCR1 was fused with a C-terminal His7 tag and cloned into the pPICZαA vector (Invitrogen). For expression in mouse cortical neurons, HcKCR1 and HcKCR2 were tagged with EYFP (enhanced yellow fluorescent protein) at the C terminus and cloned into the pAAV-CAG vector.
HEK293/HEK293A cell culture and transfection.
No cell lines from the list of known misidentified cell lines maintained by the International Cell Line Authentication Committee were used in this study. HEK293 cells obtained from the American Type Culture Collection (ATCC; catalog no. CRL-1573) and HEK293A cells from Thermo Fisher Scientific (catalog no. R70507) were grown in high-glucose DMEM supplemented with 5% fetal bovine serum (FBS), 2 mM glutamine, 100 U ml−1 penicillin, and 100 μg ml−1 streptomycin at 37°C with 5% CO2. The HEK293 cells were plated on 2-cm diameter plastic dishes 48–72 h before experiments, grown for 24 h and transfected with 10 μl ScreenFectA transfection reagent (Waco Chemicals) using 3 μg DNA per dish. The HEK293A cells were plated on 30–70 kDa poly-d-lysine-coated 12-mm circular coverslips (Carolina cover glass #0, catalog no. 633009) in 24-well plates (P24-1.5H-N, Cellvis) at 30% confluence, and transfected with 1.2 μl FuGENE HD transfection reagent (Promega, catalog no. E2311) using 400 ng DNA per well 48–72 h before measurements. Immediately after transfection, all-trans-retinal (Sigma) was added as a stock solution in ethanol at the final concentration of 5 μM.
1P patch clamp electrophysiology.
We performed whole-cell voltage clamp recordings in HEK293 cells with an Axopatch 200B amplifier (Molecular Devices). The signals were digitized with a Digidata 1440A using pClampEx v.10.7 software (both from Molecular Devices). Patch pipettes with resistances of 2–5 MΩ were fabricated from borosilicate glass. The composition of all solutions is shown in Supplementary Table 1. A 4 M salt bridge was used in all experiments. All IV dependencies were corrected for liquid junction potentials (LJP) calculated using the ClampEx built-in LJP calculator (Supplementary Table 1). Continuous light pulses were provided by a Polychrome IV light source (TILL Photonics GmbH) in combination with a mechanical shutter (Uniblitz Model LS6, Vincent Associates; half-opening time 0.5 ms). Maximal quantum density at the focal plane of the ×40 objective lens was around 7 mW mm−2 at 540 nm. The action spectra were constructed by calculation of the initial slope of photocurrent in the linear range of the dependence on the quantum density (<25 μW mm−2), corrected for the quantum density measured at each wavelength and normalized to the maximal value. Desensitization of photocurrents under continuous illumination was quantified as the difference between the peak value and that at the end of a 1-s light pulse, divided by the peak value. Laser excitation was provided by a Minilite II Nd:YAG laser (532 nm, pulsewidth 6 ns, energy 12 mJ; Continuum). Initial analysis of the recorded data was carried out using ClampFit 10.7. The current traces were filtered logarithmically using LogPro software47. We performed curve fitting by Origin Pro 2016 software (OriginLab Corporation). All measurements were carried out at room temperature (25 °C).
Noise analysis.
HcKCR1 photocurrent traces were recorded at −60 mV at room temperature for 20 s in the dark and during a 20-s light pulse of intensity eliciting a half-maximal response with 130 mM KCl in the bath and pipette. The plateau current was fit with a double exponential, and the fit signal was subtracted from the current trace. Power spectra for the light and dark conditions were calculated from the current traces using pClamp software. Three spectra for each condition were calculated for each of five cells and pooled together to obtain the mean light and dark spectra. The difference (mean light minus mean dark spectrum) was fit between 1 Hz and 1 kHz with a Lorentzian function to determine the zero-frequency asymptote S(0) and the corner frequency fc. The unitary conductance (γ) was estimated from these parameters and the amplitude of the whole-cell channel current (I), the holding potential (Vh) and the reversal potential of the channel current (Vr) using the formula: γ = πS(0)fc/2I(Vh – Vr).
2P patch clamp electrophysiology.
IR 2P excitation of HcKCRs expressed in HEK293A cells was conducted on an inverted microscope with multiphoton capability (A1R-MP, Nikon Instruments). A coverslip seeded with the transfected cells was placed in a custom glass-bottom chamber based on Chamlide EC (Live Cell Instrument) with a glass bottom made with a 24 × 24 mm cover glass #1 (Erie Scientific, catalog no. 89082-270). Cells were perfused continuously with external solution (Supplementary Table 1, the osmolarity of which adjusted to 290 mOsm l−1 with d-(+)-glucose), at around 4 ml min−1 with a peristaltic pump (505DU, Watson Marlow). The osmolarity of the pipette solution (Supplementary Table 1) was adjusted to 280 mOsm l−1. Whole-cell voltage clamp recordings were carried out using a MultiClamp 700B amplifier (Molecular Devices). The cells were held at −20 mV, with the command voltage compensated for the 4.4 mV LJP calculated using the ClampEx v.11.1 (Molecular Devices) built-in calculator. The signal was digitized with an Axon Digidata 1550B1 Low Noise system with HumSilencer (Molecular Devices), and the current was recorded at 10 kHz using ClampEx v.11.1. The access resistance (R3) and the membrane resistance (Rm) were tested before and after each recording. All measurements were carried out at room temperature (22–23 °C).
The excitation IR (NIR) light was generated by a titanium:sapphire femtosecond laser (Chameleon Ultra II, Coherent) with a repetition rate of 80 MHz and a tuning range between 680 and 1,080 nm. Laser power was tuned using an acousto-optic modulator and delivered to the sample plane through a ×40 0.95-numerical aperture (NA) objective (CFI Plan Apochromat Lambda, Nikon Instruments). Scanning across xy regions-of-interest was achieved using a pair of galvanometer scanners. A total of 30 sequential raster scans (total duration around 1 s) were conducted over a 16 × 16 μm (64 × 64 pixels) area with a dwell time of 2.7 μs per pixel and no time gap between each scan of a pulse. The dimensions of the excitation area denoted above were chosen to fit an approximate size of an average HEK293A cell. The jagged appearance of the photocurrent traces (Fig. 2g) is owing to raster scanning artifacts such as the laser being turned off when flying back to the starting pixel after each scan. The interval between pulses was around 60 s to avoid KCR desensitization. The absence of major desensitization was confirmed by a <10% decrease in the peak photocurrent between light pulses at the same power and wavelength (3.5 mW, 1,040 nm for HcKCR1 and 4.8 mW, 960 nm for HcKCR2) between the start and end of each recording.
To quantify the power dependence of 2P activation of HcKCRs, 2P illumination at the approximate peak wavelength was used (1,040 and 960 nm for HcKCR1 and HcKCR2, respectively). The excitation power at the sample plane was varied between around 0.1 and around 6 mW, as measured by a microscope slide power sensor (S170C, Thorlabs). To determine the 2P action spectra of HcKCRs, the excitation wavelength was varied from 800 to 1,080 nm in 40-nm increments. At each wavelength, the laser was tuned to around 3.5 mW at the sample plane (in the linear range of the power dependence). The maximal deviation from the mean power at the sample plane per recording was <10%. The 2P action spectra were constructed by measuring the initial linear slope of the photocurrent rise at each wavelength. The values obtained were then corrected for the exact power measured at each wavelength. The datapoints were connected with a spline line using Origin Pro 2016 software (OriginLab Corporation) and normalized to the maximal value of the spline curve.
Purification of HcKCR1 from P. pastoris.
The HcKCR1-7His-pPICZαA plasmid was linearized with SacI and delivered into P. pastoris SMD1168 by electroporation. A single colony resistant to 0.5 mg ml−1 zeocin was picked and inoculated into buffered complex glycerol medium, after which the cells were transferred to buffered complex methanol (0.5%) medium supplemented with 5 μM all-trans-retinal (Sigma-Aldrich) and grown at 30 °C with shaking at 200 rpm. After 24 h, the cells were harvested and disrupted in 100 ml ice-cold buffer A (20 mM Hepes, pH 7.4, 150 mM NaCl, 1 mM EDTA, 5% glycerol) using a bead beater. Cell debris was removed by centrifugation at 5,000g for 10 min. Membrane fragments were collected by ultracentrifugation at 190,000g for 1 h, and then solubilized in 20 ml buffer B (20 mM Hepes, pH 7.5, 350 mM NaCl, 5% glycerol) and 1% dodecyl-β-d-maltopyranoside (DDM) at 4 °C for 1 h. Nonsolubilized material was removed by ultracentrifugation at 110,000g for 1 h. The supernatant was mixed with nickel-nitrilotriacetic acid resin (Qiagen) with 15 mM imidazole and incubated at 4 °C for 1 h. After washing the resin with buffer B containing 0.02% DDM and 40 mM imidazole, the protein was eluted with buffer B containing 0.02% DDM and 300 mM imidazole, concentrated using Amicon Ultra Centrifugal Filters (Millipore) at 4 °C, and washed with buffer B containing 0.02% DDM to remove imidazole.
UV-visual absorption spectroscopy and flash photolysis.
Absorption spectra of purified HcKCR1 were recorded using a Cary 4000 spectrophotometer (Varian). Light-induced absorption changes were measured with a laboratory-constructed crossbeam apparatus. Excitation flashes (532 nm, 6 ns, 12 mJ) were provided by a Minilite II Nd:YAG laser (Continuum). Measuring light was from a 250-W incandescent tungsten lamp combined with a McPherson monochromator (model 272). Absorption changes were detected with a Hamamatsu Photonics photomultiplier tube (model R928), protected from excitation laser flashes by a second monochromator of the same type. Signals were amplified by a low noise current amplifier (model SR445A; Stanford Research Systems) and digitized with a GaGe Octopus digitizer board (model CS8327, DynamicSignals LLC), maximum sampling rate 50 MHz. Logarithmic filtration of the data was performed using the GageCon program48.
Mice.
All procedures to maintain and use mice were approved by the Institutional Animal Care and Use Committee at Baylor College of Medicine. ICR (CD-1) female mice were purchased from Baylor College of Medicine Center for Comparative Medicine. C57BL6/J male mice were obtained from Jackson Laboratory (stock numbers 000664). Mice were maintained on a 14 h:10 h light:dark cycle with regular mouse chow and water ad libitum. The temperature was maintained at 21–25 °C and humidity at 40–60%. We performed experiments during the light cycle. Both male and female mice were used in the experiments at the age of 3–4 weeks.
In utero electroporation.
Female ICR mice were crossed with male C57BL6/J mice to obtain timed pregnancies. In utero electroporation was used to deliver the transgenes49. To express HcKCR1 or HcKCR2 in the layer 2/3 pyramidal neurons of the somatosensory cortex, pAAV-CAG-HcKCR1-EYFP or pAAV-CAG-HcKCR2-EYFP (2.5 μg μl−1 as final concentration) was mixed with pCAG-tdTomato (0.1 μg μl−1 as final concentration) and Fast Green (Sigma-Aldrich, 0.01% final concentration) for injection. On embryonic day 14.5–15, female mice were anesthetized and a beveled glass micropipette (tip size 100-μm outer diameter, 50-μm inner diameter) was used to penetrate the uterus and the embryo skull to inject about 1.5 μl DNA solution into one lateral ventricle. Five pulses of current (voltage 39 V, duration 50 ms) were delivered at 1 Hz with a Tweezertrode (5-mm diameter) and a square-wave pulse generator (Gemini X2, BTX Harvard Bioscience). The electrode paddles were positioned in parallel with the brain’s sagittal plane. The cathode contacted the same lateral side of the brain of the injected ventricle to target the somatosensory cortex. Transfected pups were identified by the transcranial fluorescence of tdTomato with the MZ10F stereomicroscope (Leica) 1 day after birth.
Brain slice electrophysiology.
Mice were used at the age of 3–4 weeks for acute brain slice electrophysiology experiments. Mice were anesthetized by an intraperitoneal injection of a ketamine and xylazine mix (80 mg kg−1 and 16 mg kg−1, respectively) and perfused transcardially with cold (0–4 °C) slice cutting solution containing 80 mM NaCl, 2.5 mM KCl, 1.3 mM NaH2PO4, 26 mM NaHCO3, 4 mM MgCl2, 0.5 mM CaCl2, 20 mM d-glucose, 75 mM sucrose and 0.5 mM sodium ascorbate (315 mOsm l−1, pH 7.4, saturated with 95% O2/5% CO2). Brains were removed and sectioned in the cutting solution with a VT1200S vibratome (Leica) to obtain 300 μm coronal slices. Slices were incubated in a custom-made interface holding chamber containing slice cutting solution saturated with 95% O2/5% CO2 at 34 °C for 30 min and then at room temperature for 20 min to 10 h until they were transferred to the recording chamber.
We performed recordings on submerged slices in artificial cerebrospinal fluid (ACSF) containing 119 mM NaCl, 2.5 mM KCl, 1.3 mM NaH2PO4, 26 mM NaHCO3, 1.3 mM MgCl2, 2.5 mM CaCl2, 20 mM d-glucose and 0.5 mM sodium ascorbate (305 mOsm l−1, pH 7.4, saturated with 95% O2/5% CO2, perfused at 3 ml min−1) at 30–32 °C. For whole-cell recordings, a K+-based pipette solution containing 142 mM K+-gluconate, 10 mM HEPES, 1 mM EGTA, 2.5 mM MgCl2, 4 mM ATP-Mg, 0.3 mM GTP-Na, 10 mM Na2-phosphocreatine (295 mOsm l−1, pH 7.35) was used. Membrane potentials reported in Fig. 5 and Extended Data Fig. 9 were not corrected for LJP, which was measured experimentally as 12.5 mV.
Neurons were visualized with video-assisted IR differential interference contrast imaging, and fluorescent neurons were identified by epifluorescence imaging under a water immersion objective (×40, 0.8 NA) on an upright SliceScope Pro 1000 microscope (Scientifica) with an IR-1000 CCD camera (DAGE-MTI). Data were low-pass filtered at 4 kHz and acquired at 10 kHz with an Axon Multiclamp 700B amplifier and an Axon Digidata 1440 A Data Acquisition System under the control of Clampex 10.7 (Molecular Devices). Data were analyzed offline using Clampfit (Molecular Devices). For photostimulation, green light was emitted from a collimated 565 nm light-emitting diode (LED; Thorlabs M565L3) to stimulate HcKCR1-expressing neurons and blue light, from a collimated 470 nm LED (Thorlabs M470L3) to stimulate HcKCR2-expressing neurons. The LEDs were driven by a LED driver (Throlabs LEDD1B) under the control of an Axon Digidata 1440 A Data Acquisition System and Clampex 10.7. Light was delivered through the reflected light fluorescence illuminator port and the ×40 objective.
Photocurrents were recorded by whole-cell voltage clamp in response to 1-s 565 nm light stimulation (13.1 mW mm−2) for HcKCR1 and 470 nm light stimulation (18.0 mW mm−2) for HcKCR2. Only recordings with Ra < 20 MΩ were included. To test the recovery of photocurrents in the dark, HcKCR1-expressing neurons were held at −45 mV and stimulated with various intertrial intervals (ITI). To test current-voltage relationship, photocurrents were recorded at membrane voltages from −85 to −45 mV (for HcKCR1) or −70 to −30 mV (for HcKCR2) with 5-mV steps and 30-s ITI. Action potentials of HcKCR1- or HcKCR2-expressing neurons were evoked by injecting a series of 1.5-s depolarizing current pulses (0.1–0.5 nA) in whole-cell current clamp mode. 1-s 565 nm (13.1 mW mm−2) or 470 nm (18.0 mW mm−2) light stimulation was applied in the middle of current injections with 30-s ITI for HcKCR1 or HcKCR2, respectively. Light stimulation and control trials were interleaved.
Fluorescent imaging of HcKCR expression in neurons.
After electrophysiology recordings, brain slices were fixed overnight in 4% paraformaldehyde in PBS (pH 7.4), cryoprotected with 30% sucrose in PBS and frozen in optimum cutting-temperature medium until sectioning. An HM 450 Sliding Microtome (Thermo Scientific) was used to further section the slices to obtain 50 μm slices. Images were acquired on an Axio Zoom.V16 Fluorescence Stereo Zoom Microscope (Zeiss) or a Sp8X Confocal Microscope (Leica) and processed using MATLAB2021b (MathWorks) and Imaris v.9.2 (Oxford Instruments). Images were taken from 14 brain slices of two male and two female mice at the age of 3–4 weeks.
Statistics and reproducibility.
In experiments in HEK293/HEK293A cells, identical batches of cell culture were assigned randomly for transfection with each tested construct. Such independently transfected batches were considered independent experiments. At least three separate batches of culture were transfected independently with each construct, their exact number is indicated in the figure captions. Photocurrent traces recorded from different cells transfected with the same construct were considered biological replicates (reported as n values). In experiments with 1P excitation with pulses of continuous light and 2P excitation, only one trace per cell per condition was recorded. In experiments under single-turnover conditions (nanosecond laser flashes) used to evaluate channel kinetics by curve fitting, six traces recorded from the same cell were averaged to improve the signal-to-noise ratio. The traces recorded from the same cell were considered technical replicates and never used to derive statistics; we performed statistical analysis on averaged traces (one from each cell) considered as biological replicates. Individual transfected HEK293 cells were selected for patching by inspecting their tag fluorescence; nonfluorescent cells were excluded. Cells in which we could not establish a GΩ seal were automatically discarded from measurements. Photocurrent traces were excluded from the analyses if the Rm decreased to <500 MΩ, or Ra increased to >20 MΩ during recording. In cells that satisfied these criteria, all attempts at replication were successful. Descriptive statistics was calculated by Origin Pro 2016 software. The data are presented as mean ± s.e.m. values, as indicated in the figure legends; the data from individual cells are also shown when appropriate. No statistical methods were used to predetermine sample sizes, but our sample sizes are similar to those reported in previous publications8,10,34. No normal distribution of the data was assumed; when a specific statistics hypothesis was tested, two-tailed, nonparametric tests (the paired sample signed ranks Wilcoxon test (Extended Data Fig. 2d,e and Extended Data Fig. 4) and the Mann–Whitney test (Extended Data Fig. 7b)) were used as implemented in Origin software.
For experiments in neurons, pregnant mice were assigned randomly for in utero electroporation with each tested construct. We performed statistical analyses with Prism v.9 (GraphPad Software). The normality of the data in Fig. 5d,g,i and Extended Data Fig. 9e,g were tested by the Anderson–Darling test, D’Agostino and Pearson test, Shapiro-Wilk test and Kolmogorov–Smirnov test (data in the source files). If the data passed the normality tests, then a statistical test that assumes a Gaussian distribution was used. Otherwise, a statistical test that assumes a non-Gaussian distribution was used. The paired t-test was used in Fig. 5d,g and Extended Data Fig. 9e, the Wilcoxon matched-pairs signed rank test in Fig. 5c and the Multiple Wilcoxon matched-pairs signed rank test with multiple corrections in Fig. 5i and Extended Data Fig. 9g. All statistical tests were two-tailed with an α of 0.05. All reported sample numbers (n) represent biological replicates that are the numbers of recorded neurons.
Data collection and analysis were not performed blind to the conditions of the experiments, because this was an observational study aimed at characterization of KCRs, not their comparison with previously used tools.
Extended Data
Extended Data Fig. 1 ∣. The alignment of KCRs and representative cryptophyte BCCRs.
The black lines show the predicted transmembrane helices (TM1-TM7). The Schiff base lysine is highlighted blue, the conserved aspartates corresponding to Asp85 and Asp96 of bacteriorhodopsin, red, and the residues implicated in trimer formation in ChRmine, green. GtCCR2, Guillardia theta CCR2; RaCCR1, Rhodomonas abbreviata CCR1.
Extended Data Fig. 2 ∣. Electrophysiological characterization of HcKCR2 in HEK293 cells.
a, b, Series of HcKCR2 photocurrents recorded in response to 1-s light pulses under indicated ionic and voltage conditions. c, The IV curves measured under indicated ionic conditions (mean ± sem, n = 7 cells from 3 independent experiments). d, e, The Vrev values determined for the peak current and current at the end of a 1-s light pulse under indicated ionic conditions. The symbols are data from individual cells, the lines are the mean ± sem, n = 7 cells from 3 independent experiments. *, P = 0.031; n. s. (not significant), P = 1 by two-sided paired sample Wilcoxon signed ranks test. Source data are provided.
Extended Data Fig. 3 ∣. Analysis of relative permeabilities of HcKCR1 for metal cations and NMDG+.
Left, HcKCR1 peak photocurrents recorded in response to 1-s light pulses with 130 mM KCl in the pipette and 130 mM of the indicated cation in the bath. Right, the corresponding IV curves (mean ± sem, n = 8 cells from 3 independent experiments). The red lines show linear approximations used to determine the Vrev. Source data are provided.
Extended Data Fig. 4 ∣. Comparison of the Vrev values of HcKCR1 photocurrents measured at the time of the peak and at the end of a 1-s light pulse.
The photocurrents were recorded with 130 mM KCl in the pipette and 130 mM of the indicated cation in the bath. The symbols are the data from individual cells, the lines are the mean ± sem, n = 10 cells for Na+, 7 cells for Li+, Cs+, NMDG+, Ca2+, K+ pH 5.4, 6 cells for Mg2+, and 8 cells for K+ pH 7.4 and Rb+. P values were determined by two-sided paired sample Wilcoxon signed ranks test. Source data are provided.
Extended Data Fig. 5 ∣. Light intensity dependence of HcKCR1 photocurrents.
a, A series of HcKCR1 photocurrents recorded at 20 mV in response to 200-ms light pulses of the intensity indicated in the legend. The green bar shows the duration of illumination. b–f, Dependence of peak photocurrent (b), photocurrent at the end of the light pulse (c), desensitization (d), the time constant (τ) of photocurrent rise (e), and τ of photocurrent decay (f) on the stimulus intensity. Light gray, data from individual cells, and black, mean ± sem (n = 5 cells from 3 independent experiments). Source data are provided.
Extended Data Fig. 6 ∣. Representative photocurrents recorded under two-photon (2P) illumination at different laser powers and wavelengths.
a, b, Representative HcKCR1 (a) and HcKCR2 (b) photocurrents recorded at different power levels. c, d, Representative HcKCR1 (c) and HcKCR2 (d) photocurrents recorded with light of different wavelengths. All traces were recorded using KCR-expressing HEK293A cells held at −20 mV. The red bars mark the timing of the 1-s 2P excitation periods. The jagged appearance of the traces is due to raster scanning artifacts (see Methods).
Extended Data Fig. 7 ∣. Extended analysis of photocurrents and photochemical conversion upon single quantum excitation.
a, Photocurrent traces (thin solid lines) recorded from HcKCR1 in response to 6-ns laser flashes at 20-mV voltage increments under indicated ionic conditions and their multiexponential approximations (dashed lines). b, The time constants (τ) of the three kinetic components of channel currents at −60 (red) and 0 (black) mV (mean ± sem). The data for individual cells are shown as circles; mean ± sem, as lines (n = 16 cells for fast opening, 13 cells for slow opening at −60 mV, 10 cells for slow opening at 0 mV, and 17 cells for closing). *, P = 0.017 **, P = 0.06; n.s. (not significant), P = 0.877 by the two-sided Mann–Whitney test. Statistics source data are provided. c, The voltage dependence of the three kinetic components of channel currents. d, Peak amplitude channel currents recorded at varied time intervals between laser flashes. The datapoints are mean ± sem, n = 5 cells. Statistics source data are provided. e, Laser flash-induced absorption changes of HcKCR1 in detergent (black) and Pichia membranes (red). Experimental data are shown as thin solid lines, and their multiexponential approximations, as dashed lines. f, HcKCR1 photocurrent traces in the absence of permeant metal cations at bath pH 5.4. Experimental data are shown as thin solid lines, and their multiexponential approximations, as dashed lines.
Extended Data Fig. 8 ∣. HcKCR1 expression in mouse cortical neurons.
a, Fluorescence images showing HcKCR1-EYFP (green) and tdTomato (magenta) expression in layer 2/3 pyramidal neurons. HcKCR1-EYFP is expressed at high levels and forms some intracellular aggregates, as do many other wild-type ChRs. HcKCR2-EYFP shows the same degree of aggregation. Membrane targeting of both KCRs is confirmed by robust photocurrents (Fig. 5b and Extended Data Fig 9.). b, The fluorescence image of HcKCR1-EYFP from Fig. 5a (left panel) was overexposed to visualize the presence of HcKCR1-EYFP in the dendrites and axons (right panel). Note, the axons of layer 2/3 pyramidal neurons ramify in layer 5. Similar results were observed in 14 slices from 2 male and 2 female mice at the age of 3–4 weeks.
Extended Data Fig. 9 ∣. Photoactivation of HcKCR2 in neurons causes action potentials, but can also inhibit neuronal spiking.
a, Photocurrent traces of a HcKCR2-expressing neuron in response to a 1-s 470 nm light pulse (18.0 mW mm-2) at holding voltages increased in 5-mV steps. HcKCR2 generated robust photocurrents, but at more negative voltages the onset of illumination caused large inward currents, corresponding to action potentials (boxed segment, see its expansion in b). b, Expanded photocurrent traces of the boxed segment in a. c, d, IV curves of the early photocurrent before the onset of action potentials (c) and the current at the end of illumination (d) of individual neurons indicated by different colors (P < 0.0001, R2 > 0.99 for all linear regressions). e, Reversal potentials calculated from the data in c and d (P = 0.1, two-tailed paired t test). The reversal potentials of HcKCR2 are higher than those of HcKCR1, consistent with the results in HEK293 cells (Extended Data Fig.2). f, Membrane voltage traces of a HcKCR2-expressing neuron in response to −0.1 (left), 0 (middle), or 0.5 nA (right) current injections without (top) and with (bottom) 470 nm illumination. When the membrane potential was at rest or depolarized (middle and right), photoactivation of HcKCR2 often caused action potentials at the onset of light because the reversal potential was close to the action potential threshold. Nevertheless, action potentials evoked by current injections were suppressed by long pulses of light (right) due to shunting inhibition. g, The frequencies of action potentials evoked by different current injections with (magenta) and without (black) photoactivation (P > 0.99 for all current levels by the Multiple Wilcoxon matched-pairs signed rank test with Bonferroni–Dunn multiple corrections). Data in e and g are expressed as mean ± sem, n = 3 neurons from 1 male and 1 female mouse at the age of 3–4 weeks.
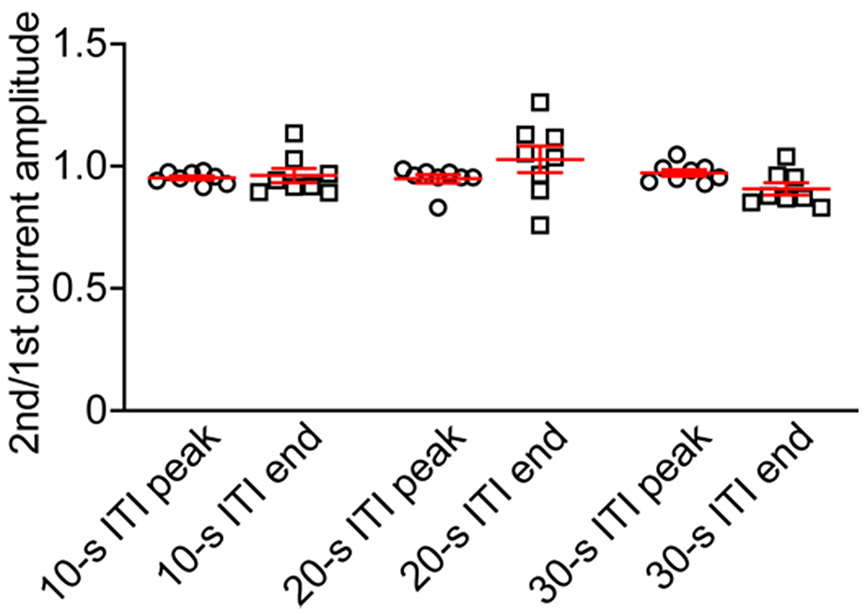
Extended Data Fig. 10 ∣. HcKCR1 photocurrent recovery in the dark in experiments with 1-s light pulses.
Neurons were stimulated by two light pulses (13.1 mW mm−2) applied with a 10-s, 20-s, or 30-s interval, and the ratio of the peak or end currents evoked by the 2nd pulse to that of the 1st pulse was calculated. ITI, intertrial interval. Data are expressed as mean ± sem; n = 8 neurons from 1 male and 1 female mouse at the age of 3–4 weeks.
Supplementary Material
Acknowledgements
This work was supported by the National Institutes of Health grants R35GM140838 (J.L.S.), U01NS118288 (M.X., J.L.S. and F.St.-P.), R01EB027145 (F.St.-P.), U01NS113294 (F.St.-P.), and P50HD103555 (Baylor College of Medicine Intellectual and Developmental Disabilities Research Center, Neurovisualization Core); National Science Foundation grants 1707359 and 1935265 (F.St.-P.); Robert A. Welch Foundation Endowed Chair AU-0009 (J.L.S.); Welch Foundation grant Q-2016-20190330 (F.St.-P.); McKnight Endowment Fund for Neuroscience (M.X.); Natural Sciences and Engineering Research Council of Canada Discovery Grant RGPIN-2018-04397 (L.S.B.); a Klingenstein-Simons Fellowship Award in Neuroscience (F.St.-P.). M.X. is a Caroline DeLuca Scholar. F.St.-P. is a Scholar of the McNair Medical Foundation. The funders had no role in study design, data collection and analysis, decision to publish or preparation of the manuscript.
Footnotes
Online content
Any methods, additional references, Nature Research reporting summaries, source data, extended data, supplementary information, acknowledgements, peer review information; details of author contributions and competing interests; and statements of data and code availability are available at https://doi.org/10.1038/s41593-022-01094-6.
Reporting summary. Further information on research design is available in the Nature Research Reporting Summary linked to this article.
Competing interests
The authors declare no competing interests.
Extended data is available for this paper at https://doi.org/10.1038/s41593-022-01094-6.
Supplementary information The online version contains supplementary material available at https://doi.org/10.1038/s41593-022-01094-6.
Data availability
The file ‘hyphochytrium_catenoides_predicted_proteins_renamed_modified. fasta’ that contains the sequence information of predicted H. catenoides proteins is available from https://www.ebi.ac.uk/biostudies/studies/S-BSST46. The whole genome shotgun sequences FLMG00000000.1 and CAFC00000000.2 are available from https://www.ncbi.nlm.nih.gov/nuccore/FLMG00000000.1 and https://www.ncbi.nlm.nih.gov/nuccore/CAFC00000000.2, respectively. The sequences of HcKCR1 and HcKCR2 expression constructs are available from GenBank (accession numbers MZ826861 and MZ826862, respectively). The plasmids encoding HcKCR1-mCherry, HcKCR2-mCherry, HcKCR1-EYFP and HcKCR2-EYFP in a mammalian expression vector backbone are available from Addgene (plasmids 177336, 177337, 182021 and 182022, respectively). Source data are provided with this paper.
Code availability
LogPro, custom software used for logarithmic filtration (noise reduction) of photocurrent traces, is freely available at Zenodo (https://zenodo.org/record/6461999#.Yl7Zx-jMIuF.
References
- 1.MacKinnon R Potassium channels. FEBS Lett. 555, 62–65 (2003). [DOI] [PubMed] [Google Scholar]
- 2.Mironenko A, Zachariae U, de Groot BL & Kopec W The persistent question of potassium channel permeation mechanisms. J. Mol. Biol 433, 167002 (2021). [DOI] [PubMed] [Google Scholar]
- 3.Sineshchekov OA, Jung K-H & Spudich JL Two rhodopsins mediate phototaxis to low- and high-intensity light in Chlamydomonas reinhardtii. Proc. Natl Acad. Sci. USA 99, 8689–8694 (2002). [DOI] [PMC free article] [PubMed] [Google Scholar]
- 4.Nagel G et al. Channelrhodopsin-1: a light-gated proton channel in green algae. Science 296, 2395–2398 (2002). [DOI] [PubMed] [Google Scholar]
- 5.Nagel G et al. Channelrhodopsin-2, a directly light-gated cation-selective membrane channel. Proc. Natl Acad. Sci. USA 100, 13940–13945 (2003). [DOI] [PMC free article] [PubMed] [Google Scholar]
- 6.Deisseroth K Optogenetics. Nat. Methods 8, 26–29 (2011). [DOI] [PMC free article] [PubMed] [Google Scholar]
- 7.Sineshchekov OA, Govorunova EG, Li H & Spudich JL Bacteriorhodopsin-like channelrhodopsins: alternative mechanism for control of cation conductance. Proc. Natl Acad. Sci. USA 114, E9512–E9519 (2017). [DOI] [PMC free article] [PubMed] [Google Scholar]
- 8.Boyden ES, Zhang F, Bamberg E, Nagel G & Deisseroth K Millisecond-timescale, genetically targeted optical control of neural activity. Nat. Neurosci 8, 1263–1268 (2005). [DOI] [PubMed] [Google Scholar]
- 9.Govorunova EG, Sineshchekov OA, Liu X, Janz R & Spudich JL Natural light-gated anion channels: a family of microbial rhodopsins for advanced optogenetics. Science 349, 647–650 (2015). [DOI] [PMC free article] [PubMed] [Google Scholar]
- 10.Mahn M, Prigge M, Ron S, Levy R & Yizhar O Biophysical constraints of optogenetic inhibition at presynaptic terminals. Nat. Neurosci 19, 554–556 (2016). [DOI] [PMC free article] [PubMed] [Google Scholar]
- 11.Messier JE, Chen H, Cai ZL & Xue M Targeting light-gated chloride channels to neuronal somatodendritic domain reduces their excitatory effect in the axon. eLife 7, e38506 (2018). [DOI] [PMC free article] [PubMed] [Google Scholar]
- 12.Richards R & Dempski RE Re-introduction of transmembrane serine residues reduce the minimum pore diameter of channelrhodopsin-2. PLoS One 7, e50018 (2012). [DOI] [PMC free article] [PubMed] [Google Scholar]
- 13.Alberio L et al. A light-gated potassium channel for sustained neuronal inhibition. Nat. Methods 15, 969–976 (2018). [DOI] [PMC free article] [PubMed] [Google Scholar]
- 14.Beck S et al. Synthetic light-activated ion channels for optogenetic activation and inhibition. Front. Neurosci 12, 643 (2018). [DOI] [PMC free article] [PubMed] [Google Scholar]
- 15.Bernal Sierra YA et al. Potassium channel-based optogenetic silencing. Nat. Commun 9, 4611 (2018). [DOI] [PMC free article] [PubMed] [Google Scholar]
- 16.Leonard G et al. Comparative genomic analysis of the ‘pseudofungus’ Hyphochytrium catenoides. Open Biol. 8, 170184 (2018). [DOI] [PMC free article] [PubMed] [Google Scholar]
- 17.Tucker K, Sridharan S, Adesnik H & Brohawn SG Cryo-EM structures of the channelrhodopsin ChRmine in lipid nanodiscs. Preprint at BioRxiv 10.1101/2021.11.21.469454 (2021). [DOI] [PMC free article] [PubMed] [Google Scholar]
- 18.Kishi KE et al. Structural basis for channel conduction in the pump-like channelrhodopsin ChRmine. Cell 185, 672–689.e623 (2022). [DOI] [PMC free article] [PubMed] [Google Scholar]
- 19.Hille B Ion Channels of Excitable Membranes (Sinauer Associates, 2001). [Google Scholar]
- 20.Eisenman G & R H Ionic selectivity revisited: the role of kinetic and equilibrium processes in ion permeation through channels. J. Membr. Biol 76, 197–225 (1983). [DOI] [PubMed] [Google Scholar]
- 21.Feldbauer K et al. Channelrhodopsin-2 is a leaky proton pump. Proc. Natl Acad. Sci. USA 106, 12317–12322 (2009). [DOI] [PMC free article] [PubMed] [Google Scholar]
- 22.Sineshchekov OA, Govorunova EG, Wang J, Li H & Spudich JL Intramolecular proton transfer in channelrhodopsins. Biophys. J 104, 807–817 (2013). [DOI] [PMC free article] [PubMed] [Google Scholar]
- 23.Sineshchekov OA, Govorunova EG, Li H & Spudich JL Gating mechanisms of a natural anion channelrhodopsin. Proc. Natl Acad. Sci. USA 112, 14236–14241 (2015). [DOI] [PMC free article] [PubMed] [Google Scholar]
- 24.Kuhne J et al. Unifying photocycle model for light adaptation and temporal evolution of cation conductance in channelrhodopsin-2. Proc. Natl Acad. Sci. USA 116, 9380–9389 (2019). [DOI] [PMC free article] [PubMed] [Google Scholar]
- 25.Ernst OP et al. Microbial and animal rhodopsins: structures, functions, and molecular mechanisms. Chem. Rev 114, 126–163 (2014). [DOI] [PMC free article] [PubMed] [Google Scholar]
- 26.Kandori H Biophysics of rhodopsins and optogenetics. Biophys. Rev 12, 355–361 (2020). [DOI] [PMC free article] [PubMed] [Google Scholar]
- 27.Lanyi JK Proton transfers in the bacteriorhodopsin photocycle. Biochim. Biophys. Acta 1757, 1012–1018 (2006). [DOI] [PubMed] [Google Scholar]
- 28.Dreier MA et al. Time-resolved spectroscopic and electrophysiological data reveal insights in the gating mechanism of anion channelrhodopsin. Commun. Biol 4, 578 (2021). [DOI] [PMC free article] [PubMed] [Google Scholar]
- 29.Verhoefen MK et al. The photocycle of channelrhodopsin-2: ultrafast reaction dynamics and subsequent reaction steps. ChemPhysChem 11, 3113–3122 (2010). [DOI] [PubMed] [Google Scholar]
- 30.Govorunova EG, Sineshchekov OA & Spudich JL Structurally distinct cation channelrhodopsins from cryptophyte algae. Biophys. J 110, 2302–2304 (2016). [DOI] [PMC free article] [PubMed] [Google Scholar]
- 31.Yamauchi Y et al. Molecular properties of a DTD channelrhodopsin from Guillardia theta. Biophys. Physicobiol 14, 57–66 (2017). [DOI] [PMC free article] [PubMed] [Google Scholar]
- 32.Sineshchekov OA et al. Conductance mechanisms of rapidly desensitizing cation channelrhodopsins from cryptophyte algae. mBio 11, e00657–00620 (2020). [DOI] [PMC free article] [PubMed] [Google Scholar]
- 33.Oppermann J et al. MerMAIDs: a family of metagenomically discovered marine anion-conducting and intensely desensitizing channelrhodopsins. Nat. Commun 10, 3315 (2019). [DOI] [PMC free article] [PubMed] [Google Scholar]
- 34.Klapoetke NC et al. Independent optical excitation of distinct neural populations. Nat. Methods 11, 338–346 (2014). [DOI] [PMC free article] [PubMed] [Google Scholar]
- 35.Govorunova EG et al. RubyACRs, non-algal anion channelrhodopsins with highly red-shifted absorption. Proc. Natl Acad. Sci. USA 117, 22833–22840 (2020). [DOI] [PMC free article] [PubMed] [Google Scholar]
- 36.Hoffmann M et al. Color tuning in rhodopsins: the mechanism for the spectral shift between bacteriorhodopsin and sensory rhodopsin II. J. Am. Chem. Soc 128, 10808–10818 (2006). [DOI] [PubMed] [Google Scholar]
- 37.Wiegert JS, Mahn M, Prigge M, Printz Y & Yizhar O Silencing neurons: tools, applications, and experimental constraints. Neuron 95, 504–529 (2017). [DOI] [PMC free article] [PubMed] [Google Scholar]
- 38.Plugge B et al. A potassium channel protein encoded by chlorella virus PBCV-1. Science 287, 1641–1644 (2000). [DOI] [PubMed] [Google Scholar]
- 39,Prakash R et al. Two-photon optogenetic toolbox for fast inhibition, excitation and bistable modulation. Nat. Methods 9, 1171–1179 (2012). [DOI] [PMC free article] [PubMed] [Google Scholar]
- 40.Adesnik H & Abdeladim L Probing neural codes with two-photon holographic optogenetics. Nat. Neurosci 24, 1356–1366 (2021). [DOI] [PMC free article] [PubMed] [Google Scholar]
- 41.Papagiakoumou E et al. Scanless two-photon excitation of channelrhodopsin-2. Nat. Methods 7, 848–854 (2010). [DOI] [PMC free article] [PubMed] [Google Scholar]
- 42.Govorunova EG et al. Cation and anion channelrhodopsins: sequence motifs and taxonomic distribution. MBio 12, e0165621 (2021). [DOI] [PMC free article] [PubMed] [Google Scholar]
- 43.Krogh A, Larsson B, von Heijne G & Sonnhammer EL Predicting transmembrane protein topology with a hidden Markov model: application to complete genomes. J. Mol. Bid 305, 567–580 (2001). [DOI] [PubMed] [Google Scholar]
- 44.Minh BQ et al. IQ-TREE 2: new models and efficient methods for phylogenetic inference in the genomic era. Mol. Biol. Evol 37, 1530–1534 (2020). [DOI] [PMC free article] [PubMed] [Google Scholar]
- 45.Hoang DT, Chernomor O, von Haeseler A, Minh BQ & Vinh LS UFBoot2: improving the ultrafast bootstrap approximation. Mol. Biol. Evol 35, 518–522 (2018). [DOI] [PMC free article] [PubMed] [Google Scholar]
- 46.Letunic I & Bork P Interactive Tree Of Life (iTOL) v5: an online tool for phylogenetic tree display and annotation. Nucleic Acids Res. 49, W293–W296 (2021). [DOI] [PMC free article] [PubMed] [Google Scholar]
- 47.Spudich JL LogPro. Zenodo 10.5281/zenodo.6461999 (2022). [DOI] [Google Scholar]
- 48.Waschuk SA, Bezerra AGJ, Shi L & Brown LS Leptosphaeria rhodopsin: bacteriorhodopsin-like proton pump from a eukaryote. Proc. Natl Acad. Sci. USA 102, 6879–6883 (2005). [DOI] [PMC free article] [PubMed] [Google Scholar]
- 49.Xue M, Atallah BV & Scanziani M Equalizing excitation-inhibition ratios across visual cortical neurons. Nature 511, 596–600 (2014). [DOI] [PMC free article] [PubMed] [Google Scholar]
Associated Data
This section collects any data citations, data availability statements, or supplementary materials included in this article.
Supplementary Materials
Data Availability Statement
The file ‘hyphochytrium_catenoides_predicted_proteins_renamed_modified. fasta’ that contains the sequence information of predicted H. catenoides proteins is available from https://www.ebi.ac.uk/biostudies/studies/S-BSST46. The whole genome shotgun sequences FLMG00000000.1 and CAFC00000000.2 are available from https://www.ncbi.nlm.nih.gov/nuccore/FLMG00000000.1 and https://www.ncbi.nlm.nih.gov/nuccore/CAFC00000000.2, respectively. The sequences of HcKCR1 and HcKCR2 expression constructs are available from GenBank (accession numbers MZ826861 and MZ826862, respectively). The plasmids encoding HcKCR1-mCherry, HcKCR2-mCherry, HcKCR1-EYFP and HcKCR2-EYFP in a mammalian expression vector backbone are available from Addgene (plasmids 177336, 177337, 182021 and 182022, respectively). Source data are provided with this paper.
LogPro, custom software used for logarithmic filtration (noise reduction) of photocurrent traces, is freely available at Zenodo (https://zenodo.org/record/6461999#.Yl7Zx-jMIuF.


