Abstract
Background
Large-volume therapeutic thoracocentesis may be associated with pulmonary congestion or a more serious complication; re-expansion pulmonary edema (RPE). We investigated whether monitoring pleural pressure with manometry during thoracocentesis would prevent these pulmonary symptoms/RPE and allow larger volume drainage.
Methods
We did a randomized controlled trial involving 110 patients with large malignant pleural effusions. Patients were randomly allocated to obtain thoracocentesis with or without pleural manometry. We measured the incidence of pulmonary congestion symptoms, total fluid aspirated, and pleural pressures in both groups. This trial is listed on ClinicalTrials.gov as NCT04420663.
Results
The mean amount of total thoracocentesis fluid withdrawn from the control group was 945.4±78.9 (mL) and 1690.9±681.0 (mL) from the intervention group (P<0.001). Clinical symptoms of pulmonary congestion appeared in (n=20) (36.3%) of patients in the intervention group while no symptoms appeared in controls (P<0.001). The difference between opening and closing pressures between the non-symptomatic cluster and the symptomatic cluster was (32.8±15.6 versus 42.2±13) respectively (P=0.02). Total fluid withdrawn from the non-symptomatic cluster was 1828.5±505 mL in comparison to 1,450±875 mL in the symptomatic cluster (P=0.04).
Conclusion
Pleural manometry can be used to increase the volume of fluid removed on each occasion in patients with malignant pleural effusion. In our study, pleural manometry was associated with a larger number of pulmonary congestion symptoms/RPE. We believe that manometry may be a useful tool to not exceed a 17 cm H2O gradient in pleural pressure which should be avoided to prevent pulmonary congestion symptoms or RPE. Pulmonary congestion symptoms/RPE are not related to the amount of volume withdrawn but to the gradient of pleural pressure drop. Our conclusion does support the adoption of pleural manometry whenever large-volume thoracocentesis is intended.
Keywords: malignant pleural effusion, pleural effusion, manometer, manometry, pleural mesothelioma, thoracocentesis
INTRODUCTION
Pleural effusion is detected in over 1.5 million patients in the United States each year, making therapeutic thoracocentesis one of the most prevalent medical procedures [1].
The activity of the respiratory muscles causes cyclic variations in pleural pressure, which are directly responsible for both inspiration and expiration [1]. Throughout the breathing cycle, pleural pressure stays lower than atmospheric pressure under normal physiological circumstances. Normally, sub-atmospheric cyclic fluctuations in pleural pressure (between –3 to –5 cm H2O and –6 to –8 cm H2O) are important in respiratory physiology [1, 2].
Both pneumothorax and pleural effusion frequently result in increased pleural pressure, which may be accompanied by clinical symptoms and a decrease in total lung capacity. Pneumothorax aspiration and large-volume therapeutic thoracocentesis, on the other hand, may be accompanied by a considerable drop in pleural pressure [2]. Despite this, certain data do not support that pleural manometry and its usual usage during thoracocentesis because it does not alter procedure-related chest discomfort [3]. It has been proposed that an uncontrolled reduction in pleural pressure is one of the mechanisms implicated in the development of several significant thoracocentesis consequences, such as pulmonary congestion or re-expansion pulmonary edema (RPE) [2].
Large amounts of pleural effusion can be safely evacuated if the pleural pressure does not fall below –20 cm H2O [4]; however, the risk of RPE pathogenesis seemed to be related to the degree of the pleural pressure decrease rather than the volume of pleural fluid drained. However, because pleural manometry was not generally accessible, the authors advised that the volume of removed pleural effusion fluid should not exceed 1,000 mL unless pleural pressure was assessed [4]. The British Thoracic Society recommends limiting drainage to 1.5 L of fluid to minimize negative pleural pressure [5].
Because changes in pleural pressure cannot be anticipated using clinical or radiological data, direct, real-time monitoring of pleural pressure during therapeutic pleural procedures is the only option currently supported by literature to limit the risk of RPE [2]. Despite this, certain data do not support that pleural manometry and its usual usage during thoracocentesis because it does not alter procedure-related chest discomfort [3].
The definition and diagnosis of RPE depend primarily on clinical or radiologic criteria. Clinical criteria included the following: a new cough (lasting more than 20 min) [6], worsening dyspnea, hypoxia, tachypnea, or hemodynamic instability [7]. Radio-graphic criteria included a chest radiograph or computed tomography scan with a new finding of focal ground-glass opacities in a vascular distribution, in the absence of another clinical explanation [7].
Pulmonary congestion symptoms and RPE are mild and severe forms of the same pathological process. The prevalence of RPE is mainly unclear, although it has been found to range between 0.2% and 14% [7]. The great variations in RPE incidence came from that the majority of RPE patients are asymptomatic or have relatively minor pulmonary congestion symptoms, so the real incidence of RPE is likely underreported [8]. Also, some authors opted to measure RPE by constructing the research to measure pulmonary congestion symptoms such as chest tightness, pain, coughing and dyspnea [3]. Moreover, it may be unethical to proceed with thoracocentesis till RPE occurs.
It should be noted that previous data indicate that the mortality risk related to RPE might be as high as 20% in extreme situations when a chronically collapsed lung is rapidly re-expanded by evacuation of large amounts of air or fluid, usually with the application of high negative intrapleural pressure [9].
The primary objective was to measure the incidence of pulmonary congestion symptoms or RPE. The secondary objectives were to measure the total fluid aspirated during thoracocentesis and to measure pleural pressures during thoracocentesis.
The study aimed to monitor pleural pressure by manometry during thoracocentesis and see whether this intervention could prevent symptoms of pulmonary congestion or RPE or allow for larger volume drainage.
METHODS
Trial design
We conducted a randomized controlled trial between August 2019 and December 2021. We enrolled 110 patients with a significant volume of malignant pleural effusion who were referred to Ain Shams University, Faculty of Medicine Hospitals for therapeutic thoracocentesis.
We reported our trial guided by the CONSORT statement [10] for reporting randomized controlled trials. This randomized clinical study was listed on June 9, 2020 on ClinicalTrials.gov as NCT04420663.
The institutional review board authorized the study and ethics approval was provided on July 20, 2019 by the Ain Shams University Ethics Committee with IRB number: FWA 00017585.
Participants
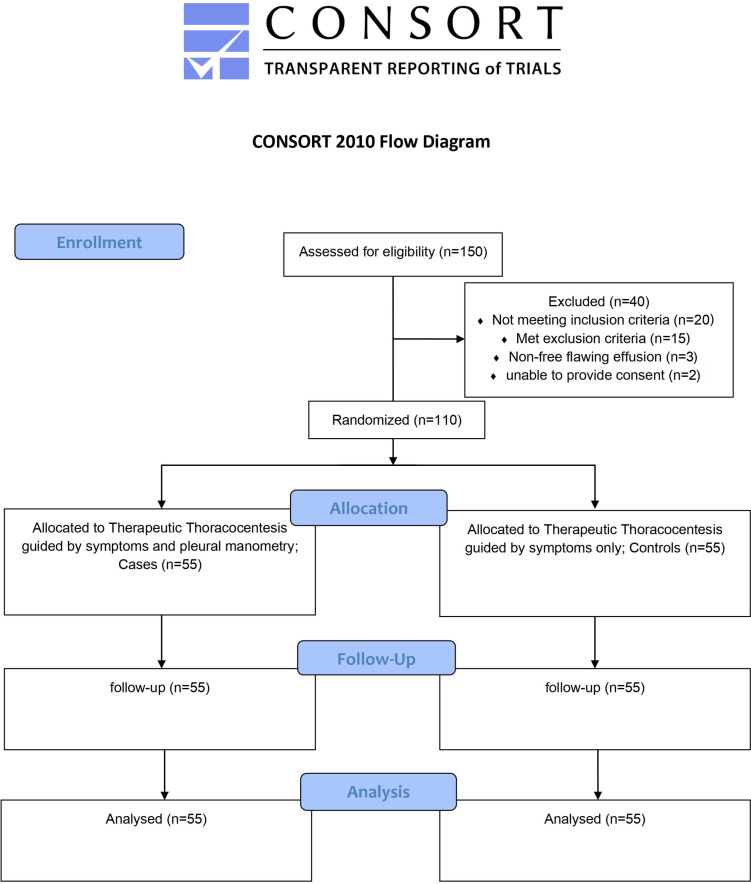
The current study examined 150 individuals. A total of 40 patients were ineligible for the present study: 20 patients didn’t match our inclusion criteria, 15 patients met our exclusion criteria, 3 patients have a non-free flawing effusion and 2 patients were unable to provide consent. A total of 110 patients were given thoracocentesis and were included in the final analysis (55 in each group) (Figure 1). Before therapeutic thoracocentesis, all patients provided informed written consent for pleural pressure monitoring (Table 1).
FIGURE 1.
Participants flow chart
TABLE 1.
Inclusion criteria and exclusion criteria
| Inclusion criteria | Exclusion criteria |
|---|---|
| 1) Age between 18 and 85 years | 1) Patients with non-malignant effusion |
| 2) Moderate to severe pleural effusion occupying at least one-third of the ipsilateral hemithorax in P-A chest radiograph (CXR) | 2) patients with very small amounts of pleural effusion |
| 3) No contraindications for therapeutic thoracocentesis | 3) patients on mechanical ventilation |
| 4) General health condition allowing prolonged therapeutic thoracocentesis 1) procedure | 4) patients on anti-coagulant therapy |
| 5) Patients with malignant pleural effusion are proven by pleural cytology or radiological criteria for malignancy (13). | 5) non-free-flowing effusions |
| 6) inability to maintain a seated position for the procedure | |
| 7) patients refusing to be subjected to thoracocentesis |
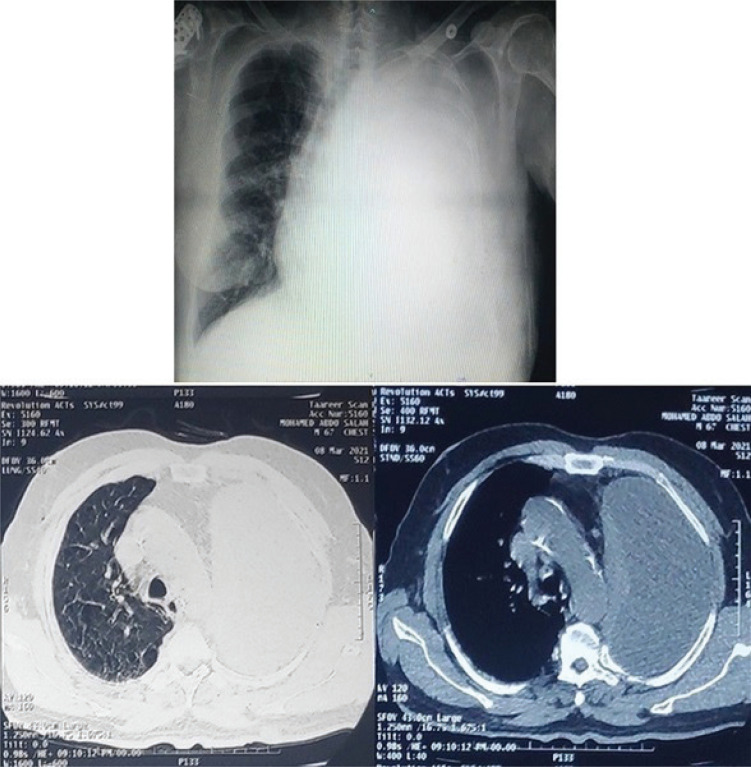
Patients were assigned randomly by computer to have thoracocentesis guided just by symptoms only (controls) or symptoms with pleural manometry (intervention). To determine the quantity of pleural effusion, we obtained a simple erect posteroanterior chest x-ray for each patient enrolled [11]. The extent of the effusion was evaluated using the well-known method of counting intercostal spaces (ICS) from the costophrenic angle (mild-localized to 1 ICS, moderate 2–3 ICS, severe 4 ICS) (Figure 2) [12].
FIGURE 2.
Plain P-A CXR and CT scan of a patient with severe left-sided pleural effusion
Interventions
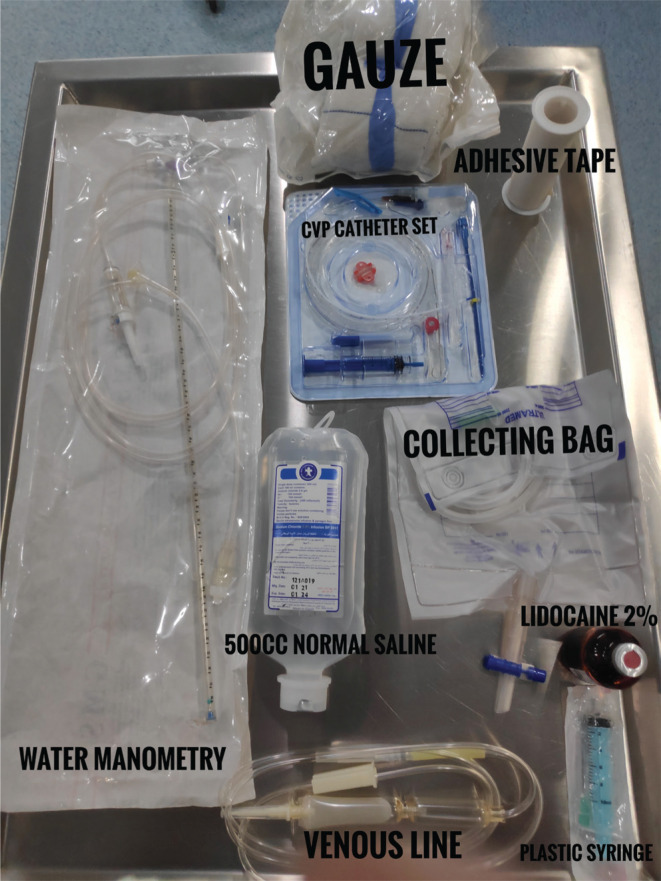
In the sitting position, therapeutic thoracocentesis was conducted. Betadine antiseptic solution was used to clean the skin. Pleural aspiration was performed in a sterile environment using full aseptic methods. As a local anesthetic, 5 to 10 cc of Lidocaine 2% was injected into the puncture site. We used a triple lumen central venous catheter kit, 7 Fr; (Amecath, AMECO MEDICAL INDUSTRIES, Cairo, Egypt) as a pleural catheter (Figure 3).
FIGURE 3.
Thoracocentesis guided by manometry tool kit
In the dependent region defined by auscultation of one intercostal space above the diaphragm. The catheter was introduced into the pleural cavity using the Seldinger method [14].
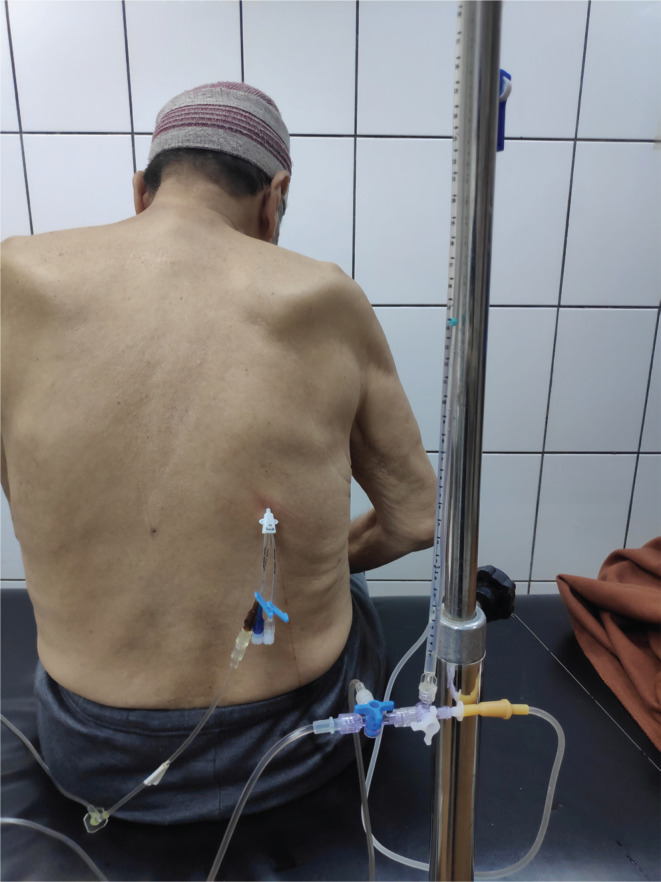
The kit needle is moved forward until fluid is aspirated. The wire was inserted guided by the needle to the pleural cavity, then the needle was removed. Then the kit was introduced over the guide wire into the pleural cavity. The kit’s widest lumen port line was connected to a 3-way adaptor; an infusion line is attached to one side port of the 3-way adapter which drains into the drainage collection bag and the other side port of the 3-way adapter is connected to a 50 cm plastic syringe for suctioning the pleural fluid under negative pressure. The other kit lumen port was connected to another 3-way adaptor; one side port of the 3-way adapter is pre-flushed with normal saline and attached to an infusion line connected to a basic water manometer (Figure 4) and the other side port of the 3-way adapter is connected to a 500 mL bag of normal saline for flushing. Then, the vertical reference point for the pressure of zero was established at the level of catheter insertion into the back.
FIGURE 4.
Patient during thoracocentesis guided by pleural manometry kit used in our study
Before the start of pleural fluid aspiration, opening pleural pressure was measured which is defined as the pleural pressure on introduction of the catheter. After that, the pleural fluid was aspirated and pleural pressure was measured during silent tidal breathing after every 200 mL of pleural fluid withdrawal until the fluid withdrawal was terminated. The closure pressure was determined by the last measured pressure.
When one of the following events happened, the pleural fluid aspiration was terminated: 1) Thoracocentesis completion is defined as no more fluid in the pleural cavity as no more pleural fluid coming from the catheter, 2) Thoracocentesis incompletion is defined as poor procedure tolerance, that is, the new development or exacerbation of preexisting symptoms (eg, dyspnea, coughing, chest pain, tachycardia), 3) closing pleural pressure of –30 cm water in the manometry group (intervention), 4) fluid withdrawal of 1,000 mL in the control group.
Outcomes
All patients’ demographics, opening, subsequent pleural pressures, closing pressure, total fluid volume extracted, complaints with the original diagnosis, Medical Research Council (MRC) dyspnea score [15], amount of effusion in pre-and post-procedural CXR, post-procedural lung re-inflation status; determined by the presence of residual effusion, pre-and post-procedural SpO2 were monitored and recorded.
Sample size
According to Feller-Kopman et al [7] who reported the rate of RPE during large volume thoracocentesis, a statistical calculator based on the upper limit of the 95% confidence interval of RPE symptoms rate to provide 80% power with a probability of a type I error set at =0.05, would require a sample of 99 patients. An additional 10% (10 patients) is required to accommodate for the risk of dropouts. Thus, 110 patients are needed for the total sample size; 55 patients per group. The sample size was calculated using the MedCalc version 12.3.0.0 program “Ostend, Belgium”.
Randomization
We randomly allocated patients to either thoracocentesis guided just by symptoms (controls) or thoracocentesis guided by symptoms plus manometry (intervention). The group assignment was produced by a computer. A study assistant created sealed opaque envelopes with group allocations.
Blinding
Patients were not informed of their research group assignment. The researchers presented all patients with a manometer and informed them that if the manometer was used, there would be frequent short pauses in drainage. A thoracocentesis catheter was inserted into the posterior hemithorax of a sitting patient, and a manometer was connected to the catheter approximately at the patient’s skin so that they couldn’t see if the manometer was being used. Pleural pressure data were not reported verbally to preserve the masking of the research group during the procedure.
Statistical methods
Data were statistically examined using SPSS software. Means and standard deviations for continuous variables, percentages, and frequencies for categorical variables were all part of the descriptive statistics. For statistical analysis, we assumed normality and homoscedasticity. For quantitative data analysis, hypothesis Student’s t tests were used, while qualitative data (ordinal, categorical) was evaluated using the χ2. For all statistical comparisons, a P-value of 0.05 is considered significant, while a P-value of 0.01 is considered extremely significant.
We performed two predetermined main sub-analyses: a subgroup analysis of the outcomes between intervention and control groups. The second sub-analysis was performed by comparing the clusters that experienced pulmonary congestion symptoms or RPE and those that did not to determine the most important determinants causing this pathophysiology.
RESULTS
Baseline data
The control group had a mean age of 59.6±7.4 years while the intervention group had a mean age of 61.6±9.2 years. The control group had 34 (61.8%) men, whereas the intervention group included 37 (67.2%) men. Mesothelioma (n=100) was the most frequent malignancy, with 10 individuals suffering from lung cancer. According to the occupied zones on chest x-ray, 38 (69%) patients in the control group showed significant pleural effusion, compared with 42 (76.3%) in the intervention group. All patients (n=110) had dyspnea as their pre-procedural primary complaint. The mean pre-thoracocentesis oxygen saturation in the control group was 93.9±3.8 against 94.1±2.4 in the intervention group.
At baseline, there was no significant difference in age, sex, complaint (chest discomfort and MRC dyspnea score), pleural fluid appearance, amount of malignant pleural effusion in CXR, initial diagnosis, laterality of thoracocentesis, or pre-thoracocentesis oxygen saturation between the intervention and controls groups (P>0.05) (Table 2).
TABLE 2.
The difference between the intervention and controls group in demographics and pre-procedural status
| Controls (n=55) | Intervention (n=55) | P | ||
|---|---|---|---|---|
| Age (year) | 59.6±7.4 | 61.6±9.2 | NS | |
| Sex (%) | ManH | 34 (61.8) | 37 (67.2) | NS |
| Amount of effusion (degree) (%) | Moderate | 17 (30.9) | 13 (23.6) | NS |
| Severe | 38 (69) | 42 (76.3) | NS | |
| MRC dyspnea score (pre) (%) | MRC IV | 41 (74.5) | 43 (78.1) | NS |
| MRC V | 14 (25.4) | 12 (21.8) | ||
| Pleuritic chest pain (pre) (%) | Yes | 16 (29.1) | 17 (30.9) | NS |
| Oxygen saturation% (pre) | 93.9±3.8 | 94.1±2.4 | NS |
NS not significant.
Outcomes and estimation
Therapeutic thoracocentesis
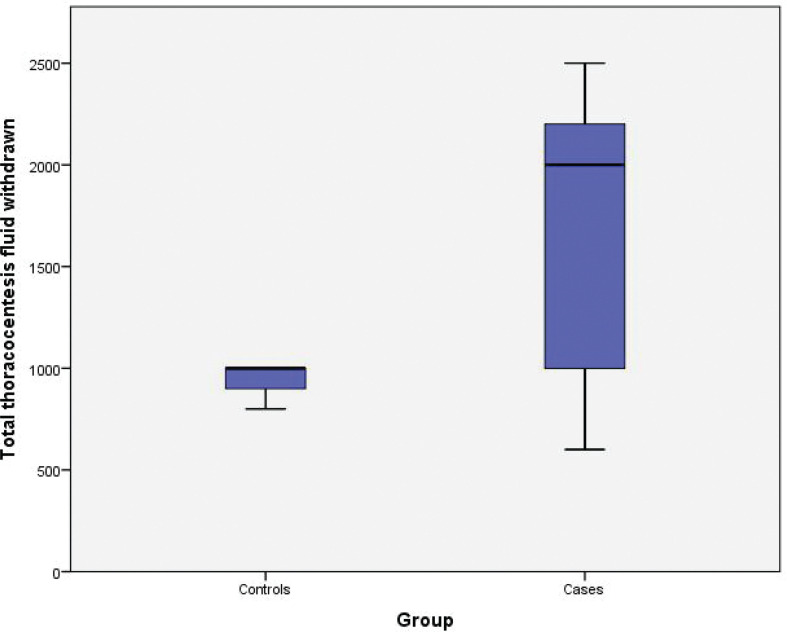
The average quantity of fluid withdrawn from the controls was 945.4±78.9 mL, compared with 1,690.9±681.0 mL from the intervention group (P<0.001) (Figure 5). The procedure stopped in (n=20). 36.3% of the participants in the intervention group had clinical symptoms of pulmonary congestion or RPE. Coughing was experienced by (n=10) 18.1% of patients during drainage and (n=10) 18.1% of patients suffered coughing and exacerbation of MRC dyspnea score, although controls showed no evidence of pulmonary congestion symptoms (P<0.001). Moreover, none of the patients in both groups showed radiological signs of RPE in the post-procedural CXR. The post-thoracocentesis oxygen saturation in the controls was 94.7±33.4 against 92.3±63.1 in the intervention (P<0.001). The completion of thoracocentesis was in 20 (36.4%) of the controls and 35 (63.6%) of the intervention (P=0.004). In comparison to zero patients in controls, 40 (72.7%) of intervention were assessed to have re-inflated lungs without (residual) pleural fluid following the procedure (P<0.001). In the control group, 55 (100%) of post-procedural CXRs showed inadequate drainage with persisting malignant pleural effusion and a non-inflated lung, compared with 15 (27.3%) in the intervention group (P<0.001) (Table 3).
FIGURE 5.
Box blot demonstrating the difference in the total thoracocentesis fluid withdrawn between cases and controls
TABLE 3.
The difference between the intervention and controls group in post-procedural status.
| Controls (n=55) | Intervention (n=55) | P | ||
|---|---|---|---|---|
| Total thoracocentesis fluid withdrew value (mL) | 945.4±78.9 | 1690.9±681.0 | <0.001 | |
| Thoracocentesis completion (%) | 20 (36.4) | 35 (63.6) | 0.004 | |
| Symptoms of pulmonary congestion (%) | No symptoms | 55 (100.0) | 35 (63.6) | <0.001 |
| Cough | 0 | 10 (18.1) | ||
| Cough and Dyspnea | 0 | 10 (18.1) | ||
| CXR (post) (%) | Re-inflated lung | 0 | 40 (72.7) | <0.001 |
| Pleural effusion | 55 (100) | 15 (27.3) | ||
| Oxygen saturation% (post) | 94.73±3.4 | 92.36±3.1 | <0.001 |
Pleural pressures in the intervention group
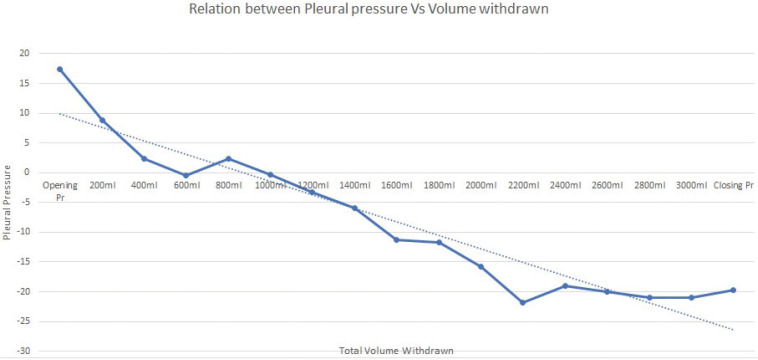
The mean opening pleural pressure at baseline was (17 ±11.7 cm H2O) while the mean closure pressure was (-19.1± 10.8 cm H2O). The average drop (pressure gradient) in pleural pressure was (36.2 ±15.3 cm H2O) (Figure 6) (Table 4).
FIGURE 6.
Relationship between total fluid withdrawn and pleural pressure in the cases group
TABLE 4.
Mean pleural pressures in the intervention group
| Pleural pressure | Number of patients | Mean±SD |
|---|---|---|
| Opening pleural pressure | 55 | 17.09±11.7 |
| Pleural pressure after withdrawal of 200 mL | 55 | 8.82±7.78 |
| Pleural pressure after withdrawal of 400 mL | 55 | 2.18±12.04 |
| Pleural pressure after withdrawal of 600 mL | 55 | –0.55±12.15 |
| Pleural pressure after withdrawal of 800 mL | 45 | 2.22±8.01 |
| Pleural pressure after withdrawal of 1,000 mL | 45 | –0.44±7.97 |
| Pleural pressure after withdrawal of 1,200 mL | 40 | –3.25±8.03 |
| Pleural pressure after withdrawal of 1,400 mL | 40 | –6.00±7.91 |
| Pleural pressure after withdrawal of 1,600 mL | 35 | –11.29±11.24 |
| Pleural pressure after withdrawal of 1,800 mL | 30 | –11.67±5 |
| Pleural pressure after withdrawal of 2,000 mL | 25 | –15.80±5.53 |
| Pleural pressure after withdrawal of 2,200 mL | 25 | –21.80±7.45 |
| Pleural pressure after withdrawal of 2,400 mL | 10 | –19.00±0 |
| Pleural pressure after withdrawal of 2,600 mL | 5 | –20.00±0 |
| Pleural pressure after withdrawal of 2,800 mL | 5 | –21.00±0 |
| Pleural pressure after withdrawal of 3,000 mL | 5 | –21.00±0 |
| Closing pleural pressure | 55 | –19.18±10.86 |
Ancillary analyses
Pulmonary congestion symptoms or RPE in the intervention group
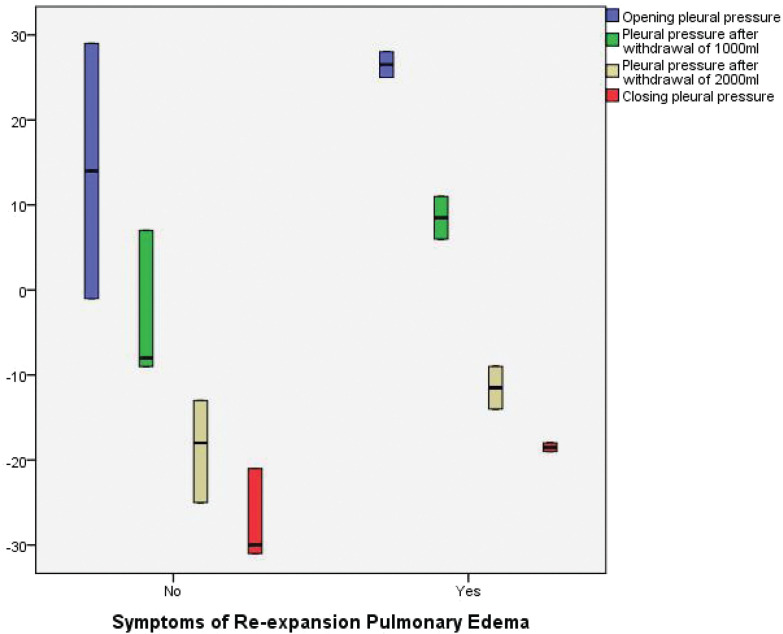
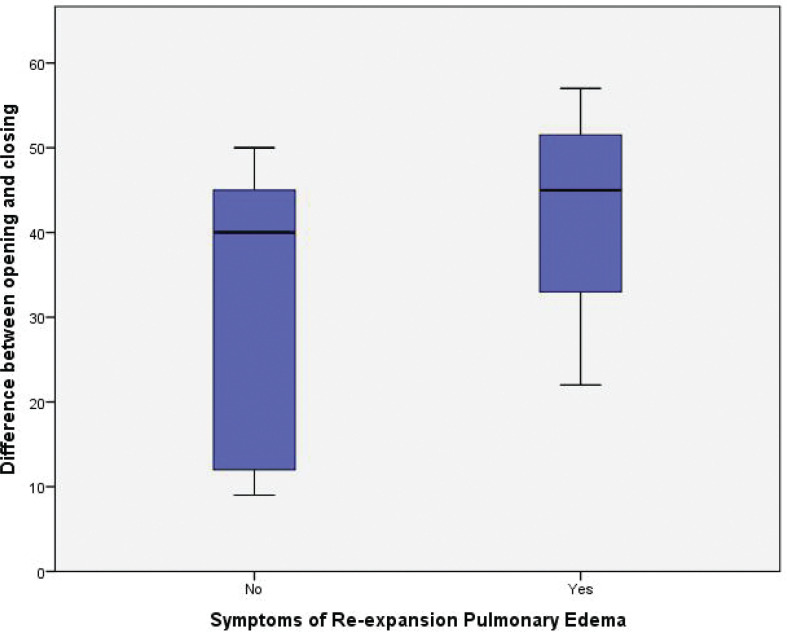
Pulmonary congestion/RPE symptoms occurred in 20 patients (symptomatic cluster) (36.3%) in the intervention group against zero patients in the control group (P<0.001). The mean pre-procedural oxygen saturation in the non-symptomatic cluster was 93.8±3.7% versus 94±4.1% in the symptomatic cluster (P=0.9). In the pre-procedural CXR, 25 (71.4%) patients in the non-symptomatic cluster had a severe degree of malignant pleural effusion, compared with 15 (75%) patients in the symptomatic cluster (P=0.8). The opening pleural pressure in the non-symptomatic cluster was 13.4±12.7 cm H2O compared with 23.5±5.7 cm H2O in the symptomatic cluster (P=0.002). While the non-symptomatic cluster had a closing pleural pressure of –19.4±12.3 cm H2O, the symptomatic cluster had a closing pleural pressure of –18.7±79 cm H2O (P=0.8) (Figure 7). The difference in opening and closing pressures (pressure gradient) was statistically significant between the non-symptomatic cluster and symptomatic cluster (32.8±15.6 versus 42.2±13) respectively (P<0.02) (Figure 8; Table 5).
FIGURE 7.
Box blots demonstrating the difference in Opening pleural pressure (cm H2O), Pleural pressure after withdrawal of 1000 mL (cm H2O), Pleural pressure after withdrawal of 2000 mL (cm H2O), Closing pleural pressure (cm H2O) between symptomatic and non-symptomatic group
FIGURE 8.
Box blots demonstrating the difference in opening and closing pressures (pressure gradient) between the non-symptomatic cluster and symptomatic cluster
TABLE 5.
The difference between symptomatic cluster and non-symptomatic cluster
| Symptoms of pulmonary congestion/RPE |
P | |||
|---|---|---|---|---|
| Non-symptomatic (n=35) | Symptomatic (n=20) | |||
| Age (year) | 60.7±10.9 | 63.2±4.6 | NS | |
| Sex (%) | Man | 20 (57.1) | 15 (75) | NS |
| Group (%) | Intervention (manometry) | 35 (63.6) | 20 (36.3) | <0.001 |
| Oxygen saturation (pre)% | 93.8±3.7 | 94±4.1 | NS | |
| Oxygen saturation (post)% | 93.2±3.2 | 90.7±2.2 | 0.003 | |
| Amount of effusion(degree) (%) | Moderate | 10 (28.5) | 5 (25) | 0.04 |
| Severe | 25 (71.4) | 15 (75) | ||
| Opening pleural pressure (cm H2O) | 13.4±12.7 | 23.5±5.7 | 0.002 | |
| Pleural pressure after withdrawal of 1,000 mL (cm H2O) | –3±7 | 8.5±2.6 | <0.001 | |
| Pleural pressure after withdrawal of 2,000 mL (cm H2O) | –18.6±5 | –11.5±2.6 | <0.001 | |
| Closing pleural pressure (cm H2O) | –19.4±12.3 | –18.7±7.9 | NS | |
| Difference between opening and closing pressures (pressure gradient) | 32.8±15.6 | 42.2±13 | 0.02 | |
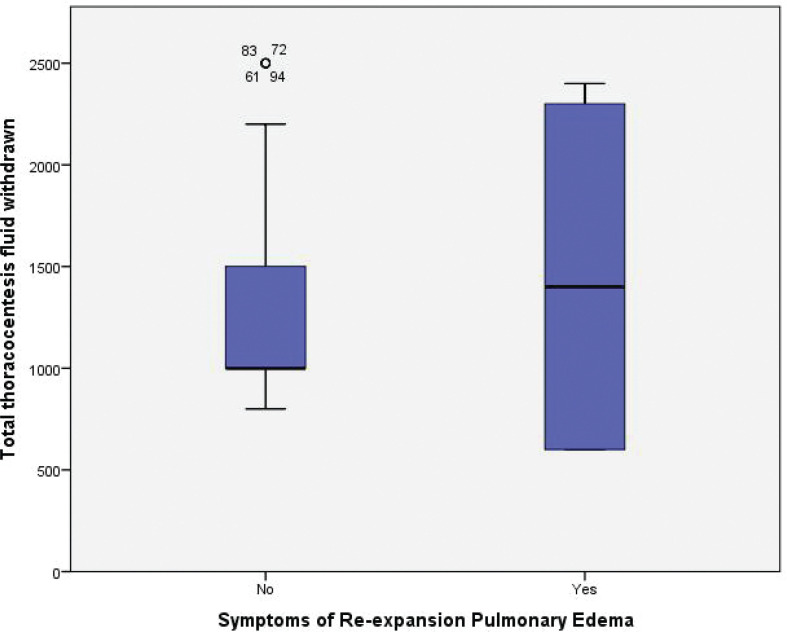
| Total thoracocentesis fluid is withdrawn (mL) | 1828.5±505 | 1,450±875 | 0.04 | |
| Thoracocentesis completion (%) | Complete thoracocentesis | 35 (100) | 0 | <0.001 |
| CXR (post) (%) | Residual pleural effusion | 0 | 15 (75) | <0.001 |
| Re-inflated lung | 35 (100) | 5 (25) | ||
NS not significant; RPE re-expansion pulmonary edema.
The total fluid aspirated from the non-symptomatic cluster was 1828.5±505 mL compared with 1450±875 mL in the symptomatic cluster (P=0.04) (Figure 9).
FIGURE 9.
Box blot demonstrating the difference in the total thoracocentesis fluid withdrawn between the symptomatic and non-symptomatic group
Harms
No harm or unintended effects happened to any patient in both groups.
DISCUSSION
Interpretation
In this randomized controlled trial, we evaluated patient clinical outcomes as well as pleural pressure during therapeutic thoracocentesis for large malignant pleural effusions. We found the average quantity of fluid withdrawn from the controls was 945.4±78.9 mL, compared with 1690.9±681.0 mL from the intervention group (P<0.001). Thus, we can aspirate more fluid greater than 1,000 mL while being directed by pleural pressure.
Our findings imply that routine use of manometry during thoracocentesis did not minimize symptoms of pulmonary congestion or RPE, but our subgroup analysis suggests that pulmonary congestion symptoms are preventable if fluid aspiration is stopped before a pleural pressure drop of 17 cm H2O. This number: 17 cm H2O came from the difference between mean opening and closing pressure in the non-symptomatic cluster minus its standard deviation; a cut-off value that had not any RPE symptom.
Our study found a link between the degree of pleural pressure drop or gradient; the difference between opening and closing pressure and pulmonary congestion symptoms after pleural fluid withdrawal. Except for one study, practically all investigations demonstrate a link between symptoms of pulmonary congestion/RPE and closing pleural pressure measures. Lentz and colleagues [3], advise avoiding exceeding 10 cm H2O during thoracocentesis. Based on the mean difference between opening and closure pressure in the non-symptomatic cluster minus the standard deviation, our findings indicate that the degree of pleural pressure drop during therapeutic thoracocentesis should not exceed 17 cm H2O.
The opening pleural pressure in the non-symptomatic cluster was 13.4±12.7 cm H2O compared with 23.5±5.7 cm H2O in the symptomatic cluster (P=0.002). Probably the gradient of pressure change rather than the closing pressure that relates to pulmonary congestion symptoms or RPE. Also, the group who start thoracocentesis at a much higher pleural pressure are subjecting the lung to some unusual forces that render them more likely to develop pulmonary congestion symptoms or RPE.
Several pathophysiological mechanisms have been suggested like increased vascular permeability, changes in lymphatic flow, decreased surfactant and changes in hydrostatic pressure in pulmonary vasculature during reexpansion [16].
The procedure stopped in (n=20). 36.3% of the participants in the intervention group had clinical symptoms of pulmonary congestion. We think that thoracocentesis which is guided by manometry pressure cut-off and symptoms rather than volume cut-off is the reason why more cases of RPE developed in the intervention group.
We found that the post-thoracocentesis oxygen saturation in the controls was 94.7±33.4 against 92.3±63.1 in the intervention (P<0.001) a finding of interest. Even though we had predefined RPE to be related to hypoxemia events, we assume that this data are explained by the development of pulmonary congestion symptoms in a considerable percentage of intervention patients.
The intervention group has a higher rate of thoracocentesis completion and fully re-inflated lung with lower rates of inadequate drainage, persistent pleural effusion, and non-inflated lung. These findings may conclude that using pleural manometry may increase the chances of a patient being completely drained from pleural effusion by using manometry during thoracocentesis.
In our study, the total fluid aspirated from the non-symptomatic cluster was 1828.5±505 mL compared with 1,450±875 mL in the symptomatic cluster (P=0.04), indicating that the volume of pleural fluid withdrawn does not associate with the development of symptoms but that a change in pleural pressure is more relevant.
Because of the classical belief that closing pleural fluid pressure below –20 cm H2O would render more incidence of RPE [4], we intended to choose a lower closing pressure to examine this belief. We finally found that the closing pleural pressure should not be an absolute indication for terminating pleural fluid withdrawal to prevent RPE, but the gradient between opening and closing pleural pressure should not exceed 17 cm H2O to be the major determinant of continuing thoracocentesis to prevent RPE.
Several studies have been conducted to examine varied patient outcomes when doing pleural manometry. They also concluded that the amount of pleural fluid evacuated has no relation to patient complaints such as chest discomfort or coughing but chest discomfort was related to lower closure pleural pressures and should be regarded as an indication to discontinue thoracocentesis [6].
Other studies found no significant difference in the number of patients who suffered chest pain or dyspnea when thoracocentesis was performed with manometry versus when the procedure was performed without manometry. [3, 17].
Generalizability
It is a straightforward and relatively safe method that may be included in standard pleural fluid thoracocentesis procedures. Also, pleural manometry may be more useful in treating patients with malignant pleural effusion, particularly in low-resource settings.
Furthermore, in the case of a significant pleural effusion, we may need to do a computerized tomography (CT) scan of the chest. If the CT scan is performed without completely emptying the pleural fluid, this can make CT interpretation more difficult. Using pleural manometry to guide a therapeutic thoracocentesis may help remove as much fluid as possible, increasing the possibility of information from the CT scan [18].
LIMITATIONS
Water manometers and electrical manometer devices are very simple. Both approaches have advantages and downsides. Water manometers are theoretically simple, inexpensive and user-friendly, but they cannot measure and record genuine instantaneous pleural pressure. This is due to continuous oscillations of the water column during respiration, as well as the system’s relatively high inertia and flow resistance when water is used as an indication. As a result, basic water manometers can only estimate the mean values of pleural pressure. Furthermore, abrupt pressure fluctuations, such as those seen when coughing, can considerably falsify the result [19].
There are various limitations to the present study. First, it was not intended to detect RPE by its radiological definition. However, because RPE is uncommon and we found it unethical to proceed in thoracocentesis till RPE occurs, we opted to construct the research to measure RPE by its clinical definition; pulmonary congestion symptoms such as coughing and dyspnea. Second, we chose a modest closure pressure; –30 cm H2O to end the procedure because a more negative pressure might have resulted in larger RPE cases in the intervention group which may end up unethical. Third, pleural pressure could only be accurately measured when fluid aspiration was halted by a water manometer. By using continuous digital pleural manometry, operators may be able to detect rapid changes in pleural pressure. However, digital manometers that provide continuous pleural manometry are not widely accessible in markets for normal clinical usage, thus we relied on the typical basic water manometer. Future comparison research with continuous manometry might be beneficial.
RECOMMENDATIONS
Pleural manometry can be used to increase the volume of fluid removed on each occasion in patients with malignant pleural effusion. In our study, pleural manometry was associated with a larger number of pulmonary congestion symptoms/RPE but the association doesn’t always imply causation. We believe that manometry may be a useful tool to not exceed a 17 cm H2O gradient in pleural pressure which should be avoided to prevent pulmonary congestion symptoms or RPE. Pulmonary congestion symptoms/RPE are not related to the amount of volume withdrawn but to the gradient of pleural pressure drop. Our conclusion does support the adoption of pleural manometry whenever large-volume thoracocentesis is intended.
Acknowledgment
We thank our cardiothoracic department members who helped us perform the present study.
DISCLOSURES
Ethical approval
The institutional review board authorized the study and ethics approval was provided on July 20, 2019 by the Ain Shams University Ethics Committee with IRB number: FWA 00017585. This randomized clinical study was listed on June 9, 2020 on clinicaltrials.gov as nct04420663.
Funding
No external funding was received.
Conflict of interest
The authors have no conflicts of interest.
Author Agreement
All authors have seen and approved the final version of the manuscript being submitted. They warrant that the article is the authors’ original work, hasn’t received before publication, and isn’t under consideration for publication elsewhere. All authors contributed equally to the data collection and manuscript writing.
Availability of data and material
The datasets used and/or analyzed during the current study are available from the corresponding author on reasonable request.
REFERENCES
- 1.Akulian J, Yarmus L, Feller-Kopman D. The evaluation and clinical application of pleural physiology. Clin Chest Med 2013;34(1):11–9. 10.1016/j.ccm.2012.11.001 [DOI] [PubMed] [Google Scholar]
- 2.Zielinska-Krawczyk M, Krenke R, Grabczak EM, Light RW. Pleural manometry–historical background, rationale for use and methods of measurement. Respir Med 2018;136:21–8. 10.1016/j.rmed.2018.01.013 [DOI] [PubMed] [Google Scholar]
- 3.Lentz RJ, Lerner AD, Pannu JK, et al. Routine monitoring with pleural manometry during therapeutic large-volume thoracocentesis to prevent pleural-pressure-related complications: A multicentre, single-blind randomised controlled trial. Lancet Respir Med 2019;7(5), 447–55. 10.1016/S2213-2600(18)30421-1 [DOI] [PubMed] [Google Scholar]
- 4.Light RW, Jenkinson SG, Minh VD, George RB. Observations on pleural fluid pressures as fluid is withdrawn during thoracocentesis. Am Rev Respir Dis 1980;121(5):799–804. 10.1164/arrd.1980.121.5.799 [DOI] [PubMed] [Google Scholar]
- 5.Ali Raza M. Management of a malignant pleural effusion: British Thoracic Society pleural disease guideline 2010. Yearbook Pulm Dis 2011;2011:119–22. 10.1016/j.ypdi.2011.03.017 [DOI] [PubMed] [Google Scholar]
- 6.Feller-Kopman D, Walkey A, Berkowitz D, Ernst A. The relationship of pleural pressure to symptom development during therapeutic thoracocentesis. Chest 2006;129(6):1556–60. 10.1378/chest.129.6.1556 [DOI] [PubMed] [Google Scholar]
- 7.Feller-Kopman D, Berkowitz D, Boiselle P, Ernst A. Large-volume thoracocentesis and the risk of reexpansion pulmonary edema. Ann Thorac Surg 2007;84(5):1656–61. 10.1016/j.athoracsur.2007.06.038 [DOI] [PubMed] [Google Scholar]
- 8.Kasmani R, Irani F, Okoli K, Mahajan V. Re-expansion pulmonary edema following thoracocentesis. Can Med Assoc J 2010;182(18):2000–2. 10.1503/cmaj.090672 [DOI] [PMC free article] [PubMed] [Google Scholar]
- 9.Mahfood S, Hix WR, Aaron BL, Blaes P, Watson DL. Reexpansion pulmonary edema. Ann Thorac Surg 1988;45(3):340–5. 10.1016/S0003-4975(10)62480-0 [DOI] [PubMed] [Google Scholar]
- 10.Schulz KF, Altman DG, Moher D. CONSORT 2010 statement: Updated guidelines for reporting parallel group randomised trials. BMJ (Online) 2010;340(7748):698–702. 10.1136/bmj.c332 [DOI] [Google Scholar]
- 11.Craig Blackmore C, Black WC, Dallas RV, Crow HC. Pleural fluid volume estimation: A chest radiograph prediction rule. Acad Radiol 1996;3(2):103–109. 10.1016/S1076-6332(05)80373-3 [DOI] [PubMed] [Google Scholar]
- 12.Brockelsby C, Ahmed M, Gautam M, ‘P1 Pleural effusion size estimation: US, CXR or CT? Thorax 2016;71(Suppl 3):A83. 10.1136/thoraxjnl-2016-209333.144. [DOI] [Google Scholar]
- 13.Moore AJ, Parker RJ, Wiggins J. Malignant mesothelioma. Orphanet J Rare Dis 2008;3(1):34. 10.1186/1750-1172-3-34 [DOI] [PMC free article] [PubMed] [Google Scholar]
- 14.Seldinger SI. Catheter replacement of the needle in percutaneous arteriography: A new technique. Acta Radiol 1953;39(5):368–76. 10.3109/00016925309136722 [DOI] [PubMed] [Google Scholar]
- 15.Fletcher CM. Standardised questionnaire on respiratory symptoms: A statement prepared and approved by the MRC Committee on the Aetiology of Chronic Bronchitis (MRC breathlessness score). BMJ 1960;2:1665. < https://cir.nii.ac.jp/crid/1574231875649636992.bib?lang=en> (Accessed on November 18, 2022).13688719 [Google Scholar]
- 16.Hirsch AW, Nagler J. Reexpansion Pulmonary Edema in Pediatrics. Pediatr Emerg Care 2018. Mar;34(3):216–220. 10.1097/PEC.0000000000001435. PMID: [DOI] [PubMed] [Google Scholar]
- 17.Pannu J, DePew ZS, Mullon JJ, Daniels CE, Hagen CE, Maldonado F. Impact of pleural manometry on the development of chest discomfort during thoracentesis: a symptom-based study. J Bronchology Interv Pulmonol 2014. Oct;21(4):306–13. 10.1097/LBR.0000000000000095. PMID: . [DOI] [PubMed] [Google Scholar]
- 18.Ravindran Chetambath SSD, Parengal J, Aslam M. A rare clinical case presenting as right lower zone shadow. Lung India 2018;35:173–175. 10.4103/lungindia.lungindia [DOI] [PMC free article] [PubMed] [Google Scholar]
- 19.Doelken P, Huggins JT, Pastis NJ, Sahn SA. Pleural manometry: Technique and clinical implications. Chest 2004;126(6):1764–1769. 10.1378/chest.126.6.1764 [DOI] [PubMed] [Google Scholar]
Associated Data
This section collects any data citations, data availability statements, or supplementary materials included in this article.
Data Availability Statement
The datasets used and/or analyzed during the current study are available from the corresponding author on reasonable request.


