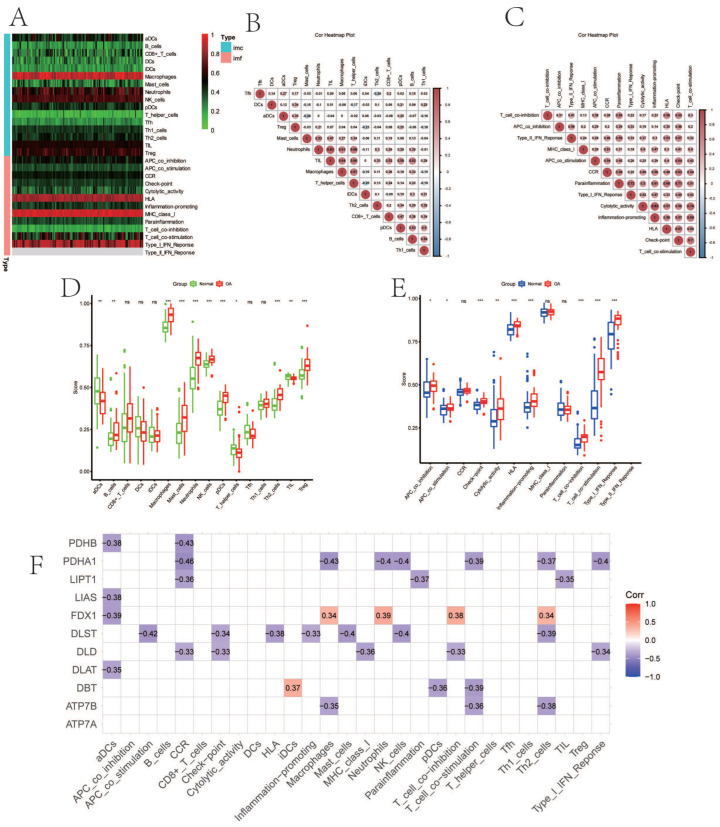
Figure 2.
The immune landscape and correlation analysis between CRGs and immune infiltration in OA. (A) Heatmap showing the expression characteristics of immune cells and immune function in OA and normal tissues. Red represents high expression levels, while green represents low expression levels. (B,C) The correlation analysis of immune cells (B) and immune function (C); positive correlation is represented by red, while negative correlation is represented by blue. (D,E) Boxplot showing differences in the expression of immune cells (D) and immune function (E) in OA and normal tissues. (F) Correlation between immune infiltration and CRGs; positive correlation is represented by red, while negative correlation is represented by blue. (For all figures: * represents p < 0.05, ** represents p < 0.01, and *** represents p < 0.001). CRGs, cuproptosis-related genes; OA, osteoarthritis.

