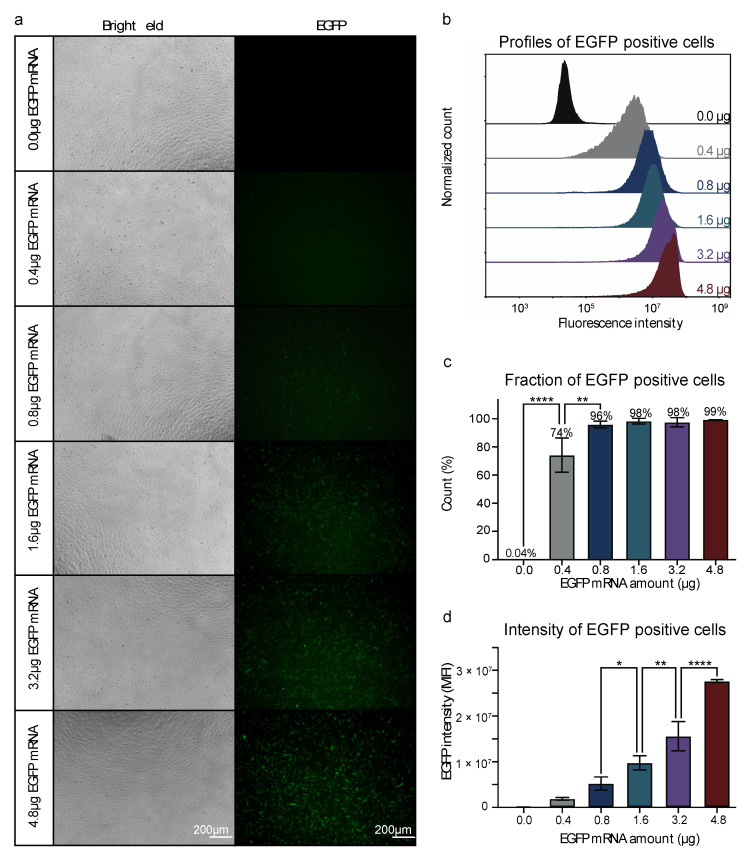
Figure 1.
Nucleofection of HUVECs with a titration of EGFP mRNA. (a) Visualization of the EGFP positive cells by fluorescent- and bright field microscopy. (b) The profiles of EGFP-positive HUVECs at each EGFP mRNA concentration. Values are presented as normalized counts of the fluorescent intensity. (c) Fraction of EGFP-positive HUVECs at each EGFP mRNA concentration. Values are presented as the mean percentage of EGFP-positive cells SD. Neighboring EGFP mRNA concentrations are compared by one-way ANOVA with Tukey multiple comparisons test, ** p ≤ 0.01, **** p ≤ 0.0001. (d) Median fluorescence intensity of EGFP-positive cells at each EGFP mRNA concentration. Values are presented as the mean SD. Neighboring EGFP mRNA concentrations are compared by one-way ANOVA with Tukey multiple comparisons test, * p ≤ 0.05, ** p ≤ 0.01, **** p ≤ 0.0001. (a–d): Experiments on HUVECs from one biological donor at p. 5 (n = 3).

