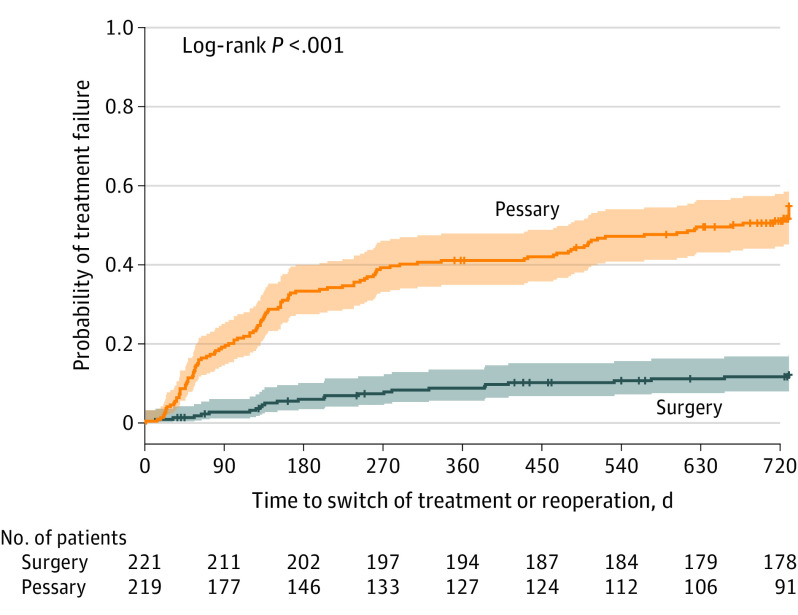
Figure 2. Time to Additional Treatment or Reoperation.
Colored shading indicates 95% CIs, and the vertical tick marks indicate patients who were censored. Pessary data indicate time to discontinuation of therapy or surgical intervention. Surgery data indicate time to repeat operation or start of additional use of pessary. The median failure observation time in the pessary group was 664 days (IQR, 131-730 days), and for the surgery group, it was beyond 730 days (right-sided censored IQR, 730-730 days).

