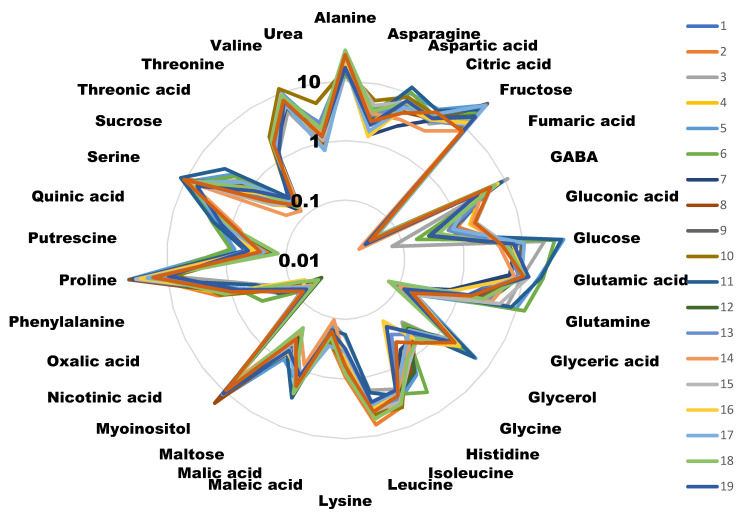
Figure 1.
Radial diagram of the metabolite amounts of the different cultivars. Values are the area of the peak per mg of sample represented in a decimal logarithmic scale. Measures are the average of four independent biological replicates. Different colors represent different cultivars. For clarity, error bars have not been represented, but in most of the cases they represent less than 5% of the total value.

