

Key Points
Question
How does the underlying genetic heterogeneity of pediatric sensorineural hearing loss (SNHL) contribute to its variable presentation and the success of cochlear implants?
Findings
In this cross-sectional study of 449 children with SNHL, genomic sequencing identified a genetic cause of SNHL for more than 50% of affected children, with 43 genes involved. Cochlear implants were successful in all participants who underwent implant, but children with hearing loss due to deafness-causing alleles of TMPRSS3 and MITF had the best results on speech perception tests.
Meaning
The study results suggest that genetic testing is a valuable prognostic tool for managing pediatric hearing loss and a predictor for cochlear implant outcomes.
Abstract
Importance
In the US, most childhood-onset bilateral sensorineural hearing loss is genetic, with more than 120 genes and thousands of different alleles known. Primary treatments are hearing aids and cochlear implants. Genetic diagnosis can inform progression of hearing loss, indicate potential syndromic features, and suggest best timing for individualized treatment.
Objective
To identify the genetic causes of childhood-onset hearing loss and characterize severity, progression, and cochlear implant success associated with genotype in a single large clinical cohort.
Design, Setting, and Participants
This cross-sectional analysis (genomics) and retrospective cohort analysis (audiological measures) were conducted from 2019 to 2022 at the otolaryngology and audiology clinics of Seattle Children’s Hospital and the University of Washington and included 449 children from 406 families with bilateral sensorineural hearing loss with an onset younger than 18 years. Data were analyzed between January and June 2022.
Main Outcomes and Measures
Genetic diagnoses based on genomic sequencing and structural variant analysis of the DNA of participants; severity and progression of hearing loss as measured by audiologic testing; and cochlear implant success as measured by pediatric and adult speech perception tests. Hearing thresholds and speech perception scores were evaluated with respect to age at implant, months since implant, and genotype using a multivariate analysis of variance and covariance.
Results
Of 406 participants, 208 (51%) were female, 17 (4%) were African/African American, 32 (8%) were East Asian, 219 (54%) were European, 53 (13%) were Latino/Admixed American, and 16 (4%) were South Asian. Genomic analysis yielded genetic diagnoses for 210 of 406 families (52%), including 55 of 82 multiplex families (67%) and 155 of 324 singleton families (48%). Rates of genetic diagnosis were similar for children of all ancestries. Causal variants occurred in 43 different genes, with each child (with 1 exception) having causative variant(s) in only 1 gene. Hearing loss severity, affected frequencies, and progression varied by gene and, for some genes, by genotype within gene. For children with causative mutations in MYO6, OTOA, SLC26A4, TMPRSS3, or severe loss-of-function variants in GJB2, hearing loss was progressive, with losses of more than 10 dB per decade. For all children with cochlear implants, outcomes of adult speech perception tests were greater than preimplanted levels. Yet the degree of success varied substantially by genotype. Adjusting for age at implant and interval since implant, speech perception was highest for children with hearing loss due to MITF or TMPRSS3.
Conclusions and Relevance
The results of this cross-sectional study suggest that genetic diagnosis is now sufficiently advanced to enable its integration into precision medical care for childhood-onset hearing loss.
This cross-sectional study examines the genetic causes of childhood-onset hearing loss and characterizes severity, progression, and cochlear implant success associated with genotype in a single large clinical cohort.
Introduction
Hearing loss is the most common human sensory dysfunction, affecting 1 of 400 newborns and more than half of the US population by age 80 years.1 Environmental factors, including ototoxic drugs, infection, and acoustic trauma, all contribute to hearing loss in children and adults, but more than half of pediatric hearing loss is genetic in origin.2,3 Variants in more than 120 genes can lead to nonsyndromic hearing loss, and many other genes are involved in syndromes that include hearing loss.4 Nearly all patients with a genetic cause of hearing loss have variant(s) in only 1 gene. The genetic heterogeneity of hearing loss is reflected phenotypically by varying severity, pattern, and rate of progression with age.5 Because genetic testing for hearing loss is relatively recent, features of many rare or recently discovered forms of genetic hearing loss are not yet completely understood. A combination of genetic diagnoses and associated longitudinal phenotype information will allow clinicians to more accurately predict hearing loss severity and progression and better manage treatment.
At present, to our knowledge, there are no therapeutic options to reverse hearing loss. Patients with hearing impairment are typically treated with amplification (hearing aids) or cochlear implants (CIs) as well as sign language support. The choice of approach depends primarily on an individual’s level of speech discrimination, if the individual is able to participate in speech assessment, and on auditory-verbal development with hearing aids if they are not. Family goals for communication6 also play a major role. Cochlear implants have led to substantial improvement in hearing thresholds, speech understanding, and quality of life for hundreds of thousands of individuals.7,8 Published studies indicate that speech performance following CI varies widely among pediatric patients.8,9 While most patients experience substantial improvement in quality of life with their CIs, some do not, and approximately 7% will eventually become nonusers.10 Age at implant, developmental delay, and cochlear anatomic abnormalities are known to be associated with success of CIs.11,12,13,14 Given the genetic heterogeneity of childhood-onset hearing loss, it is possible that variability in CI outcomes is also partially explained by the gene responsible for the hearing loss.15,16,17,18 We carried out genetic diagnosis of hearing loss for a clinic-based cohort of children with bilateral sensorineural hearing loss to characterize audiological profiles by age and genotype and evaluate the success of CIs, based on clinical speech perception tests, by age at implant and genotype.
Methods
This cross-sectional study followed Strengthening the Reporting of Observational Studies in Epidemiology (STROBE) reporting guidelines.19 The study was approved by the human participants institutional review boards of Seattle Children’s Hospital (SCH) and the University of Washington (UW). Written informed consent was obtained from participants older than 18 years and from parents or legal guardians of younger children, as well as assent from children older than 7 years.
Participants
Families that visited the otolaryngology and audiology clinics at SCH and the pediatric audiology clinic at the UW Center for Human Development and Disability (CHDD) were invited to participate in the study. The criterion for enrollment was onset before age 18 years of bilateral hearing loss with a sensorineural component, which was defined as testing at 30 dB or poorer in bone conduction in at least 3 different testing frequencies in the better hearing ear during at least 1 testing session. Participants could be any age at enrollment (eFigure 1 in Supplement 1). Participants were identified between January 2019 and October 2021 by attending physicians or audiologists, or through the SCH audiological database (AudBase; http://www.audbase.com/). Of 466 families with whom the study was discussed, 406 families (87.1%) consented to participate and were enrolled (Table). There were no significant differences between participants and nonparticipants in any available demographic or clinical metric, with a slightly (nonsignificantly) higher proportion of nonparticipants having tested positive for congenital cytomegalovirus.
Table. Demographic and Clinical Features of the Cohort.
| Characteristic | No. (%) | |
|---|---|---|
| Participants | Declined to participate | |
| Total families | 406 (100) | 60 (100) |
| Site of ascertainment | ||
| Seattle Children’s Hospital | 358 (88.2) | 60 (100) |
| University of Washington | 48 (11.8) | 0 |
| Sex assigned at birth of proband | ||
| Male | 198 (48.8) | 28 (46.7) |
| Female | 208 (51.2) | 32 (53.3) |
| No. of affected relatives | ||
| Multiplex | 82 (20.2) | NAa |
| Singleton | 324 (79.8) | NA |
| Ancestry of proband by self-definition | ||
| African/African American | 17 (4.2) | NA |
| East Asian | 32 (7.9) | NA |
| European | 219 (53.9) | NA |
| Latino/Admixed American | 53 (13.1) | NA |
| South Asian | 16 (3.9) | NA |
| More than 1 ancestry reported | 61 (15.0) | NA |
| Unknown | 8 (2.0) | NA |
| Hearing devices | ||
| Total with data on hearing devicesb | 449 (100) | 64 (100) |
| Bilateral cochlear implants | 96 (21.4) | 16 (25.0) |
| Cochlear implant plus hearing aid | 47 (10.5) | 8 (12.5) |
| Unilateral cochlear implant | 23 (5.1) | 1 (1.6) |
| Bilateral hearing aids | 244 (54.3) | 29 (45.3) |
| Unilateral hearing aid | 7 (15.6) | 3 (4.7) |
| None | 32 (7.8) | 7 (10.9) |
| Newborn hearing screen | ||
| Total with screening datab | 346 (100) | 45 (100) |
| Pass in both ears | 115 (33.2) | 17 (37.8) |
| Refer in 1 ear only | 17 (4.9) | 2 (4.4) |
| Refer in both ears | 214 (61.8) | 26 (57.8) |
| Imaging (CT/MRI) | ||
| Total who received imagingb | 227 (100) | 32 (100) |
| Mondini deformity | 14 (6.2) | 1 (3.1) |
| Enlarged vestibular aqueduct only | 35 (15.4) | 4 (12.5) |
| Incomplete partition only | 8 (3.5) | 0 (0.0) |
| Other | 26 (11.5) | 2 (6.3) |
| No finding | 144 (63.4) | 25 (78.1) |
| CMV testing from neonatal blood spot | ||
| Total testedb | 201 (100) | 28 (100) |
| Positive | 11 (5.4) | 4 (14.3) |
| Negative | 190 (94.5) | 24 (85.7) |
Abbreviations: CMV, cytomegalovirus; CT, computed tomography; MRI, magnetic resonance imaging; NA, not applicable.
Not available.
Refers to total number of participants, not families.
Saliva samples were collected by a member of the study team (R.J.C.) from probands, affected siblings, and 1 or both parents, and DNA samples were extracted using the OGR-500 saliva sampling kit (DNA Genotek). Demographic information and family history of hearing loss was collected at enrollment and later confirmed via review of the electronic medical record. Information on family history and ancestry was collected to aid with genomic analysis. Participants provided family histories and defined their own ancestries.
Genomics
Genomic DNA samples were hybridized to a custom panel of 191 known and candidate genes for hearing loss (updated20; eTable 1 in Supplement 1). Sequences were aligned and analyzed using an in-house bioinformatics pipeline, as previously described.21 To identify copy number variants in STRC and OTOA, which are located in genomic regions with segmental duplications, copy number analysis was conducted using TaqMan CNV qPCR (Thermo). For STRC, genomic DNA was tested using probe Hs04444756 overlapping intron 36 and exon 37 and a custom probe22 in intron 23 (Thermo). For OTOA, DNA was tested using probe Hs00068385 (Thermo), overlapping intron 5 and exon 6.
Variant analysis files included annotations for genomic position, genic location, population allele frequency from gnomAD,23 predicted function, and previously reported clinical significance in ClinVar and the Deafness Variation Database.24 Four experienced reviewers (R.J.C., T.W., A.A., and M.C.K.) independently interpreted all variants using the guidelines of the American College of Medical Genetics and Genomics25 and best practices for expert interpretation of genomic data.26 Variants were interpreted as potentially damaging if they were truncating, were predicted to lead to a loss of transcript, completely deleted a critical gene, or were missense with a predicted negative functional effect.27 All previously unreported variants predicted to be pathogenic or likely pathogenic were submitted to ClinVar.
Audiology
Hearing thresholds from audiograms and results of speech perception testing were obtained as part of normal clinical care. Records from SCH were downloaded from the hospital’s audiological database (AudBase), and testing from CHDD was obtained from the electronic medical record. Analyses of audiological results were based on pure tone thresholds (air and/or bone). Bone conduction thresholds were used when available, otherwise air conduction thresholds were used. To evaluate changes in hearing over time, 4-tone pure tone averages at 500, 1000, 2000, and 4000 Hz were calculated for each audiologic test, binned by gene, and plotted against the participant’s age at test. For analysis of changes in hearing loss over time, only genes with longitudinal audiological data for 3 or more individuals were evaluated.
Speech perception data, assisted by CIs, were obtained from audiology notes in the electronic medical record. Tests included were AzBio,28 Pediatric AzBio,29 HINT-C,30 PBK,31 and CNC.32 For participants with bilateral CIs, test results with both implants turned on were evaluated; for participants with unilateral implants, test results based only on the implanted ear were included. To use information in multivariate analyses from multiple tests of different levels of difficulty, raw scores (% correct) were used to calculate test-specific and condition-specific z scores for each participants. Each participant's best z score for each type of test was used in subsequent analyses.
Statistical Analysis
Statistical analyses were conducted using univariate or multiple regression, analysis of variance, or analysis of covariance, as appropriate. Source data were approximately normally distributed, and parametric tests were used for comparisons. All P values were 2-tailed and adjusted for multiple comparisons. Data analysis was carried out between January and June 2022. Significance levels were set at an α of .05 after adjustment for multiple comparisons.
Results
Genetic Causes of Hearing Loss
Of the 406 families tested, a genetic cause of hearing loss was identified for 210 (52%), including 55 of 82 families (67%) with hearing loss in more than 1 child and 155 of 324 families (48%) with hearing loss in only 1 child (Figure 1). Within each of these groups, proportions of families with genetic diagnoses differed somewhat (although not significantly) by ancestry (eTable 2 in Supplement 1), with a somewhat higher diagnostic rate among families of East Asian ancestry, due primarily to the high frequency of a founder allele (GJB2 p.V37I) and a somewhat lower diagnostic rate among African American families, likely due to individually rare missense alleles of unknown significance (eg, OTOF p.E1081K, OTOG p.P2594L, TBC1D24 p.R214C).
Figure 1. Genetic Diagnoses for Participants, With Variants in 43 Genes.

A, Genes responsible for hearing loss (HL) for the 210 families with genetic diagnoses (of 406 families total). B, Number of families with and without genetic diagnoses for singleton vs multiplex families, nonsyndromic vs syndromic hearing loss based on clinical presentation, and probands with mild/moderate or severe/profound hearing loss.
Among the 210 families with genetic diagnoses, 177 causal variants were identified in 43 different genes, with 209 families carrying causative pathogenic variant(s) in only 1 gene. The most commonly implicated genes were GJB2 (67 families), STRC (27 families), SLC26A4 (16 families), MYO15A (7 families), and TMPRSS3 (7 families). For the other 86 families with genetic diagnoses, hearing loss was associated with variants in far less frequently encountered genes (Figure 1A). Copy number variants, known to be a common mechanism for genetic hearing loss,33 were part of the genetic diagnoses for 32 of 210 families (15%), including deletions at STRC (24 families), OTOA (4 families), ADGRV1 (1 family), and a critical enhancer for GJB2 (3 families). Of the 177 different pathogenic variants in the 210 solved families, 61 variants (34%) had not been previously reported.
Genotype-Dependent Variation in Hearing Loss
For hearing loss due to GJB2, variation in severity depended on genotype, with truncating variants associated with more severe hearing loss than missense variants (Figure 2A). Variants in CDH23, MYO15A, and SOX10 were associated with stable severe-to-profound hearing loss across all frequencies; variants in DMXL2 and STRC were associated with stable mild-to-moderate hearing loss across all frequencies (Figure 2B; eFigure 2 in Supplement 1). Variants in CLDN9, ESPN, GZF1, OTOG, SLC26A4, SYNE4, or TMPRSS3 were associated with hearing loss that affected predominantly high frequencies; variants in COL4A5 or MYO6 were associated with hearing loss that affected predominantly lower frequencies; and variants in MYO7A or OTOA were associated with hearing loss with U-shaped or cookie-bite audiograms (Figure 2B; eFigure 2 in Supplement 1). Details for all genes are shown in eFigure 2 in Supplement 1).
Figure 2. Variation in Audiogram Thresholds by Gene, Genotype, and Age.

A, For children with GJB2-related hearing loss, hearing thresholds averaged across all ages for children with 3 classes of GJB2 genotypes: 2 missense variants (miss/miss), 1 truncation and 1 missense variant (TR/miss), and 2 truncating variants (TR/TR). B, Age-specific hearing thresholds by causative gene, and for GJB2 by genotype. All tests were unaided (ie, without use of hearing aids or cochlear implants). Bone conduction was substituted for air conduction when available. Results for each ear are included separately. For each panel, n indicates the number of participants with audiometric data. Error bars indicate SEM. Thresholds for several genes suggest progressive hearing loss (see Figure 3 for details). Definitions of gene names and plots for additional genes appear in supplementary data.
Sixty children received genetic diagnoses involving any 1 of 16 genes associated with syndromic hearing loss. Of these 60 children, 28 (47%) received an independent diagnosis of a syndromic disorder based on clinical presentation, for which genetics provided confirmation. For the 32 patients (53%) with genetic diagnoses but no syndromic features at the time of enrollment, the features may be later onset or dependent on the specific genotype of the critical gene. These patients were referred for specialized follow-up.
Genotype-Dependent Variation in Progression of Hearing Loss
Hearing loss progressed with age for children with truncating variants in GJB2, and for all children with hearing loss due to variants in MYO6, OTOA, SLC26A4, or TMPRSS3 (Figure 3A; eTable 3 in Supplement 1). TMPRSS3-related hearing loss progressed most steeply, with pure tone average hearing thresholds increasing 37 dB per decade. Rates of progression associated with other genes were 14 dB per decade for truncating variants in GJB2, 13 dB per decade for SLC26A4 and MYO6, and 11 dB per decade for OTOA.
Figure 3. Significance of Progression by Age for Children With Hearing Losses Due to GJB2, MYO6, OTOA, SLC26A4, and TMPRSS3.

A, Pure tone averages (PTAs) of hearing thresholds at 500, 1000, 2000, 4000 Hz were plotted by age at test. Only ears that never received cochlear implants were included. Hearing loss progressed significantly by age for children with variants in MYO6, OTOA, SLC26A4, and TMPRSS3 or with 2 truncating variants (TR/TR) in GJB2. B, Progression of TMPRSS3-related hearing loss at each frequency for 3 classes of TMPRSS3 genotypes: 2 missense variants (miss/miss), compound heterozygosity for a frameshift and a missense variant (fs/miss), and 2 frameshift variants (fs/fs). For fs/miss and miss/miss genotypes, only ears that never received cochlear implants were included. All participants with fs/fs genotypes received bilateral implants before age 3 years, and their preimplant results are included for comparison with other genotypes. At 250 and 500 Hz, the rate of progression (slope) varied significantly by genotype. Data for individual tests are in eTables 4 and 5 in Supplement 1.
Progression of TMPRSS3 hearing loss is particularly complex. Depending on the allele, alleles in TMPRSS3 can be responsible for either severe hearing loss of congenital or early-childhood onset (DFNB10) or to later-onset, progressive hearing loss preferentially affecting high frequencies (DFNB8)34,35 (Figure 3B). Both DFNB10 and DFNB8 are recessive. Of the 10 children with hearing loss due to variants in TMPRSS3, 2 children who were compound heterozygous for TMPRSS3 frameshift variants presented with congenital severe hearing loss (DFNB10) and received bilateral CIs before age 3 years, and 8 children with frameshift and missense variants or 2 missense variants presented with progressive, high-frequency hearing loss (DFNB8) and received unilateral CIs at older ages. At lower frequencies (250 and 500 Hz), the rate of progression of hearing loss was steeper for children with frameshift and missense variants than for children with 2 missense variants (Figure 3B; eTables 4 and 5 in Supplement 1).
Genotype and Sensitivity of Newborn Hearing Screening
The electronic medical records of 346 of 449 children (77%) in the cohort included results of newborn hearing screening, of whom 214 (62%) were referred for follow-up in both ears, 17 (5%) were referred in 1 ear only, and 115 (33%) passed in both ears (Table). Detection of a hearing problem at birth varied by gene (eFigure 3 in Supplement 1). Newborn screening did not detect hearing loss in 11 of 32 children (34%) with causal variants in STRC, 7 of 10 children (70%) with causal variants in TMPRSS3, and 4 of 13 children (31%) with causal variants in SLC26A4. Among children with causal variants in GJB2, for whom hearing loss severity depended on genotype,36,37 newborn hearing screening did not detect hearing loss in 5 of 14 children (36%) with hearing loss due to GJB2 missense variants vs 3 of 45 children (7%) with 1 or 2 GJB2 truncating variants.
Genotype and Speech Perception With CIs
Of the 449 participants, 166 (37%) had received either unilateral or bilateral CIs. Of participants who had received CIs more than 5 years before enrollment in the study, 98 of 100 (98%) were still using their implants actively. Because CIs typically improve audiologic hearing thresholds to near-normal levels, speech perception is a better metric of CI performance than hearing thresholds as measured by audiogram. We evaluated data for the 47 patients who had been tested at the audiology clinics of SCH or CHDD with any of 5 speech perception tests: AzBio, Pediatric AzBio, and HINT-C (all sentence-based); CNC (monosyllabic words); and PBK (phonetically balanced kindergarten-level words). Pediatric AzBio, HINT-C, and PBK tests are designed for a pediatric population, and AzBio and CNC are adult-level tests. Speech perception scores for adult-level tests (CNC words and AzBio in quiet) are depicted in Figure 4A and show improvement in all individuals vs preimplant levels.
Figure 4. Association of Variation in Cochlear Implant Outcomes With Underlying Genotype.
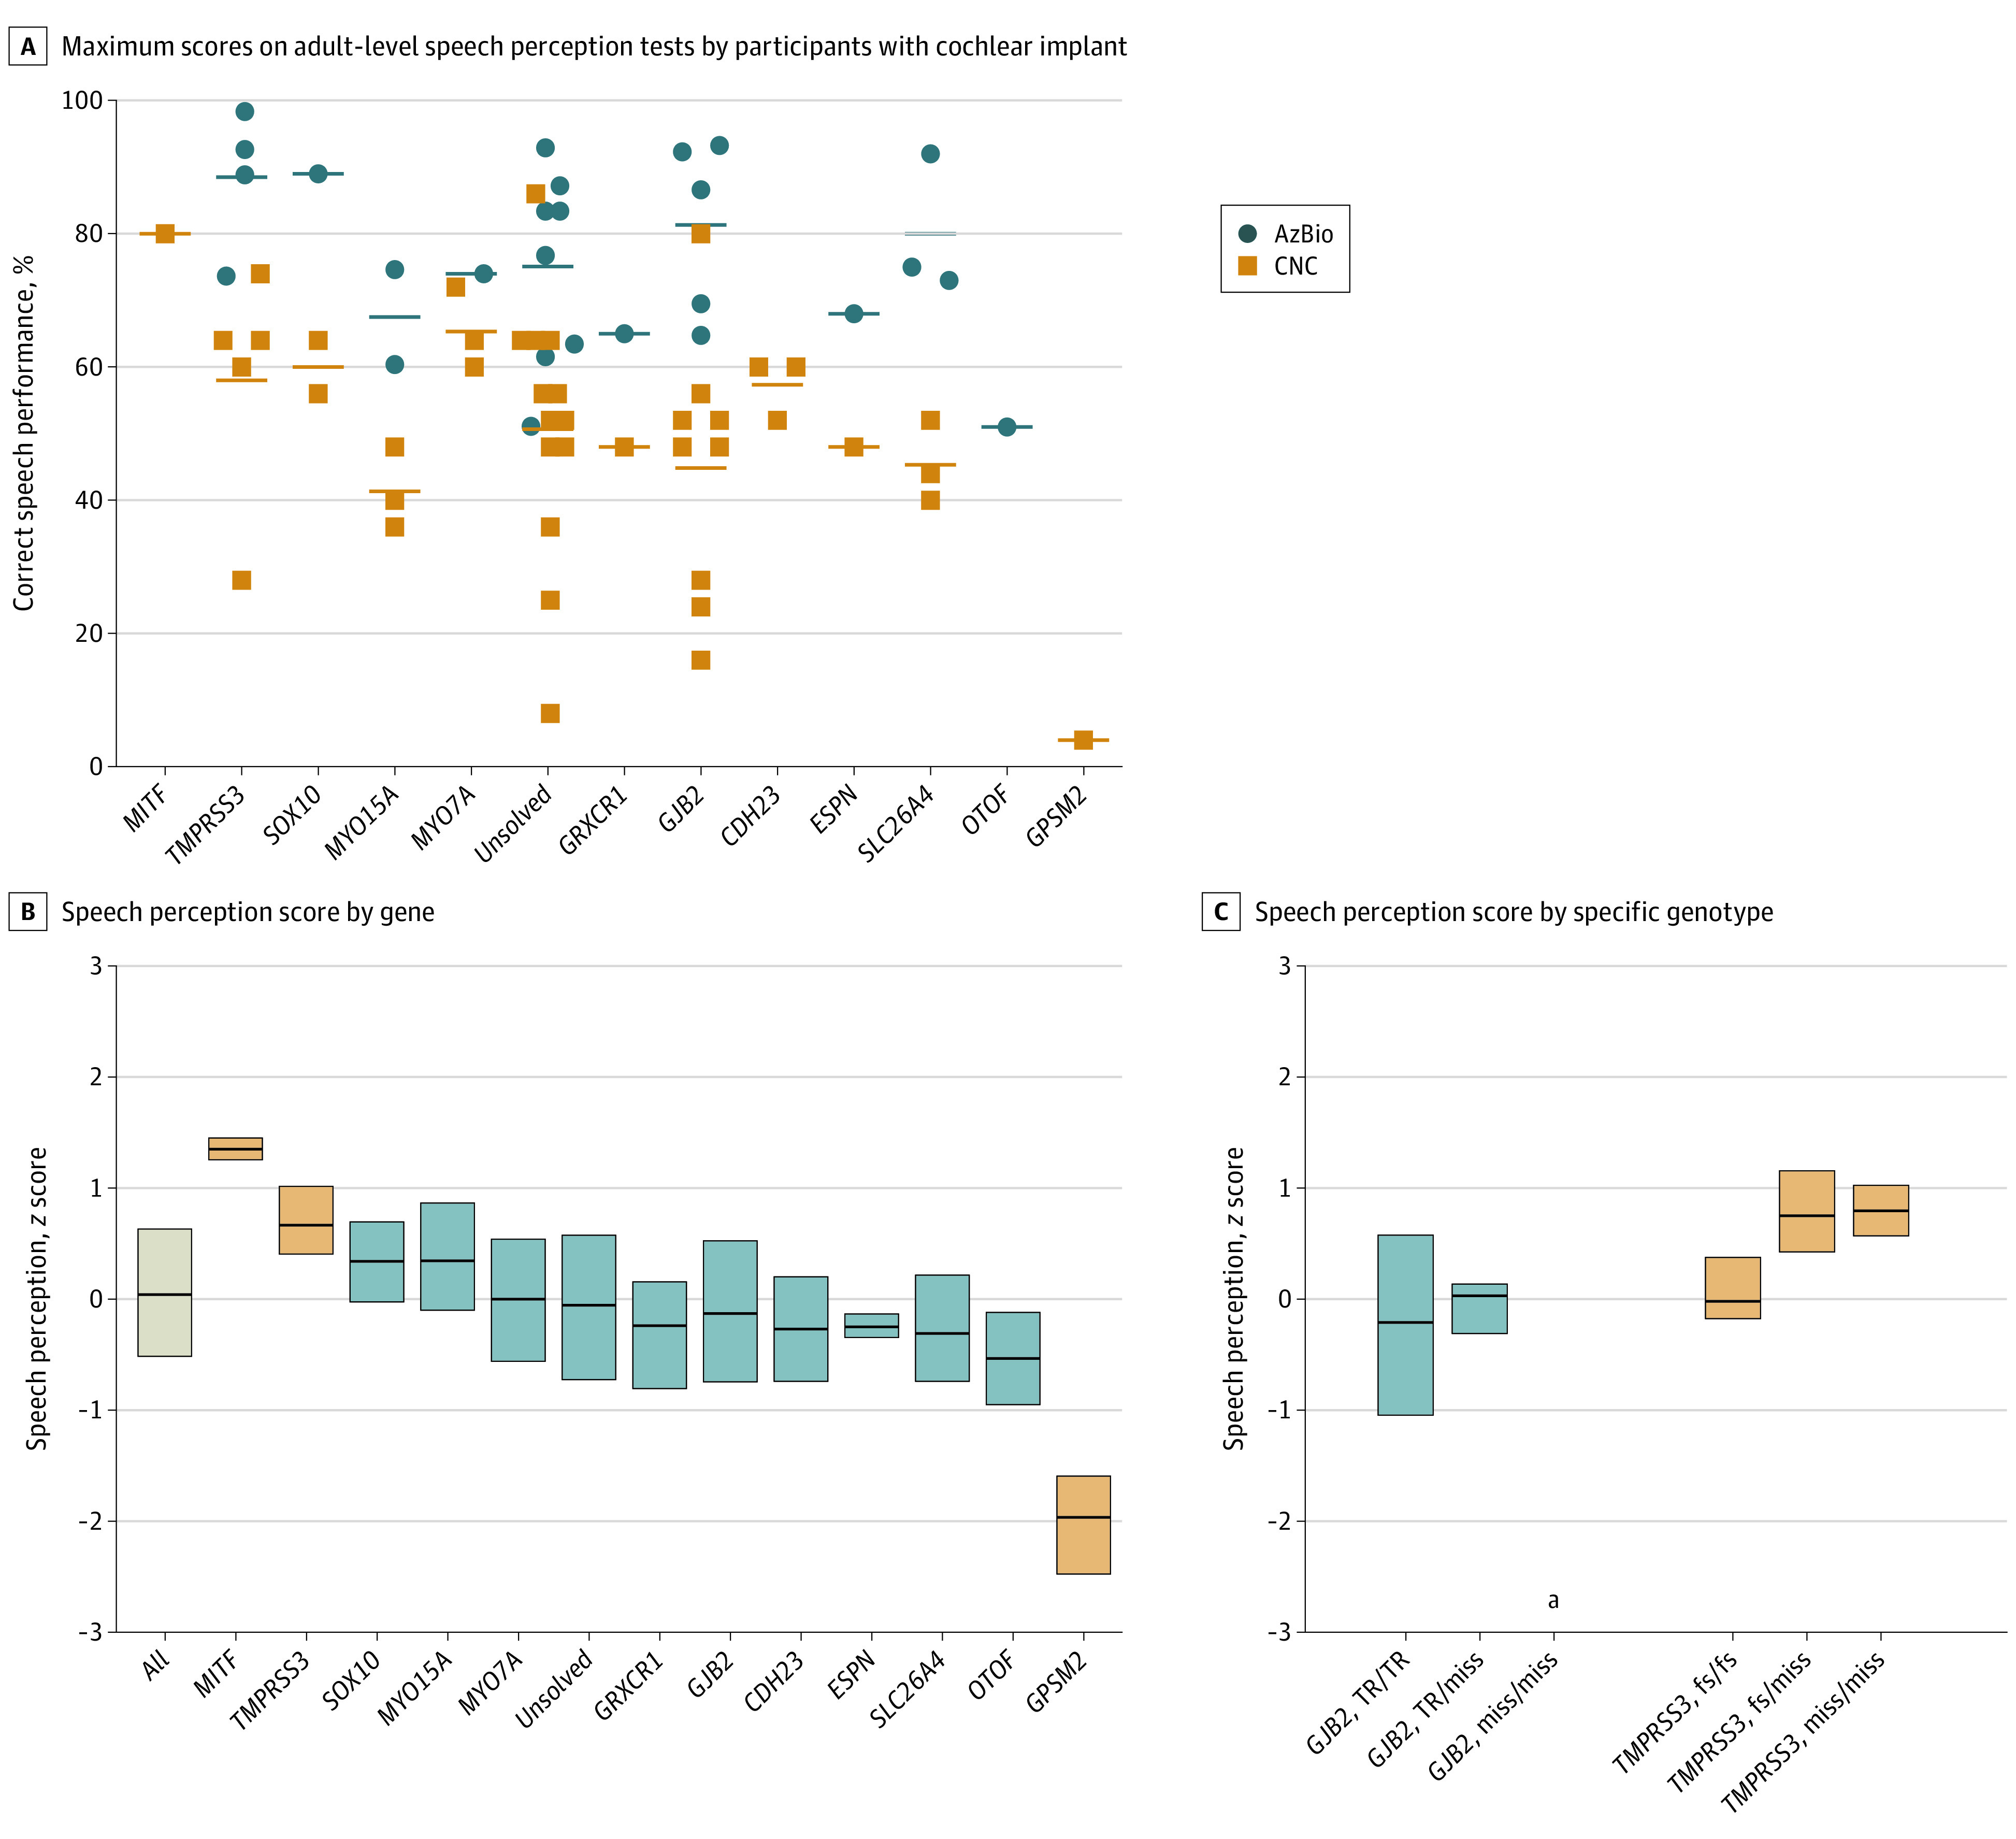
A, Maximum scores for adult-level speech perception tests, CNC (words) and AzBio (Quiet), for each individual with a cochlear implant as separated by causative gene. B, Speech perception scores by gene. Scores for each test (HINT-C, Pediatric AzBio, AzBio, PBK, and CNC) were converted to z scores by comparison with the mean for that test. For each participant, the best score for each test was included. Box plots represent 25%, 50%, and 75% percentiles. After adjusting for age at implant and time between implant and testing, scores for participants with variants in MITF or TMPRSS3 were higher than average and for the participant with variants in GPSM2 were lower than average (blue boxes) (eTable 6B in Supplement 1). The child with GPSM2 hearing loss had a syndromic presentation, including developmental delay. C, There were no significant differences by genotype for participants with variants in GJB2 or TMPRSS3. None of the patients with 2 GJB2 missense variants had cochlear implants.
Multivariate analysis of covariance enabled evaluation of differences in speech perception due to the gene responsible for the hearing loss, age at implant, months since implant, and the specific individual apart from hearing loss genotype, as well as the proportion of variance explained by each variable (eTable 6A and 6B in Supplement 1). In the multivariate analysis that included other covariates, speech perception was significantly associated with the gene responsible for hearing loss (18% of variance; P = 6.1 × 10⁻¹³), age at implant (4% of variance; P = .001), and months since implant (3% of variance; P = .001). The genes associated with highest speech perception test scores were MITF and TMPRSS3 (eTable 6B in Supplement 1). For example, individuals with TMPRSS3 hearing loss averaged mean (SD) AzBio scores of 89% (11%) in quiet and 58% (18%) in noise. The gene associated with lowest speech perception was GPSM2, but this finding was based on test results of only 1 child whose phenotype included developmental delay as well as hearing loss (Figure 4B). No significant differences in speech perception scores were observed among specific genotypes of GJB2 or TMPRSS3 (Figure 4C).
Discussion
Discovery of the genetic bases of inherited hearing loss has been highly successful during the past 25 years, with the discovery of more than 120 genes responsible for nonsyndromic hearing loss and detailed clinical and functional characterization of individual genes.36,37,38,39,40,41,42,43 We had the opportunity to conduct a genomic analysis of patients with clinical examination and audiologic and speech perception testing at 2 affiliated institutions, with sequencing on a single platform and standardized consensus interpretation. This integrated approach enabled comparison of audiometric thresholds and performance of CIs across multiple genes and genotypes. The data suggest several results of interest to those caring for children with hearing loss.
First, genetic testing for hearing loss using modern genomics tools can be expected to yield a clear genetic diagnosis for at least 50% of pediatric patients with bilateral sensorineural hearing loss. This fact comes with a caveat: adequate genetic diagnosis requires complete sequencing of all the known hearing loss–related genes, because the genetic causes of hearing loss are highly heterogeneous with respect to genes and specific variants. Among the patients of SCH and UW, who share similar ancestries with cohorts in other analyses of genetics of hearing loss in the US,3 177 variants in 43 genes were responsible for hearing loss in 210 families. Of those variants, 61 of 177 (34%) had never been reported previously to our knowledge. Based on these data, spot checking for the most common variants in the most commonly implicated genes would have missed more than a third of variants. This point is particularly important in the context of health equity. The genes responsible for hearing loss are the same in all populations, but the specific variants are almost completely different. Alleles responsible for hearing loss in children of other than European ancestries are particularly unlikely to have been reported previously; therefore, they would be excluded in spot checks. Fortunately, DNA sequencing of all known hearing loss–related genes is now straightforward and relatively inexpensive for genomics laboratories.
Second, genetic testing for hearing loss has improved very rapidly regarding the discovery of the responsible genes and technical capacity for sequencing all classes of clinically meaningful variants. Approaches and gene panels that were state of the art even a few years ago44 have been updated since.45 It is possible that children with hearing loss who received negative results based on prior genetic testing would now receive a positive and clinically meaningful genetic diagnosis if retested with current panels. Retesting should be considered periodically for patients who underwent panel testing in the past with no diagnosis.
Third, for many children, genetic testing enables identification of hearing loss before hearing deficits become clinically apparent. Newborn hearing screening did not detect one-third of study participants tested at birth, likely because sufficient hearing loss was not yet present or was too mild to have been detected. Detection of hearing loss at the earliest possible age is important for cognitive and social development, regardless of management approach.46 Genetic testing can also identify syndromic forms of hearing loss before symptom onset. Diagnosis of syndromic hearing loss allows for referral to specialized care for follow-up of involved organ systems. For example, in patients who received a diagnosis of Usher syndrome, CI may be recommended more strongly due to future communication difficulties from combined hearing and vision loss.
Fourth, genetic diagnoses could be more effectively used to inform treatment for childhood hearing loss. At present, the primary treatments for hearing loss, hearing aids and CIs, are often implemented based mostly on the remaining level of speech discrimination6 or auditory-verbal progress with hearing aids. With a genetic diagnosis, it is possible to anticipate future hearing loss across frequencies and progression with age. This information can be integrated with current severity of hearing loss to decide on treatment. This point is particularly important given that age at implant, adjusted for genotype, was significantly associated with speech perception during the years following a child's implant in the present study and others.47,48
An example of the importance of the association between phenotype and genotype is illustrated by the use of CIs to treat TMPRSS3 hearing loss. As shown in Figure 3B, this hearing loss initially affects mid-to-high frequencies (which have poorer amplification by hearing aids) then progresses at low frequencies during the first decade until generally severe to profound. Studies of CI in adults with TMPRSS3 variants have described an unclear pattern of success,15,35,49,50,51 and to our knowledge, analysis of CI outcomes in children with TMPRSS3-related hearing loss is extremely limited.52 The present study’s cohort included 10 patients with TMPRSS3-related hearing loss and CIs, to our knowledge the largest number of these patients evaluated thus far. Speech perception testing from the time of implant through the next 2 to 16 years indicated that implant was successful for all of these patients, with among the highest postimplant speech perception scores for patients of any genotype. These findings suggest that best clinical practice should include genetic testing to identify patients whose genotype suggests that they may be good candidates for CI perhaps earlier than their standard audiometric testing would suggest.
Limitations
A limitation of this study was sample size, with few patients with hearing loss due to the least frequently encountered causal genes. In particular, too few children carried variants in any of the genes expressed primarily outside the inner ear (AIFM1, DIAPH3, DFNB59, MT-RNR1, and OPA1) to enable evaluation of the hypothesis that variability in implant success might be associated with tissue-specific expression of the causative gene.15,16 With a larger sample size, it would also be possible to evaluate genes based on their developmental roles, as revealed by consequences of variants in humans vs mice.53 Overall among the patients in this study, continuing use of implants was high. Only 2 patients discontinued use, 1 whose genetic lesion was a chromosomal abnormality that was associated with subsequent severe developmental delay in addition to hearing loss, and the other for reasons of limited access to medical care.
A second limitation of the study was the need to rely on longitudinal speech perception testing data from normal care and, therefore, on various tests. The specific test in each appointment depended on the audiologist’s preference, time available, and patient’s willingness and ability to participate. Since the participants were children, test choice was dynamic as their vocabulary and testing abilities grew. To address this heterogeneity, we first created z scores that were specific to each test, then evaluated speech perception using analysis of covariance so as to include age, age at implant, time since implant, and genotype in the same analysis.8,16
Conclusions
In this cross-sectional analysis, genomic sequencing for children with bilateral sensorineural hearing loss yielded genetic diagnoses for most patients. For children with CIs, nearly all had favorable scores on adult-level speech perception tests. Variation in speech perception scores among users of implants was associated with age at implant and the gene associated with the hearing loss but was not substantial enough to preclude implantation for any patient who otherwise met audiometric and auditory-verbal developmental criteria. Using genetic diagnoses provides information about progression of the hearing loss and possible syndromic outcomes, enabling the more optimal timing of treatment. Comprehensive genetic testing of children with sensorineural hearing loss is informative, medically necessary, and should be incorporated into standard care whenever possible.
eFigure 1. Ages at diagnosis of hearing loss
eFigure 2. Age-specific audio profiles of individuals with hearing loss, by causative gene.
eFigure 3. Results of newborn hearing screen for study participants, by gene ultimately found to be causative.
eTable 1. Gene list for panel
eTable 2. Rates of genetic diagnosis by multiplex vs singleton family status and ancestry.
eTable 3. Change in hearing thresholds per year for children with mutations in progressive hearing loss genes
eTable 4. Change in hearing thresholds per year for children with mutations in TMPRSS3
eTable 5. Comparison of progression of hearing loss at each frequency for children with fs/miss vs miss/miss mutations in TMPRSS3
eTable 6a. ANCOVA of speech perception Z-score with effects of genes, age at implant, months since implant, and their interactions
eTable 6b. ANCOVA of speech perception Z-score with effects of individual genes
eTable 7. Variants responsible for hearing loss in the cohort
Data sharing statement
References
- 1.Vohr B. Overview: infants and children with hearing loss—part I. Ment Retard Dev Disabil Res Rev. 2003;9(2):62-64. doi: 10.1002/mrdd.10070 [DOI] [PubMed] [Google Scholar]
- 2.Petit C, Levilliers J, Hardelin JP. Molecular genetics of hearing loss. Annu Rev Genet. 2001;35:589-646. doi: 10.1146/annurev.genet.35.102401.091224 [DOI] [PubMed] [Google Scholar]
- 3.Sloan-Heggen CM, Bierer AO, Shearer AE, et al. Comprehensive genetic testing in the clinical evaluation of 1119 patients with hearing loss. Hum Genet. 2016;135(4):441-450. doi: 10.1007/s00439-016-1648-8 [DOI] [PMC free article] [PubMed] [Google Scholar]
- 4.Van Camp G, Smith R. Hereditary hearing loss homepage. Accessed August 31, 2022. https://hereditaryhearingloss.org.
- 5.Shearer EA, Hildebrand MS, Smith RJ. Gene reviews. In: Adam M, Ardinger H, Pagon R, eds. Gene Reviews. National Institutes of Health; 2017. [Google Scholar]
- 6.Liu CC, Anne S, Horn DL. Advances in management of pediatric sensorineural hearing loss. Otolaryngol Clin North Am. 2019;52(5):847-861. doi: 10.1016/j.otc.2019.05.004 [DOI] [PubMed] [Google Scholar]
- 7.Mo B, Lindbaek M, Harris S. Cochlear implants and quality of life: a prospective study. Ear Hear. 2005;26(2):186-194. doi: 10.1097/00003446-200504000-00006 [DOI] [PubMed] [Google Scholar]
- 8.Niparko JK, Tobey EA, Thal DJ, et al. ; CDaCI Investigative Team . Spoken language development in children following cochlear implantation. JAMA. 2010;303(15):1498-1506. doi: 10.1001/jama.2010.451 [DOI] [PMC free article] [PubMed] [Google Scholar]
- 9.Pisoni DB, Conway CM, Kronenberger WG, Horn DL, Karpicke J, Henning SC. Efficacy and effectiveness of cochlear implants in deaf children. In: Marschark M, Hauser PC. Deaf Cognition: Foundations and Outcomes. Oxford University Press; 2008:52-101. doi: 10.1093/acprof:oso/9780195368673.003.0003 [DOI] [Google Scholar]
- 10.Raine CH, Summerfield Q, Strachan DR, Martin JM, Totten C. The cost and analysis of nonuse of cochlear implants. Otol Neurotol. 2008;29(2):221-224. doi: 10.1097/mao.0b013e31815c25a1 [DOI] [PubMed] [Google Scholar]
- 11.Moberly AC, Bates C, Harris MS, Pisoni DB. The enigma of poor performance by adults with cochlear implants. Otol Neurotol. 2016;37(10):1522-1528. doi: 10.1097/MAO.0000000000001211 [DOI] [PMC free article] [PubMed] [Google Scholar]
- 12.Lazard DS, Vincent C, Venail F, et al. Pre-, per- and postoperative factors affecting performance of postlinguistically deaf adults using cochlear implants: a new conceptual model over time. PLoS One. 2012;7(11):e48739. doi: 10.1371/journal.pone.0048739 [DOI] [PMC free article] [PubMed] [Google Scholar]
- 13.Kileny PR, Zwolan TA, Ashbaugh C. The influence of age at implantation on performance with a cochlear implant in children. Otol Neurotol. 2001;22(1):42-46. doi: 10.1097/00129492-200101000-00008 [DOI] [PubMed] [Google Scholar]
- 14.Fryauf-Bertschy H, Tyler RS, Kelsay DMR, Gantz BJ, Woodworth GG. Cochlear implant use by prelingually deafened children: the influences of age at implant and length of device use. J Speech Lang Hear Res. 1997;40(1):183-199. doi: 10.1044/jslhr.4001.183 [DOI] [PubMed] [Google Scholar]
- 15.Eppsteiner RW, Shearer AE, Hildebrand MS, et al. Prediction of cochlear implant performance by genetic mutation: the spiral ganglion hypothesis. Hear Res. 2012;292(1-2):51-58. doi: 10.1016/j.heares.2012.08.007 [DOI] [PMC free article] [PubMed] [Google Scholar]
- 16.Shearer AE, Eppsteiner RW, Frees K, et al. Genetic variants in the peripheral auditory system significantly affect adult cochlear implant performance. Hear Res. 2017;348:138-142. doi: 10.1016/j.heares.2017.02.008 [DOI] [PMC free article] [PubMed] [Google Scholar]
- 17.Seligman KL, Shearer AE, Frees K, et al. Genetic causes of hearing loss in a large cohort of cochlear implant recipients. Otolaryngol Head Neck Surg. 2022;166(4):734-737. doi: 10.1177/01945998211021308 [DOI] [PMC free article] [PubMed] [Google Scholar]
- 18.Miyagawa M, Nishio S-Y, Usami S. A comprehensive study on the etiology of patients receiving cochlear implantation with special emphasis on genetic epidemiology. Otol Neurotol. 2016;37(2):e126-e134. doi: 10.1097/MAO.0000000000000936 [DOI] [PMC free article] [PubMed] [Google Scholar]
- 19.von Elm E, Altman DG, Egger M, Pocock SJ, Gøtzsche PC, Vandenbroucke JP; STROBE Initiative . The Strengthening the Reporting of Observational Studies in Epidemiology (STROBE) statement: guidelines for reporting observational studies. Lancet. 2007;370(9596):1453-1457. doi: 10.1016/S0140-6736(07)61602-X [DOI] [PubMed] [Google Scholar]
- 20.Brownstein Z, Friedman LM, Shahin H, et al. Targeted genomic capture and massively parallel sequencing to identify genes for hereditary hearing loss in Middle Eastern families. Genome Biol. 2011;12(9):R89. doi: 10.1186/gb-2011-12-9-r89 [DOI] [PMC free article] [PubMed] [Google Scholar]
- 21.Abu Rayyan A, Kamal L, Casadei S, et al. Genomic analysis of inherited hearing loss in the Palestinian population. Proc Natl Acad Sci U S A. 2020;117(33):20070-20076. doi: 10.1073/pnas.2009628117 [DOI] [PMC free article] [PubMed] [Google Scholar]
- 22.Ito T, Kawashima Y, Fujikawa T, et al. Rapid screening of copy number variations in STRC by droplet digital PCR in patients with mild-to-moderate hearing loss. Hum Genome Var. 2019;6(1):41. doi: 10.1038/s41439-019-0075-5 [DOI] [PMC free article] [PubMed] [Google Scholar]
- 23.Karczewski KJ, Francioli LC, Tiao G, et al. ; Genome Aggregation Database Consortium . The mutational constraint spectrum quantified from variation in 141,456 humans. Nature. 2020;581(7809):434-443. doi: 10.1038/s41586-020-2308-7 [DOI] [PMC free article] [PubMed] [Google Scholar]
- 24.Azaiez H, Booth KT, Ephraim SS, et al. Genomic landscape and mutational signatures of deafness-associated genes. Am J Hum Genet. 2018;103(4):484-497. doi: 10.1016/j.ajhg.2018.08.006 [DOI] [PMC free article] [PubMed] [Google Scholar]
- 25.Li MM, Tayoun AA, DiStefano M, et al. ; ACMG Professional Practice and Guidelines Committee . Clinical evaluation and etiologic diagnosis of hearing loss: a clinical practice resource of the American College of Medical Genetics and Genomics (ACMG). Genet Med. 2022;24(7):1392-1406. doi: 10.1016/j.gim.2022.03.018 [DOI] [PubMed] [Google Scholar]
- 26.Spahr AJ, Dorman MF, Litvak LM, et al. Development and validation of the AzBio sentence lists. Ear Hear. 2012;33(1):112-117. doi: 10.1097/AUD.0b013e31822c2549 [DOI] [PMC free article] [PubMed] [Google Scholar]
- 27.Shirts BH, Casadei S, Jacobson AL, et al. Improving performance of multigene panels for genomic analysis of cancer predisposition. Genet Med. 2016;18(10):974-981. doi: 10.1038/gim.2015.212 [DOI] [PubMed] [Google Scholar]
- 28.Oza AM, DiStefano MT, Hemphill SE, et al. ; ClinGen Hearing Loss Clinical Domain Working Group . Expert specification of the ACMG/AMP variant interpretation guidelines for genetic hearing loss. Hum Mutat. 2018;39(11):1593-1613. doi: 10.1002/humu.23630 [DOI] [PMC free article] [PubMed] [Google Scholar]
- 29.Spahr AJ, Dorman MF, Litvak LM, et al. Development and validation of the pediatric AzBio sentence lists. Ear Hear. 2014;35(4):418-422. doi: 10.1097/AUD.0000000000000031 [DOI] [PMC free article] [PubMed] [Google Scholar]
- 30.Nilsson M, Soli SD, Sullivan JA. Development of the Hearing in Noise Test for the measurement of speech reception thresholds in quiet and in noise. J Acoust Soc Am. 1994;95(2):1085-1099. doi: 10.1121/1.408469 [DOI] [PubMed] [Google Scholar]
- 31.Haskins H. A phonetically balanced test of speech discrimination for children. Accessed August 31, 2022. https://www.worldcat.org/title/phonetically-balanced-test-of-speech-discrimination-for-children/oclc/36229785
- 32.Peterson GE, Lehiste I. Revised CNC lists for auditory tests. J Speech Hear Disord. 1962;27:62-70. doi: 10.1044/jshd.2701.62 [DOI] [PubMed] [Google Scholar]
- 33.Shearer AE, Kolbe DL, Azaiez H, et al. Copy number variants are a common cause of non-syndromic hearing loss. Genome Med. 2014;6(5):37. doi: 10.1186/gm554 [DOI] [PMC free article] [PubMed] [Google Scholar]
- 34.Scott HS, Kudoh J, Wattenhofer M, et al. Insertion of β-satellite repeats identifies a transmembrane protease causing both congenital and childhood onset autosomal recessive deafness. Nat Genet. 2001;27(1):59-63. doi: 10.1038/83768 [DOI] [PubMed] [Google Scholar]
- 35.Weegerink NJD, Schraders M, Oostrik J, et al. Genotype-phenotype correlation in DFNB8/10 families with TMPRSS3 mutations. J Assoc Res Otolaryngol. 2011;12(6):753-766. doi: 10.1007/s10162-011-0282-3 [DOI] [PMC free article] [PubMed] [Google Scholar]
- 36.Snoeckx RL, Huygen PLM, Feldmann D, et al. GJB2 mutations and degree of hearing loss: a multicenter study. Am J Hum Genet. 2005;77(6):945-957. doi: 10.1086/497996 [DOI] [PMC free article] [PubMed] [Google Scholar]
- 37.Kenna MA, Feldman HA, Neault MW, et al. Audiologic phenotype and progression in GJB2 (Connexin 26) hearing loss. Arch Otolaryngol Head Neck Surg. 2010;136(1):81-87. doi: 10.1001/archoto.2009.202 [DOI] [PMC free article] [PubMed] [Google Scholar]
- 38.Oonk AMM, Leijendeckers JM, Lammers EM, et al. Progressive hereditary hearing impairment caused by a MYO6 mutation resembles presbycusis. Hear Res. 2013;299:88-98. doi: 10.1016/j.heares.2012.12.015 [DOI] [PubMed] [Google Scholar]
- 39.Sugiyama K, Moteki H, Kitajiri SI, et al. Mid-frequency hearing loss is characteristic clinical feature of OTOA-associated hearing loss. Genes (Basel). 2019;10(9):715. doi: 10.3390/genes10090715 [DOI] [PMC free article] [PubMed] [Google Scholar]
- 40.Miyagawa M, Nishio SY, Usami S; Deafness Gene Study Consortium . Mutation spectrum and genotype-phenotype correlation of hearing loss patients caused by SLC26A4 mutations in the Japanese: a large cohort study. J Hum Genet. 2014;59(5):262-268. doi: 10.1038/jhg.2014.12 [DOI] [PMC free article] [PubMed] [Google Scholar]
- 41.Rehman AU, Bird JE, Faridi R, et al. Mutational spectrum of MYO15A and the molecular mechanisms of DFNB3 human deafness. Hum Mutat. 2016;37(10):991-1003. doi: 10.1002/humu.23042 [DOI] [PMC free article] [PubMed] [Google Scholar]
- 42.Schraders M, Ruiz-Palmero L, Kalay E, et al. Mutations of the gene encoding otogelin are a cause of autosomal-recessive nonsyndromic moderate hearing impairment. Am J Hum Genet. 2012;91(5):883-889. doi: 10.1016/j.ajhg.2012.09.012 [DOI] [PMC free article] [PubMed] [Google Scholar]
- 43.Yokota Y, Moteki H, Nishio SY, et al. Frequency and clinical features of hearing loss caused by STRC deletions. Sci Rep. 2019;9(1):4408. doi: 10.1038/s41598-019-40586-7 [DOI] [PMC free article] [PubMed] [Google Scholar]
- 44.Mehta D, Noon SE, Schwartz E, et al. Outcomes of evaluation and testing of 660 individuals with hearing loss in a pediatric genetics of hearing loss clinic. Am J Med Genet A. 2016;170(10):2523-2530. doi: 10.1002/ajmg.a.37855 [DOI] [PubMed] [Google Scholar]
- 45.Molecular Otolaryngology and Renal Research Laboratories . OtoSCOPE genetic hearing loss testing. Accessed June 28, 2022. https://morl.lab.uiowa.edu/otoscope%C2%AE-genetic-hearing-loss-testing-v9
- 46.Korver AMH, Konings S, Dekker FW, et al. ; DECIBEL Collaborative Study Group . Newborn hearing screening vs later hearing screening and developmental outcomes in children with permanent childhood hearing impairment. JAMA. 2010;304(15):1701-1708. doi: 10.1001/jama.2010.1501 [DOI] [PubMed] [Google Scholar]
- 47.Tomblin JB, Barker BA, Spencer LJ, Zhang X, Gantz BJ. The effect of age at cochlear implant initial stimulation on expressive language growth in infants and toddlers. J Speech Lang Hear Res. 2005;48(4):853-867. doi: 10.1044/1092-4388(2005/059) [DOI] [PMC free article] [PubMed] [Google Scholar]
- 48.Harrison RV, Gordon KA, Mount RJ. Is there a critical period for cochlear implantation in congenitally deaf children? analyses of hearing and speech perception performance after implantation. Dev Psychobiol. 2005;46(3):252-261. doi: 10.1002/dev.20052 [DOI] [PubMed] [Google Scholar]
- 49.Tropitzsch A, Knoblich N, Muller M. Cochlear implant performance in patients with TMPRSS3 mutations. Laryngorhinootologie. 2018;97:S272. doi: 10.1055/s-0038-1640655 [DOI] [Google Scholar]
- 50.Shearer AE, Tejani VD, Brown CJ, et al. In vivo electrocochleography in hybrid cochlear implant users implicates TMPRSS3 in spiral ganglion function. Sci Rep. 2018;8(1):14165. doi: 10.1038/s41598-018-32630-9 [DOI] [PMC free article] [PubMed] [Google Scholar]
- 51.Miyagawa M, Nishio S-Y, Sakurai Y, et al. The patients associated with TMPRSS3 mutations are good candidates for electric acoustic stimulation. Ann Otol Rhinol Laryngol. 2015;124(1)(suppl 1):193S-204S. doi: 10.1177/0003489415575056 [DOI] [PubMed] [Google Scholar]
- 52.Holder JT, Morrel W, Rivas A, Labadie RF, Gifford RH. Cochlear implantation and electric acoustic stimulation in children with TMPRSS3 genetic mutation. Otol Neurotol. 2021;42(3):396-401. doi: 10.1097/MAO.0000000000002943 [DOI] [PMC free article] [PubMed] [Google Scholar]
- 53.Carlson RJ, Avraham KB. Emerging complexities of the mouse as a model for human hearing loss. Proc Natl Acad Sci U S A. 2022;119(35):e2211351119. doi: 10.1073/pnas.2211351119 [DOI] [PMC free article] [PubMed] [Google Scholar]
Associated Data
This section collects any data citations, data availability statements, or supplementary materials included in this article.
Supplementary Materials
eFigure 1. Ages at diagnosis of hearing loss
eFigure 2. Age-specific audio profiles of individuals with hearing loss, by causative gene.
eFigure 3. Results of newborn hearing screen for study participants, by gene ultimately found to be causative.
eTable 1. Gene list for panel
eTable 2. Rates of genetic diagnosis by multiplex vs singleton family status and ancestry.
eTable 3. Change in hearing thresholds per year for children with mutations in progressive hearing loss genes
eTable 4. Change in hearing thresholds per year for children with mutations in TMPRSS3
eTable 5. Comparison of progression of hearing loss at each frequency for children with fs/miss vs miss/miss mutations in TMPRSS3
eTable 6a. ANCOVA of speech perception Z-score with effects of genes, age at implant, months since implant, and their interactions
eTable 6b. ANCOVA of speech perception Z-score with effects of individual genes
eTable 7. Variants responsible for hearing loss in the cohort
Data sharing statement