Abstract
The present world is now facing the challenge of proper management and resource recovery of the enormous amount of plastic waste. Lack of technical skills for managing hazardous waste, insufficient infrastructure development for recycling and recovery, and above all, lack of awareness of the rules and regulations are the key factors behind this massive pile of plastic waste. The severity of plastic pollution exerts an adverse effect on the environment and total ecosystem. In this study, a comprehensive analysis of plastic waste generation, as well as its effect on the human being and ecological system, is discussed in terms of source identification with respect to developed and developing countries. A detailed review of the existing waste to energy and product conversion strategies is presented in this study. Moreover, this study sheds light on sustainable waste management procedures and identifies the key challenges to adopting effective measures to minimise the negative impact of plastic waste.
Keywords: Plastic waste, Waste generation, Waste management, Waste recycling, Challenges
Highlights
A comprehensive analysis of global plastic waste generation and its effect on land and marine environment is conducted.
Plastic waste management technologies for both land and marine environment are reviewed thoroughly.
The modern technologies for waste-to-energy and waste-to-production conversion are discussed in this paper.
The potential challenges and a way forward for sustainable management technologies are presented.
Introduction
Plastic is one of the major inorganic solid waste fractions in our daily municipal solid waste (MSW) production. Ever-increasing population, rapid urbanization, and industrial advancement are some of the key driving factors for creating critical man-made problems that eventually threaten the existence of living beings on this earth. With the industrial scale adoption of synthetic polymer in the 1940s, a new era of materials and manufacturing technologies was unlocked. Plastic has been a ubiquitous commodity for more than 50 years in every aspect of our lives, covering households, construction, packaging, health care, automotive, etc. It is mainly a petroleum-derived non-biodegradable with a unique polymeric structure that offers low specific weight, low thermal and electrical conductivity, and high durability (plastic bags-20 years, plastic bottles-450 years, fishing line-600 years), excellent mechanical properties, reasonable pricing, etc. (Eagle et al. 2016; Wang et al. 2016; Landon-Lane 2018; Mazhandu et al. 2020a, b). Plastics are mainly of two types—thermosetting and thermoplastics. Thermosetting plastics or engineered polymers, like polyurethanes, phenolic resins, and acrylonitrile butadiene styrene, have a crosslinked structure that ensures high mechanical strength, thermal stability and resistance to corrosion. On the other hand, plastic materials like polyethene (PE), polypropylene (PP), polyvinylchloride (PVC), and polyethene terephthalate (PET) contain linear chains and flexible structures to offer an easy modification to any shape by applying heat (Mourshed et al. 2017; Horodytska et al. 2019).
However, pure plastics need additives (plasticisers, stabilisers) to attain certain desired properties as they have higher degradability with lower thermal, mechanical, and physical properties (Murphy 2001). This development of plastics not only eases human life in a convenient way but also generates a large volume of waste which is hazardous and poses threats to all living beings and to the environment. Plastics, in the form of bottles, bags, containers, cups, accessories, packaging materials, etc., make a significant portion (about 10–13%) of the total inorganic content in MSW (Moharir and Kumar 2019). At present, plastics, metals, glass, papers and many other organic and inorganic contents from MSW and megacities around the world are suffering badly to handle this increasing volume of MSW (2 billion tonnes (BT) per year) (Mourshed et al. 2017; Masud et al. 2019, 2022; Moharir and Kumar 2019; Mazhandu et al. 2020a, b). It is estimated that single used plastic products (polybags, food utensils, packaging materials, etc.) contribute about 50% of that plastic waste and end up their journey in landfill sites or in the marine environment (Duru et al. 2019). An extensive research focus should be given to the post-consumer of plastic products, even for thermoplastics (polypropylene, polyethene, high-density polyethene), to tackle the environmental challenges. As every individual polymer group has their identical physical and chemical composition, understanding the characteristics properties are essential to estimate about the recycling and energy recovery potential from these polymer groups. However, sustainable waste management planning, sharing technical know-how among developed and undeveloped countries, conducting campaigns to make aware mass people about the adverse effect of plastic pollution as well as their role as global citizen to minimise this impact are the primary considerations to enjoy the full advantages of plastic.
This high amount of waste plastics consequently affects the ecosystem through soil pollution by landfilling, marine pollution by ocean dumping, and air pollution by open dumping (Mourshed et al. 2017, 2019; Paletta et al. 2019). Moreover, these problems will be added in a cumulative manner throughout the entire life cycle of plastic and threatens to ecological balance. In the first scenario, it is a complicated process (mainly for the undeveloped countries) to collect and sort plastic waste from other solid waste and arrange special recycling or dumping process. Secondly, due to lack of space or dumping sites, small and underdeveloped countries prefer incineration or open burring to reduce the mass and volume of plastics, and these processes emit a significant amount of greenhouse gas (GHG), COx, NOx, and different types of poisonous gases into the environment. However, open dumping has the same issue with spreading odour and infectious diseases. Thirdly, while dumping on the land, it turns soil infertile and contaminates groundwater; for sea dumping, marine life is heavily disturbed as plastic floating and sustains for hundreds of years. Lack of infrastructure, incorrect dumping techniques, inadequate legislation, and mismanagement are the key factors for this plastic pollution. it is estimated that about 80% of those wastes end at their disposal in land (Landon-Lane 2018; Paletta et al. 2019). Moreover, clogging of drainage system, flooding and natural disasters, infertility of soils, and contamination of water are the common results of improper plastic waste management systems (Carpenter and Wolverton 2017; Mourshed et al. 2017).
On the other hand, plastics are used accross almost every sectors (i.e., dometic, food packaging, industry, etc.) resulting in generating a great deal of plastic waste that ultimately affects the ecosystem. According to World Bank group report, plastics comprise about 5–12% of the world’s total waste generation (20–30% by weight) (Awasthi et al. 2017; Kaza et al. 2018) and about 60% of plastics enter into environment as plastic waste (PW) (Zhang et al. 2021). From 0.35 million tonne (MT) annual production in 1950 (8.4% annual growth rate), PW generation reached more than 360 MT in 2018 (Horodytska et al. 2019; Paletta et al. 2019; Ayeleru et al. 2020; Zhang et al. 2021). China holds the first position in producing plastic materials and accommodates about 29.4% of the world’s total demand, followed by another two giant regions, Europe and North America, with 18.5% and 17.7%, respectively (Horodytska et al. 2019). In Fig. 1, a global snapshot of plastic production and disposal techniques has been illustrated from 1980 to 2015. Geyer et al. reported that out of 381 Mt of plastic production in 2015, only 19.5% got recycled, 25.5% treated in incineration plants, and about 55% left as discarded. Moreover, about 80% of PW dumping ended up inland as a final destination (Landon-Lane 2018; Paletta et al. 2019) and clogging of a drainage system, flooding and natural disasters, infertility of soils, and contamination of water are the common causes of improper plastic waste management system (Carpenter and Wolverton 2017; Mourshed et al. 2017). It is interesting to note that, although China is the largest plastic producer, it consumes almost one-fourth compared to North America or Europe (PlasticsEurope 2016). In 2015, USA recycled 9%, waste to energy (WtE) conversion 15%, and disposed of 76% of their total 34.56 MT of PW (EPA 2015), whereas, in 2016, the first EU countries (including Norway and Switzerland) did higher recycling (31.1%) than landfilling (27.3%) out of their total 27.1 Mt of PW (Horodytska et al. 2019). However, for poor and developing countries, it becomes challenging to arrange proper collection (as a significant portion of PW remains unattained and mixed with MSW) and transfer to landfill sites as they still have scarcity of living and agricultural land space (Ayeleru et al. 2020). Though there are also limitations in proper waste data management systems in developing countries, it is estimated that only Indonesia, India, Thailand, Malaysia, Iran, and Bangladesh from the Asian region produce around 1 Mt of PW (Dhokhikah et al. 2012), whereas only seven cities of India is responsible for generating 500 kT of PW every year (Kumar et al. 2017). Moreover, PW generation rate varies with income level as follows: high income (USD 12, 476 or more): 13%, upper middle income (USD 4036 to USD 12,475): 11%, lower-middle (USD 1026 to USD 4035): 11%, low income (USD 1,025 or less): 6.4% (Kaza et al. 2018). From the per capita PW generation pattern shown in Fig. 1, Europe, United States of America (USA), Canada is at the top in the ladder, and their level of income, the standard of living, lack of consumer awareness, etc. plays a key role for this case (Mourshed et al. 2017; Horodytska et al. 2019; Masud et al. 2019). This high amount of waste plastics consequently affects the eco-system through soil pollution by land filling, marine pollution by ocean dumping, air pollution by open dumping as they are not a part of our food chain (Mourshed et al. 2017; Paletta et al. 2019). Lack of infrastructure, improper and unplanned dumping, inadequate legislation and mismanagement are the key factors for this plastic pollution.
Fig. 1.
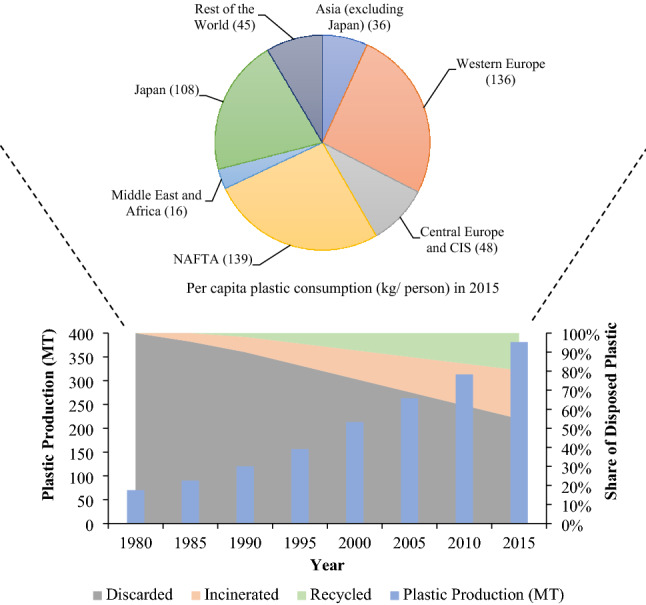
A global snapshot of plastic generation, consumption and disposal (NAFTA-Canada, Mexico, United States region, CIS-Commonwealth of Independent States) (Jambeck et al. 2015; Geyer et al. 2017a, b; Horodytska et al. 2019)
In line with plastic pollution inland, nowadays, marine pollution from PW is becoming a great concern for living beings, and it is estimated that about 60–80% of marine derbies contain plastic (Paletta et al. 2019; Peng et al. 2020a, b). However, plastic pollution in marine environment was firstly introduced in early 1970, and not that much large-scale investigation has been covered for the past 40 years (Jambeck et al. 2015). About 80% of marine debris has its origin from land sources, while the discharge from ocean vessels (commercial, military, public transport) or ship casualties are also significant. Although most of the PW data and resources mainly cover land-based PW, however, by considering the population density, income level, and solid waste generation rate, Jambeck et al. calculated that only in 2010, about 4.8–12.7 Mt of total 275 MT of PW generation entered into ocean from 192 coastal countries while in 1975 the total solid waste portion was about 6.4 Mt (Jambeck et al. 2015). By the year 2050, it is estimated that cumulative plastic production will reach 34 Bt, and at pace with the current consumption rate, around 12 Bt of PW will find their final destination either in landfills or marine areas (Geyer et al. 2017a, b; Silva et al. 2020). Waste patches in the Atlantic and Pacific reached approximate 100 Mt, and around 80% of that contains plastics (Sevigné-Itoiz et al. 2015). According to United Nations Environment Program (UNEP), plastic pollution is one of the most emerging environmental problems in oceans and the estimated value for its annual damage is USD 13 billion (Peng et al. 2020a, b). It is estimated that between 2015 and 2017, the plastic accumulated in the ocean increases more than 33-times, alarming for taking actions for PW management (Peng et al. 2020a, b), whereas their consequence on marine life can be articulated from the garbage patch in Pacific, North Atlantic, Indian oceans as well as at sea surface and seafloor of Arctic sea ice (Obbard et al. 2014; Peng et al. 2020a, b). Human activities, such as industrial dumping, leaching of chemicals (transported either by rainfall or though rivers and canals), dumping of hazards solids from populated islands, and transportations (ships and fishing boats) are causing serious hamful to the survivability of arctic ecosystem (Monteiro et al. 2018; Varotsos and Krapivin 2018; Paletta et al. 2019). Weather conditions (temperature, humidity content, pressure, etc.) and long durability of plastic debris also form micro fragments of plastics or microplastics, which is extremely challenging to clean up from the ocean, and the condition gets worst when these microplastics accidentally get ingested by marine invertebrates (Goldstein and Goodwin 2013). Moreover, roughly 51 trillion microplastics from different plastic materials are floating in sea, which is consumed as sea food by marine animals and human being (also in the form of salt) (Mazhandu et al. 2020a, b). According to a statics in 2015, 35% of these microplastics have been contributed by synthetic textiles, followed by 28% from car tires, 24% from city dust and the rest of the portion from road markings, marine coatings, personal care products, and plastic pellets, etc. (Statista 2015). In addition, toxic elements from pesticides or other chemicals like polybrominated diphenyl ethers (PBDEs) get absorbed in plastics and ingested by living species inland and marine life directly or indirectly (through food chain) (Mazhandu et al. 2020a, b). Recently, ocean ecosystems and terrestrial ecosystems are getting much affected by tons of plastic in beach areas thrown by visitors and inhabitants (Chiba et al. 2018; Ng et al. 2018).
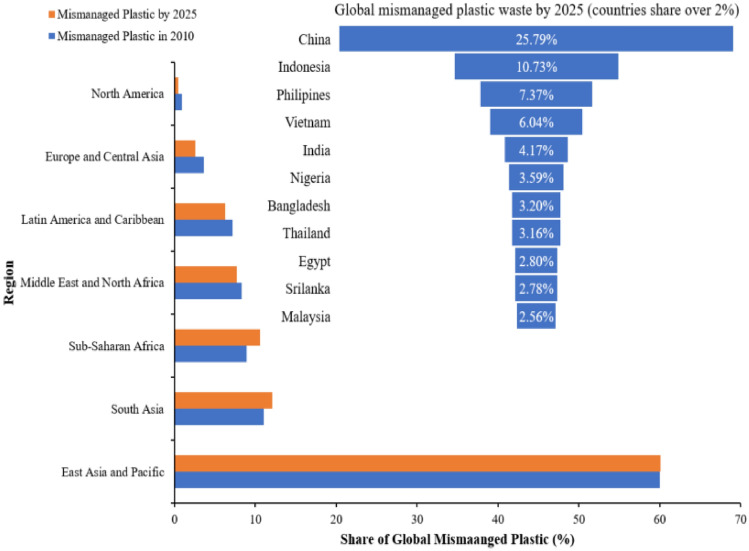
The outcome of this plastic pollution in both land and marine environment will become much more severe to total ecosystem due to unsustainable production, utilization or consumption pattern, disposal after utilization, collection and post-processing operations. Plastic waste mainly litters enter into environment due to the lack of proper collection (limited workers and supporting arrangements to proceed collection) or from mismanagement after collection (open burning, unwise dumping, poorly managed dumping sites). From the plastic production stage to processing and disposal, about 1781 Mt equivalent of CO2 was emitted into environment in 2015, and it is predicted to reach up to 6500 Mt by 2050 (Mazhandu et al. 2020a, b). On the other hand, as the materials are not fully contained, leaking and transportation to the land and marine environment can also happen by waterways (drains, canals, rivers), winds, etc. From Fig. 2, it can be seen that in the East and Asia Pacific region, mismanaged rate of waste plastic is higher, and it is about 60%. Although the waste generation and collection rate depend on income level, developed and rich countries have better waste management technologies, dumping areasand waste collection facilities, which helps to minimise the mismanaged plastic volume, and North America had the lowest share (about 0.9%) in 2010. However, if we look at the country-wise estimated mismanaged plastic share in 2025, it is also obvious that Asian countries are in the leading position, and China holds the first position by covering 25.79% of total global production, which is definitely alarming and urges for immediate action. According to the report of the Ministry of Environment, Forest and Climate Change of India, out of 15,000 tons/day of plastics, only 9000 tons are collected and processed, whereas the rest 6000 tons are dumped in landfill sites or drained into the sea (Moharir and Kumar 2019).
Fig. 2.
The scenario of global mismanaged plastics waste (Jambeck et al. 2015)
Therefore, it is high time to tackle the mismanaged plastics rather than them being tangled in the environment and, at the same time, ensure possible waste to energy (WtE) and waste to products (WtP) conversion. Therefore, sustainable plastic waste management should be ensured by the simultaneous action of non-technical/non-instrumental and technical/instrumental approaches. Non-technical/non-instrumental approach mainly comprises the increasing public awareness, strengthening existing laws by the government and facilitating ease of PW collection or developing collection rate and strategies. Whereas post-collection treatments of PW involves the conversion of PW into WtP and WtE by the evolvement of most modern technologies and involving all stakeholders in society (such as manufacturers, consumers, and waste collection staff) for the successful implementation of PW control plans and strategies. However, improving existing waste management skills and introducing modern techniques along with the implementation of sustainable and less production and consumption strategies are significant contributors to the minimisation of plastic waste generation as well as to meet the Sustainable Development Goals (SDGs)-2030 agenda set by UN (Varotsos and Cracknell 2020). Making these actions happen in reality needs the active participation of policymakers, all the stakeholders, including consumers, manufacturers, waste management workers (formal and informal) and above all, awareness among the mass people.
In this review, we provide an overview of the main sources of plastic waste generation and their impact on environmental pollution. A comprehensive analysis of global plastic waste generation and its effect on land and marine environment is discussed. Plastic waste management technologies for both land and marine environment are reviewed thoroughly. Also, the modern technologies for WtE and WtP is discussed in this paper. Later on, this current study sheds light on the potential challenges as well as gives some future directions for sustainable management of the overwhelming generation of plastic waste.
Sources of Plastic
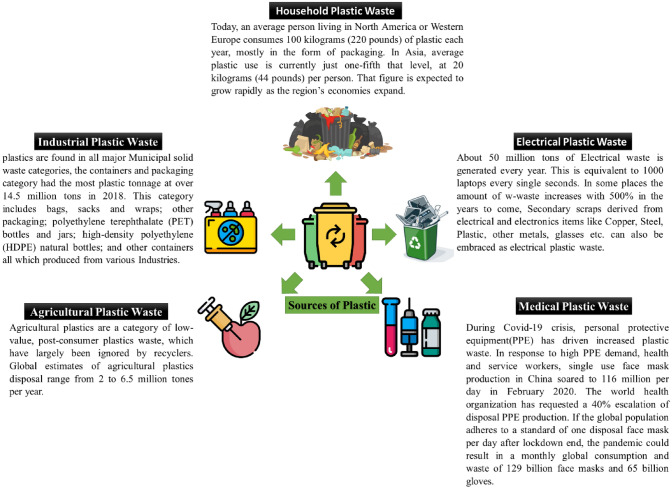
Today modern life flourishes with plastic products and would be impossible without plastics. But the increasing growth in the number of plastics produced has led to an enormous plastic waste generation which has over-stripped society’s aptitude for managing it effectively. Global production of fossil fuel-based plastic experienced an intense increase from 2 MT in 1950 to more than 454 MT in 2018 (Lusher et al. 2017) and a global source-wise plastic waste generation snapshot is given in Fig. 3. About 9.7 billion tonnes (BT) of plastics were produced between 1950 to 1980, and it is predicted that plastics production will be doubled by 2025 and tripled by 2050 (Lusher et al. 2017). It is estimated that around 343 MT of plastic waste is produced every year (Geyer 2020). The major waste primarily originated from 35 MT from North America, 45 MT from Europe and Central Asia, and 57 MT from East Asia and the Pacific region.
Fig. 3.
Sources of different types of plastic wastes (Gwada et al. 2019; Lanorte et al. 2017; Ding et al. 2021; Unicef 2021; Klemes et al. 2020)
Household Wastes
Household waste, also known as residential waste, mainly contains disposable materials generated by households. Shopping bags, packaging from different food items, printed matters, nappies, vegetable garbage, animal garbage, etc., are the main household wastes. These wastes contain both hazardous and non-hazardous wastes. Food waste, paper, bottles, etc., are non-hazardous waste, and plastics, dry cells, and electronic and medical wastes (MW) are hazardous wastes. Hazardous waste contains toxic organic compound, high concentration heavy metals, and ozone-depleting compounds, which may be flammable or explosive and also requires special collecting and dumping process. Table 1 lists the main plastic stuff used in household activities and respective provisions to handle after consumption.
Table 1.
Household plastic wastes sources (Gwada et al. 2019)
| Sources | Type | Comment |
|---|---|---|
| Salad dressing containers, processed meat packages, plastic soft drink and water bottles | PET | Recyclable |
| Milk bottles, shampoo bottles, detergent bottles, oil jerry cans, and toys | HDPE | Recyclable |
| Fruit plastic packing, sweet trays and blister packaging | PVC | Not Recyclable |
| Bread bags, frozen food bags, squeezable bottles, fibre, bottles, clothing, furniture, carpet, shrink‐wraps and garment bags | LDPE | Recyclable |
| Margarine and yoghurt containers, caps for containers, and wrapping to replace cellophane | PP | Recyclable |
| Egg cartons, fast food trays, and disposable plastic silverware | PS | Recyclable upto some extent |
|
This includes an item which is made with a resin other than the six listed above or a combination of different resins |
Other | Not recyclable |
LDPE low-density polyethene, PS polystyrene
Industries
Plastic wastes arising from the massive manufacturing, processing, and packaging industries are called industrial plastic wastes. Industrial plastics come from demolition and construction companies, electrical and electronics industries, automotive industries, packaging industries, small and medium enterprises, etc. The good thing is plastics from these sources are sufficiently clean and free of adulteration and available in large quantities. But still, they require proper guidelines and regulations for the dumping and recycling process to ensure maximum utilization with minimum damage to environment. However, MSW is heterogeneous as they are a mixture of recyclable, degradable and hazardous materials. Repalletization and remoulding are easy and effective for treating homogenous plastic wastes instead of dumping or burning them with general MSW. When these plastics are heterogeneous with mixed resins, they are unsuitable for reclamation as the resins have individual processing temperatures and pressure. Table 2 illustrates the sources of industrial plastic waste.
Table 2.
Industrial Plastic wastes sources (Gaylor et al. 2013)
| Industrial sector | Industrial operation | Residues/ Waste |
|---|---|---|
| Ordnance and accessories | Manufacturing and assembling | Metals, plastic, paper, wood, chemical residues |
| Food and kindred products | Processing, packaging and shipping | Meats, fats, oils, bones, offal, vegetables, fruits, nuts and shells, and cereals |
| Textile mill products | Weaving, processing, dying and shipping | Clothing and wrapping residues |
| Apparel and other finished products | Apparel and other finished products | Clothing, wrapping, metals, plastics, rubber |
| Chemical and related products | Manufacturing and preparation of inorganic and organic chemicals ranging from drugs and soaps to paints, varnishes and explosives | Organic and inorganic chemicals, metals, plastic, rubber, glass, oils, paints, solvents, pigments |
| Rubber and miscellaneous plastic products | Manufacturing of fabricated rubber and plastic products | Scrap rubber and plastics, lampblack, curing compounds, dyes |
| Machinery (except electrical | Manufacturing of equipment for agriculture, construction, mining, elevators, moving stairways, conveyors, trucks, trailers, stackers, etc., | Metal scrap, slag, wood, plastic, wire, rubber, resins, cloth, solvents, petroleum products |
| Electronic and electrical components and equipment | Manufacturing of electrical equipment and appliances, and communication apparatus, including machining, drawing, forming, welding, stamping, winding, painting, baking and firing operations | Metal scrap, carbon black, glass, exotic metals, rubber, plastic, resins, fibres, cloth residues |
| Transportation equipment | Manufacturing of motor vehicles, motorcycles, buses, aircraft and boats, including accessories, spare parts and repairs | Metal scrap, glass, fibre, wood, rubber, glass, cloth, paints, plastic solvents, petroleum products |
| Measuring, analysing and controlling instruments | Manufacturing and engineering, laboratory and research instruments and equipment | Metals, plastic, glass, wood, rubber, fibres, abrasives |
| Miscellaneous manufacturing | Manufacturing of plated ware, toys, amusement, sporting and athletic goods, buttons, brooms, signs, advertising displays, etc. | Metals, glass, plastic, resins, leather, rubber, bone, cloth, straw, paints, composite materials, etc. |
Agriculture
Nowadays, plastics are inevitable in the agriculture sector. They are used for mulching, irrigation pipes, silage covering, crop protection, post-harvesting operations, packaging materials for seed and fertilizers, etc. A large amount of plastic is used for nets and coverings to protect crops from adversative weather conditions, insects, and animals. It is estimated that yearly consumption of agricultural plastics around the world is about 6.5 MT that results in a huge agricultural plastic waste (APW) (Lanorte et al. 2017). On the other hand, the problem with overloaded pollution is an opportunity as they can be easily consolidated and processed. However, only a small portion of the agricultural plastic waste is recycled, but this varies widely from country to country and also depends on facility available at regional level. The majority of agricultural plastic waste is either buried in the soil or burned uncontrollably in the fields, or discarded infields and most of them ends up in the landfills or in nearby the rivers or canals (Islam et al. 2022). Table 3 represents a source of plastic waste in agricultural sectors and their relative impact on waste management strategies.
Table 3.
Agricultural plastic wastes
| Sector | Plastic Material | Application | Comment |
|---|---|---|---|
| Agrochemical packaging | HDPE with a thin internal layer of a barrier film (e.g., polyamide) | Agrochemicals, particularly the liquid ones, are packaged in plastic containers to ensure permeability | HDPE is the most accessible plastic polymer to recycle |
| Fertilizer bags | LDPE, HDPE, PP | Fertilizers—organic fertilizers (composed of decayed plant/animal matter) or inorganic fertilizers (composed of simple chemicals and minerals) are packaged in special fertilizer sacks | LDPE is a recyclable material. However, just because something is recyclable does not ensure it will be recycled. LDPE has a proclivity to tangle in recycling machines |
| Irrigation pipes | HDPE, PE, PVC |
usually used to assist in growing crops in dry areas and during periods of inadequate rainfall Drip irrigation tubing consists of hoses specifically designed to carry and drip water slowly into the soil exactly at the plant root zone, where it is needed |
PVC is not recyclable, and PE can be recyclable and reused |
| Plastic nets | HDPE |
Permeable covers are extensively used in certain types of cultivation, such as fruit-tree farming, and for hail, bird and insect protection Moreover, nets are used as insect-protecting screens along greenhouse ventilation openings and shading screens above greenhouse roofs |
HDPE is the easiest plastic polymer to recycle |
| Photo- or thermo-degradable films | PE films |
PE films containing as additives special pro-oxidants are commercialized as degradable for various applications (including degradable mulching films) These films degrade into very small fragments under solar radiation (UV) and/or heat It is claimed that the degradation fragments (or a portion of these fragments) can be assimilated by soil microorganisms |
The majority of plastic films are made of PE resin and are readily recyclable if the material is clean and dry |
Medical Wastes
A large quantity of medical plastic wastes (MPW) has been generated with modern medical advanced technologies and service coverage of health sectors. There is an urgent need for safer and cleaner disposal of MPW that includes plastics in the form of personal protection equipment (PPE), gloves, syringes, canula pipes, medicine coverings, etc. Only in 2018, around 200 large and medium-sized cities in China generated about 817,000 tons of MPW (Ding et al. 2021). During the COVID-19 crisis in 2020, UNICEF shipped over 200 million medical masks since January 2020, which is a huge source of MPW (Unicef 25 January 2021). However, the generation of MPW increased by 370% in Hubei Province, with a high proportion of plastics (Klemeš et al. 2020). From 20 January to 31 March, the MW in China was about 207 kilo tonnes (Klemeš et al. 2020). A detailed listing of MPW sources and their composition and dumping conditions is presented in Table 4.
Table 4.
Medical plastic wastes (Guo et al. 2020)
| Sources | Plastic waste | Plastic material | Comment |
|---|---|---|---|
| Hospital Cafeteria | Bag (clear/black) | HDPE/PS | Recyclable |
| Bag (white-trash) | PS | Not recyclable in normal collection | |
| Bottles (drink) | PET/HDPE | PET and HDPE is the most recyclable plastic in the world | |
| Bottles (milk/water) | HDPE/PET | HDPE and PET is the most recyclable plastic in the world | |
| Bowl (soup/food) | PS | Not recyclable in normal collection | |
| Bowl/cover (dessert/fruit) | PET | Recyclable | |
| Bucket (ice/waste stream) | HDPE | Recyclable | |
| Cover (food/bread) | PS | Not recyclable in normal collection | |
| Cover (coffee/cold drink) | PS | Not recyclable in conventional procedure | |
| Cup (hot/cold) | PS | Any black plastics are not recyclable | |
| Dish (food/bread) | PS | Not recyclable in all conditions | |
| Food carrier (colourless) | PS | Not recyclable in all conditions | |
| Ketchup/sauce | PET/LDPE |
PET is completely recyclable LDPE has a tendency to tangle in recycle machine |
|
| Packaging (snack/food, spoon) | PET/LDPE |
PET is the most recycled plastic in the world LDPE has a tendency to tangle in recycling machines |
|
| Spoon/knife/pork | PS | Not recyclable in normal conditions | |
| Straw (colour/colourless) | PS | Styrofoam products are made out of PS plastic and sometimes can be recycled | |
| Tray | PS | Not recyclable in conventional procedure | |
| Emergency room | IV Bag | PVC, HDPE, PP |
PVC is difficult to recycle, and sometimes it is not recyclable depending on waste composition HDPE is recyclable PP is a recyclable thermoplastic polymer |
| Medical | PVC, PE, PS |
PVC is not always recyclable PE is recyclable PS is not recyclable in normal conditions |
|
| Film | PS | Not recyclable in normal condition | |
| Patient kits | PVC |
Not always recyclable Need appropriate technology |
|
| Disposable gloves | PVC, PP, PS |
PVC is not recyclable always PP is recyclable PS is not recyclable in conventional procedure |
|
| Sharps | PP, PE | Recyclable | |
| Other plastics | PET, HDPE, PS | PET and HDPE are completely recyclable PS is not always recyclable | |
| Hospital Laboratories | IV bag | PVC, HDPE, PP, ABS |
HDPE, PP and ABS are easily recyclable PVC can be sometimes recyclable in appropriate condition |
| Blood bag | PVC | Recyclable in appropriate conditions | |
| Sharps | PE, PP | Recyclable | |
| Tubing | PVC HDPE |
HDPE is completely recyclable PVC is not always recyclable |
|
| Gloves/lab. ware | PS, PVC, PP | N/A | |
| Medical/ packaging | PE, PS, PVC | N/A | |
| Patient kits | PVC | N/A | |
| Nursery items | PP PE | N/A | |
| Other plastics (blood collection tubes) | PVC PS | N/A |
Various plastic-based personal protective equipment (PPE) played a key role in protecting the people during COVID-19 outbreak. Since the outbreak of the coronavirus, there seems to be an unprecedented upsurge in single use plastic (SUP) such as protective hospital suits, gloves, face masks, hand sanitizer bottles, plastic takeout bags, food and pharmaceutical product containers, reagent kits and so on (Silva et al. 2020; Benson et al. 2021). Thus, millions of SUPs related to the pandemic have been released into the environment, posing major environmental risks (Benson et al. 2021). If every person in the world used and discarded just one mask each day, only six nations—India, the United States, Brazil, Nigeria, and the United Kingdom—would produce at least 702, 386, 219, 140, 75, and 45 million facemasks made of polypropylene plastic each day. These facemasks could take more than 450 years to decompose and could release micro plastic as they break down (Benson et al. 2021). Thus, it is estimated that 22.4–53.6 tons of CO2 gas emission takes place from facemask production, waste treatment plants and transportations of the above mentioned six countries have been produced approximately 1.6 Mt facemasks in a daily basis (Graulich et al. 2021).
The situation regarding the use of corona-related plastics in Bangladesh is also a matter of headache. About 14,500 tons of plastic waste (PW) were disposed of in a single month (March–April, 2020), according to data provided by ESDO, with 3076 tons of the total being disposed of by Dhaka City alone. A total of 5877 tons from 1216 million discarded hand gloves, of which 3039 tons are comprised of plastic, were the main source of PW. 1592 tons came from used medical masks, and 900 tons came from hand sanitizer bottles (Graulich et al. 2021). Aquatic environments are open to the ocean and around 1.56 billion facemasks landed into the ocean. Community scientists stated that the number of PPE that were discarded was around 107,212 pieces from waterway and beaches. Different facemask in the ocean, was seen in the nest of birds, some birds died falling a victim to this waste (Ammendolia et al. 2022). The number of medical masks used by USA escalated to 89 million in the COVID situation and UK used near about 24.37 billion masks per year. There is also a threat of carbon dioxide emission due to increasing plastic waste. The number of facemasks used by China and Japan per day is near around 14.8 million (Dey et al. 2023). Disposal face mask is alarming for the biodiversity, which can harm the digestive system and cause internal blockage. The micro particle that is released due to the use of masks escalated to 1246.62 items which urges thereby to take necessary some steps; such as, introducing bio-degradable masks, raising awareness for the reuse of facemask after decontamination, reclaimable masks to minimise the spread of micro particles (Jiang et al. 2022). The use of a footprint calculator allowed researchers to examine temporal changes, shopper behaviours, and trends of plastic consumption. During the epidemic, there were restrictions against leaving the house that reduced single-use plastic. Bottle usage increased threefold, while food wrapper consumption increased by twofold. The customer's decision to use plastics may be influenced by government-led guidelines (Winton et al. 2022). In Sri Lanka the waste management was not adequate to deal with the plastic waste before the start of pandemic. Due to COVID, the burning of plastic increases to avoid contamination. Burning the plastic in an improper way impacts the environment. Awareness program can be useful for the people of Sri-Lanka (Jayasinghe et al. 2022). Pandemic has created a new plastic problem which has a huge impact on human health because of the chemical additives. The healthcare waste has increased up to 6 times and 30% of the beaches surveyed had PPE pollution. To solve the problem sufficient fund should be collected, and incentive should be taken to regulate the waste management policies (Rivas et al. 2022). There are some waste management policies like collecting the waste separately and disinfecting it. The COVID waste should be stored for 24 hours; then it should be taken to the biomedical waste treatment plant (Chowdhury et al. 2022). However, some of the most common wastes management conversion technologies those can be used for managing COVID wastes as well are pyrolysis, incineration, carbonization and gasification and the useful outputs can be listed as solid fuel, liquid fuel, heat and electricity (Al-Omran et al. 2021). An innovative solution includes the disposal of nitrile gloves to enhance the mechanical properties that the clay possess which shows an increase in close porosity (Zhu et al. 2022).
As most of the PPEs are made with plastic polymers, they turn out to be a huge provider of micro plastics in agricultural soil and rivers and are suspected to harm ecosystem health. Moreover, in Bangladesh, the lack of well-developed waste management facilities indirectly gives access to those MW from the hospitals and residential areas to farmland. So, it is important to focus on MW management without delay; otherwise, crop-growing soil health will be damaged.
Effects of Plastic Wastes
Soil
After collecting from households, offices, business centres, and industries, plastics are usually transferred to some secondary transfer station where the necessary sorting has been carried out. After then, recycling or reuse of plastics is conducted depending on the available infrastructure arrangement and technologies; otherwise, the PW are dumped in open space or landfill sites or burning in open space. Once plastics are integrated with the soil matrix, they can change the soil porosity and soil binding properties by affecting soil aggregation and water dynamics of soil. Plastic wastes, especially microplastics (MPs), can interact with multiple soil properties shown, as shown in Fig. 4. MPs contain toxic additives and hazardous contaminants such as polybrominated diphenyl ether (PBDE), perfluorochemicals (PFOS), heavy metals like copper, zinc, lead, etc., and the high dispersion capabilities of MPs allowed them to mix up with soil and degrade soil fertility (Gaylor et al. 2013; Wang et al. 2015; Brennecke et al. 2016; Hodson et al. 2017). Moreover, plastic also hinders the growth of earthworms and other useful microorganisms, which consequently lead to the infertility of soil. The appearance of plastics as ecosystem stressors affects soil health and changes soil biophysical properties, which creates a complex variation in the environmental behaviour of other pollutants in soil (Alimi et al. 2018; Wang et al. 2018). Stimulation of soil enzymes can be happened by the addition of microplastics to soil.
Fig. 4.
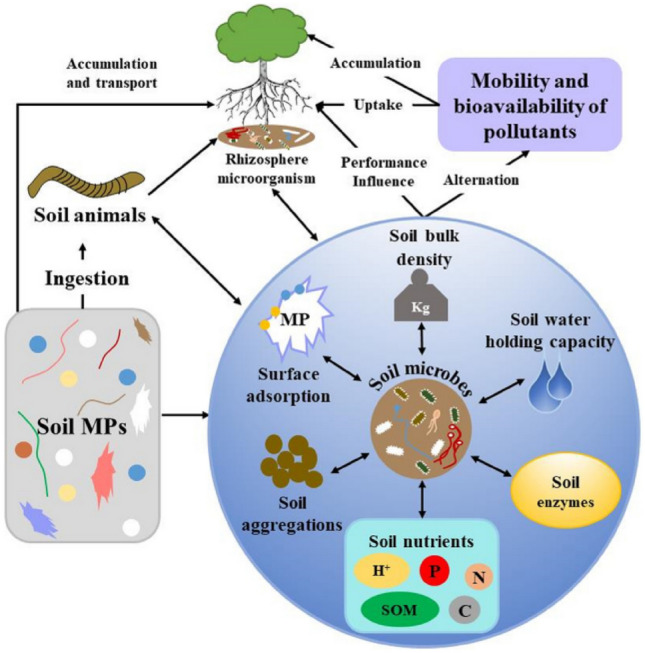
Influence of plastic wastes on soil as well as corresponding effects on plant growth and ion adsorption (Guo et al. 2020) (with permission to reuse)
Living Beings and Environments
While dumping plastic on open landfills, MPs get formed with the surrounding environmental factors (pressure, humidity, temperature, etc.) MPs can easily be passed and mixed with the environment (soil, water, storm) and get accumulated in human body by various exposures like consumption of food, dust inhalation, water contamination, etc. As MP's pollution in soil results in health and ecological risk, it is became a serious concern and needs to be addressed properly. A demographic illustration is presented in Fig. 5 to illustrate the pathways of MPS to the human body.
Fig. 5.
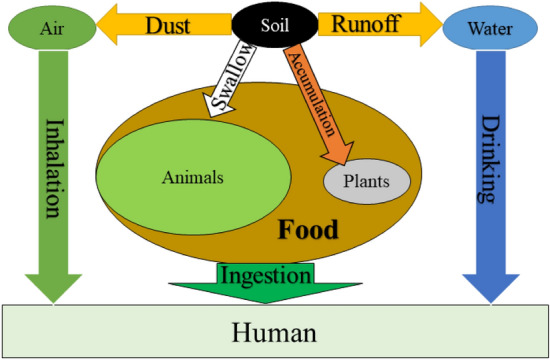
Human exposure to microplastic through different routes (Guo et al. 2020) (with permission to reuse)
Ingestion of MPs from dust is estimated at approximately 3223 and 1063 particles for children and adults, respectively (Dehghani et al. 2017). Also, many sea species ingest microplastics, such as crab, oyster, mussel, sea cucumber, etc., which are used as human food afterwards. MPs in these seafood damage not only the taste of the foods but also make it more toxic as all of these plastic merchandises contain compounds like formaldehyde, benzene, and dioxins. Some also contain some additives such as ultraviolet stabilisers and artificial pigments responsible for serious health issues like weight gain, endocrine disruption, insulin resistance, cancer, etc., which also pose serious health hazards for human beings (trash MAY 28, 2019).
Marine Environment
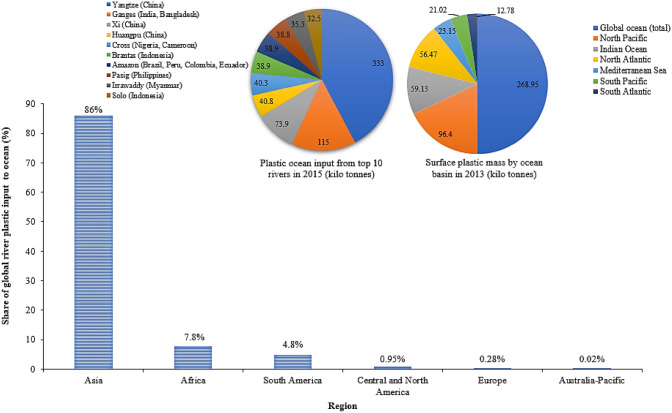
In addition to the existing 150 MT of plastic litter in marine environment, about 8 MT of plastic waste is added every year; however, UNEP predicts this rate of plastic entering into sea is close to 10–20 MT (Mazhandu et al. 2020a, b). This huge pile of plastic waste threatens marine life and consequently damage marine ecosystem. As microorganisms (like copepods and zooplanktons) in oceans take up 30% of CO2 from environment and help to mitigate GHG emission rate, it is essential to ensure their survival in marine environment (Cole and Galloway 2015). However, land-based sources are the considered as the major sources for marine pollution and according to a report, it is claimed that the pollution is mainly caused by population living in coastal areas (within 50 km of coastline) (Jambeck et al. 2015). Apart from land sources, rivers, tides and coastline sources are the main sources of plastic pollution in marine environment. Due to the buoyancy effect, plastics float on ocean surface, and wind waves force plastic to merge at the centre of oceanic gyres or oceanic basins. Thus, at the centre of the ocean, plastics’ pollution is higher, which is then distributed around the periphery (Eriksen et al. 2014). However, the presence of MPs, even at 75 MPs per millilitre and their ingestion of copepods cause not only the decrease in ingestion rate of CO2 by copepods but also affects their breeding (by releasing smaller eggs with a very low chance of successful hatching) (Cole and Galloway 2015). Figure 6 illustrates the pathways of plastic input from the river to ocean and the contribution from different continents in 2015 (Eriksen et al. 2014; Lebreton et al. 2017). Rivers flowing through Asia have a major contribution to marine pollution than others as most of the rivers have their lifeline through Asian countries as well as the population also plays a vital role in this surge in marine pollution. Moreover, the coastal population in Northern Hemisphere has a major effect on the highest accumulation of plastics in oceanic gyres and basins in this region. Although the Southern oceans have less coastline population than Northern Hemisphere but have shown a similar order of magnitude of plastic pollution; thus, the inner movement of plastic wastes among the oceanic gyres and basins now becomes a serious concern (Eriksen et al. 2014).
Fig. 6.
Global plastic input to the ocean
Overview
Plastic Entanglement
Plastic materials causing entanglement of marine animals is now a global problem which has a bad impact on conserving marine wildlife. A large number of sea turtles, birds, and other mammals are killed every year after ingesting or entangled plastics. Pacific loggerhead and Hawaiian monk seals are among 700 species that eat plastic wastes (diversity). According to the recent convention on biological diversity report, fatal entanglement and ingestion of marine debris by these marine animals have increased by 40% in the past decade (index 22 Aug 2013). Table 5 is the collected incidence of entanglement for different species, including seabirds, seals, and sea lions. The majority of entanglement materials are mainly plastics, such as fishing materials (like ropes and nets), water bottles, polybags, etc. The most common plastic material found is from fishing activities . It is approximated that > 6.4 tons of fishing gear are abandoned in the sea every year (Macfadyen et al. 2009). These materials continue to entangle with marine biota as most of them are made from lightweight, cheaper, and more durable synthetic materials. The entanglement of plastics for a specific species depends on its physical behaviour (Derraik 2002). Among the listed species in Table 5, the maximum entanglement rate is in the American crow in California, which is 5.6%. Marine plastics cause environmental, aesthetic, cultural and many other problems that are challenging to address (O’Brine and Thompson 2010). In today’s world, ‘clean-up’ of those plastics by recycling then managed by authorities or following organizations has become a challenging phenomenon to a global extent (Ryan et al. 2009).
Table 5.
Plastic entanglement by organisms
| Location | Species | Study period | Entangled material | Entanglement rate | References |
|---|---|---|---|---|---|
| South Georgia | Antarctic Fur Seals | 1988–1994 | Polypropylene packing band (42%), synthetic string (21%), fishing net fragment (14%) | 0.4% | (Arnould and Croxall 1995) |
| Cape Gantheaume, Kangaroo Island | New Zealand fur seals | 1989–1991 and 2000–2002 | Packing tape (30%), trawl netting (28%), lobster float rope (13%) | 0.73% | (Page et al. 2004) |
| Northwestern Hawaiian Islands | Hawaiian Monk Seal | 1982–1998 | Net, line, net and line combination, strap, ring | 0.70% | (Henderson 2001) |
| Southern Australia | Australian fur seals | 1997–2012 | Plastic twine or rope (50%), other plastics (20%), monofilament line (17%) | N/A | (Lawson et al. 2015) |
| Southeast Alaska and northern British Columbia | Steller sea lions | 2000–2007 | Packing bands 54%, rubber bands (30%), net (7%), rope (7%) | 0.26% | (Rodrigue 2017) |
| Seal Bay, Kangaroo Island | Australian sea lions | 1988–2002 | Monofilament netting (55%), packing tape (11%), trawl netting (11%), other rope (14%) | 0.83% | (Page et al. 2004) |
| Spanish Iberia and Mauritania | Northern gannets | 2007–2010 | Fishing ropes (73.5%), nets (11.8%), nylon fishing lines (14.7%) | 0.93% | (Rodríguez et al. 2013) |
| Davis, California | American crow | 2012–2013 | Synthetic twine, string and rope (77%), plastic strips (10%) | 5.6% | (Townsend and Barker 2014) |
| United States | Other Seals, sea lions, gull, fulmar and turtle | 2001–2005 | Fishing related (91.7%) such as fishing line, fishing hook, fishing string | N/A | (Thompson et al. 2009) |
Effect on Marine organisms
Plastics enter the marine environment directly through ocean-related activities like fishing, aqua-farming as well as from commercial ships and ferries etc. (Kershaw et al. 2011). In comparison to land-based plastics, marine plastics are difficult to control as they are randomly floating. It is estimated that 98% of these marine plastics come from land-based activities, while the rest 2% originate from ocean-based activities (Boucher and Friot 2017). Again, these plastics can be divided into two categories named ‘Microplastics’ (MPs) and ‘Nano plastics’ (NPs). Micro and nano plastic wastes and toxic chemicals cause several problems like physical damage, sub-lethal effects, various molecular modulations, etc., and Table 6 gives a detailed listing of those occurrences.
Table 6.
Toxic effects of plastic wastes on marine organisms
| Affected organisms | Sources of toxicity | References |
|---|---|---|
| Grass shrimp (Palaemonetes pugio) | Microplastic spheres, fragments and fibers | (Gray et al. 2017) |
| Marine rotifer (Brachionus koreanus) | Nanosized microbeads | (Kang et al. 2019) |
|
Dinoflagellate (Karenia mikimotoi) Marine microalgae (Skeletonema costatum) |
micro Polyvinyl chloride (mPVC) | (Zhang et al. 2016; Zhao et al. 2019) |
| Marine copepod (Paracyclopina nana) | Polystyrene nano and microbeads | (Jeong et al. 2017) |
|
Planktonic organisms (Daphnia magna) Marine planktonic species (Dunaliella tertiolecta and Artemia franciscana) |
Polystyrene nanoparticles | (Bergami et al. 2017; Brun et al. 2017) |
| Marine diatom (Phaeodactylum tricornutum) | Polystyrene nanoplastics | (Sendra et al. 2019) |
| European sea bass larvae (Dicentrarchus labrax) | Polyethylene microbeads | (Mazurais et al. 2015) |
|
Blue mussels (Mytilus edulis) Antarctic Krill (Euphausia superba) |
Polyethylene microplastics | (Dawson et al. 2018; Green et al. 2019) |
|
Marine polychaete worm (Sternaspis scutata, Magelona cincta) and Marine bivalve molluscs (Tellina sp.) Blue mussel (Mytilus edulis) |
Microplastics | (Browne et al. 2007; Naidu et al. 2018) |
| Sea birds (Pelecanoides garnotii, Pelecanoides urinatrix, Phalacrocorax bougainvillii, Spheniscus humboldti Pelecanus thagus and Larus dominicanus) | Plastic litter | (Thiel Lipids: Diversity et al. 2020) |
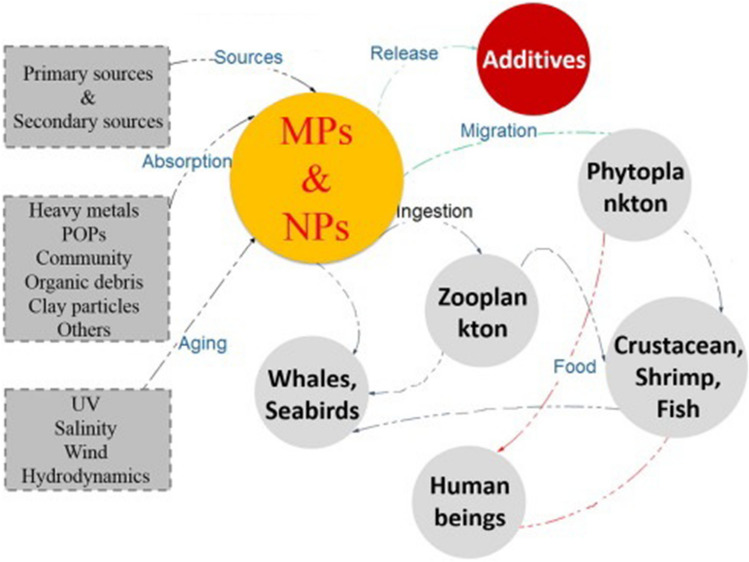
According to the sources shown in Fig. 7 (Peng et al. 2020a, b), MPs can be classified into primary and secondary sources (Li et al. 2016). Primary MPs are formed as derivatives from tearing, erosion, wastes from industrial processes, etc. Secondary MPs come from large litters in the environment by chemical, physical and biological forces (Peng et al. 2020a, b).
Fig. 7.
Micro plastics (MP) and nano plastics (NP) interact with other organisms and pollutants in marine life
Scenario of Plastic Waste and Its Management
At a Glance
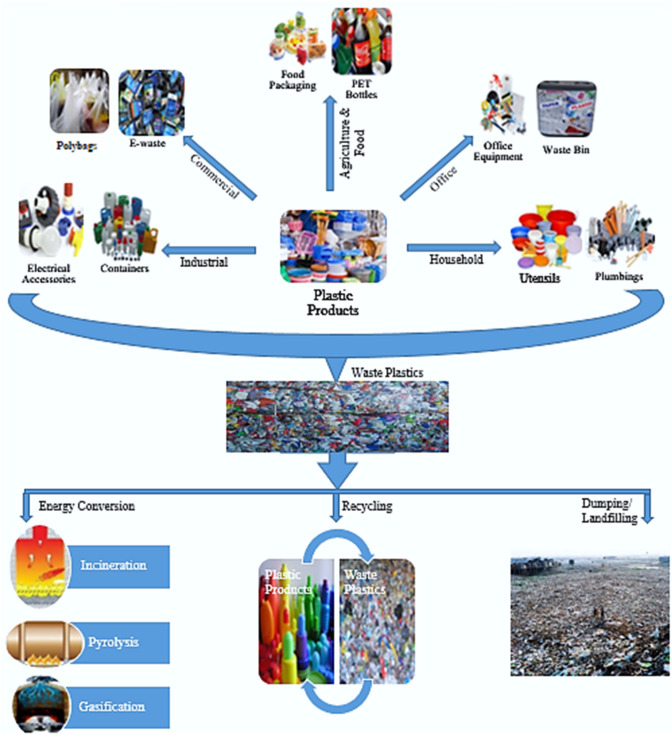
From 1950 to 2015, it is estimated that almost 6.30 BT of plastic waste was generated. However, only 9% was recycled, while more than 80% accumulated in landfills or in the marine environment (Liang et al. 2021). The amount of plastic materials consumed increased from about 2 MT to 320 MT between 2011 and 2015 (Aryan et al. 2019). Moreover, for the last 20 years, global plastic production has doubled to 335 MT (Hermabessiere et al. 2017), and it is predicted to increase by 600 MT by 2030 (UNEP-WCMC 2018). Plastic visibility is increasing due to plastic accumulation and its harmful influence on the environment and human health. Plastic takes centuries to degrade (Kaza et al. 2018). But due to their versatile nature, plastics have become a part of lifestyle and are currently used in different applications (Dhawan et al. 2019). Associated with their disposal and production, plastic use has brought adverse environmental impacts (Kaza and Bhada-Tata 2018). Figure 8 shows the life cycle of plastic from manufacturer hand to consumers and then to dumping or recycling steps. It can be seen that plastic and plastic portions are now the major portions in MSW and persist as a hazardous material. However, the percentage of plastic or single used plastic in MSW also indicates poor waste management and a lack of the application of rules and legislation.
Fig. 8.
Life cycle of a plastic product (Mourshed et al. 2017) (with permission to reuse)
The manufacture of plastic is also linked to fossil feedstock and petrochemistry. About 99% of the total feedstock for plastic manufacturing is fossil fuel-based, which accounts for almost 8–9% of global gas and oil consumption (Nielsen et al. 2020). As depicted in the life cycle for plastic products in Fig. 8, used plastic has been managed in two ways, either dumped or sent for recycling (waste to energy or waste to products conversation). In the case of recycling, there are several options like chemical recycling, mechanical recycling, energy recovery, etc. If the environmental, social and economic impact of producing a polymer is higher than that of mechanical recycling of the material in the end, it would be worthwhile to recycle the material instead of treating it as a waste (Simões et al. 2014). The most traditional method is mechanical recycling, where plastic debris is collected, washed, melted and transformed into raw material (waste to product). On the other hand, chemical recycling is the process in which polymeric waste is converted to produce substances that are used as raw materials for the build-up of new products or to convert them into energy (waste to energy). Energy recovery includes incineration, pyrolysis and gasification, etc. Table 7 gives an overview of the plastic recycling process used for different feedstocks and their respective outputs.
Table 7.
Technologies of different chemical recycling processes (Europe 20/1/2021)
| Recycling process | Feedstock | Output | Decontamination | Ability to treat mixed plastic | Maturity |
|---|---|---|---|---|---|
| Mechanical recycling | PE, PET, PP, PS | Plastic (made of one or more polymers) | No | Yes | Industrial scale |
| Solvent-based purification | PVC, PS, polyolefins (PE, PP) | Polymer | Yes | No | Pilot stage |
| Chemical depolymerisation | PET, PU, PA, PLA, PC, PHA, PEF | Monomers | Yes | No | Existing pilot plants for PET, PU, PA |
| Cracking (pyrolysis and gasification) | Plastic mix | Hydrocarbon mix | Yes | Yes | Pilot stage |
| Thermal depolymerisation (pyrolysis) | PMMA, PS | Monomers | Yes | No | Pilot stage |
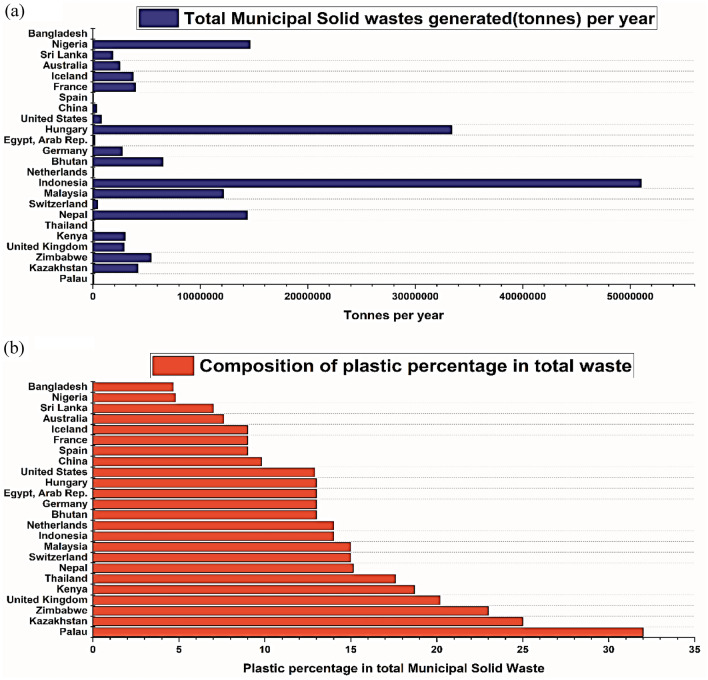
Figure 9a gives an idea of the volume of plastic waste generated per year. Among the listed countries, the highest municipal solid waste generated in Indonesia was almost 51 MT and the underdeveloped countries are at the top of this list. On the other hand, plastic composition in the MSW for the selected countries is presented in Fig. 9b, where Palau is at the top (32% plastic composition). However, plastic composition in MSW also indicates the population, living standard, and waste management strategies of a country. Therefore, largely populated countries with a comparatively low standard of living have high plastic waste content in MSW (Mourshed et al. 2017).
Fig. 9.
Global plastic waste scenario from municipal solid waste (Country basis) (Bank 2021) (with permission to reuse)
Techniques Practised for Plastic Waste Management in the Land
Plastics are non-biodegradable and cannot be easily reimbursed for carbon cycle of environment. That is the reason behind to end of their life cycle on either land or sea (Luo et al. 2000). Several methods are used for the disposal of industrial and municipal wastes like incineration, landfilling, chemical recovery, etc. (Miskolczi et al. 2006). Suitable management of plastic wastes is one of the key issues of waste management. This management process impacts environmental and economic aspects (Delattre et al. 2001). In early 2000, the major amount of plastic waste was disposed of by landfilling (65–70%) and incineration (20–25%), whereas recycling is only about 10%. However, this scenario varies from country to country, depending on the standard of living and population (Mourshed et al. 2017; Masud et al. 2019).
As shown in Fig. 10, before 1980, plastic incineration and reprocessing were tiny. Non-fibre plastics have been subjected to recycling efforts (Geyer et al. 2017a, b). The total waste produced was nearly 287 MT and increased with time. It is also predicted that in 2050 total waste will be nearly 24,712 MT (Geyer et al. 2017a, b). The recycling efforts were very less in previous years. Day by day, plastic recycling is getting many scopes after dumping.
Fig. 10.
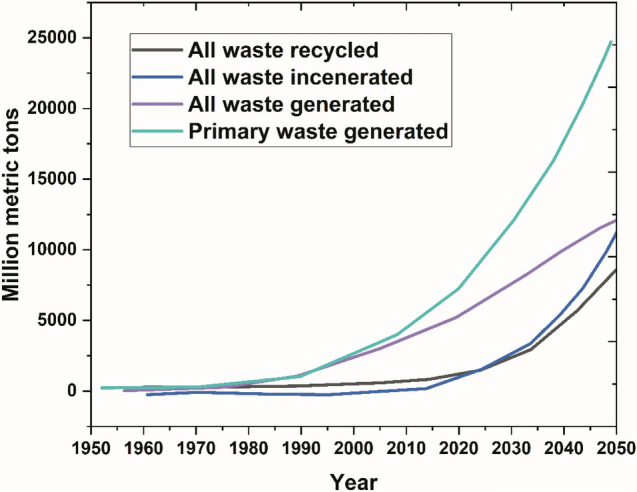
Cumulative plastic waste generation and disposal (in million metric tons). Continuous lines indicating historical statistics from 1950 to 2015; broken lines indicating forecasts of historic trends to 2050 (Geyer et al. 2017a, b) (with permission to reuse)
Landfilling
Plastics constitute a significant portion of MSW, and most of them have been imperilled to landfills without further treatment. Due to legislative pressures, lack of maintenance and infrastructure, emission of GHG and poor biodegradability of commonly used polymers, etc. causing the disposal of the waste in landfills has become a serious threat to environment (Garforth et al. 2004). In light of this hazardous waste management, environmental protection agency has improved federal and state regulations for landfilling by normalizing the use of landfilling beds, groundwater testing and post care after landfilling. As plastic waste has a high volume to weight ratio, appropriate landfilling space is a challenging issue. So, the other methods outlined in Fig. 11 can be preferred as an alternative waste management procedure to replace landfilling.
Fig. 11.
Different routes for plastic waste management
Energy Recovery by Incineration
Energy recovery from plastic wastes undergoes a process named ‘incineration’ by which energy is recaptured by non-degradable plastic wastes. This is because the octane number of some plastic materials is analogous with respect to some crude oil derivatives (Eriksson et al. 2009), and it is predicted that almost 50% of total plastic wastes will be cured by incineration by 2050 (Geyer et al. 2017a, b). It can be seen from Table 8 that calorific values of polyethene, polypropylene and polystyrene are almost close to gasoline, petroleum and kerosene. However, the main incineration products are water and carbon dioxide, which make it conceivable to be used as a substitute for conventional fossil fuels (Thanh et al. 2011). Incineration equipment includes a program control system, detection system, cyclone separator, combustion chamber, air supply bump, cooling system, etc.
Table 8.
Calorific values of popular plastic materials and conventional fuels (Al-Salem et al. 2010; Costiuc et al. 2015)
| Plastic materials/fuels | Calorific value |
|---|---|
| Polyethylene | 43.3–47.7 |
| Polystyrene | 41.6–43.7 |
| Polyethylene terephthalate | 21.6–24.2 |
| Polyurethane foam | 31.6 |
| Polypropylene | 42.6–46.5 |
| Polyvinyl chloride | 18.0–19.0 |
| Polyamide | 31.4 |
| Gasoline | 46 |
| Petroleum | 42.3 |
| Kerosene | 46.5 |
A typical fluidised bed reactor for the incineration process is illustrated in Fig. 12. The energy recovery or incineration process results in serious problems, including the production of toxic gases, GHG, and polycyclic aromatic hydrocarbons (Williamson et al. 2009; Antelava et al. 2019). However, to minimise the negative issues with incineration, advanced plastic combustion methodology for cleaner production has attracted great interest among scientists and researchers. Shimizu et al. (2006) proposed that alumina can subdue toxic substances like CO and PAHs emission in the plastic combustion process in a small-scale fluidized bed. The same experiment in a semi-scale fluidized bed combustor with nonporous and porous alumina bed materials was conducted by Qin et al. (2016). Moreover, Zia et al. (2007) included PW into MSW to enhance the calorific value of feedstock materials without uplifting the ash percentage during incineration.
Fig. 12.
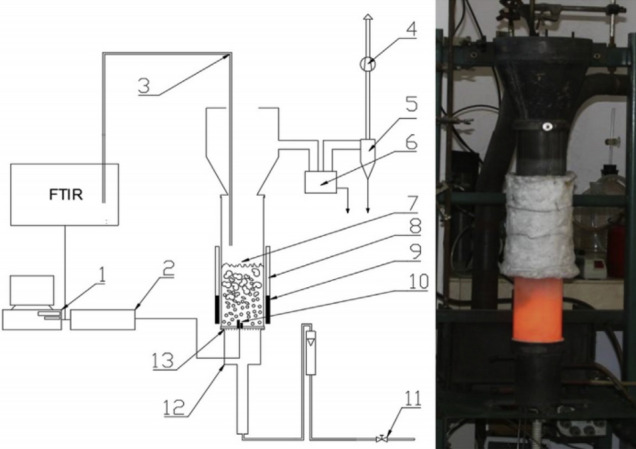
A lab-scale fluidised bed reactor for incineration of polyolefins with the equipment. 1—computer storing date of FTIR, temperature and acoustic signals, 2—A/D convertor for thermocouple signals, 3—heated probe for sampling the flue gases, 4—exhaust fan, 5—cyclone, 6—ash trap for coarser particles, 7—freeboard space, 8—radiation shield, 9—heating sleeve, 10—thermocouples, 11—air supply valve, 12—plenum chambers, 13 e Ni–Cr perforated plate (Żukowski and Berkowicz 2019) (with permission to reuse)
Though incineration of plastic wastes produces toxic and GHG gases, new technologies have been developed to assuage this discharge to keep it as minimum as possible. These technologies are in the developing stage but improving day by day. Moreover, a large amount of heat generation during this process (which is almost unused) can be utilized to attain economic value.
Mechanical Recycling
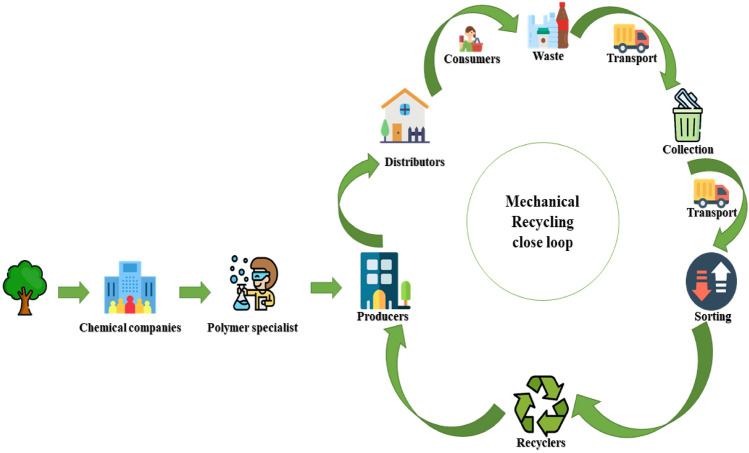
Mechanical recycling is the process of converting the used thermoplastics to form a new or similar type of product. This is a type of primary and secondary recycling process which starts with sorting out the thermoplastic to be used in the recycling process (La Mantia 2002). Homogenous waste thermoplastic is mainly converted into products with the nearly same original product. Figure 13 illustrates the mechanical recycling steps of plastic products. After assembling natural gas, crude oil, salt, etc., from nature, these products pass to petrochemical companies in which polymer specialists make plastics after various stages of operation. After then, polymer colour, thickness, and size are customised and sent to distributed to the consumers. When the first life cycle ends, these products are treated as waste. Collecting these waste products is the first step of mechanical recycling. After sorting, these products go to the recyclers who try to recycle these products and form into the same or some different products. After this, it again passes to the consumers and this loop is going on. However, the recycling operation is not cost-effective as it needs a high amount of energy to reform, technology for sorting, cleaning, transportation and processing, and the subsequent costings to carryout all these steps in an environmental friendly manner Still, at first sight, mechanical recycling of plastic wastes appears to be one of the ‘green’ operations (La Mantia 2002).
Fig. 13.
Mechanical recycling loop of plastic products
Biological Recycling
To meet the demand for organic recovery, biodegradable plastics have been studied extensively. To handle the future demand, biological infrastructure must be established with proper technical know-how. Moreover, recycling biopolymers can be made possible by aerobic composting, aerobic bacteria, fungi, etc., which consume polymers for energy and reproduction. In addition, in biological recycling, organic carbon materials are also converted into biomass which possesses energy potential and saves environment. If degradable plastics face any obstacle in this process, they are sorted to be treated as non-degradable portions.
Thermal Recycling or Incineration
Generally, composite material which contains carbon fibre and polymer matrix is exposed to high temperatures during thermal recycling (Verma et al. 2018). This high temperature usually lies between 450 and 700 °C depending on the resin property (Verma et al. 2018). It can be seen in Fig. 14 that almost 54% of plastic recycling is carried out by thermal recycling (Tominaga et al. 2015). Although the operation cost (cost of energy, labour) in thermal recycling is high but the easy refabrication process and utilisation of mixed plastics as feedstock materials makes thermal recycling much more popular than other recycling operations.
Fig. 14.
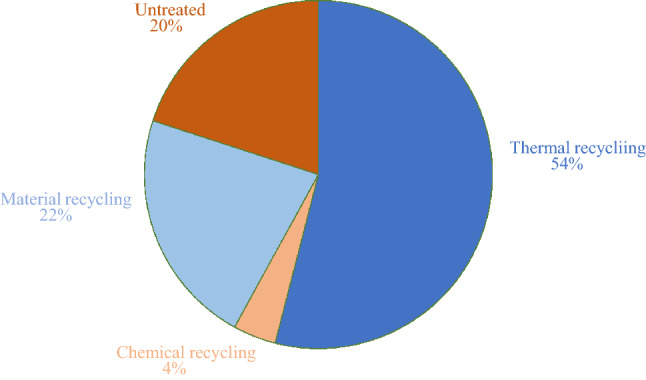
Plastic recycling uses (Simões et al. 2014)
Chemical Recycling
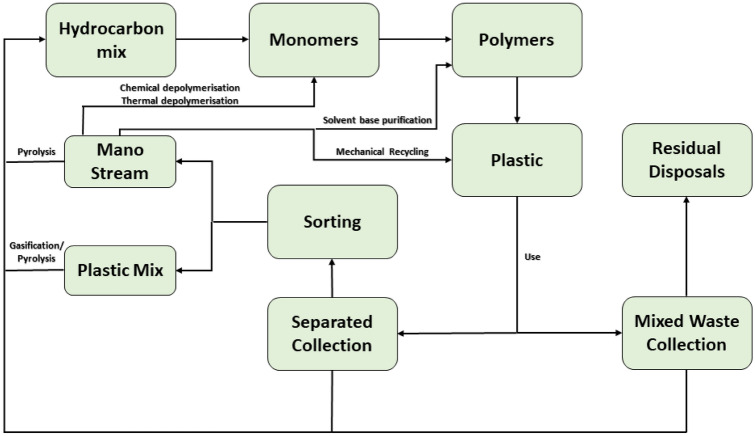
Though plastic is a generic term, the polymers used to make different types of plastics also possess different production criteria. Moreover, every polymer has different melting temperature that makes it unfeasible for different polymers to be recycled at the same melting or recycling temperature. Therefore, recycling entails sorting by polymer types as well as the products that will be formed next. The limitation of separating the additives and non-intentionally added substances in plastic makes chemical recycling a far better approach than mechanical recycling (Europe and challenges 2019). Chemical recycling follows the principle of sustainable development as it also emphasises energy recovery (Ragaert et al. 2017). The chemical recycling process can also handle mixed and contaminated polymers as they reform the degraded polymer structure according to the applications and properties entitled for final products Fig. 15 gives an overview of the chemical recycling process where this process can be divided into three main categories depending upon the following decomposition characteristics that plastics will subject to:
Solvent-based purification crumbles plastic wastes back into polymer.
Chemical depolymerisation makes plastic wastes back to their monomers via a chemical reaction.
Thermal depolymerisation (gasification and pyrolysis) is almost nearby chemical recycling. Polymers are cracked back into the monomers and transferred into hydrocarbons.
Fig. 15.
Diagram of different chemical recycling process (Europe and challenges 2019) (with permission to reuse)
Plastic Management in the Ocean Environment
Floating Marine Debris
A significant amount of plastic waste ends up their journey in marine environment and can be found to float on the sea surface under the action of wind and waves (Geyer et al. 2017a, b). The floating debris does not remain in the same place on the sea all the time; waves and turbulence of the sea can break them down and send them far away from where the particles ascended (Kukulka et al. 2012; Poulain et al. 2018). Large-scale open ocean transportation process is the most efficient way of transporting debris over a large distance, and this process has been operational since 1970 (Elipot et al. 2016). Researchers also reviewed some of the other debris transportation processes such as mesoscale, sub mesoscale, strokes drift, internal tides, transport due to direct wind force, Langmuir circulation, ice formation melting and drift (Van Sebille et al. 2020). Sea cleaning boat service in the Balearic Island showed good performance in removing coastal floating marine debris as well as spatial thermal monitoring showed a heterogenic distribution of floating plastic waste (Compa et al. 2019). Research conducted in Japan used a new method, spectral angle mapper, which works effectively in cases where the size and area of marine debris are large enough (Aoyama 2018). The removal activity can be subdivided into two main categories, such as removal activity performed by trawling or removal, which are performed through a driving survey. Trawling nets are used on deep soft seafloor, and for rocky floors, scuba or snorkel drivers are employed (de Francesco et al. 2018).
In Fig. 16, a layout of the action needed to tackle the marine litter issues is presented. The main source of marine debris is mostly generated by port facilities or by marine vessels (de Francesco et al. 2018). Many coastal cleanup programs are arranged to collect marine debris, but still, these are not enough (Iñiguez et al. 2016). The floating debris containment boom is a technology developed by Korea, which ensures that the river and water canal waste does not end up in the ocean (Cho 2005).
Fig. 16.
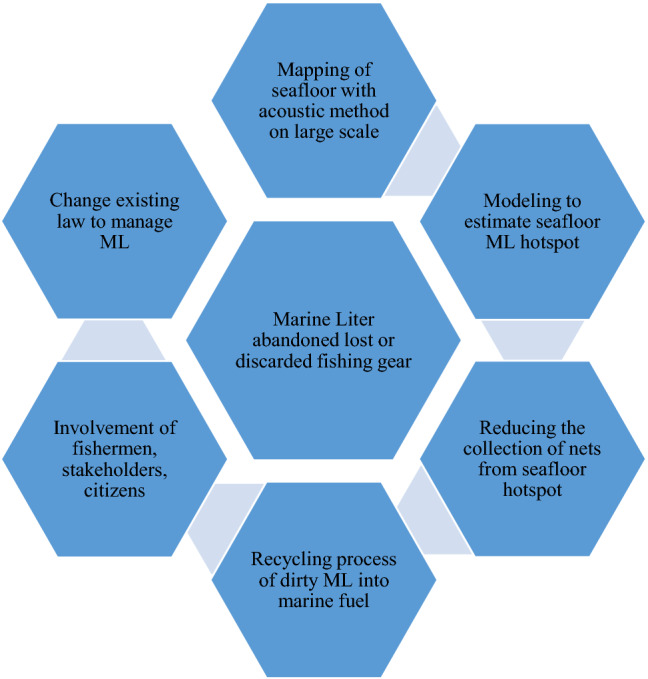
Conceptual modelling illustrates the main action needed to tackle the marine litter issue
Floating Sea Bin
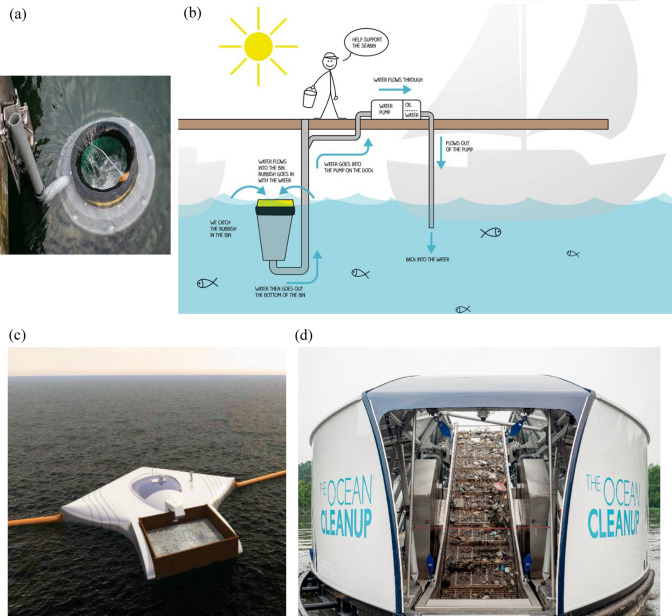
Surfers from Australia introduced a new approach to tackle the waste in the ocean, which is known as the sea bin (The Guardian 2016). Figure 17a, b shows an example of a sea bin. It is a cylindrical bin which is fitted into a floating pontoon. A filter along with a shore-based pump is fitted into it. The pump sucks water through the filter. A vortex helps the water to get into the filter; the water gets filtrated and goes back to the sea. The filter is cleaned manually every day. Floating platoons are resistant to all kinds of tides (The Seabin Project 2015). The filter allows fish eggs to pass through. Newer designs are modified, which are not stationary and run-on electricity, which the marinas provide. Some bin runs on solar power. Large-scale debris can be extracted by the filter; more sophisticated filters can also be used. Seagrass is also a threat to the sea bin, as it can clog the sea bin. The Sea bin project is an important project; newer technology is being implemented for the improvement of sea bin (The Guardian 2016). Ocean Clean Up launched a pilot project to clean the Great Pacific Garbage patch in 2018, but before being officially used in 2021, it is opined that the system may offer boom entanglement and trapping of marine species; and all of these ultimately affect marine ecosystem (Mazhandu et al. 2020a, b).
Fig. 17.
a Sea bin (Down 2018), b how sea bin works (Carpenter et al. 2017), c ocean clean up array by Boyan slat (Inhabitat 2014) and d interceptor for removing plastic pollution from river (Cleanup 2019) (with permission to reuse)
Ocean Clean Up Array
The ocean cleanup array is another simple and beautiful device, as shown in Fig. 17c. This machine uses the current of the ocean to clean debris and wastes. The chain is 2-km-long and made up of floating barriers, where there is no net. All the wastes are gathered at a place which looks like a funnel. A boat picks up the waste gathered at the centre of the machine once a month. Boyan slat, who took the initiative of this project, stated that their objective is to collect 5000 kilos of plastic in the first month of operation, and this will help to dispose of half of the pacific garbage in five years. The main advantage of this system is that it does not require any energy to function (Gate 2018).
Interceptor to Remove Plastic Pollution from the Entry Point to the Ocean (Rivers)
‘Interceptors’, which is a scalable solution, helps to protect the plastic from entering the ocean from river. A 100 per cent solar power device can be implemented in the majority of the world’s polluted rivers. River waste flowing with the current is guided by the barrier towards the opening of the interceptors carrying the plastic onto the conveyor belt, as shown in Fig. 17d. The current of the river circulates the debris onto the conveyor belt, which collects the debris and delivers the waste to the shuttle. The shuttle delivers the debris across six dumpsters; sensor data controls the conveyor when they are filled. This machine can store up to 50 m3 of trash. When the interceptors get full, it automatically sends a message to the local operators to remove the barge (Cleanup 2019).
A Circular Economy Approach to Marine Plastic Pollution
Circular economy (CE) improves the efficacy and efficiency of existing marine plastic pollution policies. It rejects the linear “extract-make-use-throw” and provides restorative and regenerative “extract-make-use-recover and restore” (Foundation 2017). CE minimizes the material and energy flows through the system by the concept of eco-effectiveness and retains previously wasted materials as a resource.
The CE model consists of two cycles, technical and biological. In this biological cycle, through composting and anaerobic digestion, life processes are recovered. The technical cycle uses the strategies like reuse, repair, remanufacture, refurbishment, and recycling. It can be noticed in Fig. 18 that industrial operationalization can be divided into three approaches; resource switch, which maximises the renewable and non-harmful inputs; resource circularity, the reuse and recovery of the end-of-life material'; and resource recovery that will ensure the efficient use of plastic.
Fig. 18.
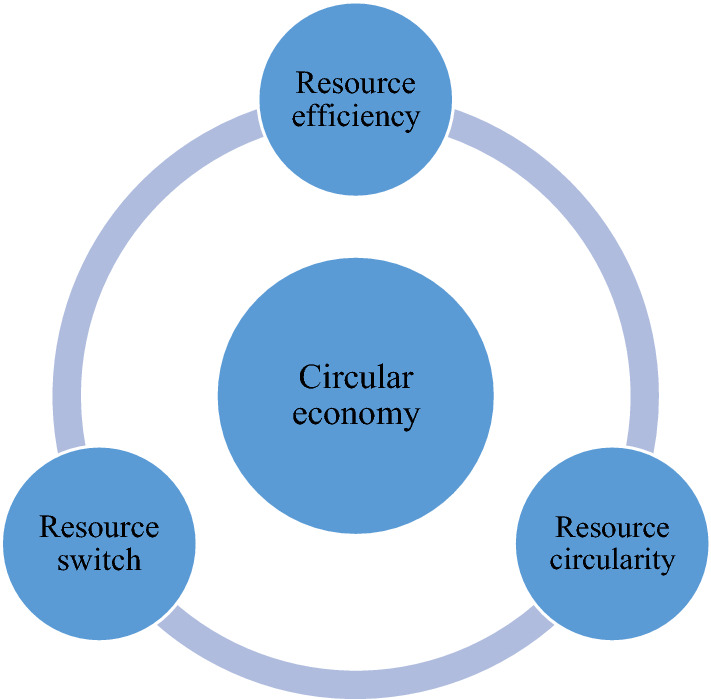
Operationalization of circular economy
Policies regarding the circular economy are noteworthy, as shown in Fig. 19, consisting of material input: Bans on non-degradable and non-recyclable plastic, laws and regulation encouraging bio-based material. Product design includes existing impact and packaging regulations. Manufacturing and service provision involves resource efficiency. Distribution and use involve a ban and a high amount of tax on degradable and non-reusable material and End of life material management policies regarding practice of circular vision through recycling targets.
Fig. 19.
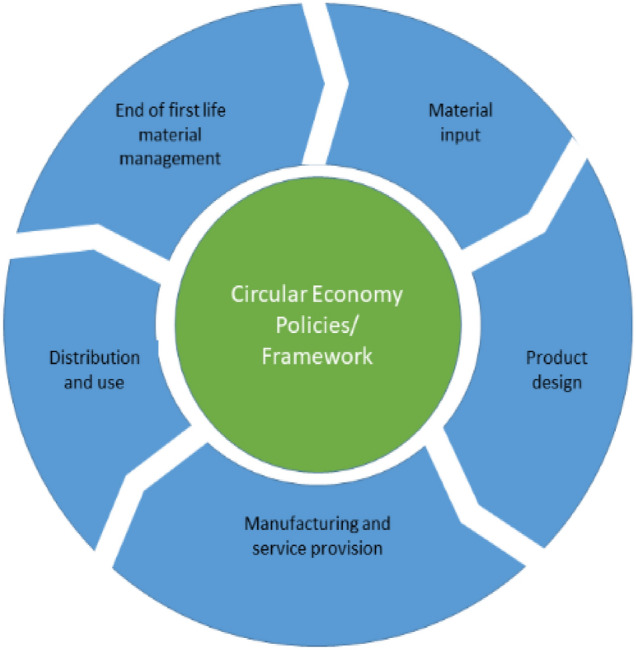
Policies for fascinating circular plastics
New Technologies Used for Plastic Waste Management
Overview
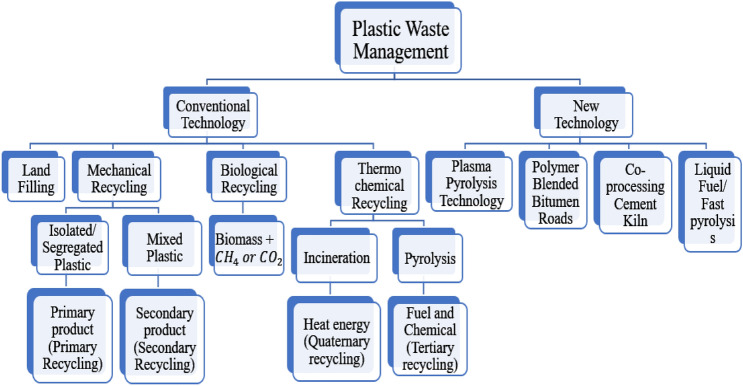
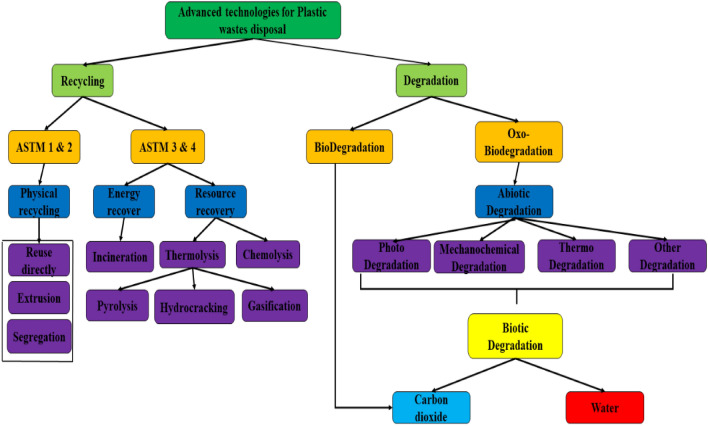
Conventional treatments for non-biodegradable plastic waste, including incineration, dumping, landfill, etc., cannot lead to sustainable plastic waste management pathways. Therefore, research works are going on, and many advanced techniques have been reported to reduce these huge piles of waste. As shown in Fig. 20, plastic disposal methods can be classified into two basic strategies. One is degradation, and the other is recycling (Brems et al. 2013). Recycling of plastic disposals can be further classified into various types according to the characteristics of plastics. The American Society for Testing Materials (ASTM) standard D5033-(2000) classifies recycling into four categories including primary (ASTM 1), secondary (ASTM 2), tertiary (ASTM 3) and quaternary (ASTM 4) recycling. Primary or physical recycling includes mechanical reprocessing of scrap materials, while secondary recycling includes mechanical processing of used plastic plastics into products with fewer performance requirements. Primary and secondary recycling indicates mechanical reprocessing of used materials to turn into new products with little or no effects on physical properties. Tertiary recycling means the recovery of chemical intermediates in the form of gases, liquids and solids, and quaternary recovery indicates the recovery of energy content of plastics (Okan et al. 2019). Tertiary recycling indicates changing intermediate chemical forms, while quaternary involves energy recapture. ASTM 1 and ASTM 2 include extrusion, segregation, direct reuse and so on, while ASTM 3 and ASTM 4 include gasification, hydrocracking, pyrolysis etc.
Fig. 20.
Currently used advanced methods for plastic waste management
Resource Recovery
Tertiary and quaternary recycling includes recovery of energy (waste to energy or WtE) and resources or products (waste to products or WtP). Currently, resource recovery of plastic wastes is mainly focused on thermolysis of thermoplastics. In thermolysis, thermoplastics undergo a chain reaction to process low molecular weight compounds (Okan et al. 2019). Again, thermolysis technology can be further classified into the following three methods: pyrolysis, hydrocracking and gasification. The mechanism of all these three technologies is used to transform large molecular long-chain polymer into gas, oil and char (WtE) at high temperature. Pyrolysis is done in an inert atmosphere and sometimes with catalysts. However, gasification is carried out at sub stoichiometric air for CO, H2, CO2 fabrication, whereas hydrogenation is done in the presence of hydrogen (Zhang et al. 2020).
Pyrolysis
Pyrolysis mainly refers to the transformation of a big chain polymer to a smaller one by thermal degradation. In this process, the temperature range varies from 300 to 900 °C under an inert gas atmosphere (Chen et al. 2014). Various important products like liquid oil, gas, etc. (WtE) are produced by pyrolysis. However, pyrolysis is suitable for treating polymers like PE, PP, and PET, which are composed of hydrocarbons (Wong et al. 2015).
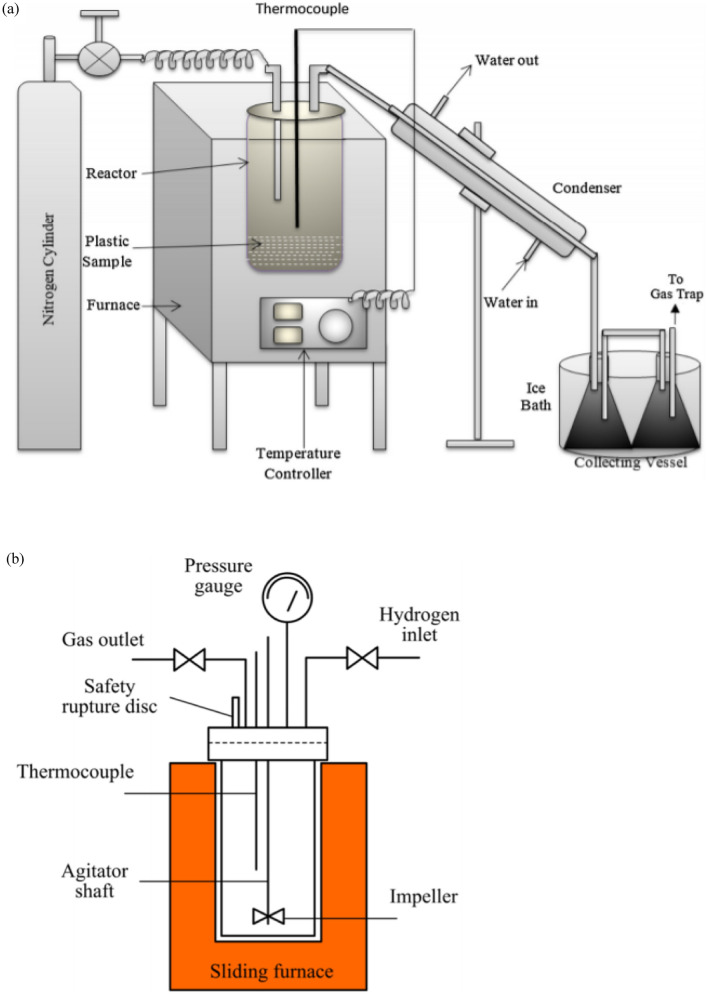
Plastic pyrolysis is a complex route which is mainly governed by multi-step reactions depending on the feedstocks used. A simple pyrolysis process is illustrated in Fig. 21a. Hirschler and Cullis (1981) offered the following four mechanisms of thermal polymer pyrolysis: (1) random chain scission, which is called fragmentation; (2) end chain scission, which is called depolymerisation; (3) cross-linking to form a chain network, and (4) elimination of side chain which is called chain- stripping. The decomposition route of plastic depends upon the chemical structure of a polymer.
Fig. 21.
a Schematic diagram of simple pyrolysis process (Gaurh and Pramanik 2018), b simple schematic diagram of hydrocracking (Munir et al. 2020) (with permission to reuse)
Hydrocracking
Hydrocracking or hydrogenation is the process in which long-chain hydrocarbons are converted into small molecules such as kerosene and gasoline. It is done by the addition of hydrogen in the presence of catalysts under high pressure (Al-Salem et al. 2017). A simple schematic diagram is given in Fig. 21b. With respect to pyrolysis, hydrocracking technology has several advantages. First, it can renovate plastic wastes into high-quality liquid fuels (Kasar et al. 2020). It shows better selectivity for C6-C12 range of gasoline than pyrolysis (Munir et al. 2018). Again hydrocracking of plastic wastes can significantly reduce the heteroatom concentration and aromatic product yield in the products by improving the quality (Fuentes-Ordóñez et al. 2013).
Second, heat and mass transfer can be increased by hydrocracking. Pyrolysis has some drawbacks due to high viscosity and large size of polymer molecules at the output (Miranda et al. 2013). But it is an important matter of concern that hydrogen used in hydrocracking is expensive compared with other fluidizing gases in the pyrolysis process like nitrogen. For example, the cost of nitrogen is less than $200 per tonne, while electrically produced hydrogen costs approximately $2800 per ton (Ragaert et al. 2017). Again, the hydrocracking process is held at high pressure, which requires high-cost equipment. Therefore, in terms of cost, hydrocracking is less popular than pyrolysis.
Gasification
Gasification is also a type of thermolysis technology which is a worthy competitor to the other two technologies, pyrolysis and hydrocracking. Feeds are converted to syngas by gasification with light hydrocarbons like carbon dioxide, water, methane under high temperatures with the presence of oxygen (Brems et al. 2013; Krapivin et al. 2017). There are various gasification processes used in the industries, such as the Battelle technique, Texaco gasification, Akzo process, etc. (Al-Salem et al. 2010). Among these, the Texaco gasification process is a commonly used technology, and a schematic diagram is shown in Fig. 22 (Ragaert et al. 2017). Texaco gasification process consists of two parts, including a liquefaction step and an entailed bed gasifier (Tukker et al. 1999). Plastics are thermo cracked into several particles in the liquefaction step with some condensable and non-condensable gas fractions or a heavy synthetic oil. These non-condensable gases are reused as fuel.
Fig. 22.
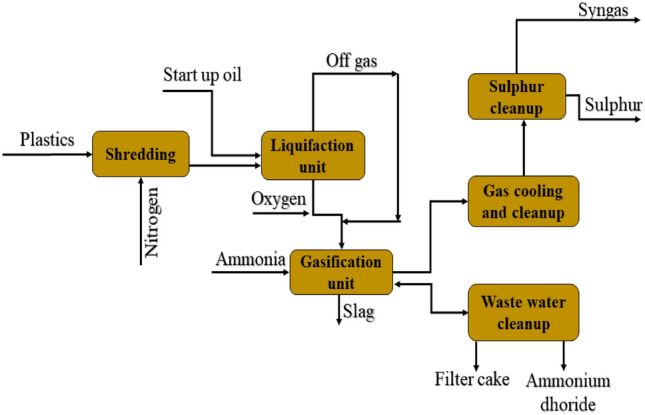
Texaco gasification process diagram (with permission to reuse)
Condensed gases and resulting oil are injected into the gasifier. Gasification is held at a temperature between 1200 and 15,000 °C with stream and oxygen. Then it passes through under a cleaning process including hydrogen fluoride and hydrogen chloride removal. After all these steps, dry and clean synthesis gas is generated, which consists of hydrogen and carbon mono oxide with smaller portions of carbon dioxide, water, methane and some inner gases (Tukker et al. 1999).
Chemolysis
Chemolysis is another resource recovery technology which is also defined as depolymerisation or solvolysis (Kumar et al. 2011; Ragaert et al. 2017). In this process, individual plastics are chemically depolymerized into monomers at approximately 80–280 °C (Payne et al. 2019). Unsaturated resins and polyesters like polyesters, polyethene terephthalate, polyamides, polycarbonate, polyurethane, etc., are mainly used as feedstock in hemolysis resource recovery technique (Panda et al. 2010; Dimitris and Achilias 2014; Oliveux et al. 2015). In the chemolysis process, the recycling phenomenon is highly dependent on the type of plastic, resulting in difficulties in the recycling process of monomers from various plastic mixtures. For this reason, the procedure of the hemolysis process is comparatively narrow and is not considered the mainstream technology for plastic waste recycling. But some countries and reputed companies use this technique for various benefits due to its chemical reaction routes. Chemical reaction routes of hemolysis include glycolysis, methanolysis, hydrolysis and alcoholysis (Kumar et al. 2011).
Alcoholysis
If the plastic polymer is depolymerized in alcohol to convert it into monomers, then it is called alcoholysis (Pardal et al. 2006). By alcoholysis, chemical degradation of polyurethane can be conducted. In this reaction, polyhydroxy alcohols and carbamate fragments are produced by transesterification reaction. But there is no carbon dioxide formed in output. By mixing different quantities of fresh polyhydroxy alcohols and isocyanates, converted monomers can be reprocessed from polyurethane (Zhang et al. 2020).
Hydrolysis
Depolymerization of plastic polymers in an aqueous solution like alkaline, acidic or neutral is called hydrolysis (Raheem et al. 2019). Raw materials can be recovered by this process by conducting a reaction of water molecules at the linkage point (Kumar et al. 2011). The monomers produced after hydrolysis can be reused with raw and fresh materials for the same foam. Reusing the facility of monomer materials improves the economic benefits, including environmental pollution.
Methanolysis
Depolymerization in the presence of methanol is called methanolysis (Kim et al. 2009). PET produces ethylene glycol monomers and dimethyl terephthalate by methanolysis. These are essential monomers to produce epoxy resins and synthetic resins type materials. The depolymerization happens at 270–300 °C temperature and an approximate pressure of 0.1–15 MPa (Genta et al. 2005).
Glycolysis
Depolymerization of polymers in the presence of glycol is called glycolysis and is a universal material recovery method (Kumar et al. 2011). It is a popular commercial PET recycling method. Well-known companies like DuPont, and Dow adopted glycolysis commercially (Ragaert et al. 2017) for the material recovery of PET. Glycolysis is called Specialized oligomeric products like α,ω-dihydroxy can also be produced by glycolysis.
Physical Recycling
Physical recycling includes ASTM 1 and 2, which are called primary and secondary recycling. Due to relatively low recycling cost and simple mechanism primary recycling draws universal attention. Manufacturing a new PET bottle from a scrap PET bottle can be a good example of primary recycling like Coca-Cola and other PET bottles. By recovering of plastic wastes via mechanical means is called secondary or mechanical recycling. The new products created carry lower performance demand than the products generated from virgin plastics (Kumar et al. 2011). Treatment of plastic wastes in secondary recycling includes a number of steps like size reduction by granulators, segregation, crumbles or shredders, cleaning, palletisation, drying and extrusion. The secondary recycling application scope is limited for some kinds of thermoplastics. The thermoplastics which do not possess high melt viscosities as well as are not temperature sensitive show physical recycling (Okan et al. 2019). Major types of polymers which are recycled via mechanical recycling are PET and PE. Other types of polymers like PP, PS, PA, etc., are less than one per cent treated by mechanical or secondary recycling (MacArthur 2017). Though physical recycling is an economically beneficial as well as environment-friendly technique, due to the above-mentioned reasons and more, this recycling process is applied narrowly.
Marine Debris Treatment
Fuel Production from Marine Debris
The debris which is extracted from the sea has a high calorific value that makes it suitable to be used as fuel. Coastal debris can be treated easily as it contains combustible materials like PE, PP, nylon and wood. Applying seawater as a solvent in a mixture of plastic materials is used in hydrothermal carbonization process. The operating temperature lies between 330 and 380 °C for the nylon fishing net, from 405 to 430 °C for PE fishing net, from 395 to 420 °C for PP rope coastal debris and from 115 to 115 °C for the wood (bamboo) coastal debris sample. Increasing the heating rate, the activation rate of global activation energy and the pre-exponential factors rose (Song et al. 2019). Hydrochar at 300 °C is found to be the most affected thermal material; however, it can be seen from the study that HTC treatment is effective above 250 °C (Iñiguez et al. 2019). However, hydrochar content has a proportional relation with temperature, whereas the number of inorganic anions reduced with temperature. The emission of gases also gets increases with temperature. The main organic compounds that are found in all cases are amides, alcohol and alkanes.
Marine Debris Recycling
The increasing number of marine plastics becomes difficult to manage; hence, subsequent recyclability of the plastic is necessary. Three following methods are generally used to conduct the recycling of marine debris: weathering method, characterization method and processing method. An artificial weathering method has been developed to investigate the recyclability of weathered and non-weathered PET. This model was designed to cope with major environmental effects (sunlight, temperature, seawater). In the characterization method, some PET flakes and HDPE caps are weathered. The surface change of the products is measured using a microscopic process. In the processing method, the following five different manufacturing methods are tested: filament and sheet extrusion, injection moulding, 3D printing and thermoforming. The test is conducted on all types of PET material, weathered, non-weathered and original PET (Ronkay et al. 2021).
Incineration of Marine Debris
Energy recovery can be made in many ways from different types of feedstocks, and incineration is one of the processes to extract energy from waste. Using this process, heat and electricity can be produced from waste (Schneider et al. 2018). Incineration helps not only to reduce waste volume but also helps to produce energy in the form of gas, fuel, heat, etc., from mixed and untreated marine waste. However, due to the high plastic content in marine debris, releasing toxic gases like dioxins, furans and polychlorinated biphenyls are common during the incineration of plastic waste (Iñiguez et al. 2016). Thermal treatment also causes the emission of hydrogen halides along with various types of other hydrogen compounds (Iñiguez et al. 2017). The presence of salt and some other minerals are a common problem in the incineration of marine debris, and all the plants cannot facilitate the cleaning system for the removal of salt; thus, the incineration process creates a lot of ashes in their output. South Korea has recently developed a new system that can process 100 kg/h of marine debris. This method uses slake limes for the removal of hydrochloric acid, activated carbon for the removal of dioxins and dust and back filter to remove heavy metal. The emission limit of the dioxins discharged in the atmosphere is also at a satisfactory level (Iñiguez et al. 2017).
Biodegradation of Marine Plastic
The biodegradation of plastic is a complex phenomenon. The initial biodegradation begins with the formation of microbial biofilm onto the plastic which is called plastisphere (Kirstein et al. 2019). This surface formation leads to the progress of bio deterioration. The exopolysaccharides secreted by microorganisms provide stronger biofilm adhesion to the plastic surface. The polymer is converted into a simpler form. Oligomers, dimers and monomers are the product of which the polymer is broken down. An enzyme destabilizes the carbon skeleton of polymers, promoting fragmentation (Degli-Innocenti 2014). Mineralization the final step of the biodegradation of plastic, where the final product is released. BioLogiQ, Inc., a bioplastic resin manufacturing company, developed a new plastic which is a natural renewably resourced plant-based resin. The plastic is certified to biodegrade in 28 days. When polybutylene adipate terephthalate is mixed with BioPolymer, the biodegradable plastic also degrades in ocean environments. Test results showed that bioplastic has a 97% biodegradation rate in ocean water within a one-year period (Kennedy 2018).
Strategies for Marine Plastic Waste Management
Current international policy for macro and microplastic contamination is a well-designed framework to minimize micro–macro plastic contamination from waterfront, beaches, oceans and marine environment (Sheavly and Register 2007). International convention for the prevention of pollution of ships (MARPOL) (Annex V pollution) gives the complete outline for international agreements and domestic legislation for marine vessels, and all the ships are encouraged to adopt these management practices and guidelines (Elgohary et al. 2015). Ship-owners are encouraged to adopt the best UNEP collaborates with international organizations like the International Oceanographic Commission Mission of the United Nations Educational, Scientific, and Cultural Organization to develop guidelines and regulations for monitoring marine litter and pollution (Walker et al. 2006). The strategy follows the main goal of reducing the amount and impact of land-based litter, sea-based debris and accumulated marine debris on the shoreline. Non-governmental organizations (NGOs) also promote waste management education and mass awareness along with the monetarization of marine debris. The recommendation for the reduction of single use in light of plastic marine pollution includes: the effectiveness of bans on single used plastic is researched and evaluated so that the policies that are implemented will have a positive impact on the marine environment or not. Outreaching education is also in place to reduce the consumption of microbeads and plastic bags at the source (Kershaw et al. 2011). Launching take-back policies and incentives on returning to collect plastic bottles, cans, etc., in the sea areas can reduce plastic pollution from tourists. Moreover, installing more trash bins in tourist areas will be a step forward for the collection and minimization of random disposal of plastics in the marine environment.
Product Bans
The government should take necessary steps to ban two types of plastic products-microbeads and single used plastic carrier bags. Microbeads which are described as primary microplastic, policies regarding them should be strengthened due to their recent and inconsistent implementation. High taxes on plastic bags help to reduce the amount of plastic entering to waste stream as well as it will discourage people (both seller and buyer) (Ogunola et al. 2018). However, imposing these rules and legislations may cause economic disruption to many small and medium plastic production companies. But in the long run, it will help to design some suitable alternatives which are ecofriendly as well as keep running the small and medium enterprises. Therefore, detailed research should be conducted on the types of plastic products that should be banned and also suitable alternatives should be launched. Moreover, these initiatives should be initiated by the government and non-government organizations to back up the financial and political issues.
Scope and Challenges to Plastic Waste Management
Overview
A theoretical model was presented by George et al. (2015), combining the ideas of circular economic activities by developing an economy model with the following two types of sources: a polluting input and a recyclable input. Also adopting continuous monitoring technologies to observe the geo-ecosystem of water reserviours by considering the surrounding hydrological and socio-economic factors can be a great help to detect and control the possible contamination of water from different sources (Varotsos et al. 2020). Several countries that tried to implement this circular economy include Netherlands (Brouwer et al. 2018), Austria (Van Eygen et al. 2018), United States (Martinho et al. 2017), Sweden (Singh and Cooper 2017) and Finland (Dahlbo et al. 2018), etc. To settle plastic pollution to a minimum level, the world-leading organisations should promote a circular economy to ensure maximum utilisation of our recyclable inputs. Beyond these, first of all, conventional mindsets should be changed in using plastic products. In this case, educational institutions, media, and respective government authorities should come forward to raise public awareness as well as to set up a goal for the sustainable waste management program. Figure 23 epitomizes the potential strategies to minimise pollution from plastic wastes as well as to set for a sustainable waste management policy. It includes with the behavioural changes, administration activeness, rules and regulations and overall awareness for plastic pollution. Thus, it is now important to rethink about the uses of plastics and find out some suitable alternatives to plastics in our daily lives.
Fig. 23.
Solutions to tackle the plastic waste problem (NRDC January 05, 2016, Revelator January 8, 2021, Earthday.org JANUARY 24, 2020, Geographic July 5, 2019)
Introducing Incentives
Financial rewards and incentives for the return of used plastic commodities not only ease the collection process but also helps the sorting process for recycling and recovery. People generally do not show the intention to recycle because of the inconvenience of time and money. But if proper incentives can be placed upon take back policy of used plastics and time can be minimised by setting up frequent take back stations, then people may get much more interest in recycling. On the other hand, it is always difficult to manage people to dump their waste plastic in some fixed spots to ensure easy collection by the respective authorities. Thus, adding collection and recycling costs to the product can be a viable option aware people of the necessity of waste management as well as the protection of the environment. To mitigate the problems identified administration has to take the necessary steps to combine the policies. Figure 24 illustrates an overview of policies distinguished in behavioural, regulation, rights-based and price based (Alpizar et al. 2020). Government should consider implementing these policies to obtain a considerable reduction in plastic waste as well as to establish a well-balanced waste management system.
Fig. 24.
Problem-based selection tool to manage plastic waste
Imposing Bans
The degradation of plastics is a complex process and takes a long to completely degraded (in some cases, more than 50 years). On the other hand, an increasing amount of plastic products utilisation causes a surge in plastic waste generation. Therefore, banning the use of plastic products (single-used plastic products, bags, etc.) will help to reduce this adverse effect. As more plastics are produced by the producers and companies, the chance of plastic pollution is increasing. In a diverse range and scope, interventions for reducing plastic bags varied. Governments all over the world have set some strategies to ban the sale of bags depending on thickness, chemical properties, etc., as shown in Fig. 25 and in Table 9.
Fig. 25.
Phase-out of lightweight plastic bags around the world (Xanthos and Walker 2017) (with permission to reuse)
Table 9.
Various steps by various countries (Laskar et al. 2019)
| Country | Policies |
|---|---|
| United States | San Francisco bans the sale of any kind of plastic water bottle |
| California is the first state to ban plastic shopping bags | |
| In 2015 a bill was passed to ban all cosmetics products that contain plastics microbeads | |
| Ireland | A bill was introduced in 2002 to charge 10 cents fee for plastic bags and 4 cents if it goes for the recycling program again |
| France | It passed a law ‘Plastic Ban’ in 2016 to ban all plastic by 2020 |
| Sweden | It is the world's largest recycling nation. Less than 1% of Sweden's household waste goes to dumping yards. It recycles all most every waste |
| China | It passed a Law in 2008, the consumer has to pay for the use of plastic bags, and within two years, usage of plastic bags dropped by 50% |
| India | Union Government of India banned the use of plastic bags below 50 µm in 2016, amended under Plastic waste Management rules 2016 |
| Bangladesh | In 2002 government of Bangladesh banned the use of thin plastic bags, and in 2020, single-use plastic was strictly banned in coastal areas, hotels, and motels by the High Court of Bangladesh |
Denmark and Germany firstly started to ban plastic bags in 1991 and 1994, and then North America, United Kingdom and Australia followed the footprint to impose a ban and partial ban (Xanthos and Walker 2017). After 2002, countries in Asia (Bangladesh), Africa and most of the European countries have introduced bans. Bangladesh in South Asia is the first country to ban thinner plastic bags (Today October 3, 2019). In 2016, Morocco introduced a nationwide ban on plastics (Today October 3, 2019), and New Zealand prime minister Jacinda Ardern banned plastic bags in 2018 (Today October 3, 2019).
Reductions in sales have been observed in areas where bans are affected, especially in the case of plastic bags, with shoppers opting to buy in other regions or limiting their purchases to whatever can be accommodated by reusable bags. In addition, some plastics may be cheaper to manufacture compared to alternatives such as jute or paper bags, and this not only increases the production costs incurred by businesses but also makes the product more expensive for consumers. We have also seen that in some countries, waste management services for conventional plastics, which is the bare minimum required, are already lacking. Therefore, any benefits attributable to biodegradable plastics will not be realized if they are introduced prematurely. Capacitating waste management systems in low-and middle-income countries will promote growth in the biodegradable plastics industry (Mazhandu et al. 2020a, b).
Psychological Interventions
The first way to reduce plastic waste is by decreasing the quantity of buying plastic stuff. All the household plastic wastes, including non-recyclable bags and all those unhealthy crisps, need to be reduced by lowering our buying behaviour. It is all about taking simple things like owning own bags and refusing plastic bags and kinds of stuff everywhere.
A six-level pyramid is shown in Figure 26 to illustrate the relative importance of reduce, reuse, repair, recycle, recover and disposal in waste management strategy. From all these aspects, the most important level is reducing our own buying intentions of fancy plastic stuff. But it is not conceivable to ban plastic entirely because still a lot of small and medium chemical industries run this business and create job opportunities for millions of people around the world. Reuse is the best option for all those pieces of stuff. A lot of plastic stuff ends up in recycling- requiring energy to turn it into a new look, or it is dumped where it will probably be sitting for hundreds of years. At this level, our throwaway culture should be challenged and replaced by the idea that anything brought can be brand new. The kinds of stuff in which the potential energy cannot be recovered should give to the administration. Motivating the mitigating actions and behavioural changes is an alternative pathway. These psychological benefits in nature can also extend economic values far beyond. Gaining a better behavioural cost and aid will lead to stimulating plastic pollution extenuation and effective policymaking.
Fig. 26.
Six level pyramids to reduce plastic wastes
Conclusions
This review work mainly focuses on the identification of plastic waste generation sources and the severity of pollution in land and marine environment. Moreover, a comprehensive analysis is presented on the relative techniques to treat waste plastic as well as the challenges to attaining a sustainable plastic waste management policy. The adverse effect of plastic waste is now a global concern as it is linked with global warming and climate change by emitting toxic gases and contaminants to the environment. The increasing volume of plastic waste not only degrades soil fertility and contaminates groundwater but also heavily damages the surrounding ecosystems and marine environment. However, the conventional techniques of plastic management mainly involve open dumping or landfilling, burning, etc., and these processes ultimately cause environmental pollution rather than achieving sustainable waste management goals. In this work, traditional plastic waste management practised in land and marine environment is extensively reviewed, and their limitations to cope up with waste to energy conversion and recycling prospects are also illustrated. This work also sheds light on the in-depth analysis of new technologies to manage plastic waste and discussed the most environmental and economically friendly ways to manage plastic waste. Finally, this review work also sorts out the potential challenges and opportunities to manage plastic waste from diverse perspectives, including infrastructure development, introducing new alternatives to plastics, emphasising 3R and 4R waste management programs, strengthening the existing laws and regulations to control plastic pollution, and above all raising social awareness among every group in the society.
Abbreviations
- MSW
Municipal solid waste
- PE
Polyethene
- PP
Polypropylene
- PVC
Polyvinylchloride
- PET
Polyethene terephthalate
- WtE
Waste to energy
- WtP
Waste to products
- GHG
Greenhouse gas
- MT
Million tonne
- PW
Plastic waste
- BT
Billion tonne
- LDPE
Low-density polyethene
- PS
Polystyrene
- APW
Agricultural plastic waste
- HDPE
High-density polyethene
- MPW
Medical plastic wastes
- MP
Microplastic
- MW
Medical waste
- NP
Nano plastic
Author contributions
Conceptualization and methodology (MGK, NIM, RS and MM); Data analysis and discussion (MGK, NIM, RS and MM); Manuscript preparation (MGK, NIM, RS and MM); Manuscript review and editing (MGK, NIM, RS, HQN and MM).
Funding
No funding was received to assist with the preparation of this manuscript.
Data availability statement
All relevant data are included in the article.
Declarations
Conflict of interest:
The authors have no competing interests to declare that are relevant to the content of this article.
Contributor Information
Md. Golam Kibria, Email: kibriaruet12@gmail.com.
Monjur Mourshed, Email: monjur.mourshed@student.rmit.edu.au.
References
- Al-Omran K, Khan E, Ali N, Bilal M. Estimation of COVID-19 generated medical waste in the Kingdom of Bahrain. Sci Total Environ. 2021;801:149642. doi: 10.1016/j.scitotenv.2021.149642. [DOI] [PMC free article] [PubMed] [Google Scholar]
- Al-Salem S, Antelava A, Constantinou A, Manos G, Dutta AJJOEM (2017) A review on thermal and catalytic pyrolysis of plastic solid waste (PSW) 197:177–198 [DOI] [PubMed]
- Al-Salem S, Lettieri P, Baeyens JJPIE, Science C (2010) The valorization of plastic solid waste (PSW) by primary to quaternary routes: from re-use to energy and chemicals. 36(1):103–129
- Alimi OS, Farner Budarz J, Hernandez LM, Tufenkji NJES and technology (2018) Microplastics and nanoplastics in aquatic environments: aggregation, deposition, and enhanced contaminant transport. 52(4):1704–1724 [DOI] [PubMed]
- Alpizar F, Carlsson F, Lanza G, Carney B, Daniels RC, Jaime M, Ho T, Nie Z, Salazar C, Tibesigwa BJES and Policy (2020) A framework for selecting and designing policies to reduce marine plastic pollution in developing countries. 109:25–35
- Ammendolia J, Saturno J, Bond AL, O’hanlon NJ, Masden EA, James NA, Jacobs S. Tracking the impacts of COVID-19 pandemic-related debris on wildlife using digital platforms. Sci Total Environ. 2022;848:157614. doi: 10.1016/j.scitotenv.2022.157614. [DOI] [PMC free article] [PubMed] [Google Scholar]
- Antelava A, Damilos S, Hafeez S, Manos G, Al-Salem SM, Sharma BK, Kohli K, Constantinou AJEM (2019) Plastic solid waste (PSW) in the context of life cycle assessment (LCA) and sustainable management. 64(2):230–244 [DOI] [PMC free article] [PubMed]
- Aoyama T (2018). Extraction of marine debris in the Sea of Japan using satellite images. Remote Sensing of the Open and Coastal Ocean and Inland Waters, International Society for Optics and Photonics
- Arnould JP, Croxall JJMPB (1995) Trends in entanglement of Antarctic fur seals (Arctocephalus gazella) in man-made debris at South Georgia. 30(11):707–712
- Aryan Y, Yadav P, Samadder SRJJOCP (2019) Life cycle assessment of the existing and proposed plastic waste management options in India: a case study. 211:1268–1283
- Awasthi AK, Shivashankar M, Majumder S (2017) Plastic solid waste utilization technologies: a review. In: IOP conference series: materials science and engineering, IOP Publishing
- Ayeleru OO, Dlova S, Akinribide OJ, Ntuli F, Kupolati WK, Marina PF, Blencowe A, Olubambi PAJWM (2020) Challenges of plastic waste generation and management in sub-Saharan Africa: a review. 110:24–42 [DOI] [PubMed]
- Bank TW (2021) What a waste global database. https://datacatalog.worldbank.org/dataset/what-waste-global-database
- Benson NU, Fred-Ahmadu OH, Bassey DE, Atayero AA. COVID-19 pandemic and emerging plastic-based personal protective equipment waste pollution and management in Africa. J Environ Chem Eng. 2021;9(3):105222. doi: 10.1016/j.jece.2021.105222. [DOI] [PMC free article] [PubMed] [Google Scholar]
- Bergami E, Pugnalini S, Vannuccini M, Manfra L, Faleri C, Savorelli F, Dawson K, Corsi IJAT (2017) Long-term toxicity of surface-charged polystyrene nanoplastics to marine planktonic species Dunaliella tertiolecta and Artemia franciscana. 189:159–169 [DOI] [PubMed]
- Boucher J, Friot D (2017) Primary microplastics in the oceans: a global evaluation of sources, Iucn Gland, Switzerland
- Brems A, Dewil R, Baeyens J, Zhang R (2013) Gasification of plastic waste as waste-to-energy or waste-to-syngas recovery route
- Brennecke D, Duarte B, Paiva F, Caçador I, Canning-Clode JJE, Coastal and S. Science (2016) Microplastics as vector for heavy metal contamination from the marine environment. 178:189–195
- Brouwer MT, van Velzen EUT, Augustinus A, Soethoudt H, De Meester S, Ragaert KJWM (2018) Predictive model for the Dutch post-consumer plastic packaging recycling system and implications for the circular economy. 71:62–85 [DOI] [PubMed]
- Browne MA, Galloway T, Thompson RJIEA, MAI Journal (2007) Microplastic—an emerging contaminant of potential concern? 3(4):559–561 [DOI] [PubMed]
- Brun NR, Beenakker MM, Hunting ER, Ebert D, Vijver MGJN (2017) Brood pouch-mediated polystyrene nanoparticle uptake during Daphnia magna embryogenesis. 11(8):1059–1069 [DOI] [PubMed]
- Carpenter E, Wolverton S. Plastic litter in streams: the behavioral archaeology of a pervasive environmental problem. Appl Geogr. 2017;84:93–101. doi: 10.1016/j.apgeog.2017.04.010. [DOI] [Google Scholar]
- Chen D, Yin L, Wang H, He PJWM (2014) Pyrolysis technologies for municipal solid waste: a review. 34(12):2466–2486 [DOI] [PubMed]
- Chiba S, Saito H, Fletcher R, Yogi T, Kayo M, Miyagi S, Ogido M, Fujikura KJMP (2018) Human footprint in the abyss: 30 year records of deep-sea plastic debris. 96:204–212
- Cho DO. Challenges to marine debris management in Korea. Coast Manag. 2005;33(4):389–409. doi: 10.1080/08920750500217559. [DOI] [Google Scholar]
- Chowdhury T, Chowdhury H, Rahman MS, Hossain N, Ahmed A, Sait SM. Estimation of the healthcare waste generation during COVID-19 pandemic in Bangladesh. Sci Total Environ. 2022;811:152295. doi: 10.1016/j.scitotenv.2021.152295. [DOI] [PMC free article] [PubMed] [Google Scholar]
- Cleanup TO (2019) The interceptors. https://theoceancleanup.com/rivers/. Retrieved 6 Apr 2021
- Cole M, Galloway TS. Ingestion of nanoplastics and microplastics by Pacific oyster larvae. Environ Sci Technol. 2015;49(24):14625–14632. doi: 10.1021/acs.est.5b04099. [DOI] [PubMed] [Google Scholar]
- Compa M, March D, Deudero S. Spatio-temporal monitoring of coastal floating marine debris in the Balearic Islands from sea-cleaning boats. Mar Pollut Bull. 2019;141:205–214. doi: 10.1016/j.marpolbul.2019.02.027. [DOI] [PubMed] [Google Scholar]
- Costiuc L, Tierean M, Baltes L, Patachia SJEE, M Journal (2015) Experimental investigation on the heat of combustion for solid plastic waste mixtures. 14(6)
- Cullis CF, Hirschler MM. The combustion of organic polymers. Oxford: Oxford University Press; 1981. [Google Scholar]
- Dahlbo H, Poliakova V, Mylläri V, Sahimaa O, Anderson RJWM (2018) Recycling potential of post-consumer plastic packaging waste in Finland. 71:52–61 [DOI] [PubMed]
- Dawson A, Huston W, Kawaguchi S, King C, Cropp R, Wild S, Eisenmann P, Townsend K, Bengtson Nash SJES and technology (2018) Uptake and depuration kinetics influence microplastic bioaccumulation and toxicity in Antarctic krill (Euphausia superba). 52(5):3195–3201 [DOI] [PubMed]
- de Francesco MC, Carranza ML, Stanisci A. Beach litter in Mediterranean coastal dunes: an insight on the Adriatic coast (central Italy) Rendiconti Lincei Scienze Fisiche e Naturali. 2018;29(4):825–830. doi: 10.1007/s12210-018-0740-5. [DOI] [Google Scholar]
- Degli-Innocenti F. Biodegradation of plastics and ecotoxicity testing: when should it be done. Front Microbiol. 2014;5:475. doi: 10.3389/fmicb.2014.00475. [DOI] [PMC free article] [PubMed] [Google Scholar]
- Dehghani S, Moore F, Akhbarizadeh RJES, P Research (2017) Microplastic pollution in deposited urban dust, Tehran metropolis, Iran. 24(25):20360–20371 [DOI] [PubMed]
- Delattre C, Forissier M, Pitault I, Schweich D, Bernard JJCES (2001) Improvement of the microactivity test for kinetic and deactivation studies involved in catalytic cracking. 56(4):1337–1345
- Derraik JGJMPB (2002) The pollution of the marine environment by plastic debris: a review. 44(9):842–852 [DOI] [PubMed]
- Dey S, Anand U, Kumar V, Kumar S, Ghorai M, Ghosh A, Kant N, Suresh S, Bhattacharya S, Bontempi E, Bhat SA, Dey A. Microbial strategies for degradation of microplastics generated from COVID-19 healthcare waste. Environ Res. 2023;216:114438. doi: 10.1016/j.envres.2022.114438. [DOI] [PMC free article] [PubMed] [Google Scholar]
- Dhawan R, Bisht BMS, Kumar R, Kumari S, Dhawan SJPS, E Protection (2019) Recycling of plastic waste into tiles with reduced flammability and improved tensile strength. 124:299–307
- Dhokhikah Y, Trihadiningrum YJJOAE, B Sciences (2012) Solid waste management in Asian developing countries: challenges and opportunities. 2(7):329–335
- Dimitris S, Achilias LJMRTP (2014) Recent advances in the chemical recycling of polymers (PP, PS, LDPE, HDPE, PVC, PC, Nylon, PMMA). 3:64
- Ding Z, Chen H, Liu J, Cai H, Evrendilek F, Buyukada MJJOHM (2021) Pyrolysis dynamics of two medical plastic wastes: Drivers, behaviors, evolved gases, reaction mechanisms, and pathways. 402:123472 [DOI] [PMC free article] [PubMed]
- Down AAN (2018) First NI Seabin installed in Bangor. https://www.ardsandnorthdown.gov.uk/news/first-ni-seabin-installed-in-bangor
- Duru RU, Ikpeama EE, Ibekwe JA. Challenges and prospects of plastic waste management in Nigeria. Waste Disposal Sustain Energy. 2019;1(2):117–126. doi: 10.1007/s42768-019-00010-2. [DOI] [Google Scholar]
- Eagle L, Hamann M, Low DR. The role of social marketing, marine turtles and sustainable tourism in reducing plastic pollution. Mar Pollut Bull. 2016;107(1):324–332. doi: 10.1016/j.marpolbul.2016.03.040. [DOI] [PubMed] [Google Scholar]
- Earthday.org (JANUARY 24, 2020) A third of the US has laws preventing plastic bans. https://www.earthday.org/a-third-of-the-us-has-laws-preventing-plastic-bans/
- Elgohary MM, Seddiek IS, Salem AM. Overview of alternative fuels with emphasis on the potential of liquefied natural gas as future marine fuel. Proc Inst Mech Eng Part M. 2015;229(4):365–375. [Google Scholar]
- Elipot S, Lumpkin R, Perez RC, Lilly JM, Early JJ, Sykulski AM. A global surface drifter data set at hourly resolution. J Geophys Res Oceans. 2016;121(5):2937–2966. doi: 10.1002/2016JC011716. [DOI] [Google Scholar]
- EPA U (2015) Advancing sustainable materials management: 2014 fact sheet
- Eriksen M, Lebreton LC, Carson HS, Thiel M, Moore CJ, Borerro JC, Galgani F, Ryan PG, Reisser JJPO (2014) Plastic pollution in the world's oceans: more than 5 trillion plastic pieces weighing over 250,000 tons afloat at sea. 9(12):e111913 [DOI] [PMC free article] [PubMed]
- Eriksson O, Finnveden GJE, E Science (2009) Plastic waste as a fuel-CO2-neutral or not? 2(9):907–914
- Europe ZW (2021) Chemical recycling. https://zerowasteeurope.eu/?s=chemical+recycling
- Europe ZWJSOP, P Challenges (2019) El Dorado of chemical recycling
- Foundation EM (2017) The new plastics economy: rethinking the future of plastics & catalysing action. https://www.ellenmacarthurfoundation.org/publications/the-new-plastics-economy-rethinking-the-future-of-plastics-catalysing-action. Retrieved 8 Apr 2021
- Fuentes-Ordóñez EG, Salbidegoitia JA, González-Marcos MAP, González-Velasco JRJI, E C Research (2013) Transport phenomena in catalytic hydrocracking of polystyrene in solution. 52(42):14798–14807
- Garforth AA, Ali S, Hernández-Martínez J, Akah AJCOISS, M Science (2004) Feedstock recycling of polymer wastes. 8(6):419–425
- Gate L (2018) Ocean array cleanup, the first revolutionary system that removes ocean plastic is ready to set sail. https://www.lifegate.com/ocean-array-cleanup-boyan-slat-ready#:~:text=Oceans,Ocean%20Array%20Cleanup%2C%20the%20first%20revolutionary%20system%20that%20removes%20ocean,is%20ready%20to%20set%20sail&text=The%20Ocean%20Array%20Cleanup%20invented,waste%20accumulated%20by%20oceanic%20currents. Retrieved 6 Apr 2021
- Gaurh P, Pramanik HJWM (2018) A novel approach of solid waste management via aromatization using multiphase catalytic pyrolysis of waste polyethylene. 71:86–96 [DOI] [PubMed]
- Gaylor MO, Harvey E, Hale RCJES and Technology (2013) Polybrominated diphenyl ether (PBDE) accumulation by earthworms (Eisenia fetida) exposed to biosolids-, polyurethane foam microparticle-, and penta-BDE-amended soils. 47(23):13831–13839 [DOI] [PubMed]
- Genta M, Iwaya T, Sasaki M, Goto M, Hirose TJI and E C Research (2005) Depolymerization mechanism of poly (ethylene terephthalate) in supercritical methanol. 44(11):3894–3900
- Geographic N (2019) A whopping 91 percent of plastic isn’t recycled. https://www.nationalgeographic.org/article/whopping-91-percent-plastic-isnt-recycled/
- George DA, Lin BCA, Chen YJEM and Software (2015) A circular economy model of economic growth. 73:60–63
- Geyer R. Production, use, and fate of synthetic polymers, plastic waste and recycling. Amsterdam: Elsevier; 2020. pp. 13–32. [Google Scholar]
- Geyer R, Jambeck JR, Law KL. Production, use, and fate of all plastics ever made. Sci Adv. 2017;3(7):e1700782. doi: 10.1126/sciadv.1700782. [DOI] [PMC free article] [PubMed] [Google Scholar]
- Geyer R, Jambeck JR, Law KLJSA (2017b) Production, use, and fate of all plastics ever made. 3(7):e1700782 [DOI] [PMC free article] [PubMed]
- Goldstein M, Goodwin D (2013) Gooseneck barnacles (Lepas spp.) ingest microplastic debris in the North Pacific subtropical gyre. PeerJ 1:e184 [DOI] [PMC free article] [PubMed]
- Graulich K, Köhler A, Löw C, Sutter DW, Mehlhart G, Egebæk KR, Bilsen V, Bley F, Manshoven S (2021) Impact of COVID-19 on single-use plastics and the environment in Europe. European Environment Agency: Boeretang, Belgium, vol 22
- Gray AD, Weinstein JEJET and Chemistry (2017) Size‐and shape‐dependent effects of microplastic particles on adult daggerblade grass shrimp (Palaemonetes pugio). 36(11):3074–3080 [DOI] [PubMed]
- Green DS, Colgan TJ, Thompson RC, Carolan JCJEP (2019) Exposure to microplastics reduces attachment strength and alters the haemolymph proteome of blue mussels (Mytilus edulis) 246:423–434 [DOI] [PubMed]
- Guo J-J, Huang X-P, Xiang L, Wang Y-Z, Li Y-W, Li H, Cai Q-Y, Mo C-H, Wong M-HJEI (2020) Source, migration and toxicology of microplastics in soil. 137:105263 [DOI] [PubMed]
- Gwada B, Ogendi G, Makindi S, Trott S (2019) Composition of plastic waste discarded by households and its management approaches
- Henderson JRJMPB (2001) A pre-and post-MARPOL Annex V summary of Hawaiian monk seal entanglements and marine debris accumulation in the Northwestern Hawaiian Islands, 1982–1998. 42(7):584–589 [DOI] [PubMed]
- Hermabessiere L, Dehaut A, Paul-Pont I, Lacroix C, Jezequel R, Soudant P, Duflos GJC (2017) Occurrence and effects of plastic additives on marine environments and organisms: a review. 182:781–793 [DOI] [PubMed]
- Hodson ME, Duffus-Hodson CA, Clark A, Prendergast-Miller MT, Thorpe KLJES and Technology (2017) Plastic bag derived-microplastics as a vector for metal exposure in terrestrial invertebrates. 51(8):4714–4721 [DOI] [PubMed]
- Horodytska O, Cabanes A, Fullana A (2019) Plastic waste management: current status and weaknesses
- Index OH (2013) Plastic entanglements increase 40% for marine animals. http://www.oceanhealthindex.org/news/Death_By_Plastic
- Inhabitat (2014) 19-year-old’s ocean cleanup array could clean half the Pacific garbage patch in 10 years, study shows. https://inhabitat.com/19-year-olds-ocean-cleanup-array-could-clean-half-the-pacific-garbage-patch-in-10-years-study-shows/
- Iñiguez ME, Conesa JA, Fullana A. Marine debris occurrence and treatment: a review. Renew Sustain Energy Rev. 2016;64:394–402. doi: 10.1016/j.rser.2016.06.031. [DOI] [Google Scholar]
- Iñiguez ME, Conesa JA, Fullana A. Pollutant content in marine debris and characterization by thermal decomposition. Mar Pollut Bull. 2017;117(1–2):359–365. doi: 10.1016/j.marpolbul.2017.02.022. [DOI] [PubMed] [Google Scholar]
- Iñiguez ME, Conesa JA, Fullana A. Hydrothermal carbonization (HTC) of marine plastic debris. Fuel. 2019;257:116033. doi: 10.1016/j.fuel.2019.116033. [DOI] [Google Scholar]
- Islam MR, Ruponti SA, Rakib MA, Nguyen HQ, Mourshed M. Current scenario and challenges of plastic pollution in Bangladesh: a focus on farmlands and terrestrial ecosystems. Front Environ Sci Eng. 2022;17(6):66. doi: 10.1007/s11783-023-1666-4. [DOI] [PMC free article] [PubMed] [Google Scholar]
- Jambeck JR, Geyer R, Wilcox C, Siegler TR, Perryman M, Andrady A, Narayan R, Law KL. Plastic waste inputs from land into the ocean. Science. 2015;347(6223):768–771. doi: 10.1126/science.1260352. [DOI] [PubMed] [Google Scholar]
- Jayasinghe RR, Abeyrathna WP, Lythgoe D, Hendawitharana MP, Liyanage C, Williams K, Halwatura RU. Analysis of the community behavioural patterns in management of household plastic waste due to the COVID-19 pandemic in Sri Lanka. Case Stud Chem Environ Eng. 2022;6:100246. doi: 10.1016/j.cscee.2022.100246. [DOI] [PMC free article] [PubMed] [Google Scholar]
- Jeong C-B, Kang H-M, Lee M-C, Byeon E, Park HG, Lee J-SJAT (2019) Effects of polluted seawater on oxidative stress, mortality, and reproductive parameters in the marine rotifer Brachionus koreanus and the marine copepod Tigriopus japonicus. 208:39–46 [DOI] [PubMed]
- Jeong J, Ryu Y, Park K, Go GJFEP (2017) Improvement of lipid homeostasis through modulation of low-density lipoprotein receptor family by functional ingredients
- Jiang H, Luo D, Wang L, Zhang Y, Wang H, Wang C (2022) A review of disposable facemasks during the COVID-19 pandemic: a focus on microplastics release. Chemosphere 137178 [DOI] [PMC free article] [PubMed]
- Kasar P, Sharma D, Ahmaruzzaman MJJOCP (2020) Thermal and catalytic decomposition of waste plastics and its co-processing with petroleum residue through pyrolysis process. 121639
- Kaza S, Bhada-Tata P (2018) Decision maker’s guides for solid waste management technologies
- Kaza S, Yao L, Bhada-Tata P, Van Woerden F (2018) What a waste 2.0: a global snapshot of solid waste management to 2050, The World Bank
- Kennedy HT (2018) Marine biodegradable plastics offer hope for oceans and waterways, The Digest
- Kershaw P, Katsuhiko S, Lee S, Woodring D (2011) Plastic debris in the ocean, United Nations Environment Programme
- Kim D, Kim B-K, Cho Y, Han M, Kim B-SJI, E C Research (2009) Kinetics of polycarbonate methanolysis by a consecutive reaction model 48(14):6591–6599
- Kirstein IV, Wichels A, Gullans E, Krohne G, Gerdts G. The plastisphere–uncovering tightly attached plastic “specific” microorganisms. PLoS ONE. 2019;14(4):e0215859. doi: 10.1371/journal.pone.0215859. [DOI] [PMC free article] [PubMed] [Google Scholar]
- Klemeš JJ, Van Fan Y, Tan RR, Jiang PJR, SE Reviews (2020) Minimising the present and future plastic waste, energy and environmental footprints related to COVID-19. 127:109883 [DOI] [PMC free article] [PubMed]
- Krapivin VF, Varotsos CA, Soldatov VY. Simulation results from a coupled model of carbon dioxide and methane global cycles. Ecol Model. 2017;359:69–79. doi: 10.1016/j.ecolmodel.2017.05.023. [DOI] [Google Scholar]
- Kukulka T, Proskurowski G, Morét‐Ferguson S, Meyer D, Law K (2012) The effect of wind mixing on the vertical distribution of buoyant plastic debris. Geophys Res Lett 39(7)
- Kumar S, Panda AK, Singh RKJR, Conservation and Recycling (2011) A review on tertiary recycling of high-density polyethylene to fuel. 55(11):893–910
- Kumar S, Smith SR, Fowler G, Velis C, Kumar SJ, Arya S, Rena RK, Cheeseman CJRSOS (2017) Challenges and opportunities associated with waste management in India. 4(3):160764 [DOI] [PMC free article] [PubMed]
- La Mantia F (2002) Handbook of plastics recycling. iSmithers Rapra Publishing
- Landon-Lane M. Corporate social responsibility in marine plastic debris governance. Mar Pollut Bull. 2018;127:310–319. doi: 10.1016/j.marpolbul.2017.11.054. [DOI] [PubMed] [Google Scholar]
- Lanorte A, De Santis F, Nolè G, Blanco I, Loisi RV, Schettini E, Vox GJC, E I Agriculture (2017) Agricultural plastic waste spatial estimation by Landsat 8 satellite images. 141:35–45
- Laskar N, Kumar UJET and Innovation (2019) Plastics and microplastics: a threat to environment. 14:100352
- Lawson T, Wilcox C, Johns K, Dann P, Hardesty BDJMPB (2015) Characteristics of marine debris that entangle Australian fur seals (Arctocephalus pusillus doriferus) in southern Australia. 98(1–2):354–357 [DOI] [PubMed]
- Lebreton LCM, van der Zwet J, Damsteeg J-W, Slat B, Andrady A, Reisser J. River plastic emissions to the world’s oceans. Nat Commun. 2017;8(1):15611. doi: 10.1038/ncomms15611. [DOI] [PMC free article] [PubMed] [Google Scholar]
- Li WC, Tse H, Fok LJSOTTE (2016) Plastic waste in the marine environment: A review of sources, occurrence and effects. 566:333–349 [DOI] [PubMed]
- Liang Y, Tan Q, Song Q, Li JJWM (2021) An analysis of the plastic waste trade and management in Asia. 119:242–253 [DOI] [PubMed]
- Luo G, Suto T, Yasu S, Kato KJPD, Stability (2000) Catalytic degradation of high density polyethylene and polypropylene into liquid fuel in a powder-particle fluidized bed. 70(1):97–102
- Lusher A, Hollman P, Mendoza-Hill J (2017) Microplastics in fisheries and aquaculture: status of knowledge on their occurrence and implications for aquatic organisms and food safety, FAO
- MacArthur E (2017) Beyond plastic waste, American Association for the Advancement of Science
- Macfadyen G, Huntington T, Cappell R (2009) Abandoned, lost or otherwise discarded fishing gear
- Martinho G, Balaia N, Pires AJWM (2017) The Portuguese plastic carrier bag tax: the effects on consumers’ behavior. 61:3–12 [DOI] [PubMed]
- Masud MH, Akram W, Ahmed A, Ananno AA, Mourshed M, Hasan M, Joardder MUH. Towards the effective E-waste management in Bangladesh: a review. Environ Sci Pollut Res. 2019;26(2):1250–1276. doi: 10.1007/s11356-018-3626-2. [DOI] [PubMed] [Google Scholar]
- Masud MH, Akram W, Ahmed A, Ananno AA, Mourshed M, Hasan M, Joardder MUHJES, P Research (2019) Towards the effective E-waste management in Bangladesh: a review. 26(2):1250–1276 [DOI] [PubMed]
- Masud MH, Mourshed M, Mahjabeen M, Ananno AA, Dabnichki P (2022) Global electronic waste management: current status and way forward. Paradigm Shift E-waste Manag 9–47
- Masud MHM, Monjur MS, Ahmed HN, Dabnichki P (2022) Generation of waste: problem to possible solution in developing and underdeveloped nations. In: Singh P, Verma P, Singh R, Ahamad A, Batalhão A (eds) Waste management and resource recycling in the developing world, vol 1. Elsevier, Amsterdam
- Mazhandu ZS, Muzenda E, Mamvura TA, Belaid M. Integrated and consolidated review of plastic waste management and bio-based biodegradable plastics: challenges and opportunities. Sustainability. 2020;12(20):8360. doi: 10.3390/su12208360. [DOI] [Google Scholar]
- Mazhandu ZS, Muzenda E, Mamvura TA, Belaid MJS (2020b) Integrated and consolidated review of plastic waste management and bio-based biodegradable plastics: challenges and opportunities. 12(20):8360
- Mazurais D, Ernande B, Quazuguel P, Severe A, Huelvan C, Madec L, Mouchel O, Soudant P, Robbens J, Huvet AJMER (2015) Evaluation of the impact of polyethylene microbeads ingestion in European sea bass (Dicentrarchus labrax) larvae. 112:78–85 [DOI] [PubMed]
- Miranda M, Cabrita I, Pinto F, Gulyurtlu IJE (2013) Mixtures of rubber tyre and plastic wastes pyrolysis: a kinetic study. 58:270–282
- Miskolczi N, Bartha L, Angyal A (2006) High energy containing fractions from plastic wastes by their chemical recycling. Macromolecular symposia, Wiley Online Library
- Moharir RV, Kumar SJJOCP (2019) Challenges associated with plastic waste disposal and allied microbial routes for its effective degradation: a comprehensive review. 208:65–76
- Monteiro RC, do Sul JAI, Costa MFJEP (2018) Plastic pollution in islands of the Atlantic Ocean. 238:103–110 [DOI] [PubMed]
- Mourshed M, Masud MH, Rashid F, Joardder MUH. Towards the effective plastic waste management in Bangladesh: a review. Environ Sci Pollut Res. 2017;24(35):27021–27046. doi: 10.1007/s11356-017-0429-9. [DOI] [PubMed] [Google Scholar]
- Munir D, Amer H, Aslam R, Bououdina M, Usman MRJMFR, S Energy (2020) Composite zeolite beta catalysts for catalytic hydrocracking of plastic waste to liquid fuels. 9(2):1–13
- Munir D, Irfan MF, Usman MRJR, S E Reviews (2018) Hydrocracking of virgin and waste plastics: a detailed review. 90:490–515
- Murphy J. Additives for plastics handbook. Amsterdam: Elsevier; 2001. [Google Scholar]
- Naidu S, Rao VR, Ramu KJEG and Health (2018) Microplastics in the benthic invertebrates from the coastal waters of Kochi, Southeastern Arabian Sea. 40(4):1377–1383 [DOI] [PubMed]
- Ng E-L, Lwanga EH, Eldridge SM, Johnston P, Hu H-W, Geissen V, Chen DJSOTTE (2018) An overview of microplastic and nanoplastic pollution in agroecosystems. 627:1377–1388 [DOI] [PubMed]
- Nielsen TD, Hasselbalch J, Holmberg K, JJWIRE Stripple and Environment (2020) Politics and the plastic crisis: a review throughout the plastic life cycle. 9(1):e360
- NRDC (2016) 10 ways to reduce plastic pollution. https://www.nrdc.org/stories/10-ways-reduce-plastic-pollution
- O’Brine T, Thompson RCJMPB (2010) Degradation of plastic carrier bags in the marine environment. 60(12):2279–2283 [DOI] [PubMed]
- Obbard RW, Sadri S, Wong YQ, Khitun AA, Baker I, Thompson RCJESF (2014) Global warming releases microplastic legacy frozen in Arctic Sea ice. 2(6):315–320
- Ogunola OS, Onada OA, Falaye AE. Mitigation measures to avert the impacts of plastics and microplastics in the marine environment (a review) Environ Sci Pollut Res. 2018;25(10):9293–9310. doi: 10.1007/s11356-018-1499-z. [DOI] [PubMed] [Google Scholar]
- Okan M, Aydin HM, Barsbay MJJOCT and Biotechnology (2019) Current approaches to waste polymer utilization and minimization: a review. 94(1):8–21
- Oliveux G, Dandy LO, Leeke GAJPIMS (2015) Current status of recycling of fibre reinforced polymers: Review of technologies, reuse and resulting properties. 72:61–99
- Page B, McKenzie J, McIntosh R, Baylis A, Morrissey A, Calvert N, Haase T, Berris M, Dowie D, Shaughnessy PDJMPB (2004) Entanglement of Australian sea lions and New Zealand fur seals in lost fishing gear and other marine debris before and after Government and industry attempts to reduce the problem. 49(1–2):33–42 [DOI] [PubMed]
- Paletta A, Leal Filho W, Balogun A-L, Foschi E, Bonoli A. Barriers and challenges to plastics valorisation in the context of a circular economy: case studies from Italy. J Clean Prod. 2019;241:118149. doi: 10.1016/j.jclepro.2019.118149. [DOI] [Google Scholar]
- Panda AK, Singh RK, Mishra DJR, S E Reviews (2010) Thermolysis of waste plastics to liquid fuel: a suitable method for plastic waste management and manufacture of value added products—a world prospective. 14(1):233–248
- Pardal F, Tersac GJPD and Stability (2006) Comparative reactivity of glycols in PET glycolysis. 91(11):2567–2578
- Payne J, McKeown P, Jones MDJPD and Stability (2019) A circular economy approach to plastic waste. 165:170–181
- Peng L, Fu D, Qi H, Lan CQ, Yu H, Ge C. Micro- and nano-plastics in marine environment: source, distribution and threats—a review. Sci Total Environ. 2020;698:134254. doi: 10.1016/j.scitotenv.2019.134254. [DOI] [PubMed] [Google Scholar]
- Peng L, Fu D, Qi H, Lan CQ, Yu H, Ge CJSOTTE (2020b) Micro-and nano-plastics in marine environment: source, distribution and threats—a review. 698:134254 [DOI] [PubMed]
- PlasticsEurope EJPE (2016) Plastics—the facts 2016. An analysis of European plastics production, demand and waste data
- Poulain M, Mercier MJ, Brach L, Martignac M, Routaboul C, Perez E, Desjean MC, Ter Halle A. Small microplastics as a main contributor to plastic mass balance in the North Atlantic Subtropical Gyre. Environ Sci Technol. 2018;53(3):1157–1164. doi: 10.1021/acs.est.8b05458. [DOI] [PubMed] [Google Scholar]
- Qin L, Han J, Chen W, Yao X, Tadaaki S, Kim HJATE (2016) Enhanced combustion efficiency and reduced pollutant emission in a fluidized bed combustor by using porous alumina bed materials. 94:813–818
- Ragaert K, Delva L, Van Geem KJWM (2017) Mechanical and chemical recycling of solid plastic waste. 69:24–58 [DOI] [PubMed]
- Raheem AB, Noor ZZ, Hassan A, Abd Hamid MK, Samsudin SA, Sabeen AHJJOCP (2019) Current developments in chemical recycling of post-consumer polyethylene terephthalate wastes for new materials production: a review. 225:1052–1064
- Revelator T (2021) Why plastic pollution is a producer responsibility. https://therevelator.org/plastic-producer-responsibility/
- Rivas ML, Albion I, Bernal B, Handcock RN, Heatwole SJ, Parrott ML, Piazza KA, Deschaseaux E. The plastic pandemic: COVID-19 has accelerated plastic pollution, but there is a cure. Sci Total Environ. 2022;847:157555. doi: 10.1016/j.scitotenv.2022.157555. [DOI] [PMC free article] [PubMed] [Google Scholar]
- Rodrigue B (2017) The effect of macroplastic debris on marine vertebrates
- Rodríguez B, Bécares J, Rodríguez A, Arcos JMJMPB (2013) Incidence of entanglements with marine debris by northern gannets (Morus bassanus) in the non-breeding grounds. 75(1–2):259–263 [DOI] [PubMed]
- Ronkay F, Molnar B, Gere D, Czigany T. Plastic waste from marine environment: demonstration of possible routes for recycling by different manufacturing technologies. Waste Manage. 2021;119:101–110. doi: 10.1016/j.wasman.2020.09.029. [DOI] [PubMed] [Google Scholar]
- Ryan PG, Moore CJ, Van Franeker JA, Moloney CLJPTOTRSBBS (2009) Monitoring the abundance of plastic debris in the marine environment. 364(1526):1999–2012 [DOI] [PMC free article] [PubMed]
- Schneider F, Parsons S, Clift S, Stolte A, McManus MC. Collected marine litter—a growing waste challenge. Mar Pollut Bull. 2018;128:162–174. doi: 10.1016/j.marpolbul.2018.01.011. [DOI] [PubMed] [Google Scholar]
- Sendra M, Staffieri E, Yeste MP, Moreno-Garrido I, Gatica JM, Corsi I, Blasco JJEP (2019) Are the primary characteristics of polystyrene nanoplastics responsible for toxicity and ad/absorption in the marine diatom Phaeodactylum tricornutum? 249:610–619 [DOI] [PubMed]
- Sevigné-Itoiz E, Gasol CM, Rieradevall J, Gabarrell XJWM (2015) Contribution of plastic waste recovery to greenhouse gas (GHG) savings in Spain. 46:557–567 [DOI] [PubMed]
- Sheavly S, Register K. Marine debris & plastics: environmental concerns, sources, impacts and solutions. J Polym Environ. 2007;15(4):301–305. doi: 10.1007/s10924-007-0074-3. [DOI] [Google Scholar]
- Shimizu T, Han J, Choi S, Kim L, Kim HJE and Fuels (2006) Fluidized-bed combustion characteristics of cedar pellets by using an alternative bed material. 20(6):2737–2742
- Silva ALP, Prata JC, Walker TR, Campos D, Duarte AC, Soares AM, Barcelò D, Rocha-Santos T. Rethinking and optimising plastic waste management under COVID-19 pandemic: policy solutions based on redesign and reduction of single-use plastics and personal protective equipment. Sci Total Environ. 2020;742:140565. doi: 10.1016/j.scitotenv.2020.140565. [DOI] [PMC free article] [PubMed] [Google Scholar]
- Simões CL, Pinto LMC, Bernardo CJWM and Research (2014) Environmental and economic analysis of end of life management options for an HDPE product using a life cycle thinking approach. 32(5):414–422 [DOI] [PubMed]
- Singh J, Cooper TJPC (2017) Towards a sustainable business model for plastic shopping bag management in Sweden. 61:679–684
- Song E, Kim D, Jeong C-J, Kim D-Y. A kinetic study on combustible coastal debris pyrolysis via thermogravimetric analysis. Energies. 2019;12(5):836. doi: 10.3390/en12050836. [DOI] [Google Scholar]
- Statista (2015) Global species with records of marine debris ingestion. 2015
- Thanh NP, Matsui Y, Fujiwara TJEM and Assessment (2011) Assessment of plastic waste generation and its potential recycling of household solid waste in Can Tho City, Vietnam. 175(1):23–35 [DOI] [PubMed]
- The Guardian (2016) Brain wave: the surfers who made a trashcan for the ocean. https://www.theguardian.com/sustainable-business/2016/mar/30/seabin-ocean-pollution-epa-marina-miami-garbage. Retrieved 6 Apr 2021
- The Seabin Project (2015) Cleaning up the World’s oceans, Scuba Diver Life. https://scubadiverlife.com/seabin-project-cleaning-worlds-oceans/. Retrieved 6 Apr 2021
- Thiel VJH, Oils O, Lipids: Diversity, Chemistry and Fate (2020) Methane carbon cycling in the past: insights from hydrocarbon and lipid biomarkers. 781–810
- Thompson RC, Moore CJ, Vom Saal FS, Swan SHJPTOTRSBBS (2009) Plastics, the environment and human health: current consensus and future trends. 364(1526):2153–2166 [DOI] [PMC free article] [PubMed]
- Today B (2019) Where is single-use plastic banned in the world? https://www.businesstoday.in/current/economy-politics/not-just-india-countries-already-banned-singleuse-plastic/story/382661.html
- Tominaga A, Sekiguchi H, Nakano R, Yao S, Takatori E (2015) Thermal process-dependence of the mechanical properties and inner structures of pre-consumer recycled polypropylene. In: AIP conference Proceedings, AIP Publishing LLC
- Townsend AK, Barker CMJPO (2014) Plastic and the nest entanglement of urban and agricultural crows. 9(1):e88006 [DOI] [PMC free article] [PubMed]
- Trash LST (2019) Effect of microplastics on human health. https://repurpose.global/letstalktrash/microplastics-in-the-oceans-and-its-effects-on-human-health/#:~:text=These%20compounds%20are%20linked%20to,both%20long%2Dlasting%20and%20severe
- Tukker A, de Groot H, Simons L, Wiegersma S (1999) Chemical recycling of plastic waste: PVC and other resins. European Commission, DG III, Final Report, STB-99-55 Final, Delft, The Netherlands
- UNEP-WCMC IJPPR (2018) NGS (2018). 70
- Unicef (2021) Medical masks during the COVID-19 pandemic. https://www.unicef.org/supply/stories/world-mask-week-during-covid-19-pandemic
- Van Eygen E, Laner D, Fellner JJWM (2018) Circular economy of plastic packaging: Current practice and perspectives in Austria. 72:55–64 [DOI] [PubMed]
- Van Sebille E, Aliani S, Law KL, Maximenko N, Alsina JM, Bagaev A, Bergmann M, Chapron B, Chubarenko I, Cózar A. The physical oceanography of the transport of floating marine debris. Environ Res Lett. 2020;15(2):023003. doi: 10.1088/1748-9326/ab6d7d. [DOI] [Google Scholar]
- Varotsos CA, Cracknell AP. Remote sensing letters contribution to the success of the sustainable development goals-UN 2030 agenda. Taylor Francis. 2020;11:715–719. [Google Scholar]
- Varotsos CA, Krapivin VF. Pollution of Arctic waters has reached a critical point: an innovative approach to this problem. Water Air Soil Pollut. 2018;229(11):1–14. doi: 10.1007/s11270-018-4004-x. [DOI] [Google Scholar]
- Varotsos CA, Krapivin VF, Mkrtchyan FA, Gevorkyan SA, Cui T. A novel approach to monitoring the quality of lakes water by optical and modeling tools: Lake Sevan as a case study. Water Air Soil Pollut. 2020;231(8):1–15. doi: 10.1007/s11270-020-04792-8. [DOI] [Google Scholar]
- Verma S, Balasubramaniam B, Gupta RKJCOIG, S Chemistry (2018) Recycling, reclamation and re-manufacturing of carbon fibres. 13:86–90
- Walker TR, Grant J, Archambault M-C. Accumulation of marine debris on an intertidal beach in an urban park (Halifax Harbour, Nova Scotia) Water Qual Res J. 2006;41(3):256–262. doi: 10.2166/wqrj.2006.029. [DOI] [Google Scholar]
- Wang F, Shih KM, Li XYJC (2015) The partition behavior of perfluorooctanesulfonate (PFOS) and perfluorooctanesulfonamide (FOSA) on microplastics. 119:841–847 [DOI] [PubMed]
- Wang F, Wong CS, Chen D, Lu X, Wang F, Zeng EYJWR (2018) Interaction of toxic chemicals with microplastics: a critical review. 139:208–219 [DOI] [PubMed]
- Wang J, Tan Z, Peng J, Qiu Q, Li M. The behaviors of microplastics in the marine environment. Mar Environ Res. 2016;113:7–17. doi: 10.1016/j.marenvres.2015.10.014. [DOI] [PubMed] [Google Scholar]
- Williamson J, Akinola M, Nason M, Tandy S, Healey J, Jones DJWM (2009) Contaminated land clean-up using composted wastes and impacts of VOCs on land. 29(5):1772–1778 [DOI] [PubMed]
- Winton D, Marazzi L, Loiselle S. Drivers of public plastic (mis) use—new insights from changes in single-use plastic usage during the Covid-19 pandemic. Sci Total Environ. 2022;849:157672. doi: 10.1016/j.scitotenv.2022.157672. [DOI] [PMC free article] [PubMed] [Google Scholar]
- Wong S, Ngadi N, Abdullah TAT, Inuwa IMJR, S E Reviews (2015) Current state and future prospects of plastic waste as source of fuel: a review. 50:1167–1180
- Xanthos D, Walker TRJMPB (2017) International policies to reduce plastic marine pollution from single-use plastics (plastic bags and microbeads): a review. 118(1–2):17–26 [DOI] [PubMed]
- Zhang C, Wang J, Tan L, Chen XJAT (2016) Toxic effects of nano-ZnO on marine microalgae Skeletonema costatum: attention to the accumulation of intracellular Zn. 178:158–164 [DOI] [PubMed]
- Zhang F, Yuting Z, Dandan W, Mengqin Y, Zhang J, Zhang P, Tonggui D, Lei C, Chao CJJOCP (2020) Current technologies for plastic waste treatment: a review. 124523
- Zhang F, Zhao Y, Wang D, Yan M, Zhang J, Zhang P, Ding T, Chen L, Chen C. Current technologies for plastic waste treatment: a review. J Clean Prod. 2021;282:124523. doi: 10.1016/j.jclepro.2020.124523. [DOI] [Google Scholar]
- Zhao T, Tan L, Huang W, Wang JJEP (2019) The interactions between micro polyvinyl chloride (mPVC) and marine dinoflagellate Karenia mikimotoi: the inhibition of growth, chlorophyll and photosynthetic efficiency. 247:883–889 [DOI] [PubMed]
- Zhu J, Saberian M, Perera STAM, Roychand R, Li J, Wang G. Reusing COVID-19 disposable nitrile gloves to improve the mechanical properties of expansive clay subgrade: An innovative medical waste solution. J Clean Prod. 2022;375:134086. doi: 10.1016/j.jclepro.2022.134086. [DOI] [PMC free article] [PubMed] [Google Scholar]
- Zia KM, Bhatti HN, Bhatti IAJR, F Polymers (2007) Methods for polyurethane and polyurethane composites, recycling and recovery: a review. 67(8):675–692
- Żukowski W, Berkowicz GJJOCP (2019) The combustion of polyolefins in inert and catalytic fluidised beds. 236:117663
Associated Data
This section collects any data citations, data availability statements, or supplementary materials included in this article.
Data Availability Statement
All relevant data are included in the article.


