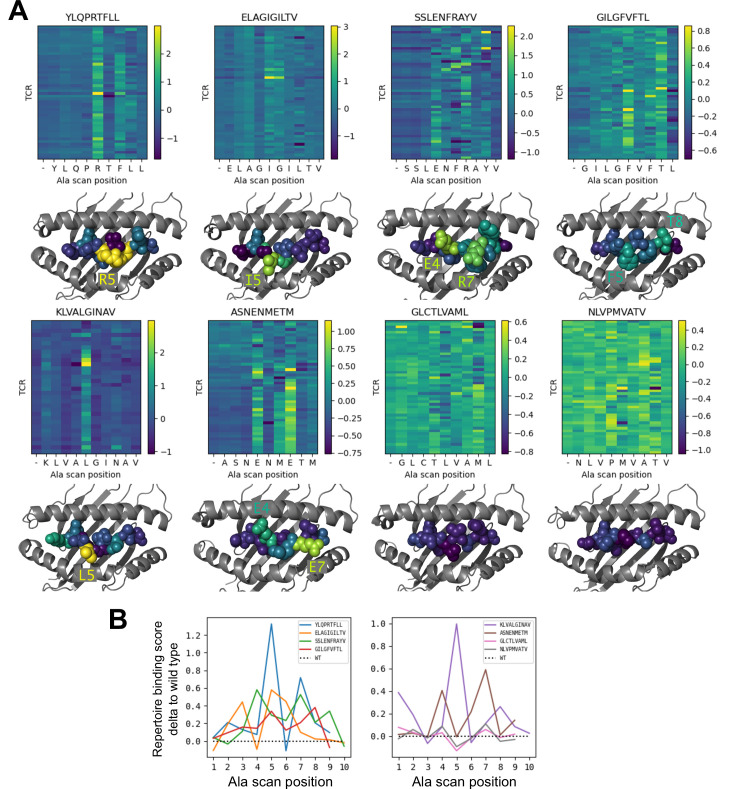
Figure 6. Alanine scanning results for the eight benchmark epitopes.
(A) Heatmaps showing the binding scores for the wild type peptide (left column) and all single-alanine mutants (columns labeled with the wild type sequence) in complex with each TCR (rows). Below each heatmap, the wild type pMHC crystal structure is shown with the peptide colored by the delta between mutant and wild-type repertoire-averaged binding scores. (B) Line plots of the delta between the mutant and wild-type repertoire-averaged binding scores reflect the predicted repertoire-level sensitivity to epitope mutations.


