

Abstract
Background:
Firefighters have occupational and environmental exposures to per- and polyfluoroalkyl substances (PFAS). The goal of this study was to compare serum PFAS concentrations across multiple United States fire departments to National Health and Nutrition Examination Survey (NHANES) participants.
Methods:
Nine serum PFAS were compared in 290 firefighters from four municipal fire departments (coded A–D) and three NHANES participants matched to each firefighter on sex, ethnicity, age, and PFAS collection year. Only Departments A and C had sufficient women study participants (25 and six, respectively) to compare with NHANES.
Results:
In male firefighters compared with NHANES, geometric mean perfluorohexane sulfonate (PFHxS) was elevated in Departments A–C, sum of branched perfluoromethylheptane sulfonate isomers (Sm-PFOS) was elevated in all four departments, linear perfluorooctane sulfonate (n-PFOS) was elevated in Departments B and C, linear perfluorooctanoate (n-PFOA) was elevated in Departments B–D, and perfluorononanoate (PFNA) was elevated in Departments B–D, but lower in A. In male firefighters compared with NHANES, perfluoroundecanoate (PFUnDA) was more frequently detected in Departments B and D, and 2-(N-methyl-perfluorooctane sulfonamido) acetate (MeFOSAA) was less frequently detected in Departments B–D. In female firefighters compared with NHANES, PFHxS and Sm-PFOS concentrations were elevated in Departments A and C. Other PFAS concentrations were elevated and/or reduced in only one department or not significantly different from NHANES in any department.
Conclusions:
Serum PFHxS, Sm-PFOS, n-PFOS, n-PFOA, and PFNA concentrations were increased in at least two of four fire departments in comparison to NHANES.
Keywords: exposure, firefighters, National Health and Nutrition Examination Survey (NHANES), occupational, per- and polyfluoroalkyl substances (PFAS)
1 |. INTRODUCTION
Per- and polyfluoroalkyl substances (PFAS) have been used in stain-resistant coatings, food packaging, detergents, and other common items, as well as some firefighting Class B aqueous film-forming foams (AFFF).1 Reported human health effects of PFAS exposure include changes in immune and thyroid function, lipid and insulin dysregulation, liver and kidney disease, deleterious reproductive and developmental outcomes, and cancer.2 In the general population, ingestion of contaminated water, dust, food, and inhalation of air are routes of exposure to PFAS. Some PFAS, particularly long-alkyl chain legacy compounds, have relatively long elimination half-lives and can bioaccumulate in the body.3 After exposure to contaminated drinking water, estimated mean elimination half-life for perfluorohexane sulfonate (PFHxS) was 5.3 years, for perfluorooctane sulfonate (PFOS) 3.4 years, and for perfluorooctanoate (PFOA) 2.7 years, with generally more rapid elimination in women.
PFAS have fluorinated carbon backbones which can be linear or in branched arrangements depending on the method of production, namely electrochemical fluorination (ECF) or telomerization; each method leads to different contents of branched and linear isomers.4 PFAS isomer concentrations can vary in a given source depending on the method of PFAS production (e.g., ECF vs. telomerization) and on the exposure source. Linear PFOS preferentially binds to soil and sediment; whereas branched PFOS isomers, which have greater polarity and decreased hydrophobicity, tend to bind more easily to water.5 Branched and linear PFAS have different toxicokinetics because isomers have different physicochemical properties and can behave differently in the environment and in the body.
In addition to environmental exposures in common with the general population, firefighters may have additional occupational exposures to PFAS including use of AFFF, turnout gear containing PFAS, and contaminated fire station dust from surface coatings.6 However, firefighter serum PFAS concentrations vary by study, suggesting that firefighter exposures may vary across this geographically and demographically diverse population.7–12 Therefore, the goal of the current study was to quantify serum PFAS concentrations across multiple United States fire departments and compare these concentrations to those of the National Health and Nutrition Examination Survey (NHANES) participants.
2 |. METHODS
2.1 |. Study participants
The 290 study participants in this cross-sectional analysis were drawn from two studies funded by the Federal Emergency Management Agency (FEMA), including a cancer prevention study involving a single fire department and additional fire departments participating in the national Fire Fighter Cancer Cohort Study (FFCCS). All participants signed written informed consent. Study enrollment and biological sample collection was performed at the participating career fire departments, sample processing was performed at the University of Arizona, and human subjects’ institutional review and approval was carried out at the University of Miami. Standardized surveys, administered online, collected information on participant demographics (e.g., age, sex, race/ethnicity), behavioral risk factors (e.g., smoking status) and firefighting history (e.g., years of firefighting, rank). Rank was self-reported as job title; choices included firefighter, firefighter/paramedic/emergency medical technician (EMT), driver operator (named as engineer in the manuscript), inspector, fire investigator, lieutenant, captain, battalion chief, deputy chief, fire chief, paramedic/EMT chief, other chief, and other.
The departments, designated A–D, are located in the Southwestern, Southeastern, and Northeastern United Sates, and were chosen based on their interest in participating in the FFCCS and not based on suspected exposure to PFAS. For the current study, the pre-enrollment information and consenting process mentioned measurement of general exposures that could potentially increase cancer risks, however, PFAS analysis was not explicitly mentioned. For Department A, recruitment took place during their annual medical examination; sera from all women enrolled at the time, and the first male firefighters enrolled up to 102 combined female and male incumbent firefighters were selected for PFAS analysis, although eventually approximately 90% of the department enrolled; for the other departments a department-wide notice was provided and interested participants came to a central location or individual fire stations; only the first 60–65 incumbents enrolled were selected for serum PFAS analysis. Blood samples from Department A were collected in 2016–2018, with the bulk collected in 2016. Serum PFAS data from both 2015–2016 and 2017–2018 NHANES participants were selected for comparison, with three NHANES participants matched to each firefighter based on sex (male or female), ethnicity (defined as Hispanic or non-Hispanic), age, and time period of PFAS serum sample collection.13,14 Race was not used in matching because race and ethnicity are combined in the NHANES data in such a way that race is unavailable for some participants.
Although the current study does not have the ability to tease apart the key structural differences related to exposure from ethnicity as a proxy variable, we included ethnicity to glean some insight into these differences. Ethnicity for the NHANES data was operationalized as Hispanic/non-Hispanic by combining certain levels of the detailed NHANES race-ethnicity categories. Hispanic ethnicity consisted of the two race-ethnicity categories “Mexican-American” and “other Hispanic”; non-Hispanic ethnicity consisted of the four race-ethnicity categories “non-Hispanic white,” “non-Hispanic black,” “non-Hispanic Asian,” and “non-Hispanic other race—including multi-racial.” The NHANES categories incorporate differences between Mexican-American and Other Hispanic ethnicities. To approximate the NHANES race-ethnicity categories, we constructed a race-ethnicity variable for the firefighter participants (Supporting Information: Table S1) with the following levels: Mexican-American or Other Hispanic, non-Hispanic White, non-Hispanic Black, non-Hispanic Asian, non-Hispanic other race—including multi-racial, with the first category being a combination of the first two NHANES categories. Geographic location is restricted in NHANES data and therefore was not available to use in matching. Data from Departments B–D were collected in 2018–2019 with the bulk of the data collected in 2019; NHANES data from 2017 to 2018, the latest year available at the time of data analysis, were selected for comparison, with three NHANES matches chosen per firefighter using the same criteria. Comparison of male participants occurred across Departments A–D and NHANES; only Departments A and C had a sufficient number of women firefighter participants to be compared to NHANES, due to the small number of women among the participants enrolled from the other departments.
2.2 |. Sample collection and analysis
Blood was collected by qualified phlebotomists in one 10.0 ml red top serum tube (Beckton, Dickinson and Company). Following collection, the tube was centrifuged at 1000–1300 × g for 15 min, and the serum stored in 1 ml aliquots. Serum was stored frozen (temporarily at −20°C followed by long-term storage at −80°C) until use. Frozen serum samples were shipped priority overnight on dry ice according to International Air Transport Association guidelines to the National Center for Environmental Health laboratory of the US Centers for Disease Control and Prevention (CDC) for analysis. The following PFAS were quantified using isotope dilution tandem mass spectrometry as previously reported15: PFHxS, linear perfluorooctane sulfonate (n-PFOS), sum of perfluoromethylheptane sulfonate (branched) isomers (Sm-PFOS), linear perfluorooctanoate (n-PFOA), branched isomers of PFOA (Sb-PFOA), perfluorononanoate (PFNA), perfluorodecanoate (PFDA), perfluoroundecanoate (PFUnDA), and 2-(N-Methyl-perfluorooctane sulfonamido) acetate (MeFOSAA). The limit of detection (LOD) for all PFAS was 0.1 ng/ml for both the firefighter and NHANES analyses. The analysis of deidentified specimens at the CDC laboratory was determined not to constitute engagement in human subjects’ research.
2.3 |. Statistical analysis
Firefighter departments were compared to NHANES for each PFAS. For noninferential comparisons, all NHANES participants from 2015 to 2018 with PFAS measurements were included, and sampling weights were used. For inferential (i.e., model-based) comparisons, sampling weights were not used; instead, 3-to-1 matching of NHANES participants who had PFAS measurements to firefighters was conducted. Matching was done sequentially and without replacement. Firefighters were randomly shuffled. In shuffled order, each firefighter was matched to the NHANES participant with the same sex, ethnicity, and serum PFAS collection time period who was closest in age to the target firefighter. After all firefighters had been assigned a single match, they were randomly shuffled again, and the process was repeated two more times with the remaining NHANES participants. This process resulted in a 3-to-1 matched NHANES data set.
For PFAS with detectable serum concentrations in at least 50% of samples for each site by sex combination, we replaced concentrations below LOD with LOD/√2, performed a log transformation, and analyzed the resulting data as continuous.16 For PFAS with detectable serum concentrations in less than 50% of the samples, we analyzed these PFAS concentrations as detectable/not detectable. We used multiple imputation by chained equations17–19 to impute missing ethnicity, age, and sex for the models of continuous data. Each analysis with imputed data utilized 50 imputed data sets. A sensitivity analysis excluded participants missing age, ethnicity, and sex; these data were thus analyzed without multiple imputation. Data from men and women were analyzed separately. A follow-up analysis of men only compared PFHxS, n-PFOS, Sm-PFOS, n-PFOA, PFNA, and PFDA concentrations among firefighter ranks.
For men, the continuous PFAS concentrations were separately fit to a linear regression model with predictors for age, site (Departments A–D and NHANES), serum collection time period (2015–2016 or 2017–2018), ethnicity (Hispanic and non-Hispanic), and all possible interactions of site, time period, and ethnicity. Due to small sample size, ethnicity was not included in the models for women firefighters. For women, only Departments A and C had a sufficient number of women firefighter study participants (25 and six, respectively) to be compared to NHANES, as there was only one woman in the participants from each of the other two departments. Given the relatively small number of women in the Department C participants, comparisons to NHANES are likely underpowered and should be viewed as exploratory.
Because serum concentrations of most legacy PFAS are declining over time in the general US population20 and because we have identified differences by ethnicity in preliminary analyses, we first examined whether departments or NHANES showed a difference in PFAS concentrations between the two time periods (men’s and women’s models) or by ethnicity (men’s models only). If either revealed a difference at α ≤ 0.05, we compared departments to NHANES for each time period and/or ethnicity with planned contrasts separately. Otherwise, we compared departments to NHANES with contrasts that averaged overtime period and/or ethnicity. Because these analyses used multiple imputation by chained equations and because the imputed variables (sex, age, and ethnicity) were used to match NHANES participants to firefighters, a separate matched NHANES data set was created for each of the 50 imputed data sets per analysis.
PFUnDA, MeFOSAA, and Sb-PFOA concentrations (detectable vs. nondetectable) were analyzed using separate Fisher’s Exact Tests21 to compare each firefighter site to NHANES, conducted for men and women separately. Additionally, because these analyses combined data from the two time periods, a sensitivity analysis was conducted on data from each time period separately to determine whether or not results were dependent on pooling. As no age and ethnicity information was used in these analyses, the only value that would need to be imputed was sex for a single person in Department D. Instead of imputing that sole missing value, that person was excluded from these analyses, no imputation was used, and a single matched NHANES data set for all dichotomous analyses was created using the approach described above.
Correlations among serum PFAS were measured separately for firefighters and NHANES participants. Pearson’s correlation coefficients of the log-transformed data were applied to PFAS concentrations analyzed as continuous. Biserial correlations were estimated for the associations between continuous and dichotomized chemicals.22,23 Odds ratios were estimated for the associations between dichotomized chemicals.
We conducted an exploratory analysis of current firefighter rank for the continuous PFAS concentrations from men. Ranks included firefighter, engineer, captain, firefighter/paramedic/EMT, inspector, and others. As not all sites had all possible ranks observed, we fit a linear model to each PFAS with predictors for rank, Department (A–D), their interaction, age, and years as a firefighter. We estimated the pairwise differences between ranks by averaging over the model-estimated differences in each site where both ranks were present. Site A had rank information provided by the fire department both in 2015 and 2017; if 2015 rank data were not available, then the 2017 rank was used in the models.
All analyses were performed using the R language for statistical computing.24 Multiple imputation by chained equations was conducted using the mice package for R.25 Processing of NHANES data for plots and summary statistic tables was done with the survey package for R.26
3 |. RESULTS
All participating fire departments were urban/suburban career departments with over 500 active-duty firefighters. Participant age was similar across departments, but sex, ethnicity, race, smoking history, and years as a firefighter varied significantly (Table 1). In general, most participants were White non-Hispanic males and nonsmokers. Eight and nine percent of men and women firefighter data respectively were missing ethnicity and/or age, all from sites C and D, and one person in site D was missing sex. As previously noted, only Departments A and C had a sufficient number of women participants for statistical analysis, 25% (N = 25) and 9% (N = 6), respectively. Because the number of women firefighters in Department C is low, these analyses are likely underpowered and should be treated as exploratory. Firefighter, captain, engineer and paramedic were the most common ranks, although the relative distribution among these varied by department. Only Department A included inspectors in addition to other fire department ranks.
TABLE 1.
Demographic characteristics, smoking and firefighting history, and job types of participants by department
| Participant characteristic | A | B | C | D | p-Value |
|---|---|---|---|---|---|
| N | 102 | 60 | 65 | 63 | |
| Age (mean [SD]) | 41.60 (8.59) | 42.73 (8.72) | 41.47 (8.94) | 43.15 (8.22) | 0.632 |
| Sex (n [%]) | <0.001 | ||||
| Male | 77 (75) | 59 (98) | 59 (91) | 61 (98) | |
| Female | 25 (25) | 1(2) | 6 (9) | 1 (2) | |
| Ethnicity (n [%]) | <0.001 | ||||
| Hispanic | 23 (23) | 10 (17) | 10 (20) | 0 (0) | |
| Non-Hispanic | 78 (77) | 50 (83) | 40 (80) | 52 (100) | |
| Race (n [%]) | |||||
| White | 88 (86) | 50 (85) | 40 (82) | 46 (88) | <0.001 |
| Black | 0(0) | 0(0) | 5(10) | 5(10) | <0.001 |
| Asian | 1 (1) | 6(10) | 3 (6) | 2 (4) | <0.001 |
| Other | 16 (16) | 5 (8) | 3 (6) | 0 (0) | <0.001 |
| Smoked at Least 100 Cigarettes (n [%]) | 13 (14) | 5(12) | 9 (39) | 10 (31) | <0.001 |
| Years as a Firefighter (mean [SD]) | 12.85 (5.54) | 18.67 (8.72) | 14.27 (8.24) | 14.62 (9.01) | <0.001 |
| Rank Department A 2015/B-D 2017 (n, %) | <0.001 | ||||
| Firefighter | 24 (24) | 8 (13) | 1 (2) | 21 (47) | |
| Captain | 23 (23) | 21 (35) | 14 (32) | 17 (38) | |
| Engineer | 16 (16) | 10 (17) | 12 (27) | 0 (0) | |
| Firefighter/Paramedic/EMT | 28 (27) | 20 (33) | 16 (36) | 6 (13) | |
| Inspector | 9 (9) | 0(0) | 0 (0) | 0 (0) | |
| Other | 2 (2) | 1(2) | 1 (2) | 1 (2) | |
| Year of PFAS sample collection (%) | <0.001 | ||||
| 2016 | 93 (91) | 0 (0) | 0 (0) | 0 (0) | |
| 2017 | 8 (8) | 0 (0) | 0 (0) | 0 (0) | |
| 2018 | 1 (1) | 0 (0) | 0 (0) | 8 (13) | |
| 2019 | 0 (0) | 60 (100) | 65 (100) | 55 (87) |
Note: Continuous variables are compared via analysis of variance. Categorical variables are compared using Fisher’s Exact Test with p-values computed by Monte Carlo simulation. Noninformative responses (“donť know,” “prefer not to respond,” “not sure”) and completely missing data are not included and are not used in the denominators for categorical data. For race, numbers presented represent people who indicated membership of the corresponding racial group. People were able to mark membership in multiple racial categories. The category “Black” corresponds to “Black or African American.” The “Other” race category includes people who marked their race as American Indian or Alaska Native, Native Hawaiian or Other Pacific Islander, and “Other.” Since people can belong to more than one racial group, analyses of distributional differences in race across departments are conducted separately per racial group (e.g., people who marked their race as White vs. people who did not mark their race as White). Smoking history refers to lifetime exposure.
For four of the nine PFAS chemicals measured (PFHxS, n-PFOS, Sm-PFOS, and n-PFOA), 99%–100% of samples were ≥LOD. For two chemicals (PFNA and PFDA), detectability ranged across departments, NHANES, and sex from 66% to 100%. Detectability for PFUnDA ranged from 37% to 78%, excluding information from the one woman in each of the sites B and D. Sb-PFOA and MeFOSAA had low detectability, with most combinations of department/NHANES by sex showing less than 50% of the samples ≥ LOD (Supporting Information: Table S2).
Department C had the highest geometric mean serum concentration of PFHxS, n-PFOS, and Sm-PFOS for men of any department (3.78, 6.62, and 2.88 ng/ml, respectively), substantially higher than the 2017–2018 NHANES comparisons (1.48, 3.67, and 1.61 ng/ml, respectively) (Table 2 and Figure 1). For women, Department C also had the highest geometric mean serum concentration of PFHxS, 2.06 ng/ml, substantially higher than the 0.81 ng/ml concentration of the NHANES comparison group, and the highest n-PFOS concentration (3.36 ng/ml compared with 2.40 ng/ml for NHANES (Table 2 and Figure 2). Median and maximum serum PFAS concentrations were also often the highest in Department C compared to the other departments, although there were higher maximum values in the NHANES comparison groups given the larger number of participants included (Supporting Information: Table S3).
TABLE 2.
Serum PFAS (ng/ml) geometric mean (GM) and geometric standard deviation (GSD) in Departments A–D and National Health and Nutrition Examination Survey (NHANES) comparison group stratified by sex
| Analyte | A | B | C | D | NHANES 2015–2016 | NHANES 2017–2018 |
|---|---|---|---|---|---|---|
| Males | ||||||
| PFHxS | 3.24 (1.77) | 1.90 (1.71) | 3.78 (1.71) | 1.77 (1.89) | 1.61 (2.17) | 1.48 (2.11) |
| n-PFOS | 4.30 (1.47) | 5.41 (1.52) | 6.62 (1.56) | 3.69 (1.68) | 4.10 (2.23) | 3.67 (2.11) |
| Sm-PFOS | 2.44 (1.59) | 2.41 (1.62) | 2.88 (1.53) | 2.06 (1.71) | 1.94 (2.23) | 1.61 (2.15) |
| n-PFOA | 1.77 (1.44) | 1.92 (1.47) | 2.04 (1.57) | 1.82 (1.57) | 1.70 (1.92) | 1.51 (1.81) |
| PFNA | 0.42 (1.45) | 0.57 (1.50) | 0.60 (1.41) | 0.64 (1.57) | 0.63 (1.93) | 0.44 (2.03) |
| PFDA | 0.25 (1.32) | 0.22 (1.70) | 0.18 (1.63) | 0.19 (1.73) | 0.15 (2.20) | 0.19 (1.82) |
| PFUnDA | 0.11 (1.70) | 0.14 (1.76) | 0.11 (1.76) | 0.14 (1.84) | 0.10 (1.87) | 0.12 (1.77) |
| Female | ||||||
| PFHxS | 1.42 (2.06) | 2.06 (1.81) | 0.88 (2.47) | 0.81 (2.28) | ||
| n-PFOS | 2.36 (1.78) | 3.36 (1.61) | 2.53 (2.44) | 2.40 (2.26) | ||
| Sm-PFOS | 1.17 (1.90) | 1.39 (1.66) | 1.05 (2.51) | 0.94 (2.37) | ||
| n-PFOA | 1.35 (1.85) | 1.78 (1.35) | 1.26 (2.30) | 1.17 (2.07) | ||
| PFNA | 0.32 (2.23) | 0.68 (1.81) | 0.53 (2.18) | 0.38 (2.49) | ||
| PFDA | 0.21 (1.77) | 0.20 (1.98) | 0.15 (2.31) | 0.20 (2.05) | ||
| PFUnDA | 0.12 (1.65) | 0.14 (1.71) | 0.10 (1.90) | 0.13 (1.93) |
Note: NHANES weights are used. NA was used for the gsd when there was only one data point for the given sex and site. Geometric means were not calculated for Sb-PFOA and MeFOSAA as the proportion of results below limit of detection was too high to provide a valid result for the majority of departments.
Abbreviations: MeFOSAA, 2–(N-Methyl-perfluorooctane sulfonamido) acetate; n-PFOA, linear perfluorooctanoate; n-PFOS, linear perfluorooctane sulfonate; PFDA, perfluorodecanoate; PFHxS, perfluorohexane sulfonate; PFNA, perfluorononanoate; PFUnDA, perfluoroundecanoate; Sm-PFOS, sum of branched perfluoromethylheptane sulfonate isomers
FIGURE 1.

Log-transformed serum per- and polyfluoroalkyl substances concentrations (ng/ml) for men, split by site. National Health and Nutrition Examination Survey (NHANES) data are weighted. The limit of detection is plotted as a red line. Numbers of participants for each site are 77 (Department A), 59 (B), 59 (C), 61 (D), 964 (NHANES 2015–2016), and 952 (NHANES 2017–2018).
FIGURE 2.
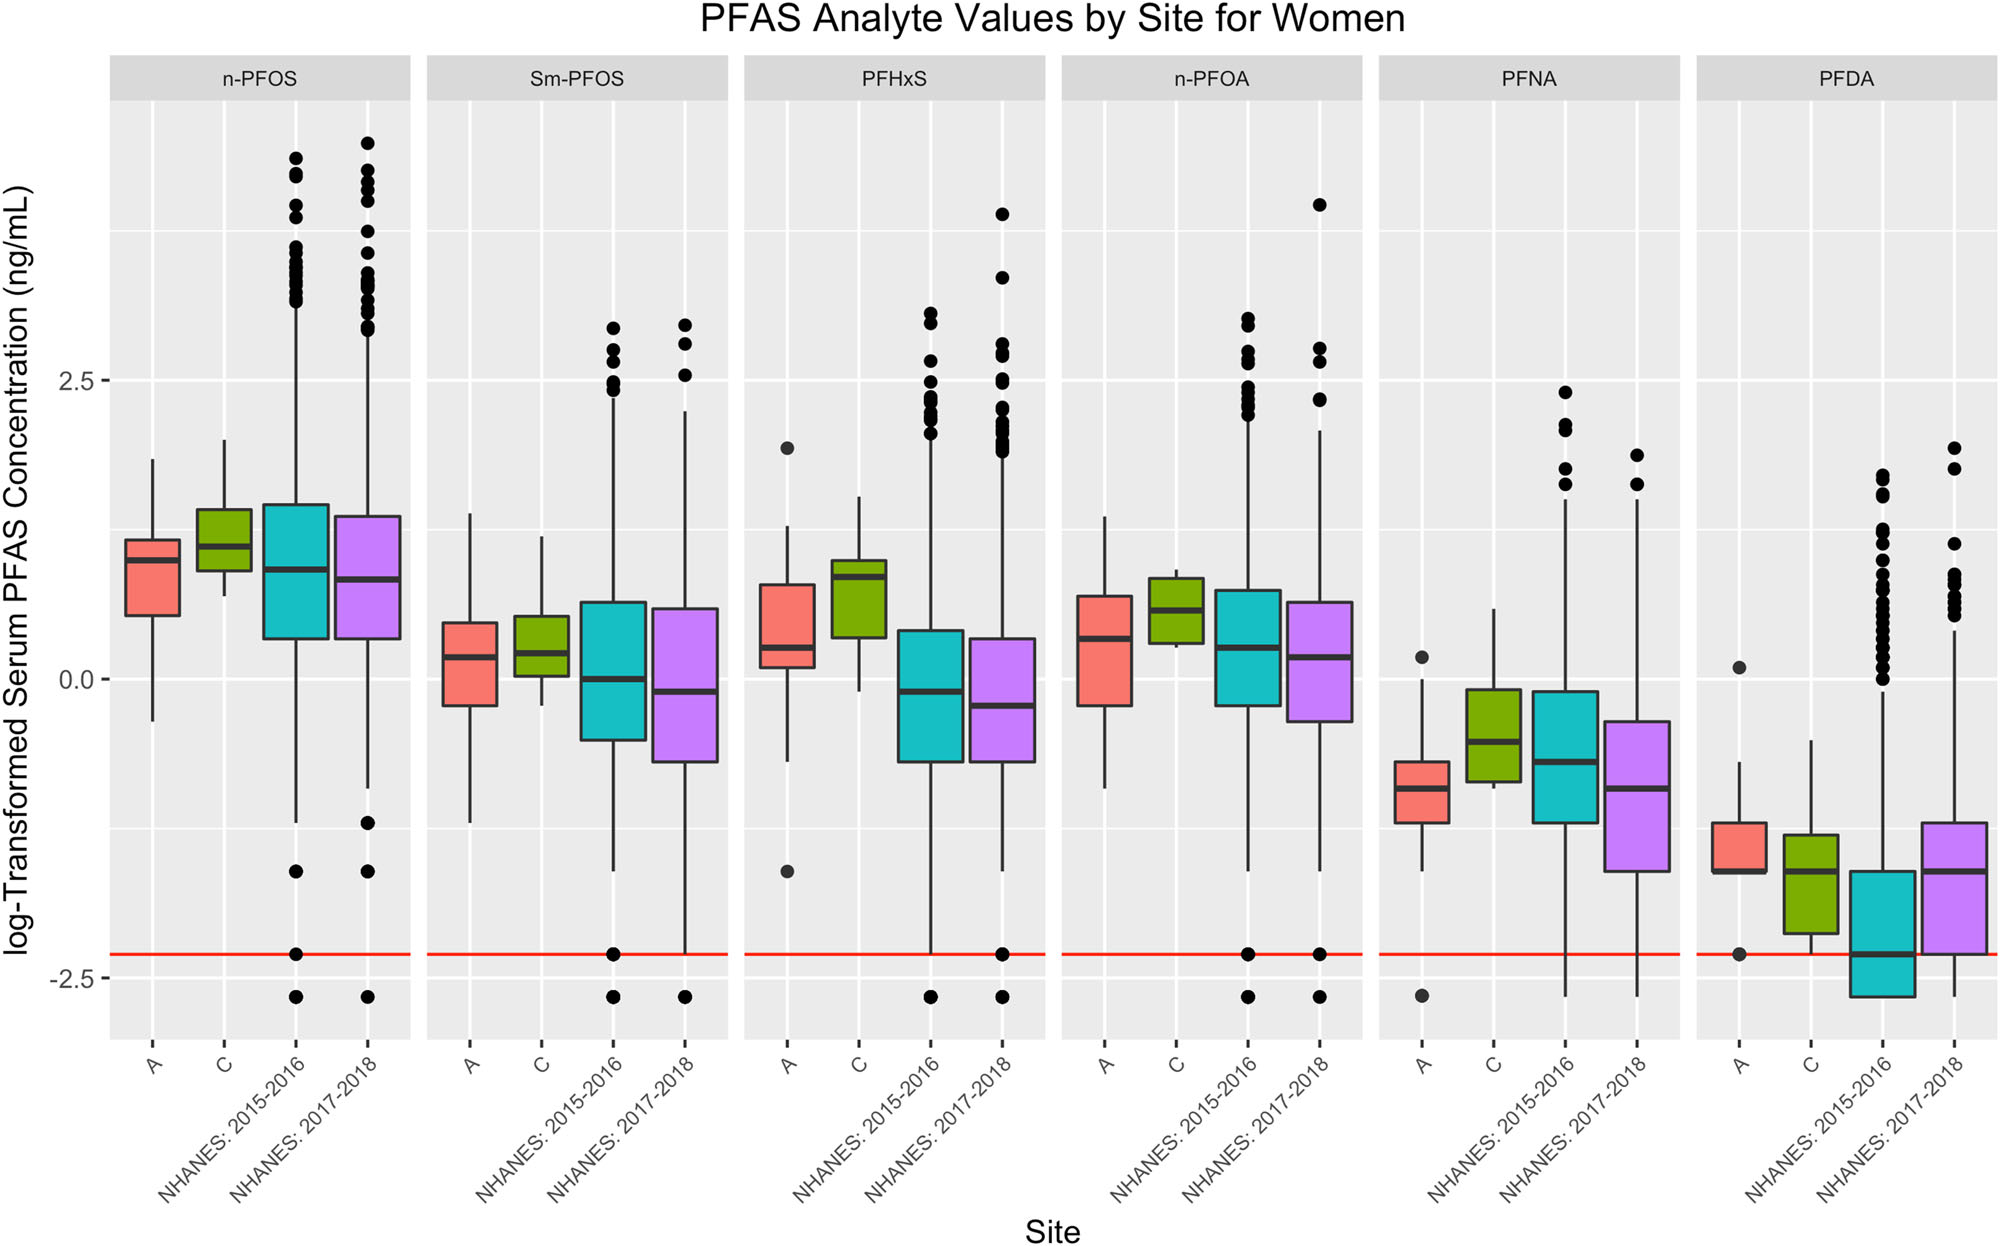
Log-transformed serum per- and polyfluoroalkyl substances concentrations (ng/ml) for women, split by site. National Health and Nutrition Examination Survey (NHANES) data are weighed. The limit of detection is plotted as a red line. Numbers of participants for each site are 25 (Department A), 6 (C), 1029 (NHANES 2015–2016), and 977 (NHANES 2017–2018).
Statistically significant differences were observed comparing departments to NHANES for PFHxS, n-PFOS, Sm-PFOS, n-PFOA, PFNA, and PFDA for men and for PFHxS and Sm-PFOS for women where comparisons were on age-adjusted geometric means possibly additionally adjusted for ethnicity (for men’s data only) and year of blood collection (Tables 3 and 4). In general, department geometric mean serum PFAS concentrations were either significantly higher or not significantly different compared to NHANES. Serum PFHxS, n-PFOS, Sm-PFOS, n-PFOA, and PFNA were higher than corresponding serum levels in NHANES in at least half the departments. Exceptions included men’s PFNA for site A. The greatest serum concentration elevations compared to NHANES were for PFHxS and Sm-PFOS. Although the number of participants was limited, women in Department C had geometric mean PFHxS and Sm-PFOS concentrations 3.34 and 2.24 times higher than matched NHANES participants, respectively, and Department A had geometric mean PFHxS concentrations over two-fold higher than NHANES. For men, geometric mean PFHxS concentrations were close to or over two times higher in Departments A and C compared to NHANES, Sm-PFOS concentrations were close to our over two times higher in Department C compared to NHANES, and n-PFOS concentrations were 2.19 times higher in Hispanic participants in Department C compared to NHANES. All other differences were less than two-fold. Differences by ethnicity were present for men in NHANES for n-PFOS, Sm-PFOS, PFHxS, and n-PFOA (all p < 0.05). Some numerically but not significantly higher differences, such as Sm-PFOS and n-PFOA from male firefighters in Department A in 2017–2018 and n-PFOS, n-PFOA, and PFNA from women firefighters in Department C, could be due to a lack of power from small numbers of participants (four and six in these cases, respectively).
TABLE 3.
Serum PFAS (ng/ml) model-estimated analyte geometric means (95% confidence intervals) for men in Departments A–D and NHANES comparison group by year and ethnicity
| Analyte | A | B | C | D | NHANES | Significant contrasts |
|---|---|---|---|---|---|---|
| N | 77 | 59 | 59 | 62 | 771 | |
| PFHxS | ||||||
| 2015–2016: NH | 3.24 (2.66, 3.94) | 1.77 (1.58, 1.98) | NH 2015–2018: A > NHANES | |||
| 2015–2016: H | 3.30 (2.43, 4.48) | 1.39 (1.16, 1.66) | H 2015–2016: A > NHANES | |||
| 2017–2018: NH | 3.17 (1.55, 6.37) | 1.93 (1.58, 2.36) | 3.95 (3.20, 4.88) | 1.77 (1.48, 2.11) | 1.49 (1.39, 1.58) | NH: B > NHANES |
| 2017–2018: H | 1.74 (1.12, 2.71) | 3.28 (2.16, 4.98) | 1.25 (1.05, 1.49) | H, NH: C > NHANES | ||
| n-PFOS | ||||||
| 2015–2016: NH | 4.49 (3.69, 5.47) | 4.81 (4.29, 5.39) | ||||
| 2015–2016: H | 4.28 (3.15, 5.81) | 3.66 (3.07, 4.37) | NH: B > NHANES | |||
| 2017–2018: NH | 3.72 (1.84, 7.53) | 5.42 (4.43, 6.63) | 6.71 (5.43, 8.28) | 3.61 (3.01, 4.32) | 3.91 (3.67, 4.18) | NH:C > NHANES |
| 2017–2018: H | 5.00 (3.20, 7.81) | 6.80 (4.47, 10.3) | 3.10 (2.59, 3.70) | H: C > NHANES | ||
| Sm-PFOS | ||||||
| 2015–2016: NH | 2.65 (2.22, 3.18) | 2.13 (1.92, 2.36) | NH 2015–16: A > NHANES | |||
| 2015–2016: H | 2.18 (1.65, 2.88) | 1.66 (1.41, 1.95) | NH: B > NHANES | |||
| 2017–2018: NH | 2.31 (1.22, 4.40) | 2.43 (2.03, 2.93) | 2.95 (2.43, 3.57) | 2.02 (1.71, 2.38) | 1.57 (1.48, 1.67) | NH, H: C > NHANES |
| 2017–2018: H | 2.16 (1.44, 3.25) | 2.93 (1.99, 4.30) | 1.44 (1.23, 1.69) | NH: D > NHANES | ||
| n-PFOA | ||||||
| 2015–2016: NH | 1.81 (1.54, 2.13) | 1.88 (1.71, 2.06) | ||||
| 2015–2016: H | 1.69 (1.32, 2.17) | 1.51 (1.30, 1.75) | NH: B > NHANES | |||
| 2017–2018: NH | 1.87 (1.05, 3.32) | 2.04 (1.73, 2.41) | 2.09 (1.75, 2.49) | 1.82 (1.57, 2.11) | 1.48 (1.41, 1.56) | NH:C > NHANES |
| 2017–2018: H | 1.40 (0.97, 2.02) | 1.89 (1.31, 2.73) | 1.32 (1.14, 1.53) | NH: D > NHANES | ||
| PFNA | ||||||
| 2015–2016: NH | 0.44 (0.37, 0.53) | 0.68 (0.61, 0.76) | 2015–2016: A < NHANES | |||
| 2015–2016: H | 0.42 (0.31, 0.55) | 0.66 (0.56, 0.78) | B > NHANES | |||
| 2017–2018: NH | 0.40 (0.21, 0.77) | 0.56 (0.47, 0.68) | 0.60 (0.50, 0.73) | 0.63 (0.53, 0.74) | 0.45 (0.42, 0.48) | C > NHANES |
| 2017–2018: H | 0.54 (0.36, 0.82) | 0.61 (0.42, 0.91) | 0.37 (0.31, 0.43) | D > NHANES | ||
| PFDA | ||||||
| 2015–2016: NH | 0.25 (0.21, 0.31) | 0.17 (0.15, 0.19) | 2015–2016: A > NHANES | |||
| 2015–2016: H | 0.24 (0.18, 0.32) | 0.15 (0.13, 0.18) | ||||
| 2017–2018: NH | 0.24 (0.12, 0.46) | 0.21 (0.17, 0.25) | 0.18 (0.15, 0.22) | 0.19 (0.16, 0.22) | 0.20 (0.19, 0.21) | |
| 2017–2018: H | 0.25 (0.17, 0.39) | 0.18 (0.12, 0.27) | 0.17 (0.15, 0.20) |
Note: Estimates at age 42 (the median age of all firefighters with observed age). Statistically significant contrasts between firefighter sites and NHANES and the directional differences are listed in the last column. Limit of detection (LOD) was 0.1 ng/ml for all PFAS. Note that there were no PFAS measurements on men firefighters in Departments B–D in the years 2015–2016. Additionally, there were no Hispanic men firefighters with PFAS measurements in Department A in 2017–2018, and there were no marked Hispanic men firefighters in Department D in our sample. All these cells have thus been left blank. Abbreviations: H, Hispanic; NHANES, National Health and Nutrition Examination Survey; NH, Non-Hispanic; n-PFOA, linear perfluorooctanoate; n-PFOS, linear perfluorooctane sulfonate; PFAS, per- and polyfluoroalkyl substances; PFDA, perfluorodecanoate; PFHxS, perfluorohexane sulfonate; PFNA, perfluorononanoate; PFUnDA, perfluoroundecanoate; Sm-PFOS, sum of branched perfluoromethylheptane sulfonate isomers.
TABLE 4.
Serum PFAS model-estimated analyte geometric means (95% confidence intervals) (ng/ml) for women in Departments A–D and NHANES comparison group by year
| Analyte | A | C | NHANES | Significant contrasts |
|---|---|---|---|---|
| N | 25 | 6 | 99 | |
| PFHxS | ||||
| 2015–2016 | 1.25 (0.86, 1.83) | 0.58 (0.47, 0.73) | A > NHANES | |
| 2017–2018 | 1.85 (0.88, 3.92) | 2.07 (1.04, 4.13) | 0.62 (0.47, 0.84) | C > NHANES |
| n-PFOS | ||||
| 2015–2016 | 2.06 (1.46, 2.90) | 1.99 (1.62, 2.44) | ||
| 2017–2018 | 2.72 (1.38, 5.38) | 3.32 (1.75, 6.30) | 1.82 (1.40, 2.36) | |
| Sm-PFOS | ||||
| 2015–2016 | 1.04 (0.75, 1.45) | 0.72 (0.59, 0.88) | A > NHANES | |
| 2017–2018 | 1.24 (0.65, 2.39) | 1.39 (0.75, 2.59) | 0.62 (0.48, 0.81) | C > NHANES |
| n-PFOA | ||||
| 2015–2016 | 1.24 (0.88, 1.75) | 1.06 (0.86, 1.30) | ||
| 2017–2018 | 1.36 (0.69, 2.71) | 1.72 (0.90, 3.27) | 0.98 (0.75, 1.28) | |
| PFNA | ||||
| 2015–2016 | 0.29 (0.20, 0.41) | 0.43 (0.35, 0.54) | ||
| 2017–2018 | 0.33 (0.16, 0.69) | 0.64 (0.32, 1.28) | 0.31 (0.23, 0.42) | |
| PFDA | ||||
| 2015–2016 | 0.19 (0.14, 0.26) | 0.14 (0.11, 0.16) | ||
| 2017–2018 | 0.26 (0.13, 0.49) | 0.20 (0.11, 0.36) | 0.19 (0.15, 0.24) | |
Note: Estimates at age 42 (the median age of all firefighters with observed age). Statistically significant contrasts between firefighter sites and NHANES and the directional differences are listed in the last column only for Departments A and C. If there were no statistically significant differences for a given PFAS chemical, those cells were left blank. limit of detection (LOD) was 0.1 ng/ml for all PFAS. Note that there were no PFAS measurements on women firefighters in Department C in the years 2015–2016. These cells have thus been left blank. Additionally, note that while data from sites B and D were included in the models, only one woman firefighter was present at each site and thus no model-estimated geometric means or statistical tests are shown here. Abbreviations: H, Hispanic; NHANES, National Health and Nutrition Examination Survey; NH, Non-Hispanic; n-PFOA, linear perfluorooctanoate; n-PFOS, linear perfluorooctane sulfonate; PFAS, per- and polyfluoroalkyl substances; PFDA, perfluorodecanoate; PFHxS, perfluorohexane sulfonate; PFNA, perfluorononanoate; PFUnDA, perfluoroundecanoate; Sm-PFOS, sum of branched perfluoromethylheptane sulfonate isomers.
Three women were removed from the data set used in the sensitivity analyses due to missing age leaving 25 in Department A, one in Department B, and four in Department C. While this loss further diminished the power to detect mean PFAS differences in Department C, we felt it prudent to explore whether or not results differed when data points were removed rather than imputed. While the estimated, adjusted, geometric means varied slightly, the inferential results were the same as for the analyses with multiple imputation: for Sm-PFOS and PFHxS, both Departments A and C were statistically significantly greater than NHANES (all p < 0.05, data not shown). No other differences were statistically significant. Twenty-two men were removed from the data set used in the sensitivity analyses due to missing age and/or ethnicity, leaving 77 in Department A, 59 in Department B, 46 in Department C, and 52 in Department D. There were slight shifts in p-values (data not shown), but overall the results were highly similar.
More than 50% of the concentrations for MeFOSAA, Sb-PFOA, and PFUnDA were <LOD for certain combinations of sex and site (Supporting Information: Table S2). For PFUnDA in men, Departments B and D had higher probabilities of being detectable than in NHANES (Supporting Information: Table S4). The probabilities of having detectable serum MeFOSAA were lower than NHANES for Departments B–D for men and Department C for women (Supporting Information: Tables S4 and S5); for Sb-PFOA, Department B had a lower probability of being detectable for men, but Department A had a higher probability of being detectable for both men and women. Sensitivity analyses that split the data by time period (data not shown) generally showed the same pattern of results for both men and women, although the differences for Department A versus NHANES for Sb-PFOA in the 2017–2018 data were more marginal (p = 0.0583 for men and 0.1153 for women, respectively). One notable difference in the sensitivity results was for PFUnDA. Both Department A men and women in 2015–2016 had a higher probability of being detectable compared to 2015–2016 NHANES (p < 0.05). In 2017–2018, both men and women in Department A had numerically lower probabilities of being detectable; these comparisons were not statistically significant, but were also likely underpowered as only four men and five women in Department A had PFAS collected in 2017–2018. Additionally, the statistically significant results for Departments B and D for men for PFUnDA were not present when compared only to 2017–2018 NHANES data. While both departments still had numerically higher probabilities of detection than 2017–2018 NHANES, the result for Department B was marginal (p = 0.059), and the result for Department D was not statistically significant (p = 0.253). Given that the probability of PFUnDA being detectable in NHANES increased quite notably from 42% in our matched 2015–2016 sample to over 60% in our matched 2017–2018 sample, this differential pattern of results for the 2 years is not unexpected.
Comparing correlation among serum PFAS separately for the firefighter participants and for the matched NHANES participants, correlations were generally similar or lower among the firefighters (Supporting Information: Tables S6 and S7). Sb-PFOA was the only serum PFAS which was frequently negatively correlated with the other PFAS.
The exploratory, complete-case analyses of rank revealed statistically significant pairwise differences in Department A, the only department in the study including inspectors (Supporting Information: Table S8a,b). Inspectors had higher PFHxS concentrations than captains, paramedics, and firefighters using 2015 ranks (all p < 0.05), and inspectors had higher PFHxS concentrations than chiefs using 2017 ranks (p = 0.045); inspectors had higher n-PFOS concentrations than paramedics and captains using 2017 and 2015 ranks, respectively (both p < 0.05); and inspectors had higher Sm-PFOS concentrations than captains using 2015 ranks (p = 0.0217).
4 |. DISCUSSION
Significant differences in firefighter serum PFAS concentrations compared to NHANES, with the exception of Sm-PFOS, were not consistent across the four participating fire departments. This could relate, among other factors, to variation in either firefighting exposures, such as from use of PFAS-containing AFFF, or differential community or workplace environmental exposures such as from PFAS contamination of drinking water. Consistent with the findings of our study, differences have been reported in significantly increased serum PFAS compared with NHANES or other general public reference groups in prior firefighter studies. PFHxS, significantly elevated in three of our four departments in men and two out of two departments in women in our study, is frequently elevated in other studies of firefighters. Two studies of municipal firefighters in Arizona and San Francisco reported higher serum concentrations of PFHxS among firefighters than NHANES, with concentrations similar to those observed in male participants in the current study.10,12 A study in Ohio found PFHxS concentrations in firefighters to be greater than those without current or past firefighting occupations living in the same geographic area; a study of firefighters at AFFF training facilities also reported elevated serum concentrations of PFHxS compared with a reference population9,27; and PFHxS was observed to increase after exposure in a study of firefighters training with AFFF.28 However, two studies of municipal career and volunteer firefighters in Southern California and New Jersey, respectively, reported PFHxS serum concentrations similar to those of the most temporally proximate NHANES means.7,8
Significant differences in serum PFOS concentrations compared with the general population also varied among prior firefighter studies. Ohio firefighters had serum concentrations 29% greater than US adult men, with airport firefighters having serum PFOS concentrations 62% higher than suburban firefighters.11 In contrast, New Jersey firefighters had PFOS concentrations that were 43% lower than NHANES.6 Other studies of municipal firefighters showed PFOS concentrations not significantly different from the general public,7,9,10,12 although studies of airport firefighters, firefighters training with AFFF, and disaster responders reported serum PFOS concentrations above reference populations.11,27,29 Firefighter on-shift occupational exposure to PFOS, but not other PFAS, was documented using silicone wristbands in a North Carolina fire department.30
An important finding of the current study was the significantly elevated Sm-PFOS concentration in 7 out of 10 department comparisons with NHANES for men and women, with numerical but not statistically significant elevations compared to NHANES for the Department A 2015–2016 period for Hispanic men, the Department A 2017–2018 period for men, and Department B for Hispanic men. The latter two results could reflect low power since only four men in Department A had PFAS measured in 2017–2018, and only 10 Hispanic men in Department B had PFAS measured. Interestingly, n-PFOS was only elevated in men in Departments B and C. Most previous studies of firefighters have not separately reported n-PFOS and Sm-PFOS. Differences in elimination half-lives for Sm-PFOS and n-PFOS have been reported for some populations. Lin et al.31 reported a longer half-life for Sm-PFOS than n-PFOS in participants from the National Diabetes Prevention Program. Zhang et al.32 reported both lower and higher estimated half-lives for select branched PFOS isomers when compared to n-PFOS. Furthermore, the health effects of Sm-PFOS and n-PFOS may vary. In one of the few studies to evaluate their individual toxicity, serum Sm-PFOS (along with n-PFOA and PFHxS) was associated with accelerated epigenetic age in a group of firefighters, whereas n-PFOS (along with Sb-PFOA, PFNA, PFDA, and PFUnDA) was associated with specific differentially methylated CpG sites.33
Two other serum PFAS were elevated in at least two of the departments. Serum n-PFOA concentrations were elevated in non-Hispanic participants in Departments B–D compared with NHANES. In previous studies, serum PFOA concentrations were found to be lower than NHANES in San Francisco,12 and not significantly different in Southern California, New Jersey, and Arizona.7,8,10 Serum PFNA concentrations, elevated in male firefighters in Departments B–D, but lower in A, were greater than NHANES in New Jersey and San Francisco, lesser in Arizona, and not significantly different in Southern California.7,8,10,12 First responders who were more exposed to smoke generated by the collapse of the World Trade Center in 2001 had higher concentrations of serum PFNA compared to those less exposed to smoke.29 Serum PFDA concentrations, elevated in male firefighters in Department A only, were greater than NHANES in New Jersey and San Francisco,8,12 and three times greater than NHANES in Southern California,7 but showed no significant difference in firefighters in Arizona.10
While we observed elevated serum concentrations of n-PFOA in three of our departments compared to NHANES, the frequency of detection of Sb-PFOA was only elevated in Department A, for both men and women, and was lower for men in Department B. For firefighters, occupational exposure to n-PFOA may also occur from the use of firefighting foams as well as from the degradation of turnout gear containing PFOA precursors.6,28 Linear isomers are thought to be more slowly eliminated when compared to branched isomers,32 and toxicokinetic differences may exist between different isomers of PFOA.
In the modeled NHANES data from men, serum PFAS concentrations were found to be higher in non-Hispanics as compared to Hispanics. PFAS serum concentrations have been found to differ by ethnicity and race in the general public. Barton et al.34 found that non-Hispanic Whites had higher serum PFOA and PFOS concentrations when compared to Hispanic Whites and non-Hispanic non-Whites, and serum PFHxS was elevated in non-Hispanic Whites when compared to Hispanic Whites. Calafat et al.35 observed higher serum PFOA concentrations in non-Hispanic Whites compared to non-Hispanic Blacks, while Mexican Americans had significantly lower serum PFOA and PFOS concentrations compared to both non-Hispanic Whites and non-Hispanic Blacks. Nelson et al.36 observed lower serum concentrations of PFOA and PFOS, as well as lower concentrations of serum PFNA and PFHxS in Mexican Americans when compared to other Hispanics, non-Hispanic Whites and non-Hispanic Blacks; and serum PFNA and PFOS were elevated in non-Hispanic Blacks compared to non-Hispanic Whites.
Occupational hazards can differ by firefighter job type, individual work tasks, and rank.37 Although the activities by job type can vary somewhat across fire departments, there are general similarities. Firefighters are the task arm of fire suppression and the most involved in fighting a fire. Captains are the tactical arm of a fire suppression incident but often will also be involved in fighting a fire. Paramedics perform rehab of other fireground personnel, particularly the entry teams, but in our four participating fire departments all paramedics have dual roles of paramedic/firefighting. Engineers oversee the engine and ladder vehicles and their operation. Inspectors (including arson investigators) perform postsuppression evaluation; they also inspect buildings for fire code. Others include anyone not in one of the previous categories.
In the current study, Department A serum PFHxS and PFOS concentrations in inspectors were significantly different than in the other job types. As inspectors in Department A traditionally focus on building inspections and do not have clear sources of PFAS exposure, a further review of these individuals determined that the three of the nine inspectors with the highest PFAS concentrations had recent fire investigator duties. In contrast, none of the firefighters in the other job types had recent fire investigation duties. Fire investigators comprise a subgroup of the firefighter workforce, with primary focus to determine the origin and cause of a fire or explosion after the scene of a fire. A study including municipal fire investigators responding to structural fires demonstrated a roughly two-fold increase in sum of urinary polycyclic aromatic hydrocarbon metabolites, although the investigator sample size was small and the increase not statistically significant.38 Historically, investigators have not consistently used personal protective equipment during most of their fire incident responses, and therefore may be at risk from inhalation of particulates. Future studies should evaluate serum PFAS and PFAS exposures specific to fire investigators.
4.1 |. Limitations
A major limitation of our study was the lack of a concurrent NHANES comparison group for three of the departments at the time of analysis. Sera from participants in Departments B–D were collected in 2018–2019 whereas the NHANES comparison participants had serum collected in 2017–2018. Given the decrease over time in NHANES serum concentrations for most of the PFAS measured in this study, true differences between fire department participants and the NHANES comparison population were likely underestimated. The study also lacked nonfirefighter comparison groups in the geographic region of each participating department, and we were not able to determine the main sources of PFAS exposure for the firefighters; in particular, we lacked data on use of AFFF, and neither department nor home drinking water was analyzed for PFAS contamination. In addition, 33% of the firefighters and 13% of the NHANES participants with measured PFAS were missing responses on smoking at least 100 cigarettes in their entire life. The four fire departments studied may not be representative of the overall US fire service in regard to PFAS exposure. Furthermore, all four departments were career, whereas the majority of US firefighters are volunteer. Selection bias involving PFAS exposure could not be ruled out, although measurement of serum PFAS was not an explicit goal at the time of participant recruitment and was not mentioned to the participants. In addition, comparison information from firefighters in each fire department not offered or declining enrollment was not available, limiting our ability to determine the extent to which participating firefighters may have differed from their colleagues. The small number of women firefighter participants limited our ability to potentially detect significant differences from women in the NHANES study. Evaluation of PFAS exposures by rank would benefit from consideration of past job history, given the relatively long elimination half-lives of the legacy PFAS examined in this study.
5 |. CONCLUSIONS
Serum PFAS concentrations in comparison to NHANES varied among the four participating fire departments, suggesting differential occupational and/or environmental exposures. PFHxS serum concentrations were the most elevated relative to NHANES, with over three-fold elevations in some comparison groups, suggesting the need for particular focus on this PFAS in firefighter studies. Sm-PFOS was elevated in all departments compared to NHANES, suggesting the relevance for quantifying isomers when trying to understand routes and sources of exposure for firefighters as well as the need for additional evaluation of the toxicity of this exposure. Additional studies investigating sources of PFAS exposure are needed to guide exposure reduction efforts.
Supplementary Material
ACKNOWLEDGMENTS
We appreciate the support of the fire service departments and organizations essential for the development of the Fire Fighter Cancer Cohort Study, and the statistical advice and insight of Drs. Dean Billheimer and Edward J. Bedrick. We also acknowledge Dr. Kayoko Kato, Kendra Hubbard, John Eng, and Ruben Hatchett for the quantification of PFAS concentrations. Funded by the Federal Emergency Management Agency (FEMA) EMW-2014-FP-00200, EMW-2015-FP-00213 and EMW-2018-FP-0086, and the International Association of Fire Fighters. The work was performed at the University of Arizona and the University of Miami.
Footnotes
CONFLICTS OF INTEREST
The authors declare that there are no conflicts of interest.
DISCLOSURE BY AJIM EDITOR OF RECORD
Leena Nylander-French and Linda Gaines declares that they have no conflicts of interest in the review and publication decision regarding this article.
INSTITUTION AND ETHICS APPROVAL AND INFORMED CONSENT
Human subjects protection review and approval was provided by the University of Miami IRB. All participants signed informed consent prior to the study procedures.
DISCLAIMER
The findings and conclusions in this paper are those of the authors and do not necessarily represent the official position of the National Institute for Occupational Safety and Health (NIOSH) or National Center for Environmental Health (NCEH) at the Centers for Disease Control and Prevention (CDC). Use of trade names is for identification only and does not imply endorsement by the CDC, the Public Health Service, or the US Department of Health and Human Services.
SUPPORTING INFORMATION
Additional supporting information can be found online in the Supporting Information section at the end of this article.
DATA AVAILABILITY STATEMENT
The data that support the findings of this study are available on request from the corresponding author. The data are not publicly available due to privacy or ethical restrictions.
REFERENCES
- 1.Sunderland EM, Hu XC, Dassuncao C, Tokranov AK, Wagner CC, Allen JG. A review of the pathways of human exposure to poly- and perfluoroalkyl substances (PFASs) and present understanding of health effects. J Expo Sci Environ Epidemiol. 2019;29(2):131–147. doi: 10.1038/s41370-018-0094-1 [DOI] [PMC free article] [PubMed] [Google Scholar]
- 2.Fenton SE, Ducatman A, Boobis A, et al. Per- and polyfluoroalkyl substance toxicity and human health review: current state of knowledge and strategies for informing future research. Environ Toxicol Chem. 2021;40(3):606–630. doi: 10.1002/etc.4890 [DOI] [PMC free article] [PubMed] [Google Scholar]
- 3.Li Y, Fletcher T, Mucs D, et al. Half-lives of PFOS, PFHxS and PFOA after end of exposure to contaminated drinking water. Occup Environ Med. 2018;75(1):46–51. doi: 10.1136/oemed-2017-104651 [DOI] [PMC free article] [PubMed] [Google Scholar]
- 4.Buck RC, Franklin J, Berger U, et al. Perfluoroalkyl and polyfluoroalkyl substances in the environment: terminology, classification, and origins. Integr Environ Assess Manag. 2011;7(4):513–541. doi: 10.1002/ieam.258 [DOI] [PMC free article] [PubMed] [Google Scholar]
- 5.Schulz K, Silva MR, Klaper R. Distribution and effects of branched versus linear isomers of PFOA, PFOS, and PFHxS: a review of recent literature. Sci Total Environ. 2020;733:139186. doi: 10.1016/j.scitotenv.2020.139186 [DOI] [PubMed] [Google Scholar]
- 6.Peaslee GF, Wilkinson JT, McGuinness SR, et al. Another pathway for firefighter exposure to per- and polyfluoroalkyl substances: firefighter textiles. Environ Sci Technol Lett. 2020;7(8):594–599. doi: 10.1021/acs.estlett.0c00410 [DOI] [Google Scholar]
- 7.Dobraca D, Israel L, McNeel S, et al. Biomonitoring in California firefighters: metals and perfluorinated chemicals. J Occup Environ Med. 2015;57(1):88–97. doi: 10.1097/JOM.0000000000000307 [DOI] [PMC free article] [PubMed] [Google Scholar]
- 8.Graber JM, Black TM, Shah NN, et al. Prevalence and predictors of per- and polyfluoroalkyl substances (PFAS) serum levels among members of a suburban US volunteer fire department. Int J Environ Res Public Health. 2021;18(7):3730. doi: 10.3390/ijerph18073730 [DOI] [PMC free article] [PubMed] [Google Scholar]
- 9.Jin C, Sun Y, Islam A, Qian Y, Ducatman A. Perfluoroalkyl acids including perfluorooctane sulfonate and perfluorohexane sulfonate in firefighters. J Occup Environ Med. 2011;53(3):324–328. doi: 10.1097/JOM.0b013e31820d1314 [DOI] [PubMed] [Google Scholar]
- 10.Khalil N, Ducatman AM, Sinari S, et al. Per- and polyfluoroalkyl substance and cardio metabolic markers in firefighters. J Occup Environ Med. 2020;62(12):1076–1081. doi: 10.1097/JOM.0000000000002062 [DOI] [PMC free article] [PubMed] [Google Scholar]
- 11.Leary DB, Takazawa M, Kannan K, Khalil N. Perfluoroalkyl substances and metabolic syndrome in firefighters: a pilot study. J Occup Environ Med. 2020;62(1):52–57. doi: 10.1097/JOM.0000000000001756 [DOI] [PubMed] [Google Scholar]
- 12.Trowbridge J, Gerona RR, Lin T, et al. Exposure to perfluoroalkyl substances in a cohort of women firefighters and office workers in San Francisco. Environ Sci Technol. 2020;54(6):3363–3374. doi: 10.1021/acs.est.9b05490 [DOI] [PMC free article] [PubMed] [Google Scholar]
- 13.Centers for Disease Control and Prevention (CDC). National Center for Health Statistics (NCHS). National Health and Nutrition Examination Survey Data. U.S. Department of Health and Human Services, Centers for Disease Control and Prevention. https://wwwn.cdc.gov/nchs/nhanes/continuousnhanes/default.aspx?BeginYear=2015 [Google Scholar]
- 14.Centers for Disease Control and Prevention (CDC). National Center for Health Statistics (NCHS). National Health and Nutrition Examination Survey Data. U.S. Department of Health and Human Services, Centers for Disease Control and Prevention. https://wwwn.cdc.gov/nchs/nhanes/continuousnhanes/default.aspx?BeginYear=2017 [Google Scholar]
- 15.Kato K, Kalathil AA, Patel AM, Ye X, Calafat AM. Per- and polyfluoroalkyl substances and fluorinated alternatives in urine and serum by on-line solid phase extraction-liquid chromatography-tandem mass spectrometry. Chemosphere. 2018;209:338–345. doi: 10.1016/j.chemosphere.2018.06.085 [DOI] [PMC free article] [PubMed] [Google Scholar]
- 16.Hornung RW, Reed LD. Estimation of average concentration in the presence of nondetectable values. Appl Occup Environ Hyg. 1990;5(1):46–51. doi: 10.1080/1047322X.1990.10389587 [DOI] [Google Scholar]
- 17.Rubin DB. Multiple Imputation for Nonresponse in Surveys. John Wiley & Sons Inc; 1987. [Google Scholar]
- 18.van Buuren S, Oudshoorn CGM Multivariate Imputation by Chained Equations: MICE V1.0 User’s Manual. https://stefvanbuuren.name/publications/MICE%20V1.0%20Manual%20TNO00038%202000.pdf
- 19.White IR, Royston P, Wood AM. Multiple imputation using chained equations: issues and guidance for practice. Stat Med. 2011;30(4):377–399. doi: 10.1002/sim.4067 [DOI] [PubMed] [Google Scholar]
- 20.Dong Z, Wang H, Yu YY, Li YB, Naidu R, Liu Y. Using 2003–2014 U.S. NHANES data to determine the associations between per- and polyfluoroalkyl substances and cholesterol: trend and implications. Ecotoxicol Environ Saf. 2019;173:461–468. doi: 10.1016/j.ecoenv.2019.02.061 [DOI] [PubMed] [Google Scholar]
- 21.Fisher M, Arbuckle TE, Wade M, Haines DA. Do perfluoroalkyl substances affect metabolic function and plasma lipids?—analysis of the 2007–2009, Canadian health measures survey (CHMS) cycle 1. Environ Res. 2013;121:95–103. doi: 10.1016/j.envres.2012.11.006 [DOI] [PubMed] [Google Scholar]
- 22.Bedrick EJ. Biserial correlation. In Armitage P, Colton T, eds. Encyclopedia of Biostatistics. 1. John Wiley & Sons; 2005:1–3. doi: 10.1002/0470011815.b2a10007 [DOI] [Google Scholar]
- 23.Fox J Polycor: Polychoric and Polyserial Correlations. R package version 0.8–1; 2022. https://CRAN.R-project.org/package=polycor
- 24.R Core Team. R: A Language and Environment for Statistical Computing. R Foundation for Statistical Computing; 2021. https://www.R-project.org/ [Google Scholar]
- 25.van Buuren S, Groothuis-Oudshoorn K. Mice: multivariate imputation by chained equations in R. J Stat Softw. 2011;45(3):1–67. doi: 10.18637/jss.v045.i03 [DOI] [Google Scholar]
- 26.Lumley T Analysis of Complex Survey Samples. https://cran.r-project.org/web/packages/survey/survey.pdf
- 27.Rotander A, Toms LM, Aylward L, Kay M, Mueller JF. Elevated levels of PFOS and PFHxS in firefighters exposed to aqueous film forming foam (AFFF). Environ Int. 2015;82:28–34. doi: 10.1016/j.envint.2015.05.005 [DOI] [PubMed] [Google Scholar]
- 28.Laitinen JA, Koponen J, Koikkalainen J, Kiviranta H. Firefighters’ exposure to perfluoroalkyl acids and 2-butoxyethanol present in firefighting foams. Toxicol Lett. 2014;231(2):227–232. doi: 10.1016/j.toxlet.2014.09.007 [DOI] [PubMed] [Google Scholar]
- 29.Tao L, Kannan K, Aldous KM, Mauer MP, Eadon GA. Biomonitoring of perfluorochemicals in plasma of New York State personnel responding to the world trade center disaster. Environ Sci Technol. 2008;42(9):3472–3478. doi: 10.1021/es8000079 [DOI] [PubMed] [Google Scholar]
- 30.Levasseur JL, Hoffman K, Herkert NJ, Cooper E, Hay D, Stapleton HM. Characterizing firefighter’s exposure to over 130 SVOCs using silicone wristbands: a pilot study comparing on-duty and off-duty exposures. Sci Total Environ. 2022;834:155237. doi: 10.1016/j.scitotenv.2022.155237 [DOI] [PMC free article] [PubMed] [Google Scholar]
- 31.Lin PID, Cardenas A, Hauser R, et al. Per- and polyfluoroalkyl substances and kidney function: follow-up results from the diabetes prevention program trial. Environ Int. 2021;148:106375. doi: 10.1016/j.envint.2020.106375 [DOI] [PMC free article] [PubMed] [Google Scholar]
- 32.Zhang Y, Beesoon S, Zhu L, Martin JW. Biomonitoring of perfluoroalkyl acids in human urine and estimates of biological half-life. Environ Sci Technol. 2013;47(18):10619–10627. doi: 10.1021/es401905e [DOI] [PubMed] [Google Scholar]
- 33.Goodrich JM, Calkins MM, Caban-Martinez AJ, et al. Per- and polyfluoroalkyl substances, epigenetic age and DNA methylation: a cross-sectional study of firefighters. Epigenomics. 2021;13(20):1619–1636. doi: 10.2217/epi-2021-0225 [DOI] [PMC free article] [PubMed] [Google Scholar]
- 34.Barton KE, Starling AP, Higgins CP, McDonough CA, Calafat AM, Adgate JL. Sociodemographic and behavioral determinants of serum concentrations of per- and polyfluoroalkyl substances in a community highly exposed to aqueous film-forming foam contaminants in drinking water. Int J Hyg Environ Health. 2020;223(1):256–266. doi: 10.1016/j.ijheh.2019.07.012 [DOI] [PMC free article] [PubMed] [Google Scholar]
- 35.Calafat AM, Kuklenyik Z, Reidy JA, Caudill SP, Tully JS, Needham LL. Serum concentrations of 11 polyfluoroalkyl compounds in the US population: data from The National Health and Nutrition Examination Survey (NHANES). Environ Sci Technol. 2007;41(7):2237–2242. doi: 10.1021/es062686m [DOI] [PubMed] [Google Scholar]
- 36.Nelson JW, Hatch EE, Webster TF. Exposure to polyfluoroalkyl chemicals and cholesterol, body weight, and insulin resistance in the general U.S. population. Environ Health Perspect. 2010;118(2):197–202. doi: 10.1289/ehp.0901165 [DOI] [PMC free article] [PubMed] [Google Scholar]
- 37.Hwang J, Xu C, Agnew RJ, Clifton S, Malone TR. Health risks of structural firefighters from exposure to polycyclic aromatic hydrocarbons: a systematic review and meta-analysis. Int J Environ Res Public Health. 2021;18(8):4209. doi: 10.3390/ijerph18084209 [DOI] [PMC free article] [PubMed] [Google Scholar]
- 38.Hoppe-Jones C, Griffin SC, Gulotta JJ, et al. Evaluation of fireground exposures using urinary PAH metabolites. J Expo Sci Environ Epidemiol. 2021;31(5):913–922. doi: 10.1038/s41370-021-00311-x [DOI] [PMC free article] [PubMed] [Google Scholar]
Associated Data
This section collects any data citations, data availability statements, or supplementary materials included in this article.
Supplementary Materials
Data Availability Statement
The data that support the findings of this study are available on request from the corresponding author. The data are not publicly available due to privacy or ethical restrictions.