

Abstract
Radiomics is a technique that extracts quantitative features from medical images using data‐characterization algorithms. Radiomic features can be used to identify tissue characteristics and radiologic phenotyping that is not observable by clinicians. A typical workflow for a radiomics study includes cohort selection, radiomic feature extraction, feature and predictive model selection, and model training and validation. While there has been increasing attention given to radiomic feature extraction, standardization, and reproducibility, currently, there is a lack of rigorous evaluation of feature selection methods and predictive models. Herein, we review the published radiomics investigations in CT lung cancer and provide an overview of the commonly used radiomic feature selection methods and predictive models. We also compare limitations of various methods in clinical applications and present sources of uncertainty associated with those methods. This review is expected to help raise awareness of the impact of radiomic feature and model selection methods on the integrity of radiomics studies.
Keywords: CT, feature selection, lung cancer, predictive model, radiomics
1. INTRODUCTION
Radiomics is a technique that extracts quantitative features, termed as radiomic features, from medical images using data‐characterization algorithms. 1 Radiomic features can be used to identify tissue characteristics and radiologic phenotyping that is not observable by clinicians. Although morphological image features have been used in clinical practice for many decades, the concept of radiomics was first proposed in 2012. Since then, radiomics studies have experienced an exponential growth.
We performed a literature search on publications from 2012 to the end of 2021 from PubMed. The use of the keyword “radiomics” returned 5579 results, adding “lung cancer” returned 911 results, then adding “CT” returned 560 results. Figure 1 illustrates the number of publications annually for the literature search.
FIGURE 1.
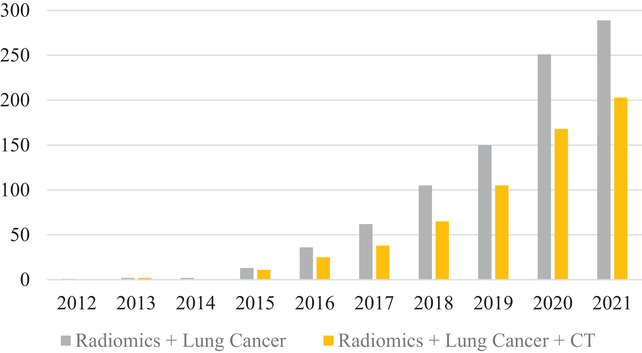
Number of publications by year from 2012 to 2021. The search was from PubMed for “Radiomics” + “Lung Cancer” and “Radiomics” + “Lung Cancer” + “CT.” The growth of the field of radiomics has been steadily increasing over the past decade. (Accessed on January 10, 2022)
We screened the publications to exclude 45 PET/CT or MRI‐related papers, 22 review papers, and 53 publications that were not in English or were not directly relevant to a radiomics study (e.g., new software tests, updated databases, or new proposed standards), leaving a total of 340 publications. Of the 340 publications, 161 had accessible full‐texts and were categorized into three categories: classification, prognostics, and meta‐analysis studies. Studies that primarily investigate the effect that image acquisition parameters, feature selection methods, and/or model selection have on predictive performance are considered meta‐analysis studies. Accordingly, 32 meta‐analysis studies were identified and excluded from the review, leaving 77 classification studies and 52 prognostics studies, which were included in the review.
The 22 review papers mainly covered three topics: image quality, 2 , 3 feature reproducibility, 4 and potential applications in lung cancer. 5 , 6 , 7 , 8 , 9 , 10 , 11 , 12 , 13 , 14 , 15 , 16 , 17 , 18 , 19 , 20 , 21 , 22 The review papers regarding image quality or feature reproducibility discussed neither feature selection methods nor predictive models. Review papers focusing on potential clinical applications generally mentioned basic model construction when discussing a study. Two of these review papers included a short summary of feature selection methods and predictive models based on a very limited number of sources. 7 , 11 To the best of our knowledge, there is no comprehensive review that examines feature selection methods and predictive models used in CT lung cancer radiomics. Feature selection methods and predictive models play a pivotal role in radiomics. Hence, we provide a review regarding this topic based on a thorough analysis of existing literature.
2. OVERVIEW
Figure 2 shows a typical radiomics study pipeline. To begin, a patient cohort is chosen based on criteria appropriate to the study parameters (e.g., type of disease, treatment method, etc.). A patient cohort can be sourced from institutional data, public databases (e.g., The Cancer Imaging Archive), or a combination of both. Radiomic features are extracted from the cohort image sets using feature extraction software, often hundreds if not thousands of features are extracted. A feature selection process is then conducted to remove redundant and unstable features before the predictive model is ready to be trained. The datasets used to train a predictive model include a training and validation dataset, both originating from the patient cohort, and a test dataset, originating from an independent data source. The independent test set is key to model development as it provides an unbiased evaluation of model performance.
FIGURE 2.

A typical pipeline of a radiomic study
The two main clinical applications of radiomics are classification and prognostics. Classification studies create a model that can stratify a cohort into distinct bins determined by the study. Typically, these studies are interested in determining malignancy, specific gene expression or phenotyping, or segmentation. 23 , 24 , 25 , 26 , 27 , 28 , 29 , 30 , 31 , 32 , 33 , 34 , 35 , 36 , 37 , 38 , 39 , 40 , 41 , 42 , 43 , 44 , 45 , 46 , 47 , 48 , 49 , 50 , 51 , 52 , 53 , 54 , 55 , 56 , 57 , 58 , 59 , 60 , 61 , 62 , 63 , 64 , 65 , 66 , 67 , 68 , 69 , 70 , 71 , 72 , 73 , 74 , 75 , 76 , 77 , 78 , 79 , 80 , 81 , 82 , 83 , 84 , 85 , 86 , 87 , 88 , 89 , 90 , 91 , 92 , 93 , 94 , 95 , 96 , 97 , 98 , 99 Prognostics studies create models that score individual cases along a sliding scale. The outputs of prognostic studies are heavily associated with future clinical outcomes such as treatment response, disease spread, or survival rates. 100 , 101 , 102 , 103 , 104 , 105 , 106 , 107 , 108 , 109 , 110 , 111 , 112 , 113 , 114 , 115 , 116 , 117 , 118 , 119 , 120 , 121 , 122 , 123 , 124 , 125 , 126 , 127 , 128 , 129 , 130 , 131 , 132 , 133 , 134 , 135 , 136 , 137 , 138 , 139 , 140 , 141 , 142 , 143 , 144 , 145 , 146 , 147 , 148 , 149 , 150 , 151 Figure 3 illustrates the annual quantity of publications for each application in this review.
FIGURE 3.
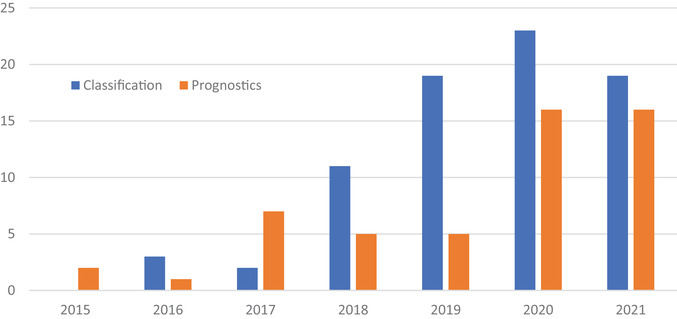
Annual number of publications for classification and prognostic studies in CT lung cancer radiomics that were included in this review
It should be noted that we provide an overview of feature selection methods and predictive models and possible trends over time. This review does not intend to compare those methods nor to provide any recommendations for future study construction.
3. RADIOMIC FEATURE SELECTION
3.1. General features
Radiomic features are extracted using mathematical calculations to generate quantitative information within a region of interest (ROI). These features are extracted with open‐source software (PyRadiomics, IBEX, etc.), commercial software (ITK SNAP, GE Analysis Kit), or with in‐house software. Table 1 lists the software used by studies in this review.
TABLE 1.
A list of feature extraction software used by the studies in this review
| Feature extraction software | Study count |
|---|---|
| Inhouse Developed Software | 54 |
| PyRadiomics | 32 |
| Artificial Intelligence Kit (GE Healthcare) | 8 |
| Analysis Kit (GE Healthcare) | 6 |
| LIFEx | 6 |
| 3D Slicer Radiomics | 4 |
| Definiens Developer | 3 |
| MaZda | 3 |
| Slicer‐Radiomics | 3 |
| Radiomics (Siemens) | 2 |
| AVIEW Research | 1 |
| CERR | 1 |
| IBEX | 1 |
| ITK | 1 |
| MATLAB Radiomics | 1 |
| PORTS | 1 |
| Radiomic Precision Metrics | 1 |
| RadiomiX Discovery Toolbox | 1 |
The extracted radiomic features typically fall under four main categories: shape, first‐, second‐, and higher‐order features. Shape features indicate morphological characteristics of the ROI. First‐order features are direct measurements of the voxel values, describing the distribution of intensities within the ROI. Second‐order features, also referred to as texture features, provide descriptions of how voxels within a given ROI relate to each other. Higher‐order features can be generated by applying filters (e.g., wavelet) to the ROI/image before extracting features.
Each category of feature aside from higher‐order features contains a number of feature families, as seen in Table 2. Each of these feature families contain individual features that operate on the ROI in a similar manner. The number of commonly used individual features is over 100 and some of these exhibit spatial variations. There may be thousands of extracted features when all variations are considered.
TABLE 2.
Commonly used radiomic feature families arranged by feature type
| Feature type | Feature family |
|---|---|
| Shape | Morphology |
| First‐order | Local Intensity |
| Intensity‐based Statistics | |
| Intensity Histogram | |
| Second‐order | Grey Level Co‐occurrence Matrix (GLCM) |
| Grey Level Run Length Matrix (GLRLM) | |
| Grey Level Size Zone Matrix (GLSZM) | |
| Grey Level Distance Zone Matrix (GLDZM) | |
| Neighborhood Grey Tone Difference Matrix (NGTDM) | |
| Neighboring Grey Level Dependence Matrix (NGLDM) | |
| Laws | |
| Gabor | |
| Higher‐order | Wavelets |
| Laplacian of Gaussian (LoG) |
3.2. Feature selection methods
The most common feature selection methods are listed in Table 3 along with a short explanation of how each one works. Single or multiple feature selection methods are employed in radiomic studies. An alternative approach is to directly extract a smaller, predetermined list of features. Feature selection methods select the most reliable and relevant features for model training through removing redundant information. This process will improve the robustness of the predictive model and help reduce the risk of overfitting as well as calculation time. 152
TABLE 3.
Commonly used feature selection methods by the studies included in this review
| Feature selection method | Mechanism |
|---|---|
| Component Analysis | Variance via sorted eigenvalues |
| Clustering | Choosing representative features among correlated groups |
| ICC/CCC | Measures feature reproducibility with correlation |
| LASSO | Regression analysis with L1 regularization |
| mRMR | Maximize F‐statistic and minimize correlation with defined feature limit |
| (Non)Parametric Statistics | Analysis of variance or means between two or more datasets |
| Pearson/Spearman Correlation | Determines highly correlated features prior to feature selection |
| Rank Sum | Two‐sided median analysis |
| Regression | Statistical relationship between dependent and independent variables |
| Relief | Scoring based on the nearest neighbor feature value differences |
| Random Forest | Calculate importance according to pureness of leaves |
Abbreviations: CCC, concordance correlation coefficient; ICC, intraclass correlation coefficient; LASSO, least absolute shrinkage and selection operator.
Table 4 shows the commonly used feature selection methods according to three categories: single, serial, and parallel feature selection methods. The “Single Method” category is comprised of studies that only use a single feature selection method. The “Serial Method” and “Parallel Method” categories refer to studies that use multiple feature selection methods, but with different approaches. “Serial Method” studies apply feature selection methods in sequence, each step reducing the dimensionality of the radiomic features further. “Parallel Method” studies simply test multiple “single method” independently to achieve better results. A feature selection method that was used only twice or less is categorized as “Other.”
TABLE 4.
Overview of feature selection methods used in CT lung cancer radiomic studies
| Classification | Prognostics | Total | ||
|---|---|---|---|---|
| Single method | LASSO | 8 | 3 | 11 |
| Other a | 3 | 1 | 4 | |
| Random Forest | 3 | 1 | 4 | |
| Logistic Regression | 2 | 2 | 4 | |
| Spearman/Pearson | 2 | 3 | 4 | |
| Component Analysis | 2 | 1 | 3 | |
| Serial methods | ICC/CCC | 28 | 16 | 44 |
| LASSO | 28 | 13 | 41 | |
| Pearson/Spearman | 13 | 7 | 20 | |
| mRMR | 12 | 3 | 15 | |
| (Non)Parametric Stats | 12 | 0 | 12 | |
| Clustering | 7 | 0 | 7 | |
| ICC/CCC + Pearson/Spearman | 4 | 3 | 7 | |
| Parallel methods | Other a | 8 | 13 | 21 |
| RELIEF | 3 | 4 | 7 | |
| (Non‐)Parametric Stats | 2 | 3 | 5 | |
| Pearson/Spearman | 0 | 4 | 4 | |
| mRMR | 1 | 3 | 4 | |
| Fisher Score | 1 | 2 | 3 | |
| Wilcox Rank Sum | 1 | 2 | 3 | |
The breakdown of the most common feature selection methods in “Single Method,” “Serial Method,” and “Parallel Method” studies is displayed. In many cases, the feature selection methods chosen in “Parallel Method” studies were not widely used, resulting in the high frequency of “Other” feature selection methods in these studies.
“Other” indicates feature selection methods that were used twice or less.
The least absolute shrinkage and selection operator (LASSO) method is most widely used in the “Single Method” and “Serial Method” categories. It is a popular choice likely due to the strong covariate reduction capabilities. The intraclass correlation (ICC) and concordance correlation coefficient (CCC) are also widely used, most often as a first step in a “Serial Method” study. ICC and CCC assess the reproducibility of features and serve as a filtering step before additional feature selection methods are employed. In regards to the “Parallel Method” category, as many as 13 feature selection methods were employed in a single study. 59 In many cases, the feature selection methods chosen in “Parallel Method” studies were not widely used, resulting in the high frequency of “Other” feature selection methods in these studies.
3.2.1. Feature selection in classification
The feature selection methods used in classification studies were tallied and separated according to the year of publication. This helps to identify potential trends that could suggest the efficacy of a particular technique. Figure 4 shows that the feature selection method used most often in classification studies is LASSO. LASSO's first usage in CT lung cancer radiomic studies was in 2018 and became the most commonly used method in 2019 onwards. Maximum relevance–minimum redundancy (mRMR) was first used in 2017, though it was initially proposed in 2005. 153 The mRMR feature selection method is most often used in a serial manner, that is, using mRMR then using LASSO on the mRMR results. Among those commonly used feature selection methods in the classification studies, LASSO and ICC/CCC have clearly gained more attention over the past several years.
FIGURE 4.
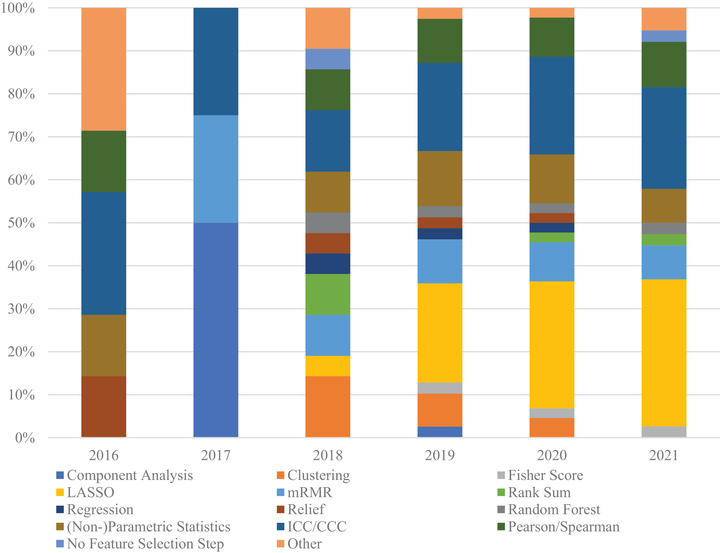
Feature selection method distribution by year for classification studies. The methods most often used were LASSO and ICC/CCC. Notably, LASSO and mRMR techniques that only appeared in 2018 onwards, with LASSO being chosen most often at the time of this review. The “Other” category encompasses feature selection methods that were used twice or less in the review
3.2.2. Feature selection methods in prognostics
Figure 5 shows the distribution of feature selection methods in prognostic studies, which is very similar to that of classification studies. This suggests that the approach to both classification and prognostics studies is quite similar at the feature selection stage. The feature selection method that has become most commonly used in both classification and prognostic studies is LASSO.
FIGURE 5.
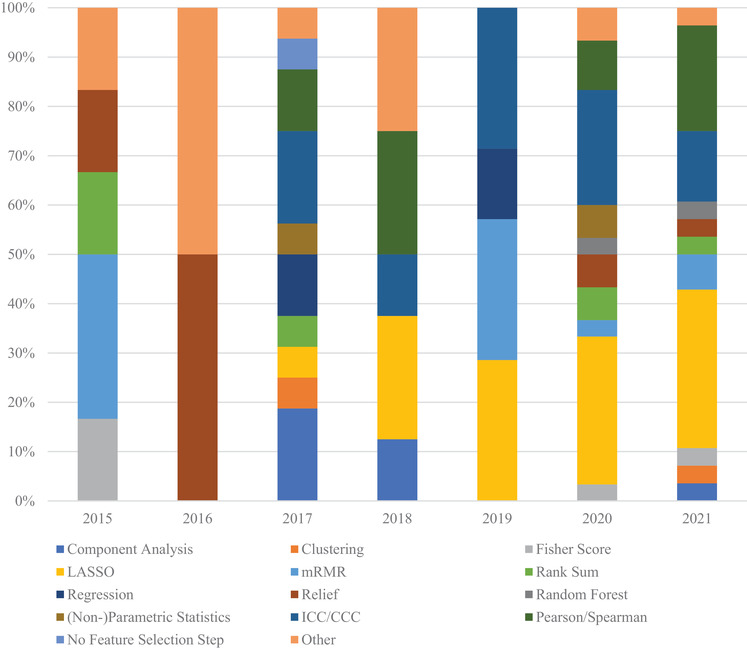
Feature selection method distribution by year for prognostic studies. The methods most often used were LASSO and correlation. The “Other” category encompasses feature selection methods that were used two or less times in the review
3.3. Common features for lung cancer
While there are hundreds of commonly extracted radiomic features and many more niche features, the majority are removed during feature selection. Table 5A lists three filters, wavelet, LoG, and original, that are most commonly applied to feature families to generate high‐order radiomic features, based on features selected by the feature selection methods in the reviewed studies. Among the five most represented feature families listed for each filter, GLCM, first‐order, and GLSZM appeared the most often, contributing over half of the total count in each category. Table 5B lists individual radiomic features and their respective number of appearances for each of the three most commonly used feature families: GLCM, first‐order, and GLSZM. A total count indicates the overall use of the feature family among selected features.
TABLE 5.
(A) Three filters, wavelet, LoG, and original, that are most commonly applied to feature families to generate high‐order radiomic features, based on features selected by the feature selection methods in the reviewed studies. A total count indicates the overall use of the filter among selected features. (B) Individual radiomic features and their respective number of appearances for each of the three most commonly used feature families: GLCM, first‐order, and GLSZM. A total count indicates the overall use of the feature family among selected features
| A) | Classification | Prognostics | ||
|---|---|---|---|---|
| Wavelet | glcm | 65 | glcm | 36 |
| first‐order | 50 | first‐order | 18 | |
| glszm | 37 | glszm | 8 | |
| gldm | 32 | glrlm | 8 | |
| stats | 22 | gldm | 3 | |
| Total Count | 237 | Total Count | 111 | |
| LoG | glcm | 26 | first‐order | 18 |
| glszm | 23 | glcm | 15 | |
| first‐order | 15 | glszm | 4 | |
| gldm | 12 | gldm | 4 | |
| glrlm | 9 | glrlm | 1 | |
| Total Count | 104 | Total Count | 52 | |
| Original | first‐order | 11 | glcm | 11 |
| glcm | 9 | shape | 7 | |
| glszm | 5 | first‐order | 6 | |
| shape | 5 | glrlm | 5 | |
| glrlm | 3 | gldm | 4 | |
| Total Count | 35 | Total Count | 51 |
| B) | Classification | Prognostics | ||
|---|---|---|---|---|
| GLCM | clustershade | 16 | clustershade | 15 |
| clusterprominence | 14 | clusterprominence | 13 | |
| entropy | 14 | correlation | 7 | |
| correlation | 10 | inversevariance | 7 | |
| imc1 | 10 | correl1 | 5 | |
| Total Count | 173 | Total Count | 119 | |
| First‐order | mean | 12 | skewness | 9 |
| median | 11 | energy | 6 | |
| skewness | 11 | 10percentile | 5 | |
| 90percentile | 6 | maximum | 5 | |
| robustmeanabsolutedeviation | 6 | rms | 5 | |
| Total Count | 83 | Total Count | 59 | |
| GLSZM | largearealowgraylevelemphasis | 8 | largeareaemphasis | 5 |
| graylevelnonuniformity | 6 | graylevelnonuniformitynormalized | 4 | |
| zoneentropy | 6 | graylevelvariance | 3 | |
| lowintensitysmallareaemphasis | 5 | largearealowgraylevelemphasis | 3 | |
| sizezonenonuniformitynormalized | 5 | sizezonenonuniformity | 3 | |
| Total Count | 76 | Total Count | 39 |
According to reviewed studies, there are not many common features in CT lung radiomic studies. In classification studies, there are nine features (mean, median, skewness, cluster shade, cluster prominence, entropy, correlation, imc1, imc2) that were selected more than 10 times in 79 total studies. In prognostic studies, there are three features (cluster shade, cluster prominence, skewness) selected more than 10 times in 51 total studies. The wide range of applications within classification and prognostics may diminish the appearance of common features.
3.4. Limitations
3.4.1. Feature extraction consistency
There are many different options for feature extraction, such as self‐developed software, open‐source software, and commercially available software. The multitude of options limits the reliability of feature values, as feature calculations can be difficult to verify across all available implementations. Prior works investigating open‐source and in‐house software have shown that systemic differences in feature values can be observed across platforms, due in part to default settings and calculation differences. 154 , 155 It is important that features are generated in an identical manner throughout all radiomic studies in order to obtain results that are reproducible across testing. The largest standardization effort to date, the Image Biomarker Standardization Initiative (IBSI), 156 has proposed a standard list of feature calculations and pre‐processing techniques. The adoption by individual research groups and open‐source software (e.g., PyRadiomics) has brought some consistency to how feature values are generated. Care should be taken as standardization efforts continue in order to minimize impacts on studies that utilize older versions of the standards.
The number of features that a given study extracts also varies heavily among the reviewed publications. The feature pool can range as low as 14 radiomic features 127 to over 1000 radiomic features. 84 , 103 , 137 , 138 The wide range of radiomic features may suggest the inherent redundancy of many extracted features within a given study. Currently, radiomics is still at the research stage so it is necessary to test a large variety of features, even they are likely redundant, for different potential applications. Table 6 shows the statistics for the number of features selected for predictive model training across the reviewed studies. The average number of features is <10, though some studies have selected as many as 50 and one study found that semantic features alone performed better in predictive model training. 48 Two studies were excluded from this analysis as they both utilized a very large number of radiomic features to train predictive models and these outliers would skew the datapoints. The outliers were a classification study that selected 115 features 74 and a prognostics study that selected 149 features. 136
TABLE 6.
Statistics of the number of features extracted and features selected in reviewed radiomic studies
| Classification | Prognostics | Combined | ||||
|---|---|---|---|---|---|---|
| Extracted | Selected | Extracted | Selected | Extracted | Selected | |
| Mean | 646.0 | 9.7 | 566.1 | 8.6 | 614.7 | 9.3 |
| Std | 625.3 | 9.3 | 543.7 | 6.2 | 595.9 | 8.4 |
| Median | 396 | 6 | 440 | 7 | 396 | 6 |
| Range | 24–2969 | 0–50 | 14–2317 | 1–28 | 14–2969 | 0–50 |
Typically, a radiomics study selects less than 10 features despite the fact that many studies extract hundreds of radiomic features before feature selection.
3.4.2. Limited feature agreement
As seen in Table 5B, there is a limited agreement in features in both classification or prognostic studies, with cluster shade, cluster prominence, and skewness being the features with the highest occurrence out of hundreds of individual features. The wide variety of applications in radiomics may contribute to the limited number of common features found in this review, though additional work should be conducted to determine if the common features have application‐related dependencies or if there are no strong associations.
3.4.3. Correlation cutoff values
ICC/CCC and Pearson/Spearman correlation are heavily used in radiomic studies, often to provide an initial filtering of radiomic features based on reproducibility and redundancy, respectively. Even though this review finds that these methods have a relatively widespread use, it is unclear as to why one, both, or neither method is chosen in any given study. The methods address two major concerns about radiomic feature values. 157 , 158 , 159 , 160 , 161 but are not as ubiquitous as one might expect from useful techniques. An additional concern is the lack of consistency regarding the thresholds that studies utilize when implementing these correlation thresholds. ICC/CCC has ranged from <0.7 24 , 26 to <0.9 39 , 42 and even <0.95. 101 Pearson/Spearman correlation threshold values have also ranged from >0.7 111 to >0.9–0.95. 69 , 124 The variance in thresholds is large across all reviewed studies. This suggests that the threshold values are chosen based on existing studies or through a process of testing that results in better model performance. As radiomics moves towards clinical implementation, it may become a necessity to use consistent correlation thresholds and as such may be worth investigating in future work.
3.4.4. Feature harmonization
Harmonization of radiomic feature values is a technique that is not consistently used in radiomic studies. The performance of feature selection methods and predictive models is directly affected when feature values are adjusted. 162 It is also important to consider that the effects of harmonization are likely feature‐dependent, since features produce values that range across multiple orders of magnitude. Future efforts should be made to fully investigate the need and benefits of this practice.
4. PREDICTIVE MODELS
4.1. General predictive models
Typically, predictive models employ semantic data (e.g., malignancy status, smoking status, age, survival time, etc.), radiomic features, or a combination of the two. Many studies use multiple models with different combinations of semantic and radiomic data. After the data are input into the model for training, the machine learning process optimizes the parameters to produce the best fit to the data.
4.2. Commonly used predictive models in CT lung cancer radiomics
Table 7 provides an overview of the predictive models used in the reviewed studies. The studies are separated based on the number of models tested, either single or multiple models. When looking at the entirety of the reviewed studies, regression is the most commonly used predictive model in CT lung cancer radiomic studies, among which logistic regression comprises a vast majority. Other commonly used models after regression are support vector machine (SVM), random forest (RF), and Cox's proportional hazard model. Very often a study will use multiple modeling methods to test which method will produce better results. This process has been made relatively easy by available software, which can provide multiple options for modeling without much increase in effort.
TABLE 7.
Overview of the predictive models in radiomic studies
| Classification | Prognostics | Total | ||
|---|---|---|---|---|
| Single model | Regression | 40 | 11 | 51 |
| Cox | 0 | 16 | 16 | |
| Random Forest | 9 | 3 | 12 | |
| Support Vector Machine | 8 | 2 | 10 | |
| Statistics | 3 | 3 | 6 | |
| Multiple models | Support Vector Machine | 8 | 11 | 19 |
| Regression | 6 | 8 | 14 | |
| Naïve Bayes | 6 | 5 | 11 | |
| Discriminant Analysis | 7 | 2 | 9 | |
| k‐Nearest Neighbor | 4 | 4 | 8 | |
| Random Forest | 8 | 0 | 8 | |
| Decision Tree | 1 | 5 | 6 | |
| Neural Network | 3 | 3 | 6 | |
| Boosting | 0 | 5 | 5 | |
| Cox | 0 | 5 | 5 | |
The studies were separated by single model and multiple models. Regression, primarily logistic regression, was most commonly used in the reviewed studies.
When looking at classification studies, classifiers are unsurprisingly the model of choice since the goal of the predictive model is to classify inputs into distinct groups. Figure 6 shows the distribution of models used in CT lung cancer radiomic studies published during the review periods. The top three commonly used models for classification over time are regression, SVM, and RF. It shows that there is an increasing trend in the use of regression.
FIGURE 6.
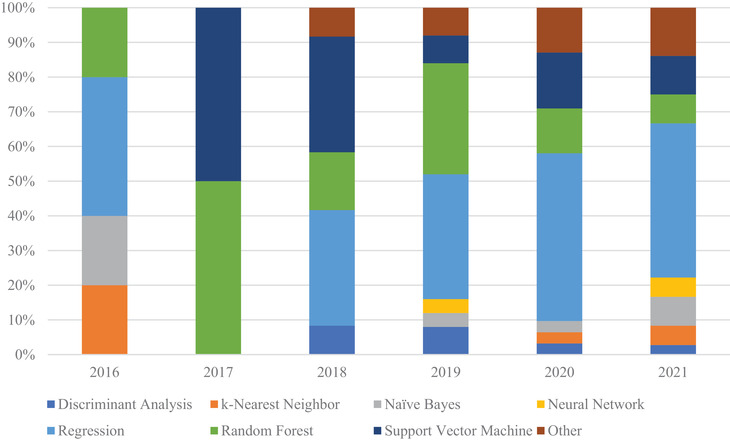
Distribution of models used in CT lung cancer radiomic studies for classification studies published during the review periods. The classification models utilize random forest and support vector machines more often than prognostic studies, as RF and SVM are better suited for classification tasks
When looking at prognostic studies, as seen in Figure 7, studies still favor regression and RF as models. The primary difference from classification studies is the use of the Cox's proportional hazard model, since it is suited for variable outputs. This shows the general trend that logistic regression has in parsing large patient cohorts.
FIGURE 7.

Distribution of models used in CT lung cancer radiomic studies for prognostics studies published during the review periods. Regression, RF, and SVM are still widely used like in classification studies. Cox's proportional hazard models are more often used in prognostic studies, as it is suited for survival rate stratification
4.3. Limitations
4.3.1. Cohort power
For radiomic studies, datasets can be sourced from public datasets (e.g., TCIA, RIDER, NLST, public clinical trials) or from institutional data collected for the purpose of the study. The decision to conduct a study using institutional data, public data, or a combination of both depends on the goals of the study and the method used to validate the predictive model. Table 8A shows the usage of institutional and public data in the reviewed studies. The number of datapoints available in a chosen cohort plays an important role in determining the statistical power of a study. Table 8B characterizes the cohort sizes in this review, illustrating how diverse cohort sizes are in radiomic studies. The size of the cohort should be appropriate to the task, and relevant power metrics should be conducted to ensure that the cohort is not too small or too large. This condition may be difficult to fulfill, depending on the availability of relevant clinical data. The lack of statistical methods used for power analysis is of a concern.
TABLE 8.
Radiomic study cohort characteristics among reviewed studies
| Classification | Prognostics | Combined | ||
|---|---|---|---|---|
| (A) | Institutional only | 64 | 41 | 105 |
| Public only | 6 | 8 | 14 | |
| Combined | 7 | 3 | 10 | |
| (B) | Cohort size | |||
| Mean | 256.3 | 242.8 | 250.9 | |
| Std | 206.7 | 217.1 | 211.1 | |
| Median | 200 | 161 | 188 | |
| Range | 7–1212 | 24–1171 | 7–1212 | |
| (C) | No split | 30 | 23 | 53 |
| Cohort split | 47 | 29 | 76 | |
| Independent testing | 5 | 6 | 11 | |
| (D) | Cohort split ratio | |||
| 90/10 | 1 | 1 | 2 | |
| 86/14 | 0 | 1 | 1 | |
| 80/20 | 6 | 5 | 11 | |
| 75/25 | 3 | 2 | 5 | |
| 70/30 | 24 | 3 | 27 | |
| 67/33 | 1 | 4 | 5 | |
| 65/35 | 1 | 1 | 2 | |
| 63/37 | 2 | 1 | 3 | |
| 60/40 | 3 | 3 | 6 | |
| 55/45 | 2 | 3 | 5 | |
| 50/50 | 4 | 5 | 9 |
4.3.2. Training and validation
Once patient cohorts are determined and radiomic features are selected, predictive model training is the next step. Some studies generate a weighted radiomic signature prior to incorporating semantic features, which condenses the selected radiomic features into a single term. In these situations, concerns of double‐training should be addressed, as the selected radiomic features are trained on the dataset to determine weighting prior to model training then used again as a radiomic signature during model training. Future considerations should be made to determine if a weighted radiomic signature has adverse effects on model performance compared to the direct use of the selected features.
Once model training is complete, best practice is to perform model validation followed by independent testing using an external dataset to assess model performance outside the training data. Some radiomic studies forgo validation and testing entirely, instead simply presenting the training results in a standalone fashion. This methodology lacks both validation and independent testing and results should be treated with some skepticism. Other studies will perform a validation step using a training and validation dataset originating from the patient cohort, with varying ratios between the two datasets. This is often done as a multiple‐fold cross‐validation that can be used to estimate the fit of the model on new data, but no technique can replace testing with independent datasets. Table 8C characterizes how studies approach validation and testing and shows that 11 of 129 reviewed studies employ independent testing. Table 8D shows that there is no consistency in how patient cohorts are split, though the effects of split ratio on model performance in radiomics are unclear.
Once a model is trained, the performance of the model is reported as results. Currently, there is no standard reporting method in radiomic studies for results when multiple feature selection methods and/or multiple models are used in a study. Some studies opt to only report the best‐performing combination while others display the results from all combinations used. The latter reporting style should be considered as standard in future works as a complete view of how specific methods interact and perform will help future studies choose more optimal techniques.
5. CONCLUSION
Currently, radiomics and deep learning are the most researched techniques in medical imaging. The hand‐crafted radiomic analysis necessitates the use of machine learning or statistical algorithms after feature extraction in order to construct a predictive model. According to our review of existing publications, their performance highly depends on the feature selection methods and prediction models used for the analysis. While efforts have been focused on the standardization of imaging biomarkers by addressing radiomic feature reproducibility and stability, the evaluation and validation of feature selection methods and predictive modeling to strengthen the stability and reproducibility of radiomic features remain a necessity.
The future refinement of radiomics need to investigate those limitations discussed above, including but not limited to feature extraction consistency, feature value harmonization, cohort power, and training/validation best practices. With the improvement of its robustness, radiomic analysis can become an efficient tool for aiding clinicians in risk stratification, prognostics, and patient management.
AUTHOR CONTRIBUTIONS
All listed authors contributed to the literature search and to drafting the manuscript.
CONFLICT OF INTEREST
The authors declare that there is no conflict of interest.
ACKNOWLEDGMENT
None.
Ge G, Zhang J. Feature selection methods and predictive models in CT lung cancer radiomics. J Appl Clin Med Phys. 2023;24:e13869. 10.1002/acm2.13869
REFERENCES
- 1. Lambin P, Rios‐Velazquez E, Leijenaar R, et al. Radiomics: extracting more information from medical images using advanced feature analysis. Eur J Cancer. 2012;48(4):441‐446. [DOI] [PMC free article] [PubMed] [Google Scholar]
- 2. Kim H, Goo JM, Ohno Y, et al. Effect of reconstruction parameters on the quantitative analysis of chest computed tomography. J Thorac Imaging. 2019;34(2):92‐102. [DOI] [PubMed] [Google Scholar]
- 3. Vonder M, Dorrius MD, Vliegenthart R. Latest CT technologies in lung cancer screening: protocols and radiation dose reduction. Transl Lung Cancer Res. 2021;10(2):1154‐1164. [DOI] [PMC free article] [PubMed] [Google Scholar]
- 4. Zhao B. Understanding sources of variation to improve the reproducibility of radiomics. Front Oncol. 2021;11:633176. [DOI] [PMC free article] [PubMed] [Google Scholar]
- 5. Bashir U, Siddique MM, Mclean E, Goh V, Cook GJ. Imaging heterogeneity in lung cancer: techniques, applications, and challenges. AJR Am J Roentgenol. 2016;207(3):534‐543. [DOI] [PubMed] [Google Scholar]
- 6. Binczyk F, Prazuch W, Bozek P, Polanska J. Radiomics and artificial intelligence in lung cancer screening. Transl Lung Cancer Res. 2021;10(2):1186‐1199. [DOI] [PMC free article] [PubMed] [Google Scholar]
- 7. Fornacon‐Wood I, Faivre‐Finn C, O‐Connor JPB, Price GJ. Radiomics as a personalized medicine tool in lung cancer: separating the hope from the hype. Lung Cancer. 2020;146:197‐208. [DOI] [PMC free article] [PubMed] [Google Scholar]
- 8. Gillies RJ, Schabath MB. Radiomics improves cancer screening and early detection. Cancer Epidemiol Biomarkers Prev. 2020;29(12):2556‐2567. [DOI] [PMC free article] [PubMed] [Google Scholar]
- 9. Hochhegger B, Zanon M, Altmayer S, et al. Advances in imaging and automated quantification of malignant pulmonary diseases: a state‐of‐the‐art review. Lung. 2018;196(6):633‐642. [DOI] [PubMed] [Google Scholar]
- 10. Jin JY, Kong FM. Personalized radiation therapy (PRT) for lung cancer. Adv Exp Med Biol. 2016;890:175‐202. [DOI] [PubMed] [Google Scholar]
- 11. Khawaja A, Bartholmai BJ, Rajagopalan S, et al. Do we need to see to believe?‐Radiomics for lung nodule classification and lung cancer risk stratification. J Thorac Dis. 2020;12(6):3303‐3316. [DOI] [PMC free article] [PubMed] [Google Scholar]
- 12. Kim TJ, Kim CH, Lee HY, et al. Management of incidental pulmonary nodules: current strategies and future perspectives. Expert Rev Respir Med. 2020;14(2):173‐194. [DOI] [PubMed] [Google Scholar]
- 13. Lee G, Bak SoH, Lee HoY. CT radiomics in thoracic oncology: technique and clinical applications. Nucl Med Mol Imaging. 2018;52(2):91‐98. [DOI] [PMC free article] [PubMed] [Google Scholar]
- 14. Mattonen SA, Ward AD, Palma DA. Pulmonary imaging after stereotactic radiotherapy‐does RECIST still apply. Br J Radiol. 2016;89(1065):20160113. [DOI] [PMC free article] [PubMed] [Google Scholar]
- 15. Ninatti G, Kirienko M, Neri E, Sollini M, Chiti A. Imaging‐based prediction of molecular therapy targets in NSCLC by radiogenomics and AI approaches: a systematic review. Diagnostics (Basel). 2020;10(6):359. [DOI] [PMC free article] [PubMed] [Google Scholar]
- 16. RodrãGuez MA, Ajona D, Seijo LM, et al. Molecular biomarkers in early stage lung cancer. Transl Lung Cancer Res. 2021;10(2):1165‐1185. [DOI] [PMC free article] [PubMed] [Google Scholar]
- 17. Sollini M, Bartoli F, Marciano A, Zanca R, Slart RHJA, Erba PA. Artificial intelligence and hybrid imaging: the best match for personalized medicine in oncology. Eur J Hybrid Imaging. 2020;4(1):24. [DOI] [PMC free article] [PubMed] [Google Scholar]
- 18. Thawani R, Mclane M, Beig N, et al. Radiomics and radiogenomics in lung cancer: a review for the clinician. Lung Cancer. 2018;115:34‐41. [DOI] [PubMed] [Google Scholar]
- 19. Van Laar M, Van Amsterdam WAC, Van Lindert ASR, De Jong PA, Verhoeff JJC. Prognostic factors for overall survival of stage III non‐small cell lung cancer patients on computed tomography: a systematic review and meta‐analysis. Radiother Oncol. 2020;151:152‐175. [DOI] [PubMed] [Google Scholar]
- 20. Wilson R, Devaraj A. Radiomics of pulmonary nodules and lung cancer. Transl Lung Cancer Res. 2017;6(1):86‐91. [DOI] [PMC free article] [PubMed] [Google Scholar]
- 21. Wong CW, Chaudhry A. Radiogenomics of lung cancer. J Thorac Dis. 2020;12(9):5104‐5109. [DOI] [PMC free article] [PubMed] [Google Scholar]
- 22. Armato SG, Francis RJ, Katz SI, et al. Imaging in pleural mesothelioma: a review of the 14th International Conference of the International Mesothelioma Interest Group. Lung Cancer. 2019;130:108‐114. [DOI] [PMC free article] [PubMed] [Google Scholar]
- 23. Cong M, Yao H, Liu H, Huang L, Shi G. Development and evaluation of a venous computed tomography radiomics model to predict lymph node metastasis from non‐small cell lung cancer. Medicine (Baltimore). 2020;99(18):e20074. [DOI] [PMC free article] [PubMed] [Google Scholar]
- 24. Lee S‐H, Cho HH, Lee HY, Park H. Clinical impact of variability on CT radiomics and suggestions for suitable feature selection: a focus on lung cancer. Cancer Imaging. 2019;19(1):54. [DOI] [PMC free article] [PubMed] [Google Scholar]
- 25. Mei D, Luo Y, Wang Y, Gong J. CT texture analysis of lung adenocarcinoma: can radiomic features be surrogate biomarkers for EGFR mutation statuses. Cancer Imaging. 2018;18(1):52. [DOI] [PMC free article] [PubMed] [Google Scholar]
- 26. Liu G, Xu Z, Ge Y, et al. 3D radiomics predicts EGFR mutation, exon‐19 deletion and exon‐21 L858R mutation in lung adenocarcinoma. Transl Lung Cancer Res. 2020;9(4):1212‐1224. [DOI] [PMC free article] [PubMed] [Google Scholar]
- 27. Huang Q, Lu L, Dercle L. Interobserver variability in tumor contouring affects the use of radiomics to predict mutational status. J Med Imaging (Bellingham). 2018;5(1):011005. [DOI] [PMC free article] [PubMed] [Google Scholar]
- 28. Wu W, Pierce LA, Zhang Y, et al. Comparison of prediction models with radiological semantic features and radiomics in lung cancer diagnosis of the pulmonary nodules: a case‐control study. Eur Radiol. 2019;29(11):6100‐6108. [DOI] [PMC free article] [PubMed] [Google Scholar]
- 29. Zhang T, Xu Z, Liu G, et al. Simultaneous identification of EGFR,KRAS,ERBB2, and TP53 mutations in patients with non‐small cell lung cancer by machine learning‐derived three‐dimensional radiomics. Cancers (Basel). 2021;13(8):1814. [DOI] [PMC free article] [PubMed] [Google Scholar]
- 30. Ramella S, Fiore M, Greco C, et al. A radiomic approach for adaptive radiotherapy in non‐small cell lung cancer patients. PLoS One. 2018;13(11):e0207455. [DOI] [PMC free article] [PubMed] [Google Scholar]
- 31. Cong M, Feng H, Ren J‐L, et al. Development of a predictive radiomics model for lymph node metastases in pre‐surgical CT‐based stage IA non‐small cell lung cancer. Lung Cancer. 2020;139:73‐79. [DOI] [PubMed] [Google Scholar]
- 32. Liu Q, Huang Y, Chen H, Liu Y, Liang R, Zeng Q. The development and validation of a radiomic nomogram for the preoperative prediction of lung adenocarcinoma. BMC Cancer. 2020;20(1):533. [DOI] [PMC free article] [PubMed] [Google Scholar]
- 33. Choi W, Oh JH, Riyahi S, et al. Radiomics analysis of pulmonary nodules in low‐dose CT for early detection of lung cancer. Med Phys. 2018;45(4):1537‐1549. [DOI] [PMC free article] [PubMed] [Google Scholar]
- 34. Lu H, Mu W, Balagurunathan Y, et al. Multi‐window CT based Radiomic signatures in differentiating indolent versus aggressive lung cancers in the National Lung Screening Trial: a retrospective study. Cancer Imaging. 2019;19(1):45. [DOI] [PMC free article] [PubMed] [Google Scholar]
- 35. Bak SoH, Park H, Lee HoY, et al. Imaging genotyping of functional signaling pathways in lung squamous cell carcinoma using a radiomics approach. Sci Rep. 2018;8(1):3284. [DOI] [PMC free article] [PubMed] [Google Scholar]
- 36. Dang Y, Wang R, Qian K, Lu J, Zhang H, Zhang Yi. Clinical and radiological predictors of epidermal growth factor receptor mutation in nonsmall cell lung cancer. J Appl Clin Med Phys. 2021;22(1):271‐280. [DOI] [PMC free article] [PubMed] [Google Scholar]
- 37. Sun F, Chen Y, Chen X, Sun X, Xing L. CT‐based radiomics for predicting brain metastases as the first failure in patients with curatively resected locally advanced non‐small cell lung cancer. Eur J Radiol. 2021;134:109411. [DOI] [PubMed] [Google Scholar]
- 38. Gu Q, Feng Z, Hu X, et al. Radiomics in predicting tumor molecular marker P63 for non‐small cell lung cancer. Zhong Nan Da Xue Bao Yi Xue Ban. 2019;44(9):1055‐1062. [DOI] [PubMed] [Google Scholar]
- 39. Liu Y, Kim J, Balagurunathan Y, et al. Radiomic features are associated with EGFR mutation status in lung adenocarcinomas. Clin Lung Cancer. 2016;17(5):441‐448.e6. [DOI] [PMC free article] [PubMed] [Google Scholar]
- 40. Yoon J, Suh YJ, Han K, et al. Utility of CT radiomics for prediction of PD‐L1 expression in advanced lung adenocarcinomas. Thorac Cancer. 2020;11(4):993‐1004. [DOI] [PMC free article] [PubMed] [Google Scholar]
- 41. He Bo, Zhao W, Pi J‐Y, et al. A biomarker basing on radiomics for the prediction of overall survival in non‐small cell lung cancer patients. Respir Res. 2018;19(1):199. [DOI] [PMC free article] [PubMed] [Google Scholar]
- 42. E L, Lu L, Li L, Yang H, Schwartz LH, Zhao B. Radiomics for classifying histological subtypes of lung cancer based on multiphasic contrast‐enhanced computed tomography. J Comput Assist Tomogr. 2019;43(2):300‐306. [DOI] [PMC free article] [PubMed] [Google Scholar]
- 43. Alvarez‐Jimenez C, Sandino AA, Prasanna P, Gupta A, Viswanath SE, Romero E. Identifying cross‐scale associations between radiomic and pathomic signatures of non‐small cell lung cancer subtypes: preliminary results. Cancers (Basel). 2020;12(12):3663. [DOI] [PMC free article] [PubMed] [Google Scholar]
- 44. Li Y, Lu L, Xiao M, et al. CT slice thickness and convolution kernel affect performance of a radiomic model for predicting EGFR status in non‐small cell lung cancer: a preliminary study. Sci Rep. 2018;8(1):17913. [DOI] [PMC free article] [PubMed] [Google Scholar]
- 45. Chen A, Lu L, Pu X, et al. CT‐based radiomics model for predicting brain metastasis in category T1 lung adenocarcinoma. AJR Am J Roentgenol. 2019;213(1):134‐139. [DOI] [PubMed] [Google Scholar]
- 46. Sha X, Gong G, Qiu Q, Duan J, Li D, Yin Y. Discrimination of mediastinal metastatic lymph nodes in NSCLC based on radiomic features in different phases of CT imaging. BMC Med Imaging. 2020;20(1):12. [DOI] [PMC free article] [PubMed] [Google Scholar]
- 47. Ni XQ, Yin HK, Fan GH, Shi D, Xu L, Jin D. Differentiation of pulmonary sclerosing pneumocytoma from solid malignant pulmonary nodules by radiomic analysis on multiphasic CT. J Appl Clin Med Phys. 2021;22(2):158‐164. [DOI] [PMC free article] [PubMed] [Google Scholar]
- 48. Rios Velazquez E, Parmar C, Liu Y, et al. Somatic mutations drive distinct imaging phenotypes in lung cancer. Cancer Res. 2017;77(14):3922‐3930. [DOI] [PMC free article] [PubMed] [Google Scholar]
- 49. Alilou M, Prasanna P, Bera K, et al. A novel nodule edge sharpness radiomic biomarker improves performance of lung‐RADS for distinguishing adenocarcinomas from granulomas on non‐contrast CT scans. Cancers (Basel). 2021;13(11):2781. [DOI] [PMC free article] [PubMed] [Google Scholar]
- 50. Wu Y‐J, Liu Y‐C, Liao C‐Y, Tang E‐K, Wu F‐Z. A comparative study to evaluate CT‐based semantic and radiomic features in preoperative diagnosis of invasive pulmonary adenocarcinomas manifesting as subsolid nodules. Sci Rep. 2021;11(1):66. [DOI] [PMC free article] [PubMed] [Google Scholar]
- 51. Shakir H, Khan T, Rasheed H, Deng Y. Radiomics based Bayesian inversion method for prediction of cancer and pathological stage. IEEE J Transl Eng Health Med. 2021;9:4300208. [DOI] [PMC free article] [PubMed] [Google Scholar]
- 52. Luo T, Xu Ke, Zhang Z, Zhang L, Wu S. Radiomic features from computed tomography to differentiate invasive pulmonary adenocarcinomas from non‐invasive pulmonary adenocarcinomas appearing as part‐solid ground‐glass nodules. Chin J Cancer Res. 2019;31(2):329‐338. [DOI] [PMC free article] [PubMed] [Google Scholar]
- 53. Sun Y, Li C, Jin L, et al. Radiomics for lung adenocarcinoma manifesting as pure ground‐glass nodules: invasive prediction. Eur Radiol. 2020;30(7):3650‐3659. [DOI] [PMC free article] [PubMed] [Google Scholar]
- 54. Liu S, Liu S, Zhang C, et al. Exploratory study of a CT radiomics model for the classification of small cell lung cancer and non‐small‐cell lung cancer. Front Oncol. 2020;10:1268. [DOI] [PMC free article] [PubMed] [Google Scholar]
- 55. Liu H, Jiao Z, Han W, Jing B. Identifying the histologic subtypes of non‐small cell lung cancer with computed tomography imaging: a comparative study of capsule net, convolutional neural network, and radiomics. Quant Imaging Med Surg. 2021;11(6):2756‐2765. [DOI] [PMC free article] [PubMed] [Google Scholar]
- 56. Ran J, Cao R, Cai J, Yu T, Zhao D, Wang Z. Development and validation of a nomogram for preoperative prediction of lymph node metastasis in lung adenocarcinoma based on radiomics signature and deep learning signature. Front Oncol. 2021;11:585942. [DOI] [PMC free article] [PubMed] [Google Scholar]
- 57. Wu G, Woodruff HC, Sanduleanu S, et al. Preoperative CT‐based radiomics combined with intraoperative frozen section is predictive of invasive adenocarcinoma in pulmonary nodules: a multicenter study. Eur Radiol. 2020;30(5):2680‐2691. [DOI] [PMC free article] [PubMed] [Google Scholar]
- 58. Ninomiya K, Arimura H, Chan WY, et al. Robust radiogenomics approach to the identification of EGFR mutations among patients with NSCLC from three different countries using topologically invariant Betti numbers. PLoS One. 2021;16(1):e0244354. [DOI] [PMC free article] [PubMed] [Google Scholar]
- 59. Shakir H, et al. Radiomics based likelihood functions for cancer diagnosis. Sci Rep. 2019;9(1):9501. [DOI] [PMC free article] [PubMed] [Google Scholar]
- 60. Wang X, Li Q, Cai J, et al. Predicting the invasiveness of lung adenocarcinomas appearing as ground‐glass nodule on CT scan using multi‐task learning and deep radiomics. Transl Lung Cancer Res. 2020;9(4):1397‐1406. [DOI] [PMC free article] [PubMed] [Google Scholar]
- 61. Zhao W, Xu Y, Yang Z, et al. Development and validation of a radiomics nomogram for identifying invasiveness of pulmonary adenocarcinomas appearing as subcentimeter ground‐glass opacity nodules. Eur J Radiol. 2019;112:161‐168. [DOI] [PubMed] [Google Scholar]
- 62. Hou D, Li W, Wang S, et al. Different Clinicopathologic and computed tomography imaging characteristics of primary and acquired EGFR T790M mutations in patients with non‐small‐cell lung cancer. Cancer Manag Res. 2021;13:6389‐6401. [DOI] [PMC free article] [PubMed] [Google Scholar]
- 63. Jiang Y, Che S, Ma S, et al. Radiomic signature based on CT imaging to distinguish invasive adenocarcinoma from minimally invasive adenocarcinoma in pure ground‐glass nodules with pleural contact. Cancer Imaging. 2021;21(1):1. [DOI] [PMC free article] [PubMed] [Google Scholar]
- 64. Wen Q, Yang Z, Dai H, Feng A, Li Q. Radiomics study for predicting the expression of PD‐L1 and tumor mutation burden in non‐small cell lung cancer based on CT images and clinicopathological features. Front Oncol. 2021;11:620246. [DOI] [PMC free article] [PubMed] [Google Scholar]
- 65. Xu Y, Lu L, E LN, et al. Application of radiomics in predicting the malignancy of pulmonary nodules in different sizes. AJR Am J Roentgenol. 2019;213(6):1213‐1220. [DOI] [PubMed] [Google Scholar]
- 66. Yang X, Dong X, Wang J, et al. Computed tomography‐based radiomics signature: a potential indicator of epidermal growth factor receptor mutation in pulmonary adenocarcinoma appearing as a subsolid nodule. Oncologist. 2019;24(11):e1156‐e1164. [DOI] [PMC free article] [PubMed] [Google Scholar]
- 67. Yang B, Guo L, Lu G, Shan W, Duan L, Duan S. Radiomic signature: a non‐invasive biomarker for discriminating invasive and non‐invasive cases of lung adenocarcinoma. Cancer Manag Res. 2019;11:7825‐7834. [DOI] [PMC free article] [PubMed] [Google Scholar]
- 68. Bracci S, Dolciami M, Trobiani C, et al. Quantitative CT texture analysis in predicting PD‐L1 expression in locally advanced or metastatic NSCLC patients. Radiol Med. 2021:1425‐1433. [DOI] [PMC free article] [PubMed] [Google Scholar]
- 69. Shi L, Shi W, Peng X, et al. Development and validation a nomogram incorporating CT radiomics signatures and radiological features for differentiating invasive adenocarcinoma from adenocarcinoma in situ and minimally invasive adenocarcinoma presenting as ground‐glass nodules measuring 5‐10 mm in diameter. Front Oncol. 2021;11:618677. [DOI] [PMC free article] [PubMed] [Google Scholar]
- 70. Aerts HJWL, Grossmann P, Tan Y, et al. Defining a radiomic response phenotype: a Pilot Study using targeted therapy in NSCLC. Sci Rep. 2016;6:33860. [DOI] [PMC free article] [PubMed] [Google Scholar]
- 71. Liu J, Xu H, Qing H, Li Y, et al. Comparison of radiomic models based on low‐dose and standard‐dose CT for prediction of adenocarcinomas and benign lesions in solid pulmonary nodules. Front Oncol. 2020;10:634298. [DOI] [PMC free article] [PubMed] [Google Scholar]
- 72. Xu Y, Ji W, Hou L, et al. Enhanced CT‐based radiomics to predict micropapillary pattern within lung invasive adenocarcinoma. Front Oncol. 2021;11:704994. [DOI] [PMC free article] [PubMed] [Google Scholar]
- 73. Xiong Z, Jiang Y, Che S, et al. Use of CT radiomics to differentiate minimally invasive adenocarcinomas and invasive adenocarcinomas presenting as pure ground‐glass nodules larger than 10 mm. Eur J Radiol. 2021;141:109772. [DOI] [PubMed] [Google Scholar]
- 74. Bashir U, Kawa B, Siddique M. Non‐invasive classification of non‐small cell lung cancer: a comparison between random forest models utilising radiomic and semantic features. Br J Radiol. 2019;92(1099):20190159. [DOI] [PMC free article] [PubMed] [Google Scholar]
- 75. He B, Song Y, Wang L, et al. A machine learning‐based prediction of the micropapillary/solid growth pattern in invasive lung adenocarcinoma with radiomics. Transl Lung Cancer Res. 2021;10(2):955‐964. [DOI] [PMC free article] [PubMed] [Google Scholar]
- 76. Alilou M, Beig N, Orooji M, et al. An integrated segmentation and shape‐based classification scheme for distinguishing adenocarcinomas from granulomas on lung CT. Med Phys. 2017;44(7):3556‐3569. [DOI] [PMC free article] [PubMed] [Google Scholar]
- 77. Kim H, Park CM, Gwak J, et al. Effect of CT reconstruction algorithm on the diagnostic performance of radiomics models: a task‐based approach for pulmonary subsolid nodules. AJR Am J Roentgenol. 2019;212(3):505‐512. [DOI] [PubMed] [Google Scholar]
- 78. Cui E‐N, Yu T, Shang S‐J, et al. Radiomics model for distinguishing tuberculosis and lung cancer on computed tomography scans. World J Clin Cases. 2020;8(21):5203‐5212. [DOI] [PMC free article] [PubMed] [Google Scholar]
- 79. Xu X, Huang L, Chen J, et al. Application of radiomics signature captured from pretreatment thoracic CT to predict brain metastases in stage III/IV ALK‐positive non‐small cell lung cancer patients. J Thorac Dis. 2019;11(11):4516‐4528. [DOI] [PMC free article] [PubMed] [Google Scholar]
- 80. Chen X, Feng B, Chen Y, et al. A CT‐based radiomics nomogram for prediction of lung adenocarcinomas and granulomatous lesions in patient with solitary sub‐centimeter solid nodules. Cancer Imaging. 2020;20(1):45. [DOI] [PMC free article] [PubMed] [Google Scholar]
- 81. Orooji M, Alilou M, Rakshit S, et al. Combination of computer extracted shape and texture features enables discrimination of granulomas from adenocarcinoma on chest computed tomography. J Med Imaging (Bellingham). 2018;5(2):024501. [DOI] [PMC free article] [PubMed] [Google Scholar]
- 82. Weng Q, Zhou L, Wang H, et al. A radiomics model for determining the invasiveness of solitary pulmonary nodules that manifest as part‐solid nodules. Clin Radiol. 2019;74(12):933‐943. [DOI] [PubMed] [Google Scholar]
- 83. Yan M, Wang W. A non‐invasive method to diagnose lung adenocarcinoma. Front Oncol. 2020;10:602. [DOI] [PMC free article] [PubMed] [Google Scholar]
- 84. Dou TH, Coroller TP, Van Griethuysen JJM, Mak RH, Aerts HJWL. Peritumoral radiomics features predict distant metastasis in locally advanced NSCLC. PLoS One. 2018;13(11):e0206108. [DOI] [PMC free article] [PubMed] [Google Scholar]
- 85. Weng Q, Hui J, Wang H, et al. Radiomic feature‐based nomogram: a novel technique to predict EGFR‐activating mutations for EGFR tyrosin kinase inhibitor therapy. Front Oncol. 2021;11:590937. [DOI] [PMC free article] [PubMed] [Google Scholar]
- 86. Wu W, Parmar C, Grossmann P, et al. Exploratory study to identify radiomics classifiers for lung cancer histology. Front Oncol. 2016;6:71. [DOI] [PMC free article] [PubMed] [Google Scholar]
- 87. Vaidya P, Bera K, Patil PD, et al. Novel, non‐invasive imaging approach to identify patients with advanced non‐small cell lung cancer at risk of hyperprogressive disease with immune checkpoint blockade. J Immunother Cancer. 2020;8(2):e001343. [DOI] [PMC free article] [PubMed] [Google Scholar]
- 88. Mao L, Chen H, Liang M, et al. Quantitative radiomic model for predicting malignancy of small solid pulmonary nodules detected by low‐dose CT screening. Quant Imaging Med Surg. 2019;9(2):263‐272. [DOI] [PMC free article] [PubMed] [Google Scholar]
- 89. Song L, Zhu Z, Mao Li, et al. Clinical, conventional CT and radiomic feature‐based machine learning models for predicting ALK rearrangement status in lung adenocarcinoma patients. Front Oncol. 2020;10:369. [DOI] [PMC free article] [PubMed] [Google Scholar]
- 90. Wu S, Shen G, Mao J, Gao Bo. CT radiomics in predicting EGFR mutation in non‐small cell lung cancer: a single institutional study. Front Oncol. 2020;10:542957. [DOI] [PMC free article] [PubMed] [Google Scholar]
- 91. Beig N, Khorrami M, Alilou M, et al. Perinodular and intranodular radiomic features on lung CT images distinguish adenocarcinomas from granulomas. Radiology. 2019;290(3):783‐792. [DOI] [PMC free article] [PubMed] [Google Scholar]
- 92. Yang M, She Y, Deng J, et al. CT‐based radiomics signature for the stratification of N2 disease risk in clinical stage I lung adenocarcinoma. Transl Lung Cancer Res. 2019;8(6):876‐885. [DOI] [PMC free article] [PubMed] [Google Scholar]
- 93. Xu F, Zhu W, Shen Y, et al. Radiomic‐based quantitative CT analysis of pure ground‐glass nodules to predict the invasiveness of lung adenocarcinoma. Front Oncol. 2020;10:872. [DOI] [PMC free article] [PubMed] [Google Scholar]
- 94. Padole A, Singh R, Zhang EW, et al. Radiomic features of primary tumor by lung cancer stage: analysis in BRAF mutated non‐small cell lung cancer. Transl Lung Cancer Res. 2020;9(4):1441‐1451. [DOI] [PMC free article] [PubMed] [Google Scholar]
- 95. Liu A, Wang Z, Yang Y, et al. Preoperative diagnosis of malignant pulmonary nodules in lung cancer screening with a radiomics nomogram. Cancer Commun (Lond). 2020;40(1):16‐24. [DOI] [PMC free article] [PubMed] [Google Scholar]
- 96. Ma D‐N, Gao X‐Y, Dan Y‐B, et al. Evaluating solid lung adenocarcinoma anaplastic lymphoma kinase gene rearrangement using noninvasive radiomics biomarkers. Onco Targets Ther. 2020;13:6927‐6935. [DOI] [PMC free article] [PubMed] [Google Scholar]
- 97. Zhou H, Dong Di, Chen B, et al. Diagnosis of distant metastasis of lung cancer: based on clinical and radiomic features. Transl Oncol. 2018;11(1):31‐36. [DOI] [PMC free article] [PubMed] [Google Scholar]
- 98. Cucchiara F, Del Re M, Valleggi S, et al. Integrating liquid biopsy and radiomics to monitor clonal heterogeneity of EGFR‐positive non‐small cell lung cancer. Front Oncol. 2020;10:593831. [DOI] [PMC free article] [PubMed] [Google Scholar]
- 99. Liu Y, Kim J, Balagurunathan Y, et al. Prediction of pathological nodal involvement by CT‐based Radiomic features of the primary tumor in patients with clinically node‐negative peripheral lung adenocarcinomas. Med Phys. 2018;45(6):2518‐2526. [DOI] [PMC free article] [PubMed] [Google Scholar]
- 100. Avanzo M, Gagliardi V, Stancanello J, et al. Combining computed tomography and biologically effective dose in radiomics and deep learning improves prediction of tumor response to robotic lung stereotactic body radiation therapy. Med Phys. 2021;48:6257‐6269. [DOI] [PMC free article] [PubMed] [Google Scholar]
- 101. Botta F, Raimondi S, Rinaldi L, et al. Association of a CT‐based clinical and radiomics score of non‐small cell lung cancer (NSCLC) with lymph node status and overall survival. Cancers (Basel). 2020;12(6):1432. [DOI] [PMC free article] [PubMed] [Google Scholar]
- 102. Bousabarah K, Blanck O, Temming S, et al. Radiomics for prediction of radiation‐induced lung injury and oncologic outcome after robotic stereotactic body radiotherapy of lung cancer: results from two independent institutions. Radiat Oncol. 2021;16(1):74. [DOI] [PMC free article] [PubMed] [Google Scholar]
- 103. Chang R, Qi S, Yue Y, Zhang X, Song J, Qian W. Predictive radiomic models for the chemotherapy response in non‐small‐cell lung cancer based on computerized‐tomography images. Front Oncol. 2021;11:646190. [DOI] [PMC free article] [PubMed] [Google Scholar]
- 104. Cherezov D, Qi S, Yue Y, Zhang X, Song J, Qian W. Improving malignancy prediction through feature selection informed by nodule size ranges in NLST. Conf Proc IEEE Int Conf Syst Man Cybern. 2016;2016:001939‐1944. [DOI] [PMC free article] [PubMed] [Google Scholar]
- 105. Coroller TP, Grossmann P, Hou Y, et al. CT‐based radiomic signature predicts distant metastasis in lung adenocarcinoma. Radiother Oncol. 2015;114(3):345‐350. [DOI] [PMC free article] [PubMed] [Google Scholar]
- 106. Dercle L, Fronheiser M, Lu L, et al. Identification of non‐small cell lung cancer sensitive to systemic cancer therapies using radiomics. Clin Cancer Res. 2020;26(9):2151‐2162. [DOI] [PMC free article] [PubMed] [Google Scholar]
- 107. Gkika E, Benndorf M, Oerther B, et al. Immunohistochemistry and radiomic features for survival prediction in small cell lung cancer. Front Oncol. 2020;10:1161. [DOI] [PMC free article] [PubMed] [Google Scholar]
- 108. Granata V, Fusco R, Costa M, et al. Preliminary report on computed tomography radiomics features as biomarkers to immunotherapy selection in lung adenocarcinoma patients. Cancers (Basel). 2021;13(16):3992. [DOI] [PMC free article] [PubMed] [Google Scholar]
- 109. He L, Huang Y, Yan L, Zheng J, Liang C, Liu Z. Radiomics‐based predictive risk score: a scoring system for preoperatively predicting risk of lymph node metastasis in patients with resectable non‐small cell lung cancer. Chin J Cancer Res. 2019;31(4):641‐652. [DOI] [PMC free article] [PubMed] [Google Scholar]
- 110. Hirose T‐A, Arimura H, Ninomiya K, Yoshitake T, Fukunaga J‐I, Shioyama Y. Radiomic prediction of radiation pneumonitis on pretreatment planning computed tomography images prior to lung cancer stereotactic body radiation therapy. Sci Rep. 2020;10(1):20424. [DOI] [PMC free article] [PubMed] [Google Scholar]
- 111. Hou D, Zheng X, Song W, et al. Association of anaplastic lymphoma kinase variants and alterations with ensartinib response duration in non‐small cell lung cancer. Thorac Cancer. 2021;12(17):2388‐2399. [DOI] [PMC free article] [PubMed] [Google Scholar]
- 112. Huynh E, Coroller TP, Narayan V, et al. Associations of radiomic data extracted from static and respiratory‐gated CT Scans with disease recurrence in lung cancer patients treated with SBRT. PLoS One. 2017;12(1):e0169172. [DOI] [PMC free article] [PubMed] [Google Scholar]
- 113. Kakino R, Nakamura M, Mitsuyoshi T, et al. Application and limitation of radiomics approach to prognostic prediction for lung stereotactic body radiotherapy using breath‐hold CT images with random survival forest: a multi‐institutional study. Med Phys. 2020;47(9):4634‐4643. [DOI] [PubMed] [Google Scholar]
- 114. Khorrami M, Bera K, Leo P, et al. Stable and discriminating radiomic predictor of recurrence in early stage non‐small cell lung cancer: multi‐site study. Lung Cancer. 2020;142:90‐97. [DOI] [PMC free article] [PubMed] [Google Scholar]
- 115. Khorrami M, Jain P, Bera K, et al. Predicting pathologic response to neoadjuvant chemoradiation in resectable stage III non‐small cell lung cancer patients using computed tomography radiomic features. Lung Cancer. 2019;135:1‐9. [DOI] [PMC free article] [PubMed] [Google Scholar]
- 116. Khorrami M, Khunger M, Zagouras A, et al. Combination of peri‐ and intratumoral radiomic features on baseline CT scans predicts response to chemotherapy in lung adenocarcinoma. Radiol Artif Intell. 2019;1(2):180012. [DOI] [PMC free article] [PubMed] [Google Scholar]
- 117. Khorrami M, Prasanna P, Gupta A, et al. Changes in CT radiomic features associated with lymphocyte distribution predict overall survival and response to immunotherapy in non‐small cell lung cancer. Cancer Immunol Res. 2020;8(1):108‐119. [DOI] [PMC free article] [PubMed] [Google Scholar]
- 118. Kim H, Park CM, Keam B, et al. The prognostic value of CT radiomic features for patients with pulmonary adenocarcinoma treated with EGFR tyrosine kinase inhibitors. PLoS One. 2017;12(11):e0187500. [DOI] [PMC free article] [PubMed] [Google Scholar]
- 119. Kim KiH, Kim J, Park H, et al. Parallel comparison and combining effect of radiomic and emerging genomic data for prognostic stratification of non‐small cell lung carcinoma patients. Thorac Cancer. 2020;11(9):2542‐2551. [DOI] [PMC free article] [PubMed] [Google Scholar]
- 120. Kinsey CM, Estépar RSJ, Bates JHT, et al. Tumor density is associated with response to endobronchial ultrasound‐guided transbronchial needle injection of cisplatin. J Thorac Dis. 2020;12(9):4825‐4832. [DOI] [PMC free article] [PubMed] [Google Scholar]
- 121. Lafata KJ, Corradetti MN, Gao J, et al. Radiogenomic analysis of locally advanced lung cancer based on CT imaging and intratreatment changes in cell‐free DNA. Radiol Imaging Cancer. 2021;3(4):e200157. [DOI] [PMC free article] [PubMed] [Google Scholar]
- 122. Le V‐H, Kha Q‐H, Hung TNK, Le NQK. Risk score generated from CT‐based radiomics signatures for overall survival prediction in non‐small cell lung cancer. Cancers (Basel). 2021;13(14):3616. [DOI] [PMC free article] [PubMed] [Google Scholar]
- 123. Li H, Zhang R, Wang S, et al. CT‐based radiomic signature as a prognostic factor in stage IV ALK‐positive non‐small‐cell lung cancer treated with TKI Crizotinib: a proof‐of‐concept study. Front Oncol. 2020;10:57. [DOI] [PMC free article] [PubMed] [Google Scholar]
- 124. Li Q, Kim J, Balagurunathan Y, et al. CT imaging features associated with recurrence in non‐small cell lung cancer patients after stereotactic body radiotherapy. Radiat Oncol. 2017;12(1):158. [DOI] [PMC free article] [PubMed] [Google Scholar]
- 125. Liu C, Gong J, Yu H, Liu Q, Wang S, Wang J. A CT‐based radiomics approach to predict nivolumab response in advanced non‐small‐cell lung cancer. Front Oncol. 2021;11:544339. [DOI] [PMC free article] [PubMed] [Google Scholar]
- 126. Liu Y, Wu M, Zhang Y, et al. Imaging biomarkers to predict and evaluate the effectiveness of immunotherapy in advanced non‐small‐cell lung cancer. Front Oncol. 2021;11:657615. [DOI] [PMC free article] [PubMed] [Google Scholar]
- 127. Nardone V, Tini P, Pastina P, et al. Radiomics predicts survival of patients with advanced non‐small cell lung cancer undergoing PD‐1 blockade using Nivolumab. Oncol Lett. 2020;19(2):1559‐1566. [DOI] [PMC free article] [PubMed] [Google Scholar]
- 128. Parmar C, Grossmann P, Bussink J, Lambin P, Aerts HJWL. Machine learning methods for quantitative radiomic biomarkers. Sci Rep. 2015;5:13087. [DOI] [PMC free article] [PubMed] [Google Scholar]
- 129. Shayesteh SP, Shiri I, Karami AH, et al. Predicting lung cancer patients' survival time via logistic regression‐based models in a quantitative radiomic framework. J Biomed Phys Eng. 2020;10(4):479‐492. [DOI] [PMC free article] [PubMed] [Google Scholar]
- 130. Shen C, Liu Z, Guan M, et al. 2D and 3D CT radiomics features prognostic performance comparison in non‐small cell lung cancer. Transl Oncol. 2017;10(6):886‐894. [DOI] [PMC free article] [PubMed] [Google Scholar]
- 131. Shen L, Fu H, Tao G, Liu X, Yuan Z, Ye X. Pre‐Immunotherapy contrast‐enhanced CT texture‐based classification: a useful approach to non‐small cell lung cancer immunotherapy efficacy prediction. Front Oncol. 2021;11:591106. [DOI] [PMC free article] [PubMed] [Google Scholar]
- 132. Sugai Y, Kadoya N, Tanaka S, et al. Impact of feature selection methods and subgroup factors on prognostic analysis with CT‐based radiomics in non‐small cell lung cancer patients. Radiat Oncol. 2021;16(1):80. [DOI] [PMC free article] [PubMed] [Google Scholar]
- 133. Sun W, Jiang M, Dang J, Chang P, Yin F‐F. Effect of machine learning methods on predicting NSCLC overall survival time based on Radiomics analysis. Radiat Oncol. 2018;13(1):197. [DOI] [PMC free article] [PubMed] [Google Scholar]
- 134. Tunali I, Stringfield O, Guvenis A, et al. Radial gradient and radial deviation radiomic features from pre‐surgical CT scans are associated with survival among lung adenocarcinoma patients. Oncotarget. 2017;8(56):96013‐96026. [DOI] [PMC free article] [PubMed] [Google Scholar]
- 135. Vaidya P, Bera K, Gupta A, et al. CT derived radiomic score for predicting the added benefit of adjuvant chemotherapy following surgery in stage I. Lancet Digit Health. 2020;2(3):e116‐e128. [DOI] [PubMed] [Google Scholar]
- 136. Van Timmeren JE, Leijenaar RTH, Van Elmpt W, et al. Survival prediction of non‐small cell lung cancer patients using radiomics analyses of cone‐beam CT images. Radiother Oncol. 2017;123(3):363‐369. [DOI] [PubMed] [Google Scholar]
- 137. Van Timmeren JE, Van Elmpt W, Leijenaar RTH, et al. Longitudinal radiomics of cone‐beam CT images from non‐small cell lung cancer patients: evaluation of the added prognostic value for overall survival and locoregional recurrence. Radiother Oncol. 2019;136:78‐85. [DOI] [PMC free article] [PubMed] [Google Scholar]
- 138. Xia X, Gong J, Hao W, et al. Comparison and fusion of deep learning and radiomics features of ground‐glass nodules to predict the invasiveness risk of stage‐i lung adenocarcinomas in CT scan. Front Oncol. 2020;10:418. [DOI] [PMC free article] [PubMed] [Google Scholar]
- 139. Xie D, Wang T‐T, Huang S‐J, et al. Radiomics nomogram for prediction disease‐free survival and adjuvant chemotherapy benefits in patients with resected stage I lung adenocarcinoma. Transl Lung Cancer Res. 2020;9(4):1112‐1123. [DOI] [PMC free article] [PubMed] [Google Scholar]
- 140. Yan M, Wang W. Radiomic analysis of CT predicts tumor response in human lung cancer with radiotherapy. J Digit Imaging. 2020;33(6):1401‐1403. [DOI] [PMC free article] [PubMed] [Google Scholar]
- 141. Yan M, Wang W. A radiomics model of predicting tumor volume change of patients with stage III non‐small cell lung cancer after radiotherapy. Sci Prog. 2021;104(1):003685042199729. [DOI] [PMC free article] [PubMed] [Google Scholar]
- 142. Yang B, Zhou Li, Zhong J, et al. Combination of computed tomography imaging‐based radiomics and clinicopathological characteristics for predicting the clinical benefits of immune checkpoint inhibitors in lung cancer. Respir Res. 2021;22(1):189. [DOI] [PMC free article] [PubMed] [Google Scholar]
- 143. Yang X, Pan X, Liu H, et al. A new approach to predict lymph node metastasis in solid lung adenocarcinoma: a radiomics nomogram. J Thorac Dis. 2018;10(suppl 7):S807‐S819. [DOI] [PMC free article] [PubMed] [Google Scholar]
- 144. Yoshioka T, Uchiyama Y, Shiraishi J. Radiomics for estimating recurrence risk of patients with lung cancer by using survival analysis. Nihon Hoshasen Gijutsu Gakkai Zasshi. 2021;77(2):153‐159. [DOI] [PubMed] [Google Scholar]
- 145. Yu L, Tao G, Zhu L, et al. Prediction of pathologic stage in non‐small cell lung cancer using machine learning algorithm based on CT image feature analysis. BMC Cancer. 2019;19(1):464. [DOI] [PMC free article] [PubMed] [Google Scholar]
- 146. Yuan M, Liu J‐Y, Zhang T, Zhang Y‐D, Li H, Yu T‐Fu. Prognostic impact of the findings on thin‐section computed tomography in stage I lung adenocarcinoma with visceral pleural invasion. Sci Rep. 2018;8(1):4743. [DOI] [PMC free article] [PubMed] [Google Scholar]
- 147. Zhang G, Cao Y, Zhang J, et al. Predicting EGFR mutation status in lung adenocarcinoma: development and validation of a computed tomography‐based radiomics signature. Am J Cancer Res. 2021;11(2):546‐560. [PMC free article] [PubMed] [Google Scholar]
- 148. Zhang L, Chen B, Liu X, et al. Quantitative biomarkers for prediction of epidermal growth factor receptor mutation in non‐small cell lung cancer. Transl Oncol. 2018;11(1):94‐101. [DOI] [PMC free article] [PubMed] [Google Scholar]
- 149. Zhang R, Sun H, Chen B, Xu R, Li W. Developing of risk models for small solid and subsolid pulmonary nodules based on clinical and quantitative radiomics features. J Thorac Dis. 2021;13(7):4156‐4168. [DOI] [PMC free article] [PubMed] [Google Scholar]
- 150. Zhang Y, Oikonomou A, Wong A, Haider MA, Khalvati F. Radiomics‐based prognosis analysis for non‐small cell lung cancer. Sci Rep. 2017;7:46349. [DOI] [PMC free article] [PubMed] [Google Scholar]
- 151. Zhong Y, Yuan M, Zhang T, Zhang Y‐D, Li H, Yu T‐F. Radiomics approach to prediction of occult mediastinal lymph node metastasis of lung adenocarcinoma. AJR Am J Roentgenol. 2018;211(1):109‐113. [DOI] [PubMed] [Google Scholar]
- 152. Saeys Y, Inza I, Larranaga P. A review of feature selection techniques in bioinformatics. Bioinformatics. 2007;23(19):2507‐2517. [DOI] [PubMed] [Google Scholar]
- 153. Ding C, Peng H. Minimum redundancy feature selection from microarray gene expression data. J Bioinform Comput Biol. 2005;3(2):185‐205. [DOI] [PubMed] [Google Scholar]
- 154. Foy JJ, Robinson KR, Li H, Giger ML, Al‐Hallaq H, Armato SG. Variation in algorithm implementation across radiomics software. J Med Imaging (Bellingham, Wash). 2018;5(4):044505. [DOI] [PMC free article] [PubMed] [Google Scholar]
- 155. Korte JC, Cardenas C, Hardcastle N, et al. Radiomics feature stability of open‐source software evaluated on apparent diffusion coefficient maps in head and neck cancer. Sci Rep. 2021;11(1):17633‐17633. [DOI] [PMC free article] [PubMed] [Google Scholar]
- 156. Zwanenburg A, Valliã¨Res M, Abdalah MA, et al. The image biomarker standardization initiative: standardized quantitative radiomics for high‐throughput image‐based phenotyping. Radiology. 2020;295(2):328‐338. [DOI] [PMC free article] [PubMed] [Google Scholar]
- 157. Fave X, Mackin D, Yang J, et al. Can radiomics features be reproducibly measured from CBCT images for patients with non‐small cell lung cancer. Med Phys. 2015;42(12):6784‐6797. [DOI] [PMC free article] [PubMed] [Google Scholar]
- 158. Haarburger C, MüLler‐Franzes G, Weninger L, Kuhl C, Truhn D, Merhof D. Radiomics feature reproducibility under inter‐rater variability in segmentations of CT images. Sci Rep. 2020;l10(1):12688. [DOI] [PMC free article] [PubMed] [Google Scholar]
- 159. Jha AK, Mithun S, Jaiswar V, et al. Repeatability and reproducibility study of radiomic features on a phantom and human cohort. Sci Rep. 2021;11(1):2055. [DOI] [PMC free article] [PubMed] [Google Scholar]
- 160. Tunali I, Hall LO, Napel S, et al. Stability and reproducibility of computed tomography radiomic features extracted from peritumoral regions of lung cancer lesions. Med Phys. 2019;46(11):5075‐5085. [DOI] [PMC free article] [PubMed] [Google Scholar]
- 161. Lu L, Ehmke RC, Schwartz LH, Zhao B. Assessing agreement between radiomic features computed for multiple CT imaging settings. PLoS One. 2016;11(12):e0166550. [DOI] [PMC free article] [PubMed] [Google Scholar]
- 162. Shiri I, Amini M, Nazari M, et al. Impact of feature harmonization on radiogenomics analysis: prediction of EGFR and KRAS mutations from non‐small cell lung cancer PET/CT images. Comput Biol Med. 2022;142:105230. [DOI] [PubMed] [Google Scholar]