

Summary
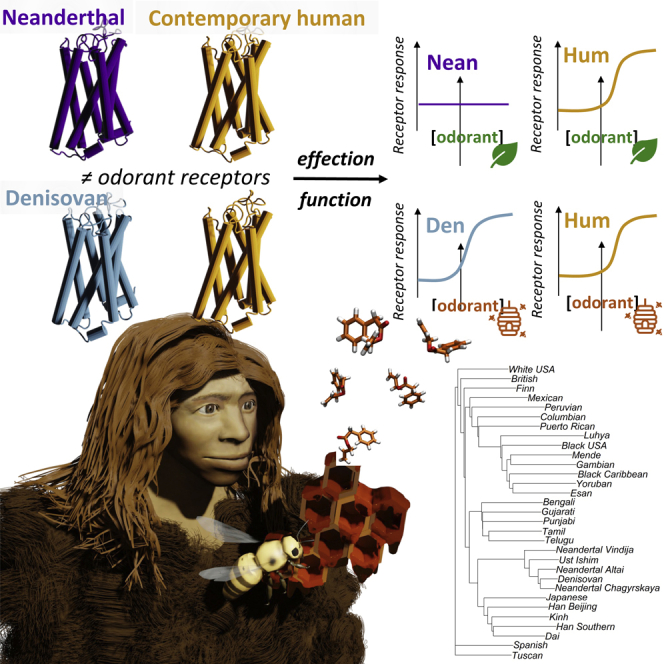
Humans, Neanderthals, and Denisovans independently adapted to a wide range of geographic environments and their associated food odors. Using ancient DNA sequences, we explored the in vitro function of thirty odorant receptor genes in the genus Homo. Our extinct relatives had highly conserved olfactory receptor sequence, but humans did not. Variations in odorant receptor protein sequence and structure may have produced variation in odor detection and perception. Variants led to minimal changes in specificity but had more influence on functional sensitivity. The few Neanderthal variants disturbed function, whereas Denisovan variants increased sensitivity to sweet and sulfur odors. Geographic adaptations may have produced greater functional variation in our lineage, increasing our olfactory repertoire and expanding our adaptive capacity. Our survey of olfactory genes and odorant receptors suggests that our genus has a shared repertoire with possible local ecological adaptations.
Subject areas: Anthropology, Archeology, Evolutionary biology, Molecular biology
Graphical abstract
Highlights
-
•
Neanderthal and Denisovan ORs vary less than human ORs but our repertoires are similar
-
•
OR variation may have helped humans adapt to new environments
-
•
There are limited functional differences in odor specificity across lineages
-
•
Neanderthals are less sensitive to odors than humans, and Denisovans more sensitive
Anthropology; Archaeology; Evolutionary biology; Molecular biology
Introduction
Terrestrial animals probe the environment for information about food, mates, and danger1,2 by binding odor molecules to odorant receptors (ORs). Variation in mammalian ORs is linked to dietary niche, habitat, and sociability.3 In comparison, human ORs are strongly biased toward food odors,4 which reflects the evolutionary importance of dietary niche to our species. Although evolutionarily recent changes in human OR protein function have been linked to major dietary shifts, such as scavenging, hunting, animal milk consumption, cooking, domestication,3,5,6,7,8,9 what about deeper evolutionary changes?
The human genus Homo underwent the most radical ecological niche expansion of all primates when migrating out of Africa and adapting to diverse global environments.10 Denisovans and Neanderthals ancestors dispersed from Africa earlier than contemporary humans (∼750,000 versus 65,000 years ago)11 and separated from each other ∼300,000 years ago12 (Figure S1). Neanderthals were geographically wide-ranging from Western Europe to the Middle East and Asia. Although Denisovans have been primarily found in Siberia,13,14 the Tibetan plateau,15 and possibly beyond Wallace’s Line,16 their genetic signature is found in Asian, Papua New Guinea, Australian, and indigenous American groups.16,17,18,19,20,21 Olfactory stimuli from divergent environments following independent dispersals from Africa may have left traces of variation in Homo OR genes. Whether there is a shared genetic and/or functional olfactory repertoire across the genus Homo or not may provide clues to evolutionary adaptive trends.
Two prior studies examined genetic variation in contemporary humans, Altai Neanderthal, and Denisovan for OR7D422 and OR2M3.23 Both studies identified novel Denisovan variants and subjected them to functional testing. Our work exponentially increases knowledge on functional differences in two novel OR variants to 29 additional open reading frames (Table S1) for ORs with known human receptor-odor relationships and well-established agonist responses.24,25 We also more than double the number of ancient samples by including two additional Neanderthal genomes (Chagyrskaya, Vindija) and one ancient human (Ust’-Ishim) who lived in the same Altai montane locality (Table S2). The contemporary human sample used is 1000 Genomes (Table S3).13 There is more variation in the contemporary human ORs studied compared to extinct lineages. Functional testing indicates that novel variants found in extinct lineages alter sensitivity more than specificity. Our wide survey of the OR family suggests that the genetic and functional olfactory repertoires of extinct lineages were highly over-lapping and that increased genetic variation in the human repertoire occurred after our split with other migratory members of our genus.
Results
Most variants were present in Homo before global divergence of the genus
Of the 30 genes examined (29 new genes and 7D4 for the newly added genomes), two ancient genes were identical to the human reference (4Q3, 8B3), twenty contained variants already observed in 1000 Genomes (Table S4: 2016 VCF Shared Variants), and only 11 genes contained a total of 14 variants not found in 1000 Genomes (Table S5). Denisovan had nine novel variants (of which two were synonymous) compared to the Neanderthal five (of which 2 were synonymous). No novel variants were observed in the ancient human Ust’-Ishim. The primary pattern across sampled genes suggests a pattern of shared variation (i.e., variants were introduced before global divergence of Homo).
Past Homo lineages exhibited more population structure than living humans
Extinct lineages and Ust’-Ishim had fewer DNA and protein variants compared to 1000 Genomes (Figure 1 and Table S6). Nucleotide variants in extinct lineages averaged 0.19% across the 17 genes containing variants—0.11% across all 30 genes, including ones with no differences from the human reference. In comparison, nucleotide variation in 1000 Genomes averaged 0.82% across 30 genes (all genes contained variants). The fixation index (Fst) measures genetic variance because of population structure (typically weighted by population size) and ranges from 0 (no differentiation) to 1 (complete differentiation).26 The Fst values by gene for 1000 Genomes populations are lower than other large-bodied mammals with wide geographic dispersal (Table S7).27 The 1000 Genomes populations are not highly differentiated across the sampled 30 ORs—an Fst mean of 4%. In contrast, the genus Homo (1000 Genomes and ancient samples) has an Fst mean of 11%, the lower end of possible significant differentiation by population structure. Of the 13 genes with Fst >12%, only two had novel variants in extinct populations, which suggests that the small number of novel variants are not highly influential in differentiating populations (Table S7).
Figure 1.

Percent OR variation
The percentage of variation was calculated by taking the total variant count per gene divided by total basepairs per gene for each population. We used raw counts for ancient populations and raw counts for the consensus sequence of each gene for each of 26 groups in 1000 Genomes. We used the consensus sequence for each of the 1000 Genomes groups rather than total raw counts because the sample sizes are divergent. By using the consensus raw count, we compare percentage variation of one gene to another gene.
Extinct lineages clustered with each other and closest to East Asian living humans
Amino acid sequences for the sampled ORs were the basis of a cladogram, which visualizes relationships across samples (Figure S2). Extinct lineages formed a clade with Vindija Neanderthal being the most distinct, which was unexpected because genome-wide studies have indicated that Vindija is most genetically similar to Chagyrskaya Neanderthal.28 The clade of extinct lineages (Neanderthal and Denisova) was closest to the ancient human Ust’-Ishim. Ancient samples were closest to living East Asians and then living South Asians—both groups harbor genetic signatures of introgression with Neanderthals and Denisovans.16
Testing for differences in protein function due to SNPs indicates a shared functional repertoire with differences in sensitivity more than specificity
Of the 29 new genes examined and additional genomes examined for 7D4, we identified 11 genes containing 14 novel variants that were subjected to functional testing. Because gene function in not reliably predictable for ORs from sequence data,29,30 we directly measured the functional responses of ORs containing novel variants. Each OR protein, expressed in a cell line, was screened against seven odorants previously identified in the literature as evoking responses: OR1A1,29,31 OR1C1,30 OR2C1,29 OR10J5,29 OR5P3,29 and OR10G3.30 Dose response assays for the top screening responses included seven concentrations of the odors delivered separately. To compare dose responses, we computed an Activity Index based on the potency and efficacy of an OR/odorant pair (Figure 4). We distinguish between genes and proteins by prefixing proteins with OR and eliminating the prefix when referring to genes (e.g., 1A1 for the gene, OR1A1 for the protein). Functional testing included 784 OR/odorant pairs with at least 1 concentration in total—42 odorants on 2 ORs (living and extinct) for a total of 84 OR/odorant pairs (Figure S3), 2 ORs against 350 odorants for a total of 700 OR/odorant pairs (Figure S4).
Figure 4.

Comparison of OR activity index for human and extinct lineages
Color coding is from low (purple) to high (mustard). Odor qualities are from Good Scents Company.32
There were only three Neanderthal genes containing novel variants across all three Neanderthal samples. Their dose responses were not correlated with those of contemporary humans (Figures 2A, 2C and 2D). Only OR1C1 had a detectable response, but it was significantly lower than that of living humans (Figures 3A, 3C, 3D, 4, S2, and S3). Despite the higher number of novel OR variants in Denisovans and higher dose responses compared to contemporary humans (Figures 2C and 2D), the OR responses for six genes and those for human reference were significantly correlated (R2 = 0.87) (Figure 2B). Sampled Denisovan ORs were less sensitive to odors that contemporary humans perceive as floral but much more sensitive to odors perceived as spicy, balsamic, or unpleasant (e.g., sulfur 4x greater and balsamic 3x greater than in contemporary humans) (Figure 4). Higher dose responses in Denisovan ORs appear to be driven by two amino acid variations in two ORs containing novel variants (Figures 3 and S3).
Figure 2.

Regression results for dose responses
(A) Comparison of human (xaxis) and Neanderthal (yaxis) OR responses to odorants in vitro, (B) Comparison of human (xaxis) and Denisovan (yaxis) OR responses to odorants in vitro.
(C) Boxplots of in vitro OR responses for all samples showing median, box boundaries (first and third quartiles), and two whiskers (upper whisker extends to the largest value no further than 1.5 inter-quartile range from the third quartile; lower whisker extends to the smallest value at most 1.5 inter-quartile range of first quartile, outliers identified with red asterisk), (D) OR response by lineage and gene. Each OR is represented by a different color and each point represents the natural log of the response to an odorant. Dotted lines correspond to the linear regression for the entire set of ORs responses for a given lineage. The corresponding equation and R2 values are shown on the regression plot. Raw and analyzed data are in DataS1.
Figure 3.

Homology model of the human consensus odorant receptor
The transmembrane domains are represented in tubes and numbered from 1 to 7. The location of each of the variants is pointed on the human consensus OR homology model by a colored ring. For each variant, dotted lines connect the variant location to a panel showing the ORs dose-response to odorants that were significantly activating ORs in screening. The xaxis of panels represents the logarithmic transformation of the odorant concentration (M) and the yaxis the normalized luminescence (Luciferase (L) normalized by Renilla (R) luminescence, see STAR Methods) generated by the OR activation in luciferase assay. The empty vector pCI is added as a negative control. Error bars are SEM (standard error of the mean) of n = 4 replicates. The Homo lineage origin of the OR variant is color coded in the OR homology model and the dose-responses as modern human = orange, Denisova = blue, Neanderthal Vindija = light purple, Neanderthal Chagyrskaya = dark purple. Statistical significance of OR response between of the human and Homo lineage versions is assessed by Extra sum-of-square F test on the dose-response and shown as ∗∗∗p<0.001, ∗∗0.001<p<0.01, ∗0.01<p<0.05, ns non-significant. Raw and analyzed data are in DataS1.
Despite using the same DNA sequence as previous studies of OR2B1130 and OR6P1,25 neither responded to any of the ∼350 odors (100 μM) against which they were tested (Figure S4)—neither did the extinct lineages. In previous studies, OR2B1130 and OR6P125 responded strongly to coumarin and Anisaldehyde, respectively, at concentrations higher than 100 μM. We found that such concentrations often cause cell toxicity or OR non-specific cell responses.
OR1A1. All but 2-heptanone induced a response in the screening assay (Figure S3A) and the highest responses were for allyl phenylacetate, a honey-like odor (particularly for Denisovan) (Figures 4 and 3). Neither of the two Denisovan variants (V461I1.54, T257 M6.54) was in an amino acid region critical for mammalian OR function nor were they involved in the odorant binding cavity—perhaps explaining their minimal functional impact.
OR1C1. The only significant response was from Chagyrskaya Neanderthal to androstadienone (Figure S3B) and it was weak (Figure 4 and 3). Chagyrskaya Neanderthal OR1C1 variant Y120H3.48 is part of the highly conserved MAY3.48DRY motif involved in the activation of mammalian ORs (Figure 3 and S3B), which might explain why this variant alters function.23,33,34
OR2C1. Screening assay responses were strong but not statistically significant (Figure S3A). The dose response assay for octanethiol produced a statistically significant response in the Denisovan version of this OR (Figures 4 and 3). The shared C149 W4.50 corresponds to the conserved W4.50. The W residue is highly conserved in GPCRs but less so in ORs (58%). The location of the novel Denisovan I214 T5.54 in TM5 is below residues involved in canonical ligand binding cavity and it points into the receptor rather than the surface. In addition, prior functional tests for C149 found a similar response.25 The C149W allele may stop protein function and may have produced octanethiol-specific anosmia.
OR5P3. In the screening assay, Vindija Neanderthal did not have a significant response but the human reference responded to five of the seven odorants (Figure S3B). Vindija dose responses, which included higher concentrations of the top three responses for contemporary humans (coumarin and both enantiomers of carvone), did not exceed control (Figure 3). The cell surface expression for Vindija indicated that the OR protein was present at the cell surface, albeit at a slightly lower level than that in contemporary humans. Vindija F159 L4.58 is in the extra-cellular part of TM4 (Figure 3), near 4.53, which is involved in mouse OR trafficking.35 We observed slightly lower trafficking of the Vindija protein. A similar mutation (S155 A4.56) in human OR1A2 decreases in vitro responses to (S)-(−)-citronellal.31 If OR5P3 F159 L4.58 is involved in odorant binding, the mutation of this position from phenylalanine to leucine might prevent the π-π stacking interaction between the aromatic residue and coumarin. We conclude that the Vindija protein is not functional and this might be attributable to many potential reasons (a few examples are lack of odorant binding, or fail in activation mechanism, or fail to bind the G protein).
OR10G3. The screening assay revealed significant responses for all seven odors in the Denisovan OR and in the human reference (Figure S3A). Denisovan variants had significantly stronger dose responses to vanillin and ethyl vanillin compared to contemporary humans (Figure 4 and 3). Neither of the Denisovan variants (S73G2.52, E197 K5.36) was located in conserved amino acid regions (Figure 3). TM2 is not involved in odorant binding or receptor function, implying that S73G2.52 probably did not change the receptor response. TM5 (E197 K5.36) forms part of the binding cavity but position 5.36 is located at the very limit of ECL2. K at this position is a rare residue in contemporary human ORs (3.6%), suggesting a functional, adaptive reason for this change. The location of the variant suggests it may be involved in ligand entry.
OR10J5. There were three significant screening responses to lyral, helional and eugenol (Figure S3A). The Denisovan response to top odor lyral was lower than that of the human reference (Figures 4 and 3). The G21RNter variant of OR10J5 found in the Denisovan is located at the very end of the N terminal end, just before the start of TM1. The role of this region in OR function is undetermined.
Discussion
We tested 784 OR/odorant pairs on ten novel missense variants, which were located in 8 genes out of 30 (29 new genes and OR7D4 for the new Neanderthal samples). Five were functionally different than contemporary humans (OR1C1, OR2C1, OR5P3, OR10G3, OR10J5), one the same (OR1A1) and two without identifiable ligands (OR2B11, OR6P1). Given the small percentage of genes with variants altering OR function, members of the genus Homo likely shared an olfactory repertoire based on our sample, with Neanderthals and Denisovans smelling the same range of odors we do but having different dose responses to those odors. When OR function was altered by a novel OR, the difference was in sensitivity rather than specificity. Novel Denisovan OR variants (OR1A1, OR2C1, OR10G3, OR10J5) were twice as responsive as human equivalents to odors contemporary humans perceive as spicy, balsamic, and unpleasant (Figure 4), but not to odors perceived as floral. Given the human specialization of olfactory sensory neurons to food-based odors,4 the variation in sensitivity to food odors in an extinct lineage in our sample is indirect evidence of a similar emphasis. Novel Neanderthal variants were three times less responsive than human ORs, including reduced responses to odors perceived as green, floral, and spicy (Figure 4). There is some correlation in Neanderthal skull morphology that suggests their olfactory bulbs were smaller than contemporary humans,13 but the link between bulb size and olfactory acuity is unclear.36,37
Given that most variants are shared by the genus Homo, the small number of novel variants in extinct lineages may reflect adaptations following dispersals from Africa and after the split with humans. For example, the Denisovan OR strong response to honey-like odors (allyl phenyl acetate) may reflect the evolutionary olfactory ecology of the lineage. Honey is the most energy-dense natural food and is a prized component of extant hunter-gatherer diets (except where bees are rare or absent)—even great apes have a ‘honey tooth’.38 The hunt for sugar is as old as the earliest stem primates 54 mya who notably had a high prevalence of caries after a shift to a diet high in fruit39—such an emphasis on sweet is allied with the increased sensitivity to vanilla odors in our study. Denisovan’s increased sensitivity to sweet odors suggests an evolutionary tuning to sources of natural sugar. Energy-dense foods like sugars are sought by larger-brained primates40 and, based on oral microbiome data, Neanderthals and contemporary humans share functional adaptations in nutrient metabolism, including starch digestion, that are not found in our closest ape relatives.41 The high response to vanilla odors further suggests a tuning to sweet—an odor-taste pairing common in contemporary humans.42
Although local ecological adaptive pressures may have acted on ORs in extinct lineages to produce the few novel variants observed, extinct lineages were less variable in OR genes and proteins compared to 1000 Genomes. Differences in sample sizes might account for some of the striking differences, but the reduced variation is probably because of genetic drift effect or gene conservation.28 Purifying selection has been observed in chimpanzee ORs compared to a mix of relaxed and positive selection in human ORs43 and extinct lineages may also have been subject to this as well (as suggested by the presence of fewer variants, most of which code for synonymous proteins). The mean of Fst values across genes comparing 1000 Genomes to extinct lineages (11%) is higher than those for 1000 Genomes population comparisons (4%), which suggests that there are structural differences between them and us that reflect both explanations—drift and conservation. Denisovans have been previously noted to exhibit geographical and temporal population structure.16,17 Based on our data the last common ancestor shared by Homo (contemporary humans, Neanderthals, Denisova, and others) and Pan (chimpanzees, bonobos) had a conserved set of ORs. Contemporary humans derived away from the pattern of conservation more recently, with evolutionary pressure toward increased missense variation.
Despite sharing a genetic and functional olfactory repertoire with Neanderthals and Denisovans (shared variants suggest a shared olfactory world), contemporary humans have greater genetic variability and diversity (across populations) than extinct lineages. Such variation and diversity indicates a broad olfactory repertoire44 and may reflect cultural adaptations following our migrations from Africa. Relaxed selection on OR genes for groups no longer engaging in traditional lifestyles is possible.45 In our sample, 1000 Genomes groups outside Africa were less variable in most OR genes than those in Africa in our sample and other research has found that greater OR gene enrichment in African hunter-gatherer groups (Hadza and Pygmies) but not African agricultural (Yoruba) and pastoral (Maasai) groups.46 Tanzanian Sandawe hunter-gatherers show no OR allelic enrichment, however, which undermines the case for relaxed selection.46 High allelic diversity and OR generalization on a broad scale may have functional implications, such as increasing the effective size of the olfactory repertoire.44
Our data provide insights into how the dispersal of human lineages outside of Africa (Denisova, Neanderthal, ancient human) may have affected olfactory gene repertoire and function. Understanding the evolutionary genetics and functional significance of observed OR variability in and among human populations and extinct relatives sheds light on the role of olfaction in key aspects of human culture, and perhaps our current success as a global species. The applications of these methods to a large dataset addressing the function of genetic variation in extinct hominins is an advance in the study of human evolution and allows future work with odorant receptors (and other proteins that can be created in the lab) and their adaptive function in human evolutionary timescales. Understanding our unique OR allelic diversity and its evolution is an important challenge to olfactory science.
Limitations of the study
The primary limitation of the study is outside our control: the small sample sizes available for the extinct human lineages that met our inclusion criteria. Although there are an increasing number of ancient genomes available, each team uses different methods for handling damaged DNA and variant calls may be true genetic variation or the result of different methods. We limited our sample to the largest available sample across lineages of interest that was generated by one team using the same methods for damaged genomes. Another limitation is that we are unable to conduct sophisticated population genetics analysis with sample sizes as low as 1 (Denisova and Ust’-Ishim, respectively) and as high as 3 (if Altai, Chagyrskaya, and Vindija Neanderthals are grouped together despite having different ecological challenges). Although the data generated are robust for examining how odorant receptors function to bind odors, we cannot gain insights into how these odors may have been perceived by the extinct lineages. A final limitation is our current knowledge of odorant-OR and genotype-phenotype associations. Deorphanizing ORs with potential agonists is outside the scope of this paper. Many recent deorphanized ORs47,48,49 have yet to undergo extensive testing against a vast array of agonists. Our approach was to focus on the well-established ORs supported by multiple lab testing, given our focus on applying established OR-odorant pairs to the question of human olfactory evolution.
STAR★Methods
Key resources table
| REAGENT or RESOURCE | SOURCE | IDENTIFIER |
|---|---|---|
| Antibodies | ||
| mouse antiRho4D2 | Millipore Sigma | Catalog#MABN15, RRID:AB_10807045 |
| (PE)-donkey anti-mouse F(ab’)2 Fragment antibody | Jackson Immunologicals | Catalog#715-116-150, RRID:AB_2340798 |
| Critical commercial assays | ||
| Dual-Glo Luciferase Assay System | Promega | Catalog# E2940 |
| Deposited data | ||
| Functional Data (raw) | This paper | https://github.com/kchoover14/OldNoseshttps://doi.org/10.6084/m9.figshare.21542943 |
| Protein Models.pdb | This paper | https://github.com/kchoover14/OldNoseshttps://doi.org/10.6084/m9.figshare.21542943 |
| Functional data (2013 all and active) | This paper | https://github.com/kchoover14/OldNoseshttps://doi.org/10.6084/m9.figshare.21542943 |
| Functional data (2016 all and active) | This paper | https://github.com/kchoover14/OldNoseshttps://doi.org/10.6084/m9.figshare.21542943 |
| Experimental models: Cell lines | ||
| HEK293 cells | Hiroaki Matsunami lab | Saito et al., Cell, 200429 |
| Hana3A cells | Hiroaki Matsunami lab | Saito et al., Cell, 200429 |
| Oligonucleotides | ||
| Primers for mutation of human ORs by site-directed mutagenesis | Supplementary information of this paper – ordered from IDT DNA | N/A |
| Software and algorithms | ||
| R v4.1.0 | R Core Team | https://www.R-project.org/ |
| RStudio v1.4.1717 | R Studio Team | www.rstudio.com/ |
| Graphpad Prism 9 | GraphPad Software | https://www.graphpad.com/ |
| Excel v.2018 | Microsoft | https://www.microsoft.com/en-us/microsoft-365/excel |
| FACSDive Software v9.0 | Becton Dickinson | https://www.bdbiosciences.com/en-us/products/software/instrument-software/bd-facsdiva-software |
| FlowJo v10 | Becton Dickinson | https://www.flowjo.com/ |
| Other | ||
| R scripts for analysis (n=12) | This paper | https://github.com/kchoover14/OldNoseshttps://doi.org/10.6084/m9.figshare.21542943 |
Resource availability
Lead contact
Further information and requests for resources and constructs should be directed to and will be fulfilled by the lead contact, Kara C. Hoover (kchoover@alaska.edu).
Materials availability
-
•
This study did not generate new unique reagents (see key resources table for materials used)
-
•
All protein models are made available in https://github.com/kchoover14/OldNoses. DOI is listed in the key resources table.
Experimental model and subject details
HEK293T and Hana3A cells were cultured in Minimum Essential Media (MEM) supplemented by 10% Fetal Bovine Serum (FBS), Penicillin-Streptomycin and Amphotericin B at 37C° in 5% CO2 and saturated humidity environement. Duke DNA Analysis Facility authentified the cells by conducting DNA profiling of HEK293T lab stock and Hana3A cell line for polymorphic short tandem repeat (STR) markers using a GenePrint 10 (Promega) and confirmed shared profiles with the reference (ATCC CRL3216).
Method details
Gene sample
Our gene sample is limited to 30 OR genes shown to generate functional response data in previous studies24 (Table S1). One of these genes, 7D4 was previously examined but only for Altai Neandertal and Denisovan and using older genomic sequence data.22 While there are more than 30 ORs with putative agonists (see two recent surveys of deorphanized ORs,47,48 many of these have yet to undergo extensive testing against a vast array of agonists. Our question is about the role human olfaction in the evolution of the genus of Homo, a unique type of ape that expanded its range to almost every area of the globe. While our method is not comprehensive in terms of the number of ORs that have putative ligands, it is a broad survey of ORs with 11 of 15 OR subfamilies with identified ligands (1, 2, 4, 5, 6, 7, 8, 10, 11, 51, 56), including class II and class I ORs. The remaining subfamilies (OR 13, 14, 3, 9, 52) are mostly poorly characterized (a few ligands for a few ORs). Our approach was to focus on the well-established ORs supported by multiple lab testing. Gene regions were targeted using NCBI and RefSeq ranges—in the case of eight genes that contained up- and downstream sequences, the region was cut to the protein coding portion of the gene to be consistent with the other 22 genes that contained no up- or downstream areas.
We cataloged variants in high quality paleogenomic sequence data produced by the Max Planck Institute Leipzig (Table S2) for Neandertals (Altai, Chagyrskaya, Mezmaiskaya), Denisovan 3 (the only high quality Denisovan genome, finger phalanx), and an ancient human hunter-gatherer from Siberia (Ust’-Ishim). We used the data generated by snpAD in/neandertal/vindija/vcf, an ancient DNA damage-aware genotyper.1 The VCF reference genome for genomes analyzed was hg19/GRCh37. Only variants with a minimum genotype quality of 20 (GC20) were used for downstream analysis. The choice of restricting ancient genome samples to those generated by Max Planck was to reduce the noise introduction by different methods of variant calling and handling damaged genomes. Although the draft genomes of Neandertals and Denisovans were reported as having more nonfunctional ORs than contemporary humans,50 these genomes have since been revised.28,51 The bioinformatic identification of olfactory pseudogenes has been experimentally challenged52 by data showing the receptors containing coding sequence regions split into separate exons are conserved across mammals and expressed at the same level as protein-coding receptors with a single exon.53
We also catalogued variants from contemporary using 1000 Genomes dataset54 consisting of over 2,500 individuals from 26 populations in Africa, the Americas, Europe, and Asia (Table S3). The 26 groups in 1000 Genomes were comprised of individuals with at least 3 out of 4 grandparents identifying membership in the group. While there are some groups engaging in pastoral or traditional horticulture/farming lifestyles, most practice mixed subsistence economies and lead western lifestyles.
Variant calling
Max Planck and 1000 Genomes Project both used the reference genome, hg19/GRCh37, to call variants using VCFtools.55 GRCh37 is built from sequences from different individuals and serves as the reference. If the reference allele is C at a specific genomic position, a variant is called if it is not a C. We excluded insertions and deletions from analysis. BCFtools56 was used to slice VCFs into chromosomes (ancient DNA) and genes of interest. For 1000 Genomes, BCF tools was also used to generate population specific VCF files. BCF tools was used to create consensus sequences for each gene for the entire 1000 Genomes dataset and for each population.
We cataloged variants using two sets of VCF data published by Max Planck Institute for Evolutionary Anthropology Leipzig in 2013 and 2016. Both datasets are based on the same original sequence data but the 2016 VCFs were generated using snpAD, an ancient DNA damage-aware genotyper, and are more conservative estimates mutations.51
The 2016 ancient VCFs (Tables S2 and S6) include high quality data from three Neandertals (Altai, Chagyrskaya, Vindija), lower quality data from one Neandertal (Mezmaiskaya), high quality from one Denisova (Denisovan 3), and one ancient human contemporary to Altai Neandertal and Denisova in Denisova Cave (Ust’-Ishim).
The 2013 VCF data analysis included high quality data—but not subject to the damage-aware genotyper—for Altai Neandertal, Denisova 3, and Ust’-Ishim. Variants were called using a custom bioinformations pipeline (Figure S5). Data are found at http://cdna.eva.mpg.de/ust-ishim/VCF and http://cdna.eva.mpg.de/neandertal/altai/AltaiNeandertal/. Most variants were shared with contemporary humans (Table S8: 2013 VCF Variants). Three genes matched the human reference (contained no variants, novel or shared) in all three samples tested (OR5K1, OR11A1, OR56A4) and 16 contained novel missense variants (Table S9). See Figure S6 for functional results and Figure S7 for regression results—Altai is significantly different from contemporary humans and Denisova but there were few differences in terms of patterns of response.
Primer design
ORs for extinct humans were created by mutating human ORs to match paleogenomic sequence data using chimeric PCR. Forward and reverse PCR primers containing the desired mutation were designed to have a 56⁰C or 58⁰C annealing temperature, obtained from Integrated DNA Technologies, and diluted to 5μM.
Chimeric PCR
Chimeric PCR was performed using Phusion polymerase and Rho-tagged OR in a pCI vector as a template, with separate reactions using the forward primers paired with a 3’ pCI primer or reverse primers paired with a 5’ pCI primer.57 The reaction was started at 98⁰C for 30 seconds, then run for 25 cycles of the following conditions: denaturation at 98⁰C for 5 seconds, primer annealing at 55⁰C for 15 seconds, and elongation at 72⁰C for 30 seconds. The reaction was then held at 72⁰C for 5 minutes. The products resulting from the forward and reverse primers were combined for each mutant and diluted 10x with distilled water (Gibco). A second PCR was performed using Phusion polymerase, 5’and3’ pCI primers, and the combined and diluted products for each desired mutant as the template. The same PCR conditions were used. The products were purified using the QIAquick PCR Purification Kit (Qiagen), cut with MluI and NotI restriction enzymes, run on a 1.1% agarose gel with GelRed, and extracted using the QIAquick Gel Extraction Kit (Qiagen). The products were then ligated into Rho-tagged pCI cut with MluI and NotI using T4 ligase (New England Biolabs) and used to transform competent ampicillin-resistant E. Coli. These were plated on LB-ampicillin plates and incubated at 37⁰C overnight, then a single colony was grown in 4mL of 2XYT-ampicillin (100mg/mL) medium overnight at 37⁰C. The Denville Miniprep Purification Kit was used to lyse the bacteria and purify the plasmid DNA. The concentration of the products was determined using an Eppendorf Biophotometer, and then adjusted to 100 ng/μL using TE buffer. The products were sequenced using BigDye Terminator Sequencing Kit (Applied Biosystems), purified using Sephadex (GE Healthcare), and sequenced with 3130 Genetic Analyzer (Applied Biosystems).
Luciferase assay
Functionality was tested by a Luciferase assay as described in Zhuang and Matsunami24 and fully described here. Hana3A cells were plated in Minimum Essential Medium (MEM) containing 10% FBS (vol/vol), penicillin-streptomycin and amphotericin B on Poly-D-lysine coated 96-well plates (Corning #3843) and co-transfected using Lipofectamine2000 (Invitrogen) with 5 ng of the prepared Rho-tagged OR or the empty vector pCI (negative control), 5 ng of RTP1S, and 2.5 ng of the muscarinic receptor M3. The cells were transfected with elements from the Dual-Glo Luciferase Assay System (Promega): the cAMP response element (CRE) coupled with a luciferase reporter gene (L) (10 ng); and the constitutively active SV40 promoter region coupled with the Renilla luciferase (R) reporter (5 ng). In a period of 18-24 hours after transfection, the medium was replaced with 0 μM, 1 μM, 3.16 μM, 10 μM, 31.6 μM, 100 μM, or 316 μM of odorants (Sigma Aldrich) in CD293 (Gibco) containing 2 mM glutamine and 30 μM copper and incubated for 3.5 hours. After the addition of Dual-Glo luciferase substrate and buffer (Promega), plates were read using BMG Labtech POLARStar Optima plate reader. Promega Stop-and-Glo buffer and RL substrate were added, and plates were read again. The degree of activation was quantified for each well in Microsoft Excel using the formula (L-400)/(R-400) and reported on the y-axis (L/R emitted in lumens). The R quantification is made due to variation in cell numbers in each well and the 0 μM values provide the basal activity value for each OR. 0 μM thus served as a comparison to identify OR response values to odorant stimulations —if the odor value on the y-axis exceeded the 0 μM value, the OR was taken to have responded to the odor but if the odor value did not exceed the 0 μM value, the OR was considered unresponsive. Dose responses and EC50s were determined with Graphpad Prism 9. Activity indexes have been calculated from dose responses by multiplying the absolute value of the logEC50 to the efficacy.58 If EC50 could not be determined because the dose response did not reach its plateau, logEC50 were set as the arbitrary value −2. These values were used for Figure 4along with odor descriptors and olfactory notes from Good Scents.32
Flowcytometry
The cell surface expression of the Rho-tagged ORs was evaluated as described in Ikegami, deMarch et al.35 and fully detailed here. HEK293 cells were plated in 35 mm plates at 25% confluency and grown overnight at 37°C and 5% CO2. The cells were then transfected with 1200 ng of the Rho-tagged ORs, 300 ng of RTP1s and 30 ng of GFP using the Lipofectamine2000 reagent (ThermoFisher Scientific) in MEM supplemented with 10% FBS. 18 to 24h later, the cells were detached from the plates with cellstripper and resuspended in PBS containing 15 mM NaN3, 2% FBS in ice. The cells were then centrifuged at 4°C and resuspended and incubated for at least 30min in 1/400 (v/v) of primary antibody (mouse antiRho4D2, Millipore Sigma). The cells were then centrifuged at 4°C and resuspended and incubated for at least 30 min and in the dark in 1/200 (v/v) of phycoerythrin (PE)-donkey anti-mouse F(ab’)2 Fragment antibody (Jackson Immunologicals: 715-116-150). Finally, the cells were stained with 1/500 (v/v) of 7-Amino-actinomycin D (7AAD, Calbiochem). The cell surface expression was monitored through the PE fluorescence emitted by cells GFP positive, single, spherical, viable and 7AAD negative using a BD FACSCanto II. The results were analyzed with Flowjo. Olfr539 and Olfr541 were added to the experiment plan as positive and negative, respectively, controls of OR cell surface expression.
Homology model
The protocol followed a previously published method57 and is described here. 391 human OR sequences were aligned to pre-aligned sequences of 11 GPCRs including bovine rhodopsin (PDB: 1U19), human chemokine receptors CXCR4 (PDB: 3ODU) and CXCR1 (PDB: 2LNL), and human adenosine a2A receptor (PDB: 2YDV) using Jalview.59 The four experimental GPCR structures (1U19, 3ODU, 2YDV and 2LNL) were used as templates to build the human consensus OR by homology modeling with Modeller. The human consensus amino acid sequence was determined by aligning 391 human OR sequences and by selecting the most conserved amino acid for each position. Five models were obtained and the one fulfilling several constraints (binding cavity sufficiently large, no large folded structure in extra-cellular loops, all TMs folded as α-helices, a small α-helix structure between TM3 and TM4) was retained for further structural analysis. Visualization of the models and picture generation were performed with VMD.
Quantification and statistical analysis
Novel variant calling
R v4.1.060 via R Studio v1.4.171761 were used for analysis. Excel and csv files were read using readxl.62 The hash function in base R used 1000 Genomes variant data54 as a key to flag variants present in ancient samples but not found in contemporary humans. Data were manipulated using tidyverse.63
Genetic analysis
Variants were called using DNAsp to generate Nexus files for each gene comparing a consensus sequence for each of the 26 groups in 1000 Genomes to the human reference sequence used for the published datasets (Max Planck and 1000 Genomes). Consensus sequences were used for each group in 1000 Genomes to reduce the sample size for comparison to ancient sequences which represented individuals, not groups. Several packages from Bioconductor64 were used in R to create protein sequence files and call amino acid substitutions. Figures for percentage of variation by gene were generated using ggplot in tidyverse63 with the viridis color-blind friendly palette and plotted panels using gridExtra.65 Concatenated amino acid sequences were used to infer phylogenetic relationships across populations for 30 genes.66 The phylogenetic tree and cladogram were created using the R packages ape,67 seqinr,68 phylogram,69 gdsfmt,70 SNPrelate,70 and dendextend.71 Fst was calculated using gdsfmt70 and SNPRelate.70 for Figures 1, 2, S1, S2, and S7–S9.
Regression analysis
Data were analyzed in R for Windows 4.1.0, using the R Studio GUI for Windows 1.4.1717. Data were wrangled using 63tidyverse.63 The dose response dependent variable was fitted to distributions using fitdistrplus72 and formed log normal distributions. The natural log was used to transform to normally distributed data for linear regression models. The car package73 was used for ANOVA. 0 μM values, as noted above, provided a control (the baseline threshold of OR activation). Because the number of cells varied across plates, the OR tested for each sample had a different 0 μM. As such, removing values below the 0 μM for each correlation between contemporary humans and ancient DNA sample resulted in some odors missing values for one of the lineages. We compared the results of regression for testing using only active ORs (above the 0 μM value) and for the full set of ORs—the results were nearly identical (Figure S8 for 2016 VCFs, Figure S9 for 2013 VCFs). Testing the full suite of responses, active or below the threshold, allowed a broader comparison of how these cells operate. Analysis was conducted on the full dataset for both between sample correlations and for mean difference testing. Plots for data visualization and results were created using ggplot263 and ggpubr.74 Panels were created using cowplot75 and ggarrange.
Quantification and statistical analysis of OR activity
OR response was monitored in n=4 biological replicates and plotted with the corresponding SEM on Figure 3. A doseresponse curve was fitted to the OR dose-response with the leastsquares regression method (three parameters). Statistical significance of OR response between of the human and Homo lineage versions is assessed by an Extra sum-of-square F test on the dose-response fitted curves and shown as ∗∗∗p<0.001, ∗∗0.001<p<0.01, ∗0.01<p<0.05, ns non-significant. Raw and analyzed data are in https://github.com/kchoover14/OldNoseshttps://doi.org/10.6084/m9.figshare.21542943. Analysis was done with GraphPad Prism 9.
Acknowledgments
The high-performance computing and data storage resources operated by the Research Computing Systems Group at the University of Alaska Fairbanks, Geophysical Institute. US National Science Foundation Award #1550409 (KCH), US National Institutes of Health grant K99DC018333 (CADM), US National Science Foundation Award 1556207 (HM), US National Institutes of Health grant DC014423 (HM), US National Institutes of Health grant DC016224 (HM).
Author contributions
Conceptualization, K.C.H., H.M., and M.C.; Methodology, K.C.H., C.A.D.M., H.M., and M.C.; Investigation, K.C.H., C.A.D.M., and M.A.; Visualization, K.C.H. and C.A.D.M.; Funding acquisition, K.C.H., C.A.D.M., and H.M.; Project administration, K.C.H. and H.M.; Supervision, K.C.H. and H.M.; Writing – original draft, K.C.H. and C.A.D.M.; Writing – review and editing, K.C.H., C.A.D.M., M.C., and H.M.
Declaration of interests
H.M. has received royalties from Chemcomm. H.M. has received research grants from Givaudan. H.M. has received consultant fees from Kao.
Inclusion and diversity
One or more of the authors of this paper self-identifies as a gender minority in their field of research. While citing references scientifically relevant for this work, we also actively worked to promote gender balance in our reference list.
Published: January 20, 2023
Footnotes
Supplemental information can be found online at https://doi.org/10.1016/j.isci.2022.105908.
Contributor Information
Claire A. de March, Email: claire.de-march@cnrs.fr.
Kara C. Hoover, Email: kchoover@alaska.edu.
Supplemental information
Date code and availability
Data
-
•
All raw in vitro data are made available in https://github.com/kchoover14/OldNoses. DOI is listed in the key resources table.
-
•
All raw in vitro data analysis is reported in the paper.
-
•
This paper analyzes existing, publicly available genomic data. These accession numbers for the datasets are listed in the key resources table.
-
•
Data generated from analysis of the shared genomic data are made available in https://github.com/kchoover14/OldNoses. DOI is listed in the key resources table.
Code
-
•
All original code has been deposited at https://github.com/kchoover14/OldNoses and is publicly available as of the date of publication. DOI is listed in the key resources table.
References
- 1.Boughman J.W. How sensory drive can promote speciation. Trends Ecol. Evol. 2002;17:571–577. doi: 10.1016/S0169-5347(02)02595-8. [DOI] [Google Scholar]
- 2.Matsumoto T., Terai Y., Okada N., Tachida H. Sensory drive speciation and patterns of variation at selectively neutral genes. Evol. Ecol. 2014;28:591–609. doi: 10.1007/s10682-014-9697-8. [DOI] [Google Scholar]
- 3.Hughes G.M., Boston E.S.M., Finarelli J.A., Murphy W.J., Higgins D.G., Teeling E.C. The birth and death of olfactory receptor gene families in mammalian niche adaptation. Mol. Biol. Evol. 2018;35:1390–1406. doi: 10.1093/molbev/msy028. [DOI] [PMC free article] [PubMed] [Google Scholar]
- 4.Saraiva L.R., Riveros-McKay F., Mezzavilla M., Abou-Moussa E.H., Arayata C.J., Makhlouf M., Trimmer C., Ibarra-Soria X., Khan M., Van Gerven L., et al. A transcriptomic atlas of mammalian olfactory mucosae reveals an evolutionary influence on food odor detection in humans. Sci. Adv. 2019;5:eaax0396. doi: 10.1126/sciadv.aax0396. [DOI] [PMC free article] [PubMed] [Google Scholar]
- 5.Luca F., Perry G.H., Di Rienzo A. Evolutionary adaptations to dietary changes. Annu. Rev. Nutr. 2010;30:291–314. doi: 10.1146/annurev-nutr-080508-141048. [DOI] [PMC free article] [PubMed] [Google Scholar]
- 6.McRae J.F., Jaeger S.R., Bava C.M., Beresford M.K., Hunter D., Jia Y., Chheang S.L., Jin D., Peng M., Gamble J.C., et al. Identification of regions associated with variation in sensitivity to food-related odors in the human genome. Curr. Biol. 2013;23:1596–1600. doi: 10.1016/j.cub.2013.07.031. [DOI] [PubMed] [Google Scholar]
- 7.Jaeger S.R., McRae J.F., Bava C.M., Beresford M.K., Hunter D., Jia Y., Chheang S.L., Jin D., Peng M., Gamble J.C., et al. A Mendelian trait for olfactory sensitivity affects odor experience and food selection. Curr. Biol. 2013;23:1601–1605. doi: 10.1016/j.cub.2013.07.030. [DOI] [PubMed] [Google Scholar]
- 8.McRae J.F., Mainland J.D., Jaeger S.R., Adipietro K.A., Matsunami H., Newcomb R.D. Genetic variation in the odorant receptor OR2J3 is associated with the ability to detect the “Grassy” smelling odor, cis-3-hexen-1-ol. Chem. Senses. 2012;37:585–593. doi: 10.1093/chemse/bjs049. [DOI] [PMC free article] [PubMed] [Google Scholar]
- 9.Lunde K., Egelandsdal B., Skuterud E., Mainland J.D., Lea T., Hersleth M., Matsunami H. Genetic variation of an odorant receptor OR7D4 and sensory perception of cooked meat containing androstenone. PLoS One. 2012;7:e35259. doi: 10.1371/journal.pone.0035259. [DOI] [PMC free article] [PubMed] [Google Scholar]
- 10.Varki A., Geschwind D.H., Eichler E.E. Human uniqueness: genome interactions with environment, behaviour and culture. Nat. Rev. Genet. 2008;9:749–763. doi: 10.1038/nrg2428. [DOI] [PMC free article] [PubMed] [Google Scholar]
- 11.Winder I.C., Devès M.H., King G.C.P., Bailey G.N., Inglis R.H., Meredith-Williams M. Evolution and dispersal of the genus Homo: a landscape approach. J. Hum. Evol. 2015;87:48–65. doi: 10.1016/j.jhevol.2015.07.002. [DOI] [PubMed] [Google Scholar]
- 12.Prüfer K., Racimo F., Patterson N., Jay F., Sankararaman S., Sawyer S., Heinze A., Renaud G., Sudmant P.H., de Filippo C., et al. The complete genome sequence of a Neanderthal from the Altai Mountains. Nature. 2014;505:43–49. doi: 10.1038/nature12886. [DOI] [PMC free article] [PubMed] [Google Scholar]
- 13.Jacobs Z., Li B., Shunkov M.V., Kozlikin M.B., Bolikhovskaya N.S., Agadjanian A.K., Uliyanov V.A., Vasiliev S.K., O’Gorman K., Derevianko A.P., Roberts R.G. Timing of archaic hominin occupation of Denisova Cave in southern Siberia. Nature. 2019;565:594–599. doi: 10.1038/s41586-018-0843-2. [DOI] [PubMed] [Google Scholar]
- 14.Zavala E.I., Jacobs Z., Vernot B., Shunkov M.V., Kozlikin M.B., Derevianko A.P., Essel E., de Fillipo C., Nagel S., Richter J., et al. Pleistocene sediment DNA reveals hominin and faunal turnovers at Denisova Cave. Nature. 2021;595:399–403. doi: 10.1038/s41586-021-03675-0. [DOI] [PMC free article] [PubMed] [Google Scholar]
- 15.Chen F., Welker F., Shen C.-C., Bailey S.E., Bergmann I., Davis S., Xia H., Wang H., Fischer R., Freidline S.E., et al. A late Middle pleistocene denisovan mandible from the Tibetan plateau. Nature. 2019;569:409–412. doi: 10.1038/s41586-019-1139-x. [DOI] [PubMed] [Google Scholar]
- 16.Jacobs G.S., Hudjashov G., Saag L., Kusuma P., Darusallam C.C., Lawson D.J., Mondal M., Pagani L., Ricaut F.X., Stoneking M., et al. Multiple deeply divergent denisovan ancestries in papuans. Cell. 2019;177:1010–1021.e32. doi: 10.1016/j.cell.2019.02.035. [DOI] [PubMed] [Google Scholar]
- 17.Browning S.R., Browning B.L., Zhou Y., Tucci S., Akey J.M. Analysis of human sequence data reveals two pulses of archaic denisovan admixture. Cell. 2018;173:53–61.e9. doi: 10.1016/j.cell.2018.02.031. [DOI] [PMC free article] [PubMed] [Google Scholar]
- 18.Sankararaman S., Mallick S., Patterson N., Reich D. The combined landscape of Denisovan and Neanderthal ancestry in present-day humans. Curr. Biol. 2016;26:1241–1247. doi: 10.1016/j.cub.2016.03.037. [DOI] [PMC free article] [PubMed] [Google Scholar]
- 19.Qin P., Stoneking M. Denisovan ancestry in East Eurasian and native American populations. Mol. Biol. Evol. 2015;32:2665–2674. doi: 10.1093/molbev/msv141. [DOI] [PubMed] [Google Scholar]
- 20.Vernot B., Tucci S., Kelso J., Schraiber J.G., Wolf A.B., Gittelman R.M., Dannemann M., Grote S., McCoy R.C., Norton H., et al. Excavating neandertal and denisovan DNA from the genomes of melanesian individuals. Science. 2016;352:235–239. doi: 10.1126/science.aad9416. [DOI] [PMC free article] [PubMed] [Google Scholar]
- 21.Hu Y., Ding Q., Wang Y., Xu S., He Y., Wang M., Wang J., Jin L. Investigating the evolutionary importance of Denisovan introgressions in Papua New Guineans and Australians. bioRxiv. 2015 Preprint at. [Google Scholar]
- 22.Hoover K.C., Gokcumen O., Qureshy Z., Bruguera E., Savangsuksa A., Cobb M., Matsunami H. Global survey of variation in a human olfactory receptor gene reveals signatures of non-neutral evolution. Chem. Senses. 2015;40:481–488. doi: 10.1093/chemse/bjv030. [DOI] [PMC free article] [PubMed] [Google Scholar]
- 23.Noe F., Polster J., Geithe C., Kotthoff M., Schieberle P., Krautwurst D. OR2M3: a highly specific and narrowly tuned human odorant receptor for the sensitive detection of onion key food odorant 3-Mercapto-2-methylpentan-1-ol. Chem. Senses. 2016;42:195–210. doi: 10.1093/chemse/bjw118. [DOI] [PubMed] [Google Scholar]
- 24.Zhuang H., Chien M.S., Matsunami H. Dynamic functional evolution of an odorant receptor for sex-steroid-derived odors in primates. Proc. Natl. Acad. Sci. USA. 2009;106:21247–21251. doi: 10.1073/pnas.0808378106. [DOI] [PMC free article] [PubMed] [Google Scholar]
- 25.Mainland J.D., Keller A., Li Y.R., Zhou T., Trimmer C., Snyder L.L., Moberly A.H., Adipietro K.A., Liu W.L.L., Zhuang H., et al. The missense of smell: functional variability in the human odorant receptor repertoire. Nat. Neurosci. 2014;17:114–120. doi: 10.1038/nn.3598. [DOI] [PMC free article] [PubMed] [Google Scholar]
- 26.Wright S. The interpretation of population structure by f-statistics with special regard to systems of mating. Evolution. 1965;19:395–420. doi: 10.1111/j.1558-5646.1965.tb01731.x. [DOI] [Google Scholar]
- 27.Templeton A.R. Human races: a genetic and evolutionary perspective. Am. Anthropol. 1998;100:632–650. [Google Scholar]
- 28.Mafessoni F., Grote S., de Filippo C., Slon V., Kolobova K.A., Viola B., Markin S.V., Chintalapati M., Peyrégne S., Skov L., et al. A high-coverage neandertal genome from Chagyrskaya Cave. Proc. Natl. Acad. Sci. USA. 2020;117:15132–15136. doi: 10.1073/pnas.2004944117. [DOI] [PMC free article] [PubMed] [Google Scholar]
- 29.Saito H., Chi Q., Zhuang H., Matsunami H., Mainland J.D. Odor coding by a Mammalian receptor repertoire. Sci. Signal. 2009;2:ra9. doi: 10.1126/scisignal.2000016. [DOI] [PMC free article] [PubMed] [Google Scholar]
- 30.Adipietro K.A., Mainland J.D., Matsunami H. Functional evolution of mammalian odorant receptors. PLoS Genet. 2012;8:e1002821. doi: 10.1371/journal.pgen.1002821. [DOI] [PMC free article] [PubMed] [Google Scholar]
- 31.Schmiedeberg K., Shirokova E., Weber H.P., Schilling B., Meyerhof W., Krautwurst D. Structural determinants of odorant recognition by the human olfactory receptors OR1A1 and OR1A2. J. Struct. Biol. 2007;159:400–412. doi: 10.1016/j.jsb.2007.04.013. [DOI] [PubMed] [Google Scholar]
- 32.GoodScentsCo The GoodScents Company. http://thegoodscentscompany.com/
- 33.Yu Y., de March C.A., Ni M.J., Adipietro K.A., Golebiowski J., Matsunami H., Ma M. Responsiveness of G protein-coupled odorant receptors is partially attributed to the activation mechanism. Proc. Natl. Acad. Sci. USA. 2015;112:14966–14971. doi: 10.1073/pnas.1517510112. [DOI] [PMC free article] [PubMed] [Google Scholar]
- 34.de March C.A., Yu Y., Ni M.J., Adipietro K.A., Matsunami H., Ma M., Golebiowski J. Conserved residues control activation of mammalian G protein-coupled odorant receptors. J. Am. Chem. Soc. 2015;137:8611–8616. doi: 10.1021/jacs.5b04659. [DOI] [PMC free article] [PubMed] [Google Scholar]
- 35.Ikegami K., de March C.A., Nagai M.H., Ghosh S., Do M., Sharma R., Bruguera E.S., Lu Y.E., Fukutani Y., Vaidehi N., et al. Structural instability and divergence from conserved residues underlie intracellular retention of mammalian odorant receptors. Proc. Natl. Acad. Sci. USA. 2020;117:2957–2967. doi: 10.1073/pnas.1915520117. [DOI] [PMC free article] [PubMed] [Google Scholar]
- 36.Bastir M., Rosas A., Gunz P., Peña-Melian A., Manzi G., Harvati K., Kruszynski R., Stringer C., Hublin J.-J. Evolution of the base of the brain in highly encephalized human species. Nat. Commun. 2011;2:588. doi: 10.1038/ncomms1593. http://www.nature.com/articles/ncomms1593#supplementary-information [DOI] [PubMed] [Google Scholar]
- 37.Weiss T., Soroka T., Gorodisky L., Shushan S., Snitz K., Weissgross R., Furman-Haran E., Dhollander T., Sobel N. Human olfaction without apparent olfactory bulbs. Neuron. 2019;105:35–45.e5. doi: 10.1016/j.neuron.2019.10.006. [DOI] [PMC free article] [PubMed] [Google Scholar]
- 38.Marlowe F.W., Berbesque J.C., Wood B., Crittenden A., Porter C., Mabulla A. Honey, Hadza, hunter-gatherers, and human evolution. J. Hum. Evol. 2014;71:119–128. doi: 10.1016/j.jhevol.2014.03.006. [DOI] [PubMed] [Google Scholar]
- 39.Selig K.R., Silcox M.T. The largest and earliest known sample of dental caries in an extinct mammal (Mammalia, Euarchonta, Microsyops latidens) and its ecological implications. Sci. Rep. 2021;11:15920. doi: 10.1038/s41598-021-95330-x. [DOI] [PMC free article] [PubMed] [Google Scholar]
- 40.Dominy N.J. Ferment in the family tree. Proc. Natl. Acad. Sci. USA. 2015;112:308–309. doi: 10.1073/pnas.1421566112. [DOI] [PMC free article] [PubMed] [Google Scholar]
- 41.Fellows Yates J.A., Velsko I.M., Aron F., Posth C., Hofman C.A., Austin R.M., Parker C.E., Mann A.E., Nägele K., Arthur K.W., et al. The evolution and changing ecology of the African hominid oral microbiome. Proc. Natl. Acad. Sci. USA. 2021;118 doi: 10.1073/pnas.2021655118. e2021655118. [DOI] [PMC free article] [PubMed] [Google Scholar]
- 42.Wang G., Hayes J., Ziegler G., Roberts R., Hopfer H. Dose-response relationships for vanilla flavor and sucrose in skim milk: evidence of synergy. Beverages. 2018;4:73. [Google Scholar]
- 43.Gilad Y., Man O., Glusman G. A comparison of the human and chimpanzee olfactory receptor gene repertoires. Genome Res. 2005;15:224–230. doi: 10.1101/gr.2846405. [DOI] [PMC free article] [PubMed] [Google Scholar]
- 44.Trimmer C., Keller A., Murphy N.R., Snyder L.L., Willer J.R., Nagai M.H., Katsanis N., Vosshall L.B., Matsunami H., Mainland J.D. Genetic variation across the human olfactory receptor repertoire alters odor perception. Proc. Natl. Acad. Sci. USA. 2019;116:9475–9480. doi: 10.1073/pnas.1804106115. [DOI] [PMC free article] [PubMed] [Google Scholar]
- 45.Somel M., Wilson Sayres M.A., Jordan G., Huerta-Sanchez E., Fumagalli M., Ferrer-Admetlla A., Nielsen R. A scan for human-specific relaxation of negative selection reveals unexpected polymorphism in proteasome genes. Mol. Biol. Evol. 2013;30:1808–1815. doi: 10.1093/molbev/mst098. [DOI] [PMC free article] [PubMed] [Google Scholar]
- 46.Lachance J., Vernot B., Elbers C.C., Ferwerda B., Froment A., Bodo J.M., Lema G., Fu W., Nyambo T.B., Rebbeck T.R., et al. Evolutionary history and adaptation from high-coverage whole-genome sequences of diverse African hunter-gatherers. Cell. 2012;150:457–469. doi: 10.1016/j.cell.2012.07.009. [DOI] [PMC free article] [PubMed] [Google Scholar]
- 47.Sharma A., Saha B.K., Kumar R., Varadwaj P.K. OlfactionBase: a repository to explore odors, odorants, olfactory receptors and odorant–receptor interactions. Nucleic Acids Res. 2021;50:D678–D686. doi: 10.1093/nar/gkab763. [DOI] [PMC free article] [PubMed] [Google Scholar]
- 48.Kowalewski J., Ray A. Predicting human olfactory perception from activities of odorant receptors. iScience. 2020;23:101361. doi: 10.1016/j.isci.2020.101361. [DOI] [PMC free article] [PubMed] [Google Scholar]
- 49.Haag F., Hoffmann S., Krautwurst D. Key food furanones furaneol and sotolone specifically activate distinct odorant receptors. J. Agric. Food Chem. 2021;69:10999–11005. doi: 10.1021/acs.jafc.1c03314. [DOI] [PubMed] [Google Scholar]
- 50.Hughes G.M., Teeling E.C., Higgins D.G. Loss of olfactory receptor function in hominin evolution. PLoS One. 2014;9:e84714. doi: 10.1371/journal.pone.0084714. [DOI] [PMC free article] [PubMed] [Google Scholar]
- 51.Prüfer K., de Filippo C., Grote S., Mafessoni F., Korlević P., Hajdinjak M., Vernot B., Skov L., Hsieh P., Peyrégne S., et al. A high-coverage neandertal genome from vindija Cave in Croatia. Science. 2017;358:655–658. doi: 10.1126/science.aao1887. [DOI] [PMC free article] [PubMed] [Google Scholar]
- 52.Prieto-Godino L.L., Rytz R., Bargeton B., Abuin L., Arguello J.R., Peraro M.D., Benton R. Olfactory receptor pseudo-pseudogenes. Nature. 2016;539:93–97. doi: 10.1038/nature19824. [DOI] [PMC free article] [PubMed] [Google Scholar]
- 53.Barnes I.H.A., Ibarra-Soria X., Fitzgerald S., Gonzalez J.M., Davidson C., Hardy M.P., Manthravadi D., Van Gerven L., Jorissen M., Zeng Z., et al. Expert curation of the human and mouse olfactory receptor gene repertoires identifies conserved coding regions split across two exons. BMC Genom. 2020;21:196. doi: 10.1186/s12864-020-6583-3. [DOI] [PMC free article] [PubMed] [Google Scholar]
- 54.1000 Genomes Project Consortium. Auton A., Brooks L.D., Durbin R.M., Garrison E.P., Kang H.M., Korbel J.O., Marchini J.L., McCarthy S., McVean G.A., Abecasis G.R. The 1000 genomes project consortium. Nature. 2015;526:68–74. doi: 10.1038/nature15393. [DOI] [PMC free article] [PubMed] [Google Scholar]
- 55.Danecek P., Auton A., Abecasis G., Albers C.A., Banks E., DePristo M.A., Handsaker R.E., Lunter G., Marth G.T., Sherry S.T., et al. The variant call format and VCFtools. Bioinformatics. 2011;27:2156–2158. doi: 10.1093/bioinformatics/btr330. [DOI] [PMC free article] [PubMed] [Google Scholar]
- 56.Danecek P., Bonfield J.K., Liddle J., Marshall J., Ohan V., Pollard M.O., Whitwham A., Keane T., McCarthy S.A., Davies R.M., Li H. Twelve years of SAMtools and BCFtools. GigaScience. 2021;10:giab008. doi: 10.1093/gigascience/giab008. [DOI] [PMC free article] [PubMed] [Google Scholar]
- 57.Bushdid C., de March C.A., Matsunami H., Golebiowski J. In: In Olfactory Receptors: Methods and Protocols. Simoes de Souza F.M., Antunes G., editors. Springer New York; 2018. Numerical models and in vitro assays to study odorant receptors; pp. 77–93. [DOI] [PubMed] [Google Scholar]
- 58.del Marmol J., Yedlin M., Ruta V. The structural basis of odorant recognition in insect olfactory receptors. bioRxiv. 2021 doi: 10.1101/2021.01.24.427933. Preprint at. [DOI] [PMC free article] [PubMed] [Google Scholar]
- 59.de March C.A., Kim S.K., Antonczak S., Goddard W.A., 3rd, Golebiowski J. G protein-coupled odorant receptors: from sequence to structure. Protein Sci. 2015;24:1543–1548. doi: 10.1002/pro.2717. [DOI] [PMC free article] [PubMed] [Google Scholar]
- 60.R Development Core Team . Foundation for Statistical Computing; Vienna, Austria: 2018. R: A Language and Environment for Statistical Computing.https://www.R-project.org/ [Google Scholar]
- 61.RStudio Team. RStudio: Integrated Development for R. RStudio, Inc.; 2020. http://www.rstudio.com/
- 62.Wickham H., Bryan J. Readxl: Read Excel Files. R Package Version 1.3.1. 2019. https://CRAN.R-project.org/package=readxl
- 63.Wickham H., Averick M., Bryan J., Chang W., McGowan L., François R., Grolemund G., hayes A., Henry L., Hester J., et al. Welcome to the tidyverse. Journal of Open Source Software. 2019;4:1686. doi: 10.21105/joss.01686. [DOI] [Google Scholar]
- 64.Huber W., Carey V.J., Gentleman R., Anders S., Carlson M., Carvalho B.S., Bravo H.C., Davis S., Gatto L., Girke T., et al. Orchestrating high-throughput genomic analysis with Bioconductor. Nat. Methods. 2015;12:115–121. doi: 10.1038/nmeth.3252. [DOI] [PMC free article] [PubMed] [Google Scholar]
- 65.Aguie B. gridExtra: Miscellaneous Functions for "Grid" Graphics. R package version 2.3. 2017. https://CRAN.R-project.org/package=gridExtra
- 66.Gadagkar S.R., Rosenberg M.S., Kumar S. Inferring species phylogenies from multiple genes: concatenated sequence tree versus consensus gene tree. J. Exp. Zool. B Mol. Dev. Evol. 2005;304:64–74. doi: 10.1002/jez.b.21026. [DOI] [PubMed] [Google Scholar]
- 67.Paradis E., Claude J., Strimmer K. APE: analyses of phylogenetics and evolution in R language. Bioinformatics. 2004;20:289–290. doi: 10.1093/bioinformatics/btg412. [DOI] [PubMed] [Google Scholar]
- 68.Charif D., Lobry J.R. In: In Structural approaches to sequence evolution: Molecules, networks, populations. Bastolla U., Porto M., R.H.E, Vendruscolo M., editors. Springer Verlag; 2007. SeqinR 1.0-2: a contributed package to the R project for statistical computing devoted to biological sequences retrieval and analysis; pp. 207–232. [Google Scholar]
- 69.P Wilkinson S., K Davy S. Phylogram: an r package for phylogenetic analysis with nested lists. J. Open Source Softw. 2018;3:790. doi: 10.21105/joss.00790. [DOI] [Google Scholar]
- 70.Zheng X., Levine D., Shen J., Gogarten S.M., Laurie C., Weir B.S. A high-performance computing toolset for relatedness and principal component analysis of SNP data. Bioinformatics. 2012;28:3326–3328. doi: 10.1093/bioinformatics/bts606. [DOI] [PMC free article] [PubMed] [Google Scholar]
- 71.Galili T. Dendextend: an r package for visualizing, adjusting, and comparing trees of hierarchical clustering. Bioinformatics. 2015;31:3718–3720. doi: 10.1093/bioinformatics/btv428. [DOI] [PMC free article] [PubMed] [Google Scholar]
- 72.Delignette-Muller M.L., Dutang C. Fitdistrplus: an R package for fitting distributions. J. Stat. Soft. 2015;64:1–34. [Google Scholar]
- 73.Fox J., Weisberg S. Sage; 2011. An {R} Companion to Applied Regression. [Google Scholar]
- 74.Kassambara A. 2018. Ggpubr: 'ggplot2' Based Publication Ready Plots.https://CRAN.R-project.org/package=ggpubr R package version 0.2. [Google Scholar]
- 75.Wilke C.O. 2020. Cowplot: Streamlined Plot Theme and Plot Annotations for 'ggplot2'.https://CRAN.R-project.org/package=cowplot R package version 1.1.0. [Google Scholar]
Associated Data
This section collects any data citations, data availability statements, or supplementary materials included in this article.
Supplementary Materials
Data Availability Statement
Data
-
•
All raw in vitro data are made available in https://github.com/kchoover14/OldNoses. DOI is listed in the key resources table.
-
•
All raw in vitro data analysis is reported in the paper.
-
•
This paper analyzes existing, publicly available genomic data. These accession numbers for the datasets are listed in the key resources table.
-
•
Data generated from analysis of the shared genomic data are made available in https://github.com/kchoover14/OldNoses. DOI is listed in the key resources table.
Code
-
•
All original code has been deposited at https://github.com/kchoover14/OldNoses and is publicly available as of the date of publication. DOI is listed in the key resources table.