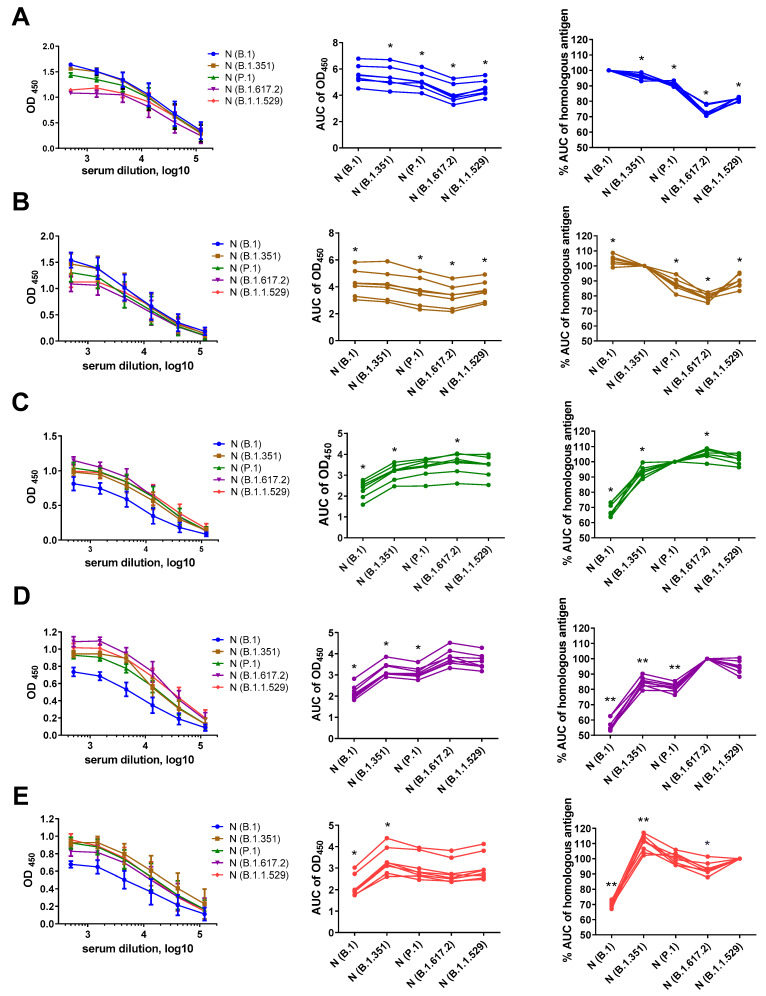
Figure 2.
N-based ELISAs of serum samples of mice immunized with B.1 (A, blue), B.1.351 (B, brown), P.1 (C, green), B.1.617.2 (D, magenta) and B.1.1.529 (E, red). The left panel shows the mean OD450 values in ELISAs with the indicated N antigen. The area under the OD450 curve (AUC) values for each serum sample tested against five N antigens are shown in the middle panel. The right panel shows the AUC values normalized to the homologous antigen. These data were compared using the Wilcoxon matched-pairs test. * p < 0.05, ** p < 0.01.

