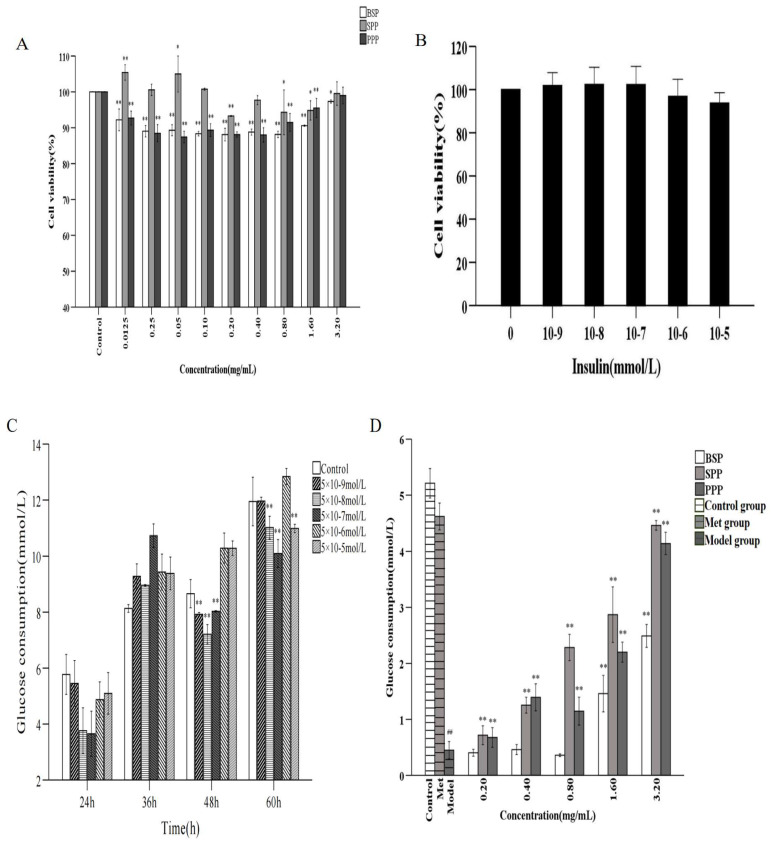
Figure 2.
Analysis of hypoglycemic activity in vivo. (A) Effects of SPP, BSP, and PPP on HepG2 cytotoxicity. Note: ** (p < 0.01) and * (p < 0.05) indicate the difference between the experimental group and the blank group. (B) Effects of different insulin concentrations on HepG2 cells. (C) Effects of different insulin concentrations on IR HepG2 cell model. Note: ** (p < 0.01) indicate the difference between the experimental group and the blank group. (D) Effects of polysaccharides on glucose consumption of IR HepG2 cells. Control: control group; Model: insulin resistance model group; Met: positive control group. Note: ** (p < 0.01) show that there was a significant difference between the polysaccharide group and the model group; ## (p < 0.01) represent significant differences between the model group and the blank group.

