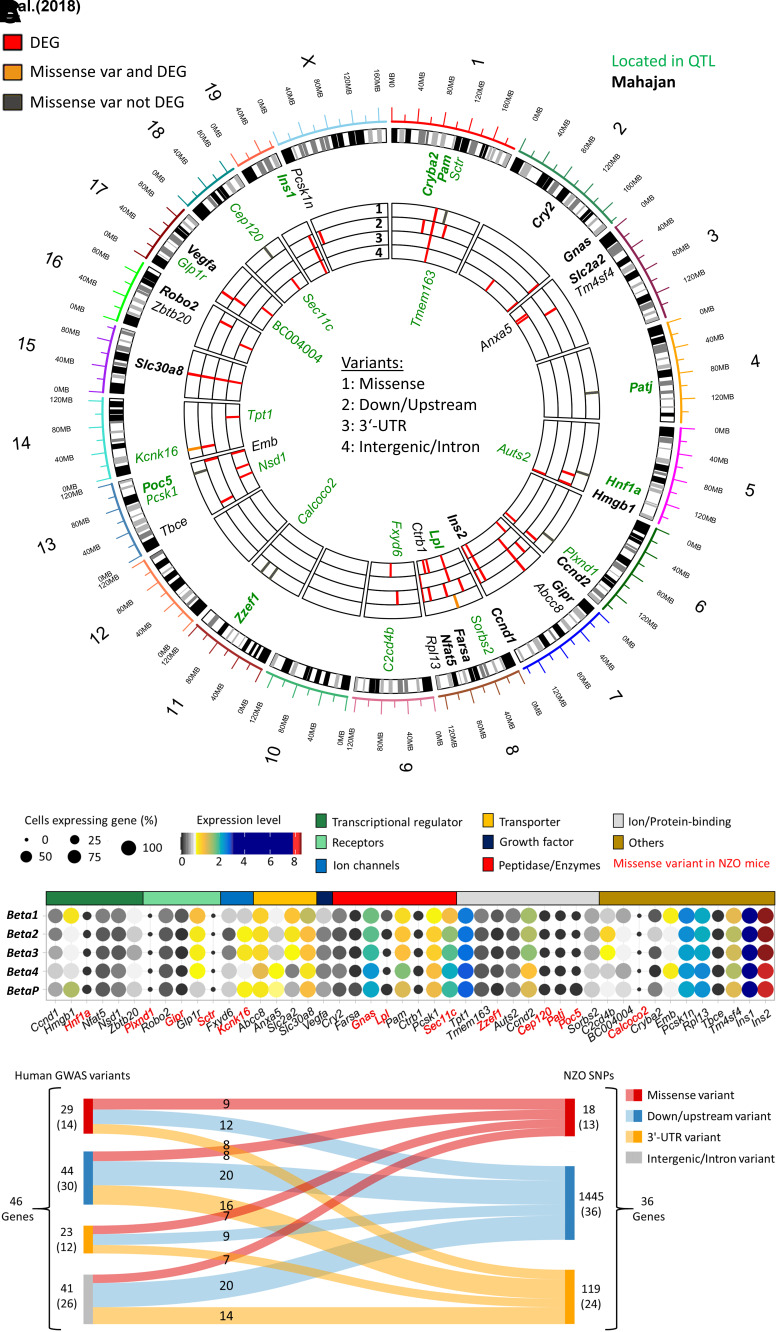
Figure 7.
Comparison of human T2D GWAS genes with NZO SNPs and mouse transcriptome. A: Circos plot of mouse scRNA-seq β-cell cluster DEGs compared with human genes and loci associated with diabetes susceptibility. B: Expression and functional annotation of T2D GWAS genes in the different β-cell clusters. Dot color and size represent expression level and cells expressing the gene. Genes marked in red harbor a missense variant in NZO mice. C: Mapping of human GWAS variants into NZO variants by variant consequence, focusing only on regulatory (down/upstream, 3′-UTR) and missense variants. var, variant.

